Abstract
The paper analyses the mechanical properties of shales from the Baltic Basin, focusing on creep strain in conditions of variable stress and elevated temperature (85 °C). Rock samples were collected from drill cores from various depths between 3600–4000 m. A series of creep tests was performed using a triaxial apparatus in simulated pressure and temperature conditions in the reservoir. The creep tests were conducted at variable levels of differential stress in variable time intervals. The laboratory experiments were performed in order to study brittle and viscoelastic creep proceeding in time in shales rich in organic matter and clay minerals. Creep compliance of shale formations rich in organic matter influences the success of hydraulic fracturing procedures, as well as migration of natural gas during exploitation. Laboratory characteristics of geomechanical properties (compressive strength, strain and elastic moduli) is crucial for planning natural gas exploitation from unconventional resources. The results indicate that the level of constant differential stress and creep time significantly influence the mechanical properties of shales. The paper presents the differences between brittle and viscoelastic strain registered during creep tests at variable stress conditions and time intervals. In viscoelastic creep tests, creep strain is over two times larger in the second stage of creep in comparison to the magnitude of strain registered in the first stage. In brittle creep tests, axial strain in the first creep stage is two times larger than in viscoelastic creep tests in the second stage. Based on the experiments, elastic parameters, i.e., Young’s modulus and Poisson’s ratio, have been determined for each of the analysed samples. In brittle creep tests, Young’s modulus is smaller than in viscoelastic creep tests. In viscoelastic creep tests Young’s modulus increases in successive stages. Whereas Poisson’s ratio is larger for samples from brittle creep tests than for samples from viscoelastic creep tests and does not change with subsequent creep stages in viscoelastic creep tests.
1. Introduction
Development of geomechanical investigations resulted in better knowledge and understanding of the elastic and strain properties of reservoir rocks. However, the most recent studies [1,2,3,4,5,6,7,8,9,10,11,12,13,14,15], indicate that assessment of time-dependent creep parameters and determination of brittle and viscoelastic strain may be of key significance for the successful exploitation of natural gas from unconventional deposits. Strain caused by slow time-dependent deformation, known as creep, may be a factor restricting or controlling changes of stress caused by hydraulic fracturing [6,7,8,16].
Strain taking place during creep processes is important both in the assessment of short-term and long-term reaction of the shale gas reservoir [3,16]. In a short interval, viscoelastic strain may cause change of the stress state, which has impact on the success of fracturing procedures [4,6], whereas in long intervals, viscoelastic strain may cause closing of the created fractures and fissures in the rock massif resulting from hydraulic fracturing, and thus decrease the permeability of the reservoir and hamper the migration of gas to the borehole [7,17,18,19]. Taking into account the significance of creep strain both in short- and long-term exploitation of shale gas, it is important to evaluate the creep response in shale rocks rich in organic matter and clay minerals. Understanding the reasons and rate of production reduction, resulting from decreased permeability, is a key factor during design and later gas exploitation from unconventional shale gas resources. Laboratory studies of the mechanical properties of rocks are usually fixed and allow for assessing their behavior in short-term conditions and at fast growing loading. In most processes acting in the rock massif, a crucial role is played by time, long-term loading, or long-term deformation stages (strain). Due to this fact, testing rock behavior at long-term loading or strain is of high practical value.
Laboratory tests of the creep process are usually, due to technical and economic reasons, restricted in time. Therefore, a common challenge for numerous researchers (e.g., [13]) is estimating the duration of tests indispensable for determining parameters used for forecasting strain occurring in rocks in a relatively long time span. Based on the conducted short-term creep tests, the parameters necessary for modeling (e.g., using the power function) of the behavior of unconventional hydrocarbon reservoirs in a relatively long period of time are able to obtain [6,7].
The paper presents the behavior of siltstones and claystones (shales) under short-term and long-term, permanent loading, and their strength and strain properties. The aim of the studies performed at high pressure and high temperature conditions was to characterize time-dependent, brittle and viscoelastic properties of siltstones and claystones from the Baltic Basin.
2. Theoretical Background
A schematic diagram of the creep process presenting various time-dependent stages showing the reaction of material subject to creep tests is shown in Figure 1. At a constant temperature (T = const), the creep process comprises of the following characteristic, corresponding to various stages of deformation: initial (instantaneous) elastic strain (part OA), primary (transient) creep (part AB), secondary (steady-state) creep (part BC) and tertiary (accelerating) creep (part CD), resulting by material failure [1,2,20]. At the beginning, depending on the magnitude of the applied stress, instantaneous deformation takes place; it may be elastic as well as partly irreversible, which may be caused by dilatancy (formation of microfractures and microfissures) [21]. In the primary stage, creep velocity decreases with time. Usually, creep is reversible at this stage (elastic delay), although some contribution of irreversible deformation is also possible. In the secondary stage, creep proceeds with a constant velocity. Microfailure of the rock samples takes place at this stage, and therefore durable (irreversible) deformation may also be observed after loading. In the last stage, creep is characterised by rapid increase of the strain velocity, which is related with the intensification of the destruction process, formation of macrofractures and in the end of failure of the material [1,2,20]. The presented creep process is characteristic for rocks. It is assumed that creep in rocks is larger in the case of samples with a higher content of clay minerals and organic matter [7,9], where it is caused by compaction of clay mineral sheets and of organic matter, as well as reduction of the pore space [6,11,15].
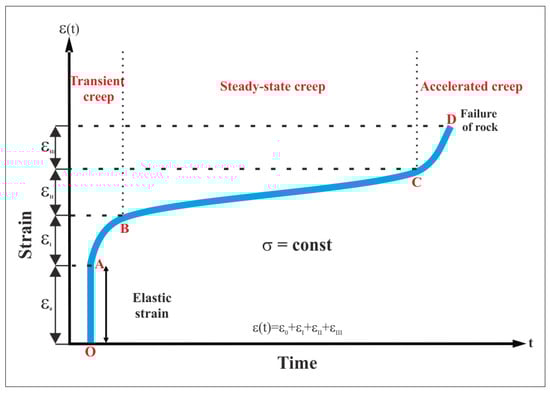
Figure 1.
Schematic diagram of the creep process [20], modified.
Depending on the magnitude of the stress applied to the sample, the test duration and the properties of the material, primary, secondary and tertiary stages of creep might occur. In the presented test results, in brittle creep, at high stress values at a minimum of 75% (σ1–σ3)max, all creep stages occurred, whereas in viscoelastic creep, at stress values below 50% (σ1–σ3)max, maximally secondary stages of creep occurred. Whereas, in the research by Rybacki et al. [11], the transition from primary to secondary creep occurred in a narrow stress range, corresponding to about 84–90% of the compressive strength obtained in constant strain rate tests of 5 × 10⁻⁴ s−1 under similar pressure and temperature conditions [22].
3. Material
Cores for laboratory tests were collected from various depths between 3600–4000 m from three boreholes located in the Baltic Basin (northern Poland) (Figure 2). Core samples were drilled perpendicular to the rock bedding and stored at room temperature and air humidity. It is the best and the safest way to store shale cores at a constant temperature of ~4 °C and a consistent relative humidity of >75% to minimise any micro fracturing and internal moisture movement in the core [23]. For laboratory investigations, cylindrical samples were cut out from the core samples. Laboratory tests were performed on 26 samples. The creep tests were conducted on samples representing the lower Silurian (Pelplin Claystone Formation, Pasłęk Claystone Formation, Jantar Bituminous Claystone Member) and Upper Ordovician (Sasino Claystone Formation) lithostratigraphic units. These units correspond to the interval between the Caradoc and Wenlock [24].
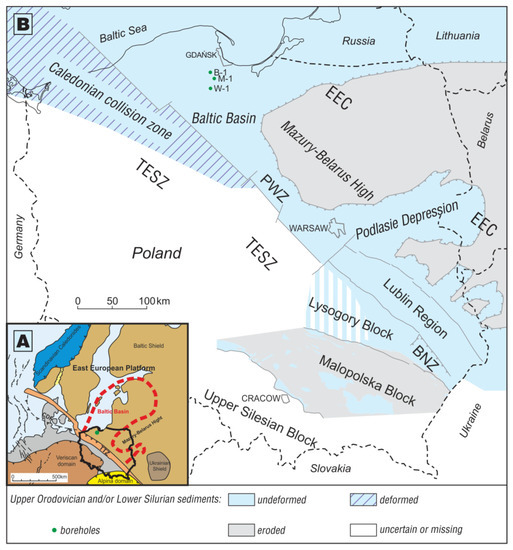
Figure 2.
Location of the analysed shale gas boreholes (green dots) with regard to (A) lower Paleozoic Baltic Basin (CDF—Caledonian Deformation Front, TTZ—Teisseyre-Tornquist Zone [26,33]) and (B) lower Paleozoic sedimentary basins and area covered by Upper Ordovician and lower Silurian shales (PWZ—Płock-Warsaw Zone, BNZ—Biłgoraj-Narol Zone, EEC—East European Craton, TESZ—Trans-European Suture Zone [25,33]).
3.1. Geology of the Study Area
The most prospective with regard to natural gas in Poland are the lower Palaeozoic graptolitic shales located on the western slope of the East European Craton (EEC) in the Baltic Basin [25] (Figure 2). From the Late Ordovician to the late Silurian, development of basin subsidence on the western slope of the EEC was linked with its flexural bending, caused by the Caledonian, oblique collision of Avalonia and Baltica, which lead to the formation of a foreland basin [26,27]. In the first stage of its development, bending of the plate at slow clastic supply caused the formation of accommodation space and development of anoxic conditions at the sea bottom, which favoured the deposition of shales rich in organic matter. In the Caradoc, claystone deposition prevailed in the sedimentary basins in the western and north-western part of the western slope of the EEC. The Llandeilo and Caradoc are characterised by black clay shales with graptolites or inarticulate brachiopods. The Silurian began with a marine transgression in the Llandovery, causing vast deposition of siltstones and claystones rich in organic matter. This time interval is characterised by black and grey clay shales with graptolites [28,29,30]. A characteristic feature of the lower Palaeozoic sedimentary basins on the western slope of the EEC is their rather simple tectonic structure. The main feature of the Baltic Basin is its regional flexural bending to the west and south-west. A small number of faults, usually characterised by small throws, is also typical for the area [27,31]. There is an interesting tectonic structure near the research area (in the North direction). The Opalino Anticline is a symmetric box-fold with subsidiary: two northern and southern anticlines and a syncline in the hinge zone, giving in an m-shape [32]. This anticline was formed as a result of collision between Avalonia with Baltica during the Caledonian Orogeny. Whereas the syn-tectonic strata that formed during fold growth, as observed in the limb of the Opalino Anticline, suggests that the main stage of folding within the western part of the Caledonian Foredeep Basin occurred during the Pridoli [32].
3.2. Specimen Characteristics
The mineral composition of the analysed rocks was determined using X-ray diffraction (XRD). The results of XRD analyses and the petro-physical properties of lower Palaeozoic gas shales from the Baltic Basin have been presented by Leśniak et al. [34]. The organic matter (TOC) content was determined using pyrolitic Rock-Eval analysis [35]. The results are presented in Figure 3 and Table 1.
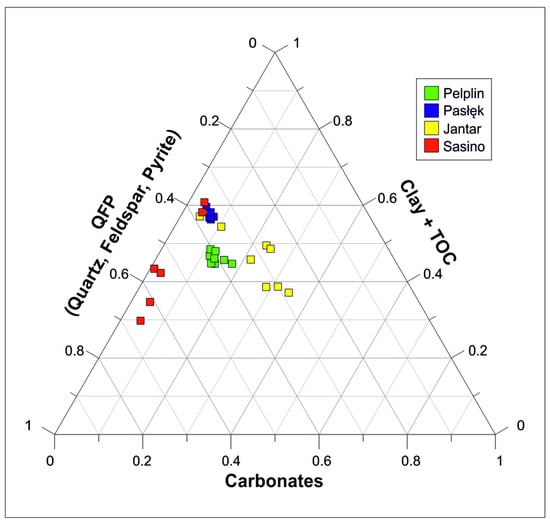
Figure 3.
Mineral composition of the analysed siltstone-claystone formations.

Table 1.
Mineral composition and organic matter (TOC) content in the studied siltstone-claystone formations.
Samples from the Pelplin Formation are characterised by a very uniform mineral composition (Figure 3). Shales of this unit contain have an average content of 46% clay minerals, 40% quartz, feldspars and pyrite (QFP) and almost 14% carbonates. The organic matter content reaches 1.5% weight. Shales from the Pasłęk Formation are also characterised by a uniform mineral composition. They are rich in clay minerals (57.6%), whereas the QFP and carbonate content reaches about 36% and 6.5%, respectively. In the shales, the organic matter content is low (TOC < 1% weight), therefore the formation has low prospectiveness. The mineral composition of samples from the Pelplin and Pasłęk formations is similar to the mineral composition of samples from the Pelplin and Pasłęk formations that were subject to mechanical anisotropy analysis [33]. The most prospective shale formations in the Baltic Basin are the shales of the Jantar Member and Sasino Formation [25]. In both units the TOC is about 4% weight (Table 1), but they have a variable mineral composition (Figure 3). Due to this, the mechanical and strain properties of the analysed rocks are quite different [33]. Shales from the Jantar Member contain 46% of clay minerals, 31% QFP and 22% carbonates. Shales from the Sasino Formation are richer in silicates, and averagely contain 45% clay minerals, 52% QFP and only 3.5% carbonates.
4. Experimental Methods
This paper presents the analyses of creep tests performed in a triaxial stress field. The tests were conducted on shales rich in organic matter [0.9–4.3 wt%] in order to analyses the brittle and viscoelastic deformation process taking place in these rocks.
Creep tests were made on samples oriented parallel to laminations. Two modes of creep tests in a triaxial stress field were made. Brittle creep was tested in the first mode (BCT) and viscoelastic creep—in the second mode (VCT). Each test comprised four stages: thermal, hydrostatic, triaxial and failure. The first stage (thermal) and fourth stage (failure) were performed according to the same procedure. A different methodology was applied in the BCT and VCT for the second stage (hydrostatic) and third stage (triaxial). In BCT, in the second stage (hydrostatic), the samples were subject to hydrostatic pressure (σ1 = σ2 = σ3) in one step, and then in the third stage (triaxial), they were step by step loaded axially (σ1 > σ2 = σ3). In VCT, in the second stage (hydrostatic), the samples were loaded with 3 steps of confining pressure, and next in the third stage (triaxial) they were step by step loaded axially.
Analysis of creep strain taking place during the third stage (triaxial) was made by experiments performed at different levels of differential stress. In order to register brittle strain, the samples were performed according to the BCT at constant levels of maximum differential stress reaching 75% and 85% (σ1–σ3)max, respectively. In turn, registering of viscoelastic strain was accomplished by performing the VCT at constant levels of maximum differential stress reaching 25% and 50% (σ1–σ3)max, respectively.
Values of the levels of constant differential stress, at which the analyses were performed, i.e., 75% and 85% or 25% and 50% (σ1–σ3)max were determined based on the result of single failure tests of equivalent samples from the same rock units and the same boreholes as presented by Wilczynski et al. [33].
4.1. Sample Preparation
Cylindrical samples were cut out for the creep tests in a bedding-parallel direction (horizontal samples) (Figure 4A), 1.5 inch in diameter (37.8 mm) and about 3 inches in height. After removing the samples from the drill cores, their upper and lower surfaces were polished to maintain parallelism according to the norm ASTM D 4543-01 [36]. After the retrieval of any shale sample, it is important to ensure that structural integrity is maintained (Figure 4B), and unwanted drying, evaporation, and oxidation is avoided [23]. Prior to the analyses the samples were stored at room temperature. In a subsequent step the samples were sealed with a heat-shrink jacket (Figure 4C) against loss of humidity. They were not dried or subject to additional saturation before the analyses, in order to have no impact of the sample structure, and thus influence the change of mechanical properties. Re-saturation process could damage the rock. On the other hand, due to the low permeability of shales, a single drained test could take several weeks, even months [37,38].
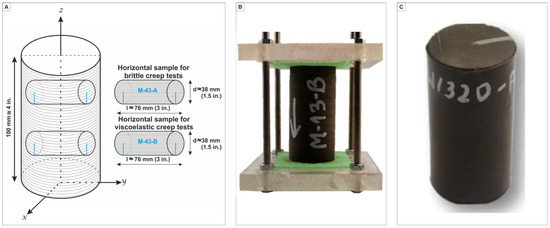
Figure 4.
(A) Scheme of preparing samples for laboratory tests, (B) protected sample for laboratory tests, (C) and a single sample sealed with a heat-shrink jacket.
4.2. Experimental Equipment
Series of creep tests were carried out using a comprehensive, multi-purpose testing system equipped with a termo-pressure cell for testing in the triaxial state (MTS-815). The technical capabilities of the cell allow for simulating the conditions within the rock mass at the depth reaching 5000 m below the ground level using pressure (up to 140 MPa) and temperature (up to 200 °C).
The temperature in the triaxial cell was monitored by thermocouples installed in the cell, and its increase was obtained using three electric heaters with a power of 2000 W each. Each sample was sealed with a heat-shrink jacket to protect it against the surrounding fluids. The surrounding fluid from the fluid medium (mineral oil) can otherwise infiltrate into the pore space and microfissures, contaminating the sample and altering its stress regime during the experiment.
The axial extensometer measured the axial deformation and chain extensometer measured the lateral deformation. The volumetric strain was calculated by the summation of both the axial and the lateral strains (e.g., [39,40,41]) from the following Formula (1):
where:
εv = εz + 2εx,y
- εv—volumetric strain,
- εz—axial strain,
- εx,y—lateral strain.
Confining pressure and differential stress were monitored using a pressure sensor and a force sensor installed in the cell. In order to reflect the temperature and effective stress at in situ conditions, all tests were performed at a constant temperature of T = 85 °C and constant confining pressure of pc = 50 MPa. Confining pressure was set on the rock sample at a constant velocity of 10 MPa/min.
4.3. Brittle Creep Test—BCT
Brittle creep tests were designed using and significantly modifying the hourly creep index after Borecki et al. [42]. The test was conducted in four stages. At first, in the first stage (thermal), temperature in the triaxial cell was increased to the target level. Warming up of the cell to 85 °C took about 30 min. After reaching the target temperature, it was maintained at a constant level till the end of the test. In the second stage (hydrostatic), confining pressure was increased to 50 MPa and maintained at a constant level till the end of the test (through all remaining stages). Confining pressure was increased with a constant velocity of 10 MPa/min. The third stage (triaxial) took place at stabilised termo-pressure conditions. This stage comprised two 3-h constant differential stress levels, during which creep strain (εcr) was registered. The first creep strain (first loading) was registered at stress values reaching 75% (σ1–σ3)max, and the second at stress values reaching 85% (σ1–σ3)max (Figure 5). In BCT, the rock samples were loaded with a constant axial strain rate (10−5 s−1). After finishing the second 3-h constant differential stress level began the stage of rock sample destruction, comprising increase of axial stress with the same axial strain rate till complete destruction of the sample took place.
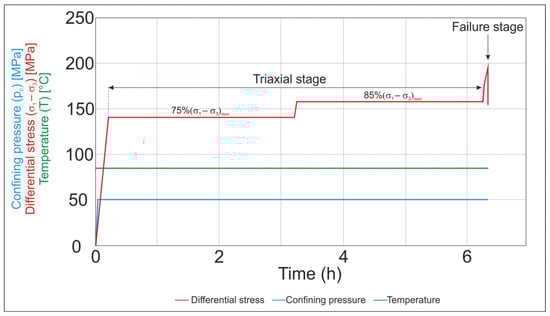
Figure 5.
Schematic diagram of the brittle creep test (BCT).
Based on the performed creep tests in a triaxial cell (BCT), experimental deformation curves showing differential stress (σ1–σ3) to axial strain (εz), lateral strain (εx,y) and volumetric strain (εv) were obtained. Young’s modulus (E) and Poisson’s ratio (ν) were determined only at an initial stage of axial compression, prior to the first 3-h constant level of differential stress. These parameters were determined based on the American norm (ASTM) [43], European recommendations (Eurokod 7) [44] and ISRM guidelines [45]. Young’s modulus was determined on a straight section of the differential stress (σ1–σ3)–axial strain (εz) curve. Poisson’s ratio (ν) was defined as the relationship (quotient) between the value of axial strain (εz) and lateral strain (εx,y) for the straight section of all three characteristics showing the relationship between stress and axial, lateral and volumetric strain.
4.4. Viscoelastic Creep Test—VCT
In viscoelastic creep tests the hydrostatic stage was extended and subdivided into three steps, and the levels of constant differential stress were reduced in the triaxial cell (Figure 6). The first stage (thermal) and fourth stage (failure) were performed as in the brittle creep tests (BCT). The second stage (hydrostatic) and third stage (triaxial) in VCT were made by modifying the procedure presented by Sone and Zoback [4,5,6,7]. In the hydrostatic stage, the confining pressure was applied in three steps (up to 10 MPa, 30 MPa, 50 MPa) with a constant velocity of confining pressure increment at 10 MPa/min, till the target pressure of 50 MPa was achieved. After each stage of confining pressure increase, it was maintained at a constant level for 3 h for preliminary sample compaction and achievement of sample equilibrium.
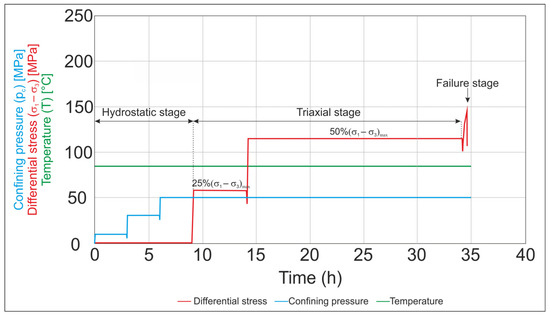
Figure 6.
Schematic diagram of the viscoelastic creep test (VCT).
During the 3-h constant levels of confining pressure, axial and lateral strain were registered, but we do not refer to them as hydrostatic creep strain. It is debatable if isotropic loading of a sample during hydrostatic stage does result in creep (e.g., [3,20]). It should be noted, however, that the results of other laboratory tests (e.g., [12,16]) suggest that creep may also take place during the hydrostatic stage.
The third (triaxial) stage began at stabilised temperature-pressure conditions, i.e., after 9 h at 85 °C and confining pressure at 50 MPa. This stage comprised two constant differential pressure levels, in which creep strain was registered. The first loading 25% (σ1–σ3)max was maintained for 5 h (for one sample exceptionally 3 h), and the second loading 50% (σ1–σ3)max was maintained from 5 to 20 h.
In order to determine the values of Young’s modulus and Poisson’s ratio, loading and unloading cycles were subsequently performed after each creep stage. In the last stage (failure), the samples were compressed axially with a constant axial strain rate (10−5 s−1). The analysis was conducted till the sample was destroyed.
5. Experimental Results and Discussion
5.1. Analysis of Brittle Creep Test
During the brittle creep tests strain was registered during two 3-h constant differential pressure levels, however in four cases destruction took place in the triaxial stage. One sample (M-60-A) was destroyed already after 90 s from the moment of reaching the first constant differential stress level. Two samples (W-277-A and W-305-B) were destroyed at stress increase from 75% (σ1–σ3)max to 85% (σ1–σ3)max, whereas another sample (M-30-A) was destroyed after 108 s from the moment of reaching the second constant differential stress level. Destruction of these four samples in the first mode was caused by the fact that the applied stress level in the samples was close to the maximum sample strength.
5.1.1. Example of Strain Data
The brittle creep process is presented on differential stress-strain curves (Figure 7) and relationships between strain and time (Figure 8) based on the sample (M-43-A). Based on these relationships, Young’s modulus and Poisson’s ratio were determined for all samples, the magnitude of creep strain were determined for two constant differential strain levels (triaxial stage), and the values of the maximum differential stress–for the failure stage (Table 2). The table contains also information about the lack of the second creep stage due to exceeding of maximum sample strength, which lead to its destruction, the duration time and the value of the constant stress level.
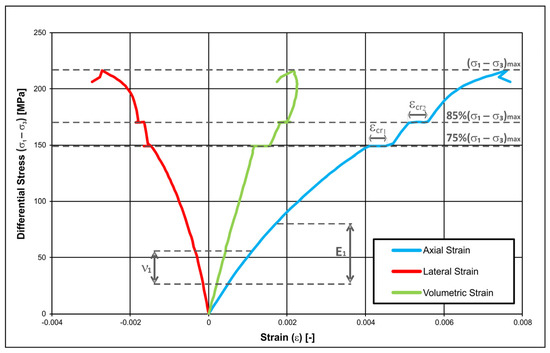
Figure 7.
Characteristics of differential stress–axial, lateral and volumetric strain obtained from the brittle creep test for sample M-43-A.
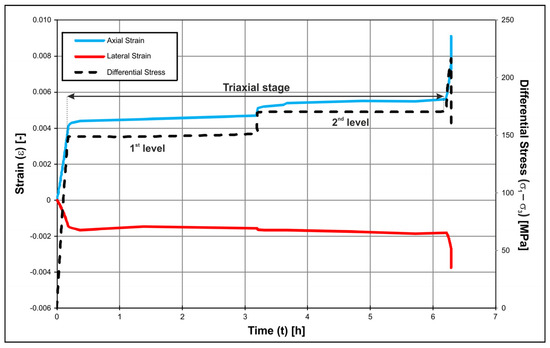
Figure 8.
Relationship between axial strain, lateral strain, and differential stress and time in the brittle creep test for sample M-43-A.
Table 2.
Conditions of the performed analyses and results obtained during brittle creep tests for all analysed samples from the siltstone-claystone formations.
Analysis of the values of creep strain registered during the first (εcr1) and second (εcr2) creep stages shows that it is difficult to indicate at which stage larger creep strain was registered. For three samples larger creep strain was noted in the second stage, for two samples larger creep strain was obtained in the first stage, and for two samples the same creep strain values were determined in the first and second stage (Table 2). According to published reports, at high stress levels the strain in the first creep stage should be larger than in the second stage. This is confirmed by studies at high stress levels (60%, 70%, 75% and 85%) of Mishra and Verma [46], which show that samples are most deformed during the first stage, and in subsequent stages much less, despite increasing loading.
5.1.2. Observation of Creep Behavior in Brittle Creep Tests
Figure 9 shows the creep process at the first and second constant differential stress level for sample W-264-B. The strain was measured from the moment at which stress stabilised at a constant level. In this case, creep strain reaches the same value on both levels, whereas the shape of the creep curve changes. Primary creep (transient) and secondary creep (steady-state) were registered in the first stage according to the schematic diagram of creep (Figure 1). In turn, in the second stage, beside primary and secondary creep, tertiary creep was also observed. In this case a longer test would lead to sample destruction by brittle strain.
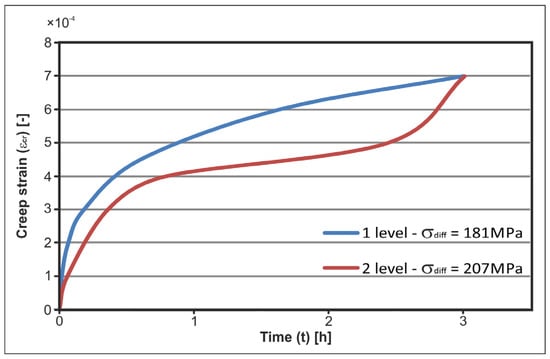
Figure 9.
Comparison of axial creep strain for the first and second constant differential stress level in the brittle creep test for sample W-264-B.
5.1.3. Young’s Modulus and Poisson’s Ratio
Deformation curves (Figure 7) obtained for all samples presenting the relationship between differential stress (σ1–σ3), and axial (εz), lateral (εx,y) and volumetric (εv) strain were used to determine Young’s modulus (E) and Poisson’s ratio (ν). It should be emphasised that in brittle creep tests (BCT) only one Young’s modulus and one Poisson’s ratio were determined during the elastic stage of sample loading to 75% (σ1–σ3)max (Figure 7). Young’s modulus (E) and Poisson’s ratio (ν) were determined in the beginning of axial compression prior to the first creep stage.
In BCT, the determined average value of Young’s modulus for samples from particular lithostratigraphic units was: 44.2 GPa for the Pelplin Formation, 48.2 GPa for the Pasłęk Formation, 45.2 GPa for the Jantar Member, and 40.5 GPa for the Sasino Formation. In turn, the average value of Poisson’s ratio for samples from particular lithostratigraphic units was: 0.26 for the Pelplin Formation, 0.29 for the Pasłęk Formation, 0.33 for the Jantar Member, and 0.29 for the Sasino Formation.
Young’s modulus from studies of mechanical anisotropy with application of classical, single triaxial tests for samples cut out in a direction parallel (horizontal) to the bedding [33] generally attains values for all formations similar to the values obtained from BCT, because this parameter was methodically and physically determined for the same stress-strain sections. In turn, the average values of Poisson’s ratio were slightly lower in mechanical anisotropy studies [33] than the average values obtained in BCT.
5.2. Analysis of Viscoelastic Creep Test
During viscoelastic creep tests, none of the samples was destroyed during the triaxial stage, because the samples in VCT were loaded with values below 50% (σ1–σ3)max. Loading of samples with such low values of differential stress cannot result in their destruction, because only constant viscoelastic strain will develop in this range of differential stress.
5.2.1. Strain Data Example
The viscoelastic creep process is presented on differential stress-strain curves (Figure 10) and relationships between strain and time (Figure 11) based on the sample (M-43-B). Based on these relationships, the values of creep strain, Young’s modulus and Poisson’s ratio were determined for all samples at two constant differential stress levels (triaxial stage), and the values of the maximum differential stress were determined for the destruction stage (Table 3).
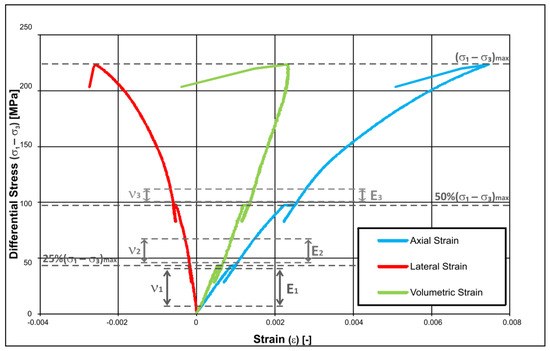
Figure 10.
Characteristics of differential stress–axial, lateral and volumetric strain obtained in viscoelastic creep tests for sample M-43-B.
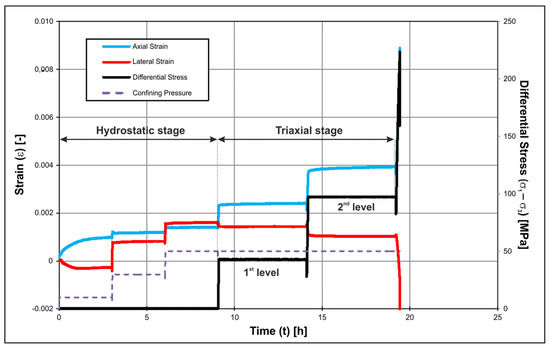
Figure 11.
Relationship of axial strain, lateral strain, differential stress and confining pressure and time in viscoelastic creep tests for sample M-43-B.
Table 3.
Conditions of the performed studies and obtained results during viscoelastic creep tests for all analysed samples from the analysed claystone units.
In VCT, axial and lateral strain were observed during the hydrostatic and triaxial stages. Figure 11 shows axial and lateral strain for sample M-43-B. Increase of axial strain in the first step of the hydrostatic stage is visible, when confining pressure was elevated to 10 MPa and the value was maintained for 3 h. In the second and third step of the hydrostatic stage, such large increments of axial strain were not observed. In turn, lateral strain rises in the hydrostatic stage but falls in the triaxial stage when the sample is loaded with the differential stress.
In the triaxial stage, further constant rise of axial strain is observed. In VCT, axial strain at the second level of constant differential stress are larger than in the first stage (Table 3). In these tests, creep strain increased averagely by 2.5 times on the second loading (εcr2) compared to the first loading (εcr1) in all analysed samples.
5.2.2. Observation of Creep Behavior in Viscoelastic Creep Tests
Axial and lateral strain during the triaxial stage for both levels of constant differential stress for sample W-264-A are presented in Figure 12. In VCT, axial strain is twice as large on the second loading than on the first loading, but the shape of the curves is similar; primary and secondary creep may be distinguished following the schematic diagram of the creep process (Figure 1).
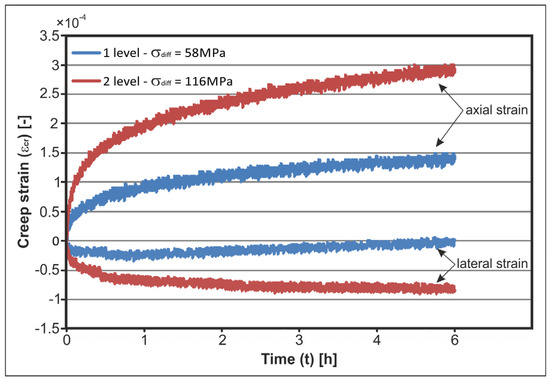
Figure 12.
Axial and lateral strain for sample W-264-B.
Interesting, however, is the behavior of lateral strain during creep tests at both levels of constant differential stress. Theoretically, after increasing differential stress and maintaining it at a constant level for a long period of time, the sample should shrink axially and expand laterally [6]. In thecurrent experiments, for most samples lateral strain registered during the first level of constant differential stress after initial increase, decreased with time, whereas during the second level of constant differential stress, lateral strain increased during the entire experiment (Figure 12).
Shales of the Baltic Basin also show that that during axial differential stress loading after initial extension, strain reversal may occur, which suggests a complex deformational behavior leading to volumetric compaction [14]. In turn, the Barnett and Haynesville shales lateral strain stabilised after 10 min and did not change till the end of the experiment [6].
5.2.3. Young’s Modulus and Poisson’s Ratio
Strain curves were also obtained for all analysed samples in VCT (Figure 9). Three Young’s moduli and three Poisson’s ratios were obtained (Table 3), which were determined in all stages of increasing sample loading, beginning from the first stage (E1, ν1), and terminating in the destruction stage (E3, ν3).
In VCT (Table 3), the average value of the first Young’s modulus (E1) for samples from particular lithostratigraphic units was: 51.5 GPa for the Pelplin Formation, 55 GPa for the Pasłęk Formation, 46 MPa for the Jantar Member and 47.2 MPa for the Sasino Formation. Analysis of the results from Table 3 shows that for most samples the values of the static modulus increase with subsequent creep stage. In turn, the average value of the first-loading Poisson’s ratio (ν1) for samples from particular lithostratigraphic units was: 0.24 for the Pelplin Formation, 0.28 for the Pasłęk Formation, 0.23 for the Jantar Member and 0.20 for the Sasino Formation. In these tests at subsequent loading stages, for which the Poisson’s ratio was determined, such clear correlation is not visible as in the case of Young’s modulus. In subsequent stages, the value of the average Poisson’s ratio for samples from the Pelplin and Sasino formations is practically invariable. In turn, for the samples from the Pasłęk Formation, the average value of Poisson’s ratio at first decreases, and then increases at subsequent creep stages. In samples from the Jantar Member, the average value of Poisson’s ratio increases with subsequent creep stages.
5.3. Comparison of Brittle Creep and Viscoelastic Creep
For comparison of the results obtained from brittle and viscoelastic creep tests, the following sections will present creep compliance, comparison of strength-strain parameters (Young’s modulus E, Poisson’s ratio ν, maximum compressive strength (σ1–σ3)max) obtained from both experimental modes, as well as an extended viscoelastic creep test, in which a third level of stress at 75% (σ1–σ3)max was added.
5.3.1. Creep Compliance
Some authors (e.g., [13,14]) normalize the measured values of the obtained strain by the magnitude of stress step, due to which strain is expressed as creep compliance (e.g., [9,47]). Creep compliance depends on the content of clay minerals and organic matter in shale rocks and the orientation of bedding planes with respect to differential load (e.g., [6]).
Creep compliance for samples W-305-B (BCT) and B-279-D (VCT) is presented in Figure 13 and Figure 14. Brittle creep strain (Figure 13) was registered during sample loading with a value of about 75% (σ1–σ3)max, and viscoelastic creep strain (Figure 14) was registered during sample loading with a value of about 50% (σ1–σ3)max. The sample loaded with a higher value of differential stress obtained a higher value of creep compliance and three stages of creep (primary, secondary and tertiary) were observed in this sample. The obtained creep curve practically resembles the schematic diagram of creep (Figure 1). The sample loaded with a value corresponding to about 50% (σ1–σ3)max had a twice smaller value of creep strain than sample W-305-B, and a different character of the creep curve was obtained (only transient and steady-state creep stages, without accelerating creep), in spite of the fact that the sample was loaded for an almost 7 times longer time interval than sample W-305-B. Based on the data it can be assumed that sample destruction was largely caused by the magnitude of the applied loading rather than the time of loading, as well as that loading below 50% (σ1–σ3)max will not cause sample destruction, because constant viscoelastic strain will develop with time, but the strain at which brittle strain will start to develop, successfully leading to final sample destruction, will not be exceeded.
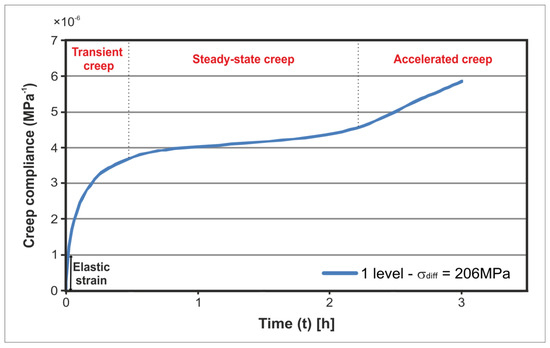
Figure 13.
Brittle creep compliance (sample W-305-B).
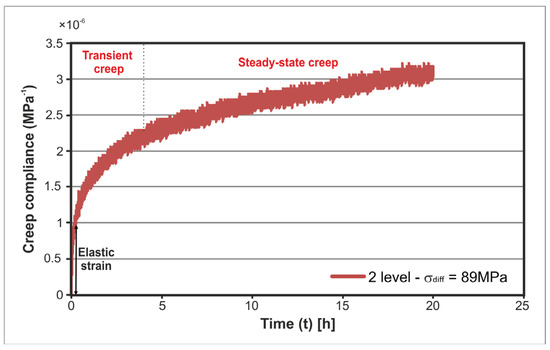
Figure 14.
Viscoelastic creep compliance (sample B-279-D).
5.3.2. Comparison of Young’s Modulus and Poisson’s Ratio from Brittle and Viscoelastic Creep Tests
In BCT, one Young’s modulus and one Poisson’s ratio were determined according to the methodology presented in chapter 4.3. In VCT, three Young’s moduli and three Poisson’s ratios were determined at all stages of increasing loading. In the next section, the analysis is based on the first-loading Young’s modulus (E1), and the first-loading Poisson’s ratio (ν1), from viscoelastic creep tests, determined at the initial stage of increasing differential stress to the level of 25% (σ1–σ3)max.
The distribution of Young’s modulus values in particular lithostratigraphic units, subdivided into the type of test: brittle creep/viscoelastic creep, is presented in Figure 15. Values of Young’s modulus obtained from VCT are significantly higher than the values of Young’s modulus from BCT. The average value of Young’s modulus in samples from the Pelplin Formation from VCT is by 16% larger than for samples from the same formation from BCT. In the Pasłęk Formation, the average Young’s modulus from VCT is larger by 23% than for samples from the same formation from BCT. The smallest differences were obtained for sample from the Jantar Member. In this unit, the average value of Young’s modulus from VCT is by 10% larger from the average value of Young’s modulus from BCT. In the Sasino Formation, the average Young’s modulus from VCT is by 18% larger than for samples from the same unit from BCT. Lower values of Young’s modulus were obtained in BCT than in VCT. It should be emphasized that Young’s modulus was determined in BCT at a higher level of differential strain than in the VCT).
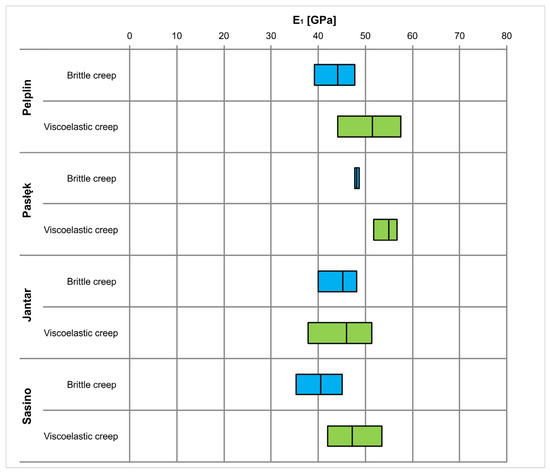
Figure 15.
Comparison of ranges of Young’s modulus from brittle creep and viscoelastic creep tests for particular lithostratigraphic units.
The distribution of the Poisson’s ratio in particular lithostratigraphic units, subdivided into the type of test: brittle creep/viscoelastic creep is presented in Figure 16. Analysis of the values of Poisson’s ratio from brittle and viscoelastic creep tests shows higher average values of Poisson’s ratio from BCT than from VCT, and for example in the Sasino Formation the average value of Poisson’s ratio from BCT is by 45% higher in comparison to the average value from VCT.
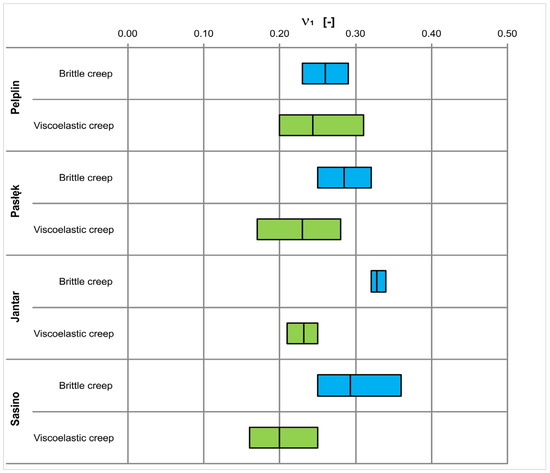
Figure 16.
Comparison of ranges of Poisson’s ratio from brittle and viscoelastic creep tests for particular lithostratigraphic units.
5.3.3. Compressive Strength
Maximum differential stress obtained from brittle and viscoelastic creep tests was compared with values of maximum differential stress obtained from conventional mechanical anisotropy experiments, in which rock samples were compressed axially at a given confining pressure [33].
In the performed creep and anisotropy tests, the samples were tested at the same temperature (85 °C) and confining pressure (50 MPa). All samples were cut out in the same direction (only results of mechanical anisotropy analysis for horizontal samples were taken into account in this study). The conducted experiment modes differed in the applied methodology (most of all the duration of particular experiments).
Results of the maximum differential stress for each analysed sample from creep tests are presented in Table 2 and Table 3. The distribution of strength in particular lithostratigraphic units with subdivision into the experiment mode: brittle creep/viscoelastic creep/anisotropy are presented in Figure 17.
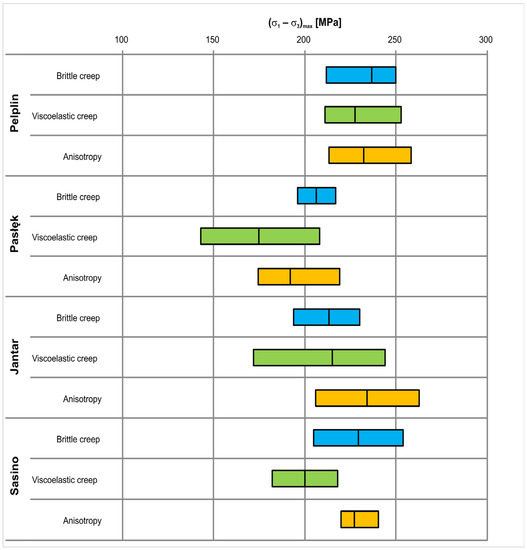
Figure 17.
Comparison of strength ranges from brittle and viscoelastic creep tests, and mechanical anisotropy experiments in particular lithostratigraphic units.
Conventional creep experiments should decrease the strength of the rock material in relation to the classical strength tests. Comparison of the results of maximum differential stress obtained in three test modes shows that for all shale units the average values of maximum differential stress from VCT are lower than the average values from anisotropy tests. In turn, only for the Jantar Member, the average values (σ1–σ3)max from BCT are lower than the average values (σ1–σ3)max from mechanical anisotropy tests. Comparison of strain values for both creep modes indicates that the average values of maximum differential stress for the Pelplin, Pasłęk and Sasino formations from VCT are lower than the average values of maximum differential stress from BCT.
5.3.4. Third Creep Level in Viscoelastic Creep Tests
Additional tests were conducted, in which brittle creep was modelled after registering viscoelastic creep. To achieve this, in two samples (W-260-A and W-306-A) a third level of constant differential stress (75% (σ1–σ3)max) was added after two levels of constant differential stress (25 and 50% (σ1–σ3)max). Such tests allow for comparing brittle creep strain on this additional level of constant differential stress with brittle creep strain (BCT). The magnitude of registered third-loading strain for sample W-260-A (0.00053) is only slightly smaller than the magnitude of strain for mode 1 (W-264-B = 0.00070) representing the same Pelplin Formation and the same borehole (Table 2). A similar relationship was obtained for samples from the Jantar Member, where the magnitude of registered third-loading strain for sample W-306-A (0.00100) is also smaller from the magnitude of strain for BCT (W-305-B = 0.00120) (Table 2). In turn, comparison of brittle creep strain of additional experiments (for the third loading) shows that almost twice larger magnitudes of creep strain were obtained for sample W-306-A than for sample W-260-A (Figure 18).
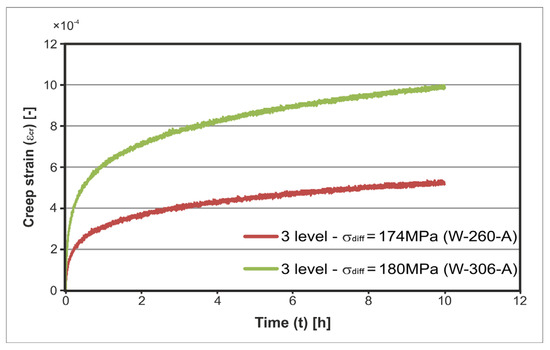
Figure 18.
Third-loading creep strain from viscoelastic creep tests for samples W-260-A and W-306-A.
6. Conclusions
A series of triaxial creep tests was performed on samples of shales rich in organic matter and clay minerals in order to investigate time-dependent deformation. Brittle creep (BCT) and viscoelastic creep (VCT) tests were conducted on horizontal samples (parallel to lamination) from the Baltic Basin and originating from depths over 3600 m. All tests were made at T = 85 °C. In the BCT, the samples were loaded axially at 75% and 85% (σ1–σ3)max, and in VCT—at 25% and 50% (σ1–σ3)max. Comparison of results obtained in different experimental modes was achieved by cutting out the samples from the same section of the core (Figure 4A), from the same lithostratigraphic unit and the same borehole.
All samples display variably time-dependent deformation regardless the experimental mode. Axial strain during creep was larger than lateral strain. In BCT it cannot be stated unequivocally at which stage larger axial creep strain takes place. For most samples, larger strain was noted in the second stage. In these experiment, all three creep stages were observed (primary, secondary and tertiary). In VCT, axial strain is much larger in the second creep stage than in the first creep stage. Practically for all samples, creep strain increased averagely 2.5 times in the second stage than in the first stage. Only two creep stages were noted in these experiments (primary, secondary). Magnitude of strain in second-loading VCT is twice smaller than the magnitude of strain in first-loading BCT. A constant increase of viscoelastic creep in time was registered in VCT.
Young’s modulus is larger for samples from VCT than for samples from BCT and increases in successive stages. Poisson’s ratio is larger for samples from BCT than for samples from VCT and does not change with subsequent creep stages in VCT.
The obtained strength results from brittle and viscoelastic creep tests were compared with strength results obtained from mechanical anisotropy experiments. Based on the analyses it was assumed that long-term loading of a sample at various stress levels only slightly decreases its maximum strength.
Additionally, special tests linking viscoelastic creep with brittle creep were conducted. In VCT a third level of constant stress at 75% (σ1–σ3)max was added. This step was undertaken to check the differences in the magnitude of strain registered during the first creep stage in BCT and the third creep stage in VCT. As a result, it was assumed that brittle creep strain during the first creep stage is higher than the third creep stage in VCT.
Based on the performed experiments and the obtained results, it was assumed that a more optimal extraction of natural gas from shales requires fracturing activities at pressures higher than may be assumed from simple strength-strain analyses of the fracturing fluids. The very high pressure of fracturing fluids should cause brittle strain, which with time will develop into a network of fractures and fissures, and thus enable better and more efficient gas migration to the borehole.
Fracturing at initially low pressures, in which the pressure is increased gradually, will even have negative impact on the availability of the deposit, because viscoelastic strain may take place during the fracturing process; this deformation will cause closing of fractures obtained during the fracturing process in the rock massif. Long-term viscoelastic strain may also hamper gas migration to the borehole through decreasing reservoir permeability.
Author Contributions
Conceptualization, P.M.W., A.D. and P.L.; methodology, P.M.W. and P.L., validation, P.M.W.; formal analysis, P.M.W.; investigation, P.M.W.; data curation, P.M.W.; writing—original draft preparation, P.M.W.; writing—review and editing, P.M.W., A.D. and P.L.; visualization, P.M.W.; project administration, A.D.; funding acquisition, A.D. and P.L. All authors have read and agreed to the published version of the manuscript. Please turn to the CRediT taxonomy for the term explanation. Authorship must be limited to those who have contributed substantially to the work reported.
Funding
The research was conducted under the framework of the ShaleMech project led by Polish Oil and Gas Company (PGNiG S.A.), under the auspices of the Blue Gas Program launched by the Polish National Committee for Research and Development (NCBiR), Poland, grant no. BG2-SHALE MECH-14. Samples were provided by Polish Oil and Gas Company (PGNiG S.A.).
Institutional Review Board Statement
Not applicable.
Informed Consent Statement
Not applicable.
Data Availability Statement
Data is classified. The data is stored by the Polish Oil and Gas Company (PGNiG S.A.).
Conflicts of Interest
The authors declare no conflict of interest.
References
- Brantut, N.; Baud, P.; Heap, M.; Meredith, P. Micromechanics of brittle creep in rocks. J. Geophys. Res. Space Phys. 2012, 117. [Google Scholar] [CrossRef] [Green Version]
- Brantut, N.; Heap, M.; Meredith, P.; Baud, P. Time-dependent cracking and brittle creep in crustal rocks: A review. J. Struct. Geol. 2013, 52, 17–43. [Google Scholar] [CrossRef]
- Sone, H. Mechanical Properties of Shale Gas Reservoir Rocks, and Its Relation to the In-Situ Stress Variation Observed in Shale Gas Reservoirs. Ph.D. Thesis, Stanford University, Stanford, CA, USA, 2012. [Google Scholar]
- Sone, H.; Zoback, M.D. Strength, creep and frictional properties of gas shale reservoir rocks. In Proceedings of the 44th USA Rock Mechanics Symposium and 5th USA-Canada Rock Mechanics Symposium, Salt Lake City, UT, USA, 27–30 June 2010; American Rock Mechanics Association: Salt Lake City, UT, USA, 2010. [Google Scholar]
- Sone, H.; Zoback, M.D. Mechanical properties of shale-gas reservoir rocks—Part 1: Static and dynamic elastic properties and anisotropy. Geophysics 2013, 78, D381–D392. [Google Scholar] [CrossRef] [Green Version]
- Sone, H.; Zoback, M.D. Mechanical properties of shale-gas reservoir rocks—Part 2: Ductile creep, brittle strength, and their relation to the elastic modulus. Geophysics 2013, 78, D393–D402. [Google Scholar] [CrossRef]
- Sone, H.; Zoback, M.D. Time-dependent deformation of shale gas reservoir rocks and its long-term effect on the in situ state of stress. Int. J. Rock Mech. Min. Sci. 2014, 69, 120–132. [Google Scholar] [CrossRef]
- Lora, R.V.; Ghazanfari, E. Creep Behavior of Shale Formations in Shale Gas Development. In Proceedings of the IFCEE 2015, San Antonio, TX, USA, 17–21 March 2015. [Google Scholar]
- Yang, Y.; Zoback, M. Viscoplastic Deformation of the Bakken and Adjacent Formations and Its Relation to Hydraulic Fracture Growth. Rock Mech. Rock Eng. 2016, 49, 689–698. [Google Scholar] [CrossRef]
- Khosravi, E.; Ghassemi, A. Influence of temperature and anisotropy on creep behavior of Mancos shale. In Proceedings of the 51st U.S. Rock Mechanics/Geomechanics Symposium (ARMA-2017-0917), San Francisco, CA, USA, 25–28 June 2017. [Google Scholar]
- Rybacki, E.; Herrmann, J.; Wirth, R.; Dresen, G. Creep of Posidonia Shale at Elevated Pressure and Temperature. Rock Mech. Rock Eng. 2017, 50, 3121–3140. [Google Scholar] [CrossRef]
- Kamali-Asl, A.; Ghazanfari, E.; Newell, P.; Stevens, M. Elastic, viscoelastic, and strength properties of Marcellus Shale specimens. J. Pet. Sci. Eng. 2018, 171, 662–679. [Google Scholar] [CrossRef]
- Rassouli, F.S.; Zoback, M.D. Comparison of Short-Term and Long-Term Creep Experiments in Shales and Carbonates from Unconventional Gas Reservoirs. Rock Mech. Rock Eng. 2018, 51, 1995–2014. [Google Scholar] [CrossRef]
- Trzeciak, M.; Sone, H.; Dabrowski, M. Long-term creep tests and viscoelastic constitutive modeling of lower Paleozoic shales from the Baltic Basin, N Poland. Int. J. Rock Mech. Min. Sci. 2018, 112, 139–157. [Google Scholar] [CrossRef]
- Herrmann, J.; Rybacki, E.; Sone, H.; Dresen, G. Deformation Experiments on Bowland and Posidonia Shale—Part II: Creep Behavior at In Situ pc–T Conditions. Rock Mech. Rock Eng. 2020, 53, 755–779. [Google Scholar] [CrossRef] [Green Version]
- Ghassemi, A.; Suarez-Rivera, R. Sustaining Fracture Area and Conductivity of Gas Shale Reservoirs for Enhancing Long-Term Production and Recovery; RPSEA Report 08122-081448; Terra Tek Inc.: Birmingham, UK, 2012. [Google Scholar]
- Rybacki, E.; Meier, T.; Dresen, G. What controls the mechanical properties of shale rocks?—Part II: Brittleness. J. Pet. Sci. Eng. 2016, 144, 39–58. [Google Scholar] [CrossRef] [Green Version]
- Du, J.; Hu, L.; Meegoda, J.N.; Zhang, G. Shale softening: Observations, phenomenological behavior, and mechanisms. Appl. Clay Sci. 2018, 161, 290–300. [Google Scholar] [CrossRef]
- Liu, K.; Rassouli, F.S.; Liu, B.; Ostadhassan, M. Creep Behavior of Shale: Nanoindentation vs. Triaxial Creep Tests. Rock Mech. Rock Eng. 2021, 54, 321–335. [Google Scholar] [CrossRef]
- Fjaer, E.; Holt, R.M.; Horsrud, P.; Raane, A.M.; Risnes, R. Petroleum Related Rock Mechanics, 2nd ed.; Elsevier Science: Amsterdam, The Netherlands, 2008; Volume 53, ISBN 978-0-444-50260-5. [Google Scholar]
- Cieślik, J. Dilatancy as a measure of fracturing development in the process of rock damage. Open Geosci. 2018, 10, 484–490. [Google Scholar] [CrossRef] [Green Version]
- Rybacki, E.; Reinicke, A.; Meier, T.; Makasi, M.; Dresen, G. What controls the mechanical properties of shale rocks?—Part I: Strength and Young’s modulus. J. Pet. Sci. Eng. 2015, 135, 702–722. [Google Scholar] [CrossRef]
- Basu, S.; Jones, A.; Mahzari, P. Best Practices for Shale Core Handling: Transportation, Sampling and Storage for Conduction of Analyses. J. Mar. Sci. Eng. 2020, 8, 136. [Google Scholar] [CrossRef] [Green Version]
- Modliński, Z.; Podhalańska, T. Outline of the lithology and depositional features of the lower Paleozoic strata in the Polish part of the Baltic region. Geol. Q. 2010, 54, 109–121. [Google Scholar]
- Poprawa, P. Shale gas potential of the Lower Palaeozoic complex in the Baltic and Lublin-Podlasie basins (Poland). Prz. Geol. 2010, 58, 226–249. [Google Scholar]
- Poprawa, P.; Šliaupa, S.; Stephenson, R.; Lazauskien, J. Late Vendian–Early Palæozoic tectonic evolution of the Baltic Basin: Regional tectonic implications from subsidence analysis. Tectonophysics 1999, 314, 219–239. [Google Scholar] [CrossRef]
- Poprawa, P.; Šliaupa, S.; Sidorov, V. Późnosylursko-wczesnodewońska śródpłytowa kompresja na przedpolu kaledońskiego orogenu (centralna część basenu bałtyckiego)—Analiza danych sejsmicznych. Pract. Panstw. Inst. Geol. 2006, 186, 215–224. [Google Scholar]
- Tomczyk, H. Rozwój litofacjalny syluru w zachodniej części syneklizy perybałtyckiej. Biul. Inst. Geol. 1976, 270, 109–130. [Google Scholar]
- Modliński, Z.; Nehring--Lefeld, M.; Ryba, J. The Early Palaeozoic complex in the Polish part of the Baltic Sea. Z. Geol. Wiss. 1994, 22, 227–234. [Google Scholar]
- Modliński, Z.; Szymański, B.; Teller, L. The silurian lithostratigraphy of the Polish part of the Peri-Baltic Depression (N Poland). Prz. Geol. 2006, 54, 787–796. [Google Scholar]
- Domżalski, J.; Górecki, W.; Mazurek, A.; Myśko, A.; Strzetelski, W.; Szymałek, K. The prospects for petroleum exploration in the eastern sector of Southern Baltic as revealed by sea bottom geochemical survey correlated with seismic data. Prz. Geol. 2004, 52, 792–799. [Google Scholar]
- Konon, A.; Wyglądała, M.; Haluch, A.; Rybak-Ostrowska, B.; Cyz, M.; Malinowski, M. Using seismic and well data to determine processes of folding in the Pomeranian segment of the Caledonian Foredeep Basin, Poland. Mar. Pet. Geol. 2021, 124, 104804. [Google Scholar] [CrossRef]
- Wilczynski, P.; Domonik, A.; Lukaszewski, P. Anisotropy of Strength and Elastic Properties of Lower Paleozoic Shales from the Baltic Basin, Poland. Energies 2021, 14, 2995. [Google Scholar] [CrossRef]
- Leśniak, G.; Sowiżdżał, K.; Stadtmuller, M.; Lis-Śledziona, A.; Kaczmarczyk, W.; Słota-Valim, M.; Kasza, P. Wykonanie niestandardowych Kompleksowych Badań Petrofizycznych i Geomechanicznych na Próbkach i Danych z Dolnopaleozoicznych Łupków; Technical Report, Shalemech no.3; INiG–PIB: Kraków, Poland, 2017. [Google Scholar]
- Janas, M. Rock-Eval Study on Samples Dedicated to ShaleMech Geomechanical Tests (Samples from O-3, B-1, W-1 and M-1 Wells). 2017; Unpublished Report. [Google Scholar]
- ASTM D 4543-01. Standard Practices for Preparing Rock Core Specimens and Determining Dimensional and Shape Tolerances. In Annual Book of ASTM Standards; ASTM International: West Conshohocken, PA, USA, 2001. [Google Scholar]
- Dewhurst, D.N.; Siggins, A.F. Impact of fabric, microcracks and stress field on shale anisotropy. Geophys. J. Int. 2006, 165, 135–148. [Google Scholar] [CrossRef] [Green Version]
- Islam, A.; Skalle, P. An Experimental Investigation of Shale Mechanical Properties Through Drained and Undrained Test Mechanisms. Rock Mech. Rock Eng. 2013, 46, 1391–1413. [Google Scholar] [CrossRef] [Green Version]
- Fairhurst, C.E.; Hudson, J.A. Draft ISRM suggested method for the complete stress-strain curve for intact rock in uniaxial compression. Int. J. Rock Mech. Min. Sci. 1999, 36, 279–289. [Google Scholar]
- Cieślik, J. Onset of Crack Initiation in Uniaxial and Triaxial Compression Tests of Dolomite Samples. Stud. Geotech. Mech. 2014, 36, 23–27. [Google Scholar] [CrossRef] [Green Version]
- Gupta, N.; Mishra, B. Influence of stress-induced microcracks on viscoplastic creep deformation in Marcellus shale. Acta Geotech. 2021, 16, 1575–1595. [Google Scholar] [CrossRef]
- Borecki, M.; Kwaśniewski, M.; Oleksy, S. Experimental studies on creep of the Lower-Ruda and Upper-Saddle carboniferous rocks from the Jastrzebie coal mine. Mat. Sil. Univ. Technol. 1982, 125–164. [Google Scholar]
- ASTM D 3148-02. Standard Test Method for Elastic Moduli of Intact Rock Core Specimens in Uniaxial Compression; ASTM International: West Conshohocken, PA, USA, 1993. [Google Scholar]
- Eurokod 7-PN-EN-1997-2:2009. Geotechnical Design. Design Assisted by Laboratory Testing; European Committee for Standardization: Brussel, Belgium, 2009. [Google Scholar]
- Bieniawski, Z.T.; Bernede, M.J. Suggested methods for determining the uniaxial compressive strength and deformability of rock materials: Part 1. Suggested method for determining deformability of rock materials in uniaxial compression. Int. J. Rock Mech. Min. Sci. Geomech. Abstr. 1979, 16, 138–140. [Google Scholar] [CrossRef]
- Mishra, B.; Verma, P. Uniaxial and triaxial single and multistage creep tests on coal-measure shale rocks. Int. J. Coal Geol. 2015, 137, 55–65. [Google Scholar] [CrossRef]
- Chang, C.; Moos, D.; Zoback, M.D. Anelasticity and dispersion in dry unconsolidated sands. Int. J. Rock Mech. Min. Sci. 1997, 34, 48.e1–48.e12. [Google Scholar] [CrossRef]
Publisher’s Note: MDPI stays neutral with regard to jurisdictional claims in published maps and institutional affiliations. |
© 2021 by the authors. Licensee MDPI, Basel, Switzerland. This article is an open access article distributed under the terms and conditions of the Creative Commons Attribution (CC BY) license (https://creativecommons.org/licenses/by/4.0/).