
Measures of Functional Reliability of Two-Lane Highways


Abstract
1. Introduction
- –
- Whether and to what extent selected traffic parameters impact the functional reliability measures of single carriageways and two-lane highways?
- –
- Whether the measures and reference values for dual carriageways can be transplanted directly onto analyses of two-lane highways?An indirect aim pointing the directions of further research work revolves around answering the question of
- –
- Whether the statistical parameters describing travel time variability are sufficient to analyze and assess the reliability of a road section in a probabilistic approach that takes into account the risk of the occurrence of road incidents happening during travel speeds exceeding the speed limit?
2. Materials and Methods
2.1. Reliability Measures
- The presence of traffic control–traffic signals, including in particular incorrectly designed control parameters, rail-road crossings,
- Daily, weekly or seasonal fluctuations in traffic,
- Occasional events—various types of events making the traffic flow value different from the typical values of the flow on this road (religious, public holidays, days off, etc.),
- Road capacity—dependent on road geometry and a number of other factors e.g., the technical condition of road surface,
- Weather conditions, in particular snowfall, heavy or prolonged rainfall, fog,
- Road accidents and other road incidents blocking passing vehicles,
- Road works resulting in a taper of the road’s cross-section, alternating traffic, temporary road blockage.
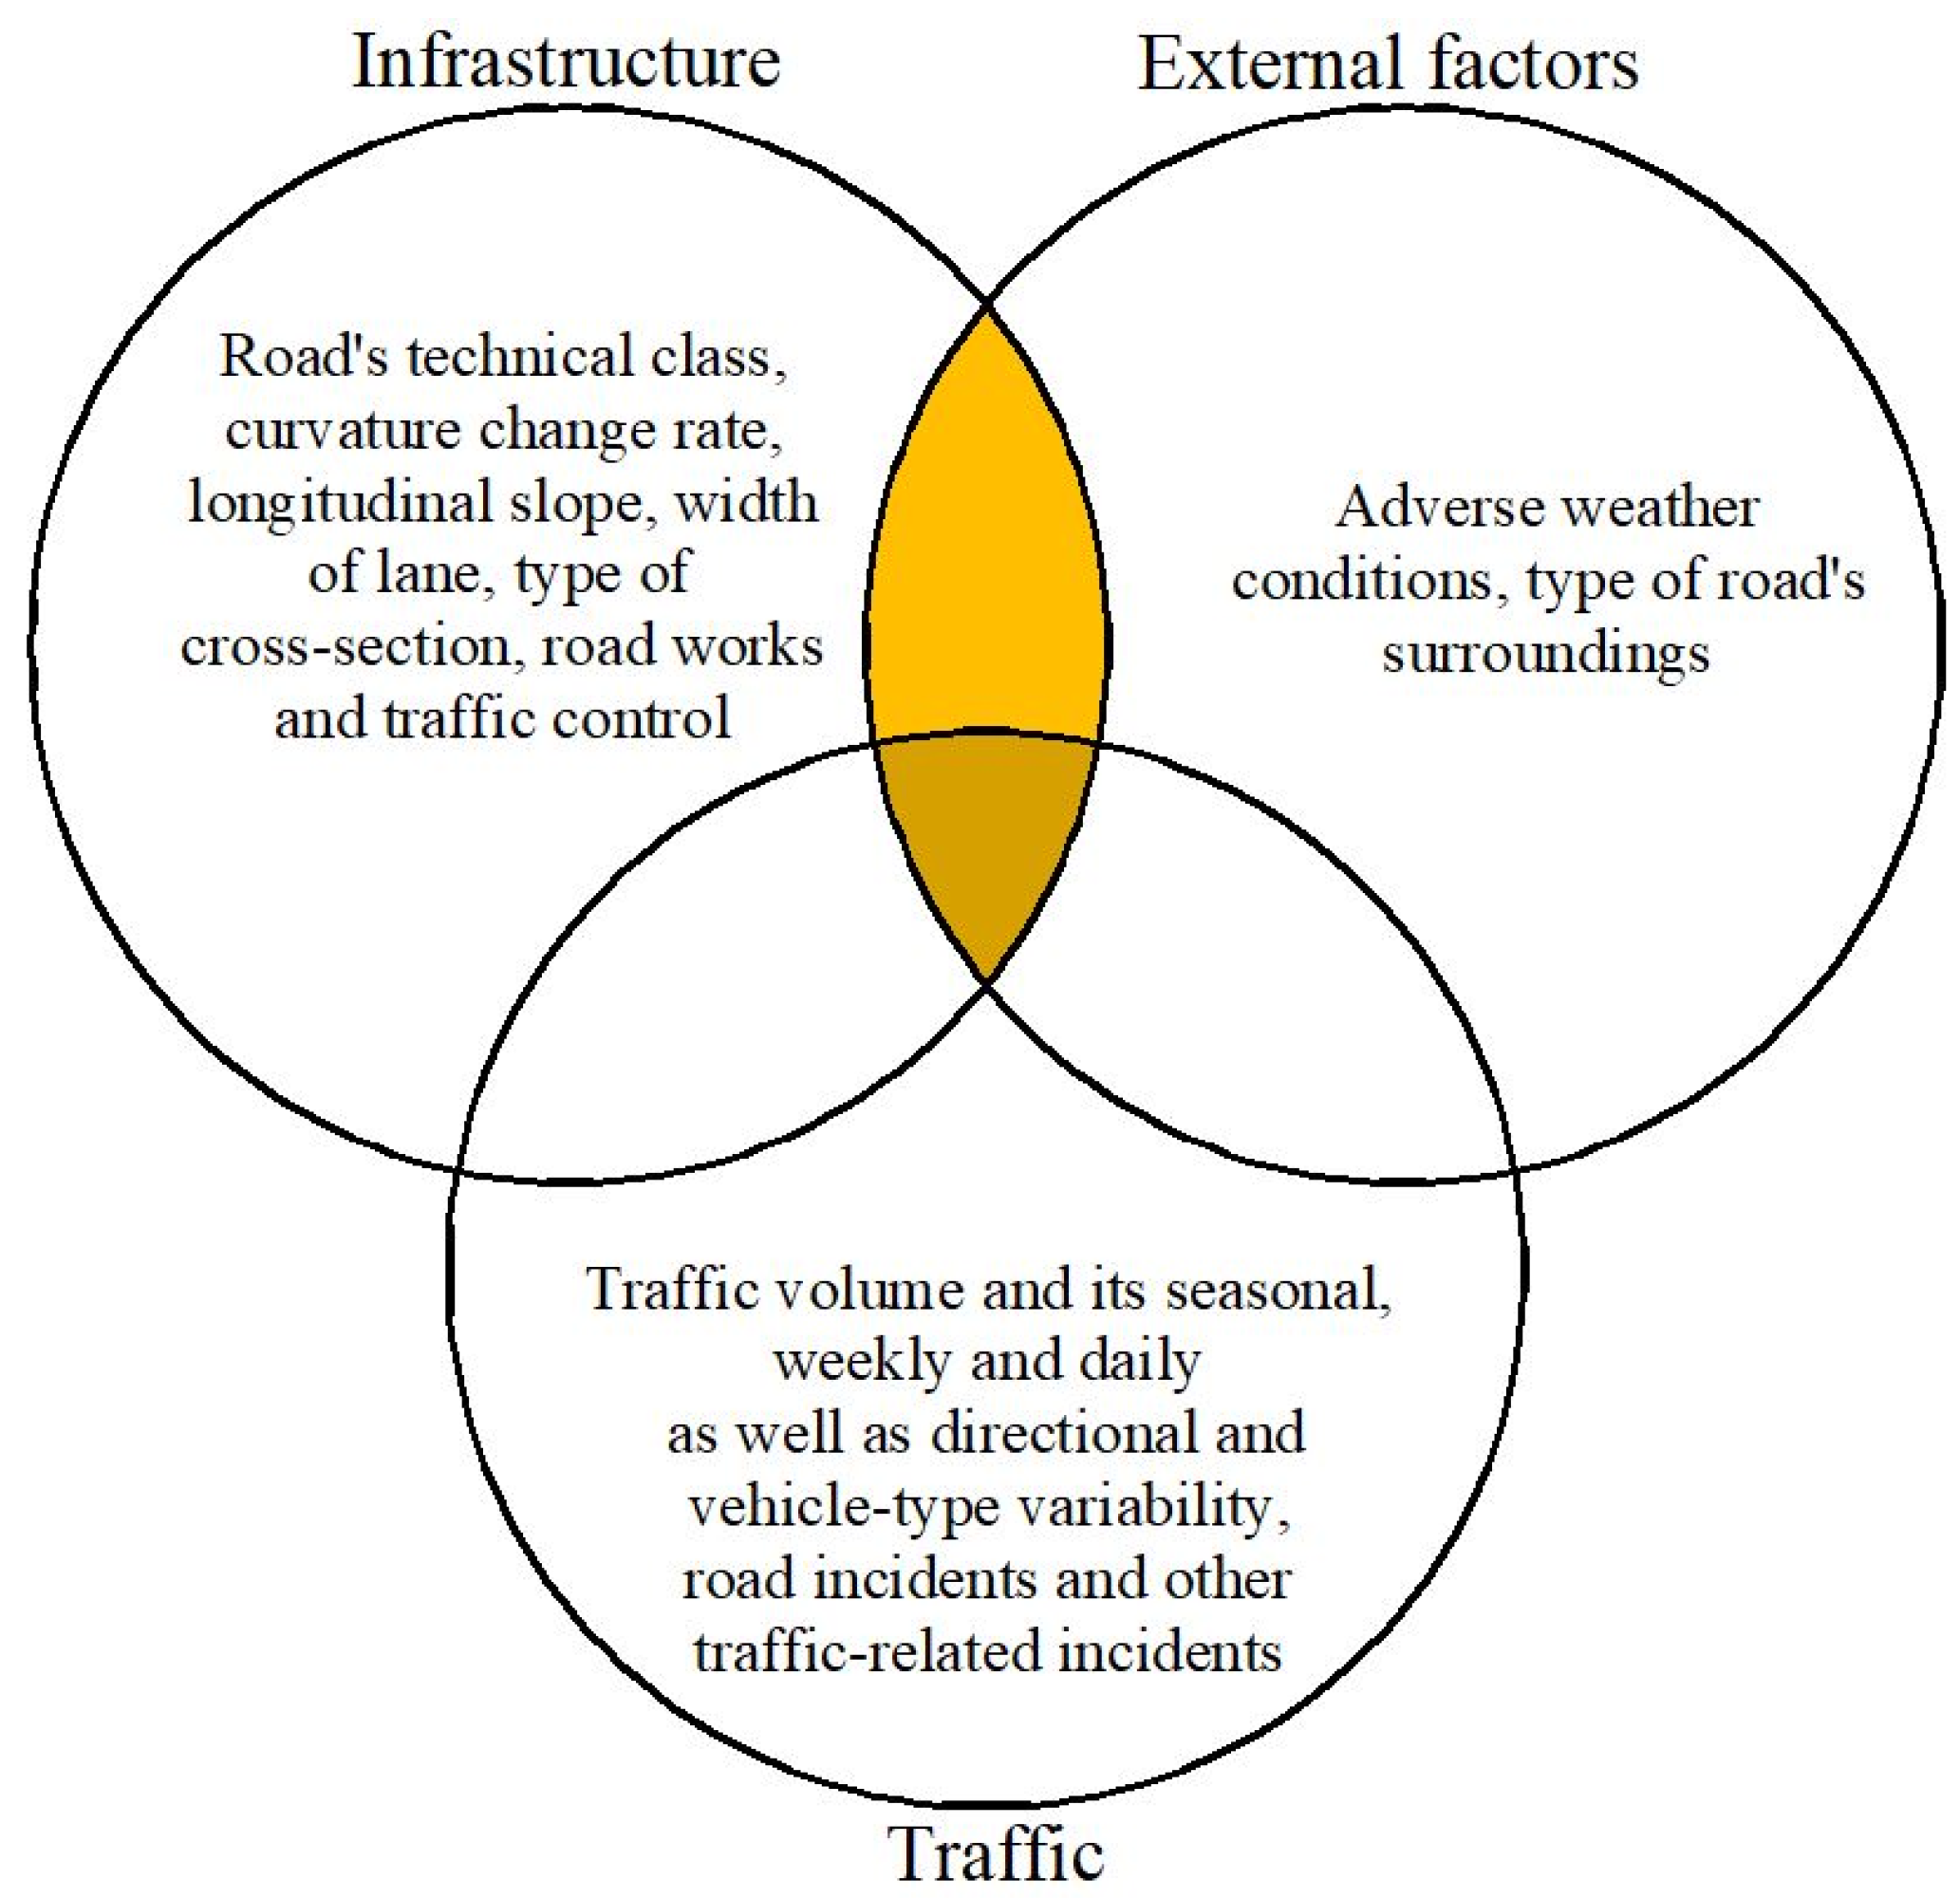
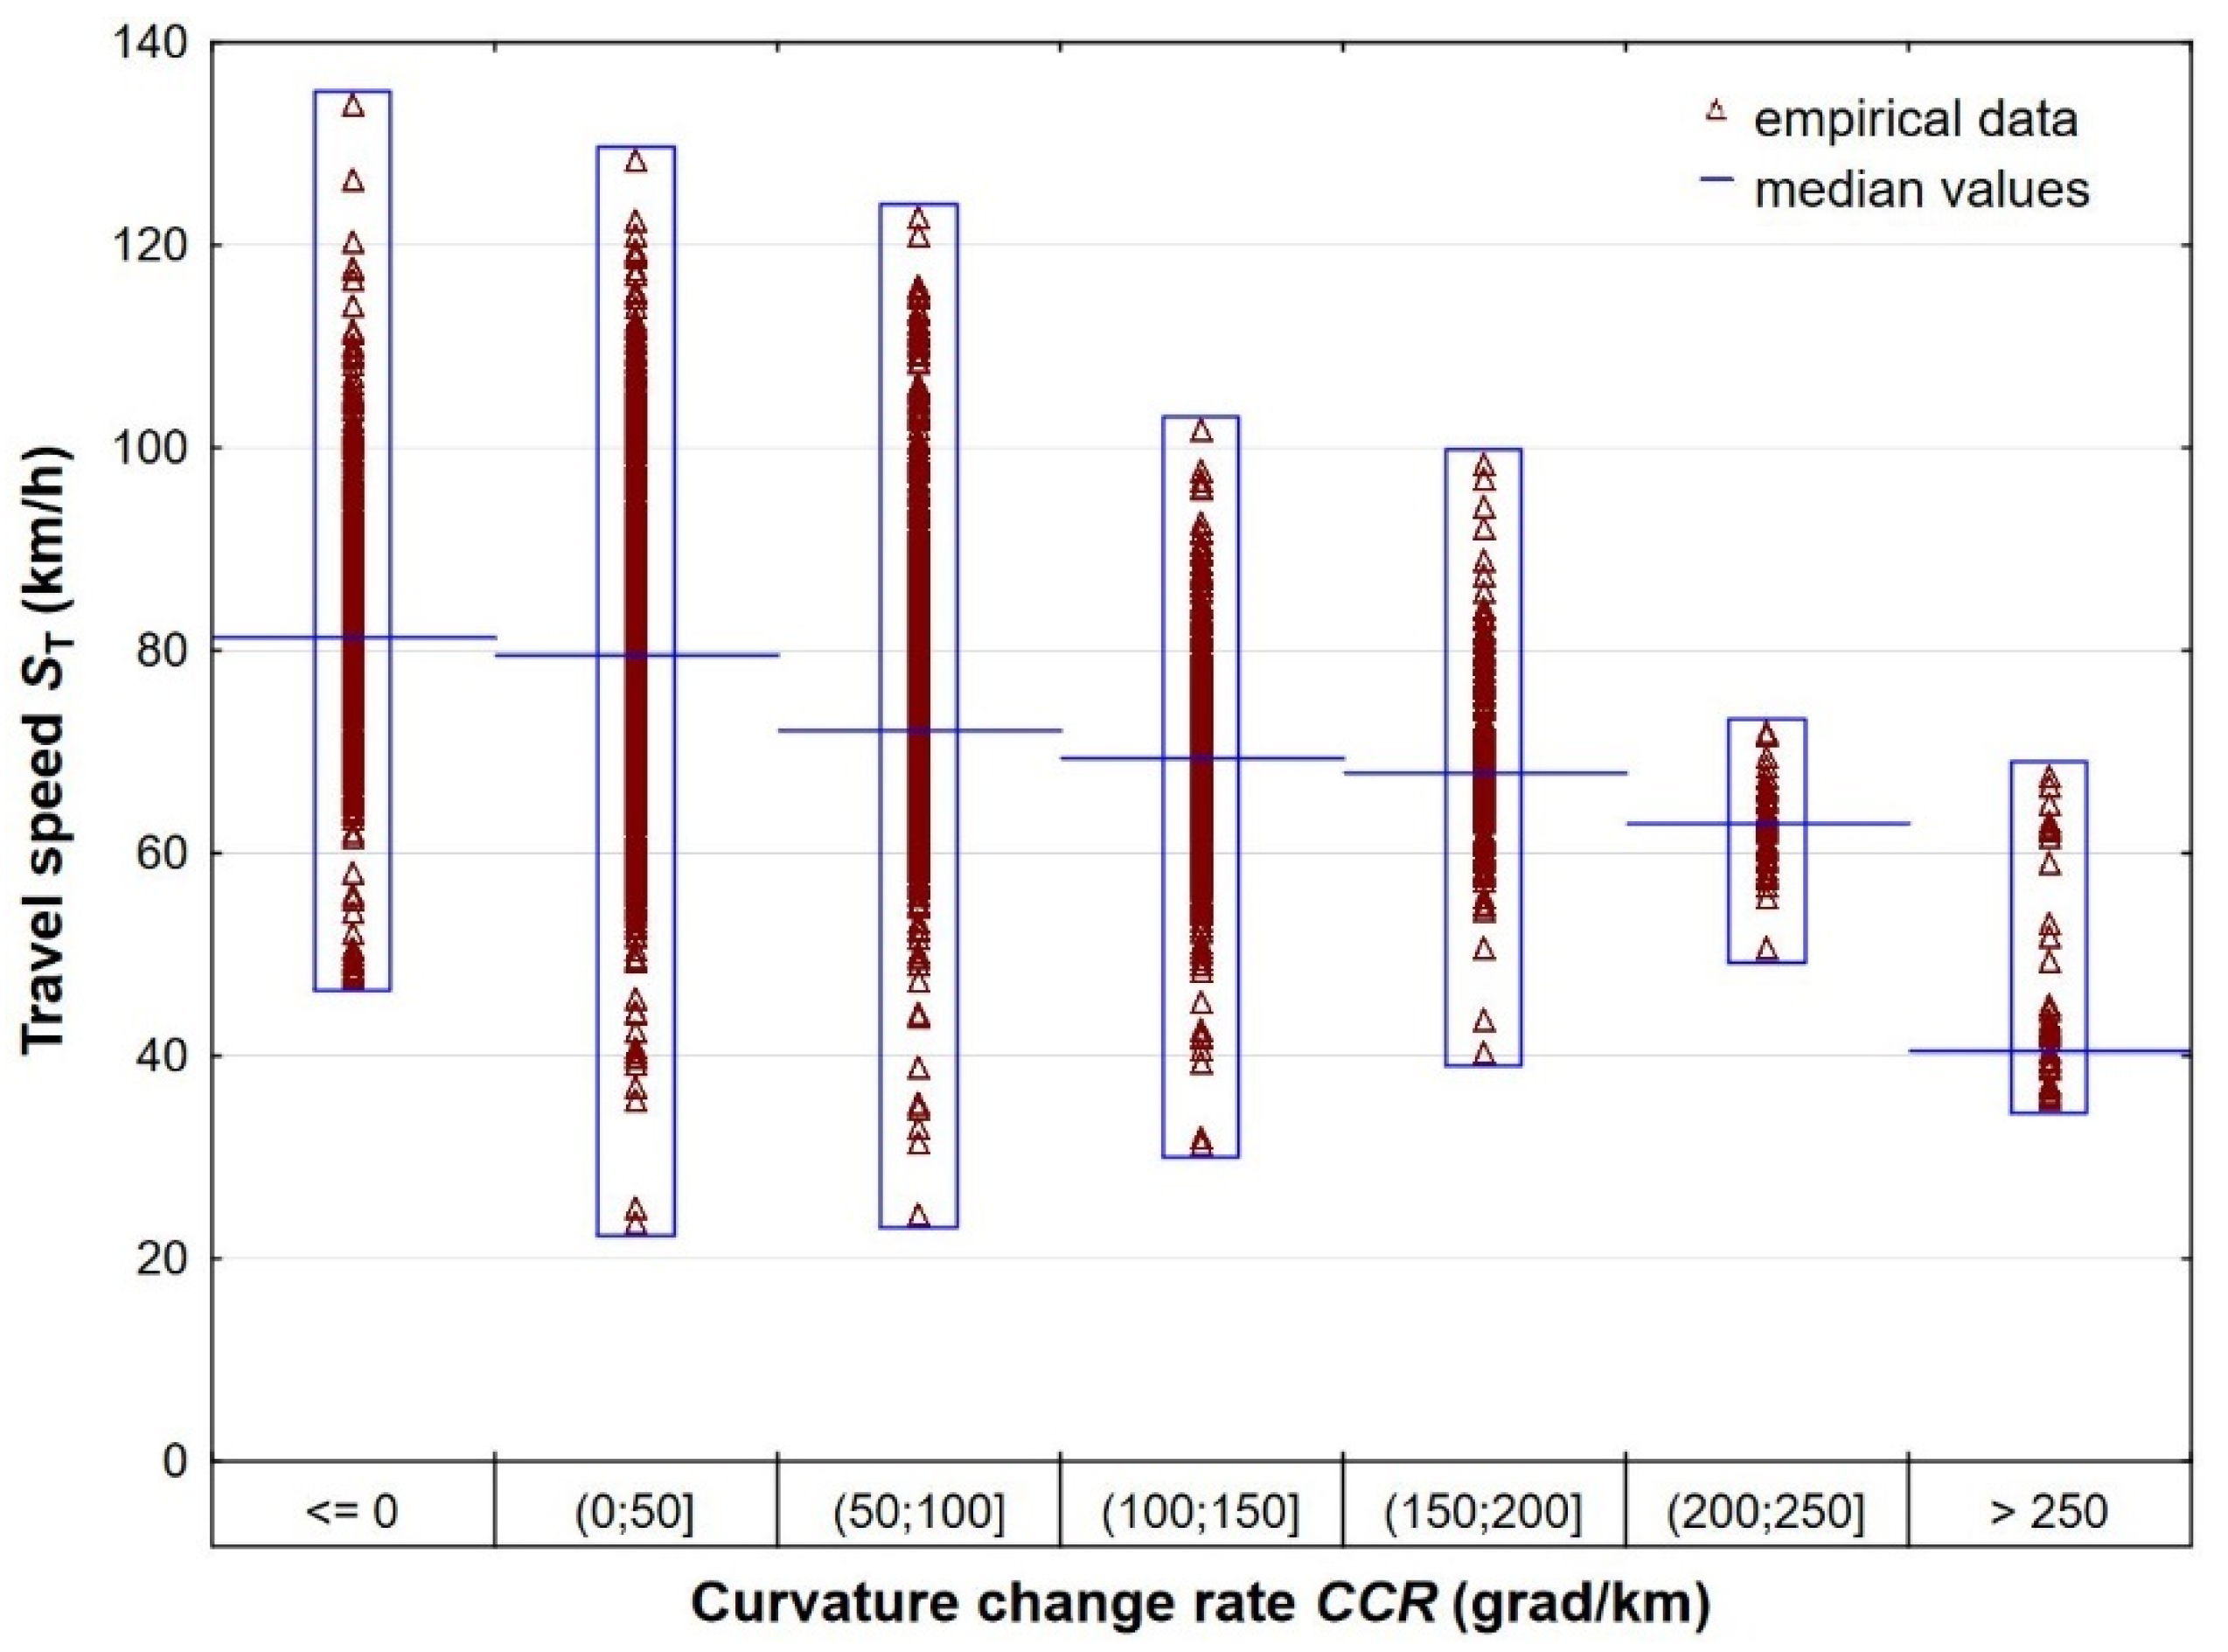
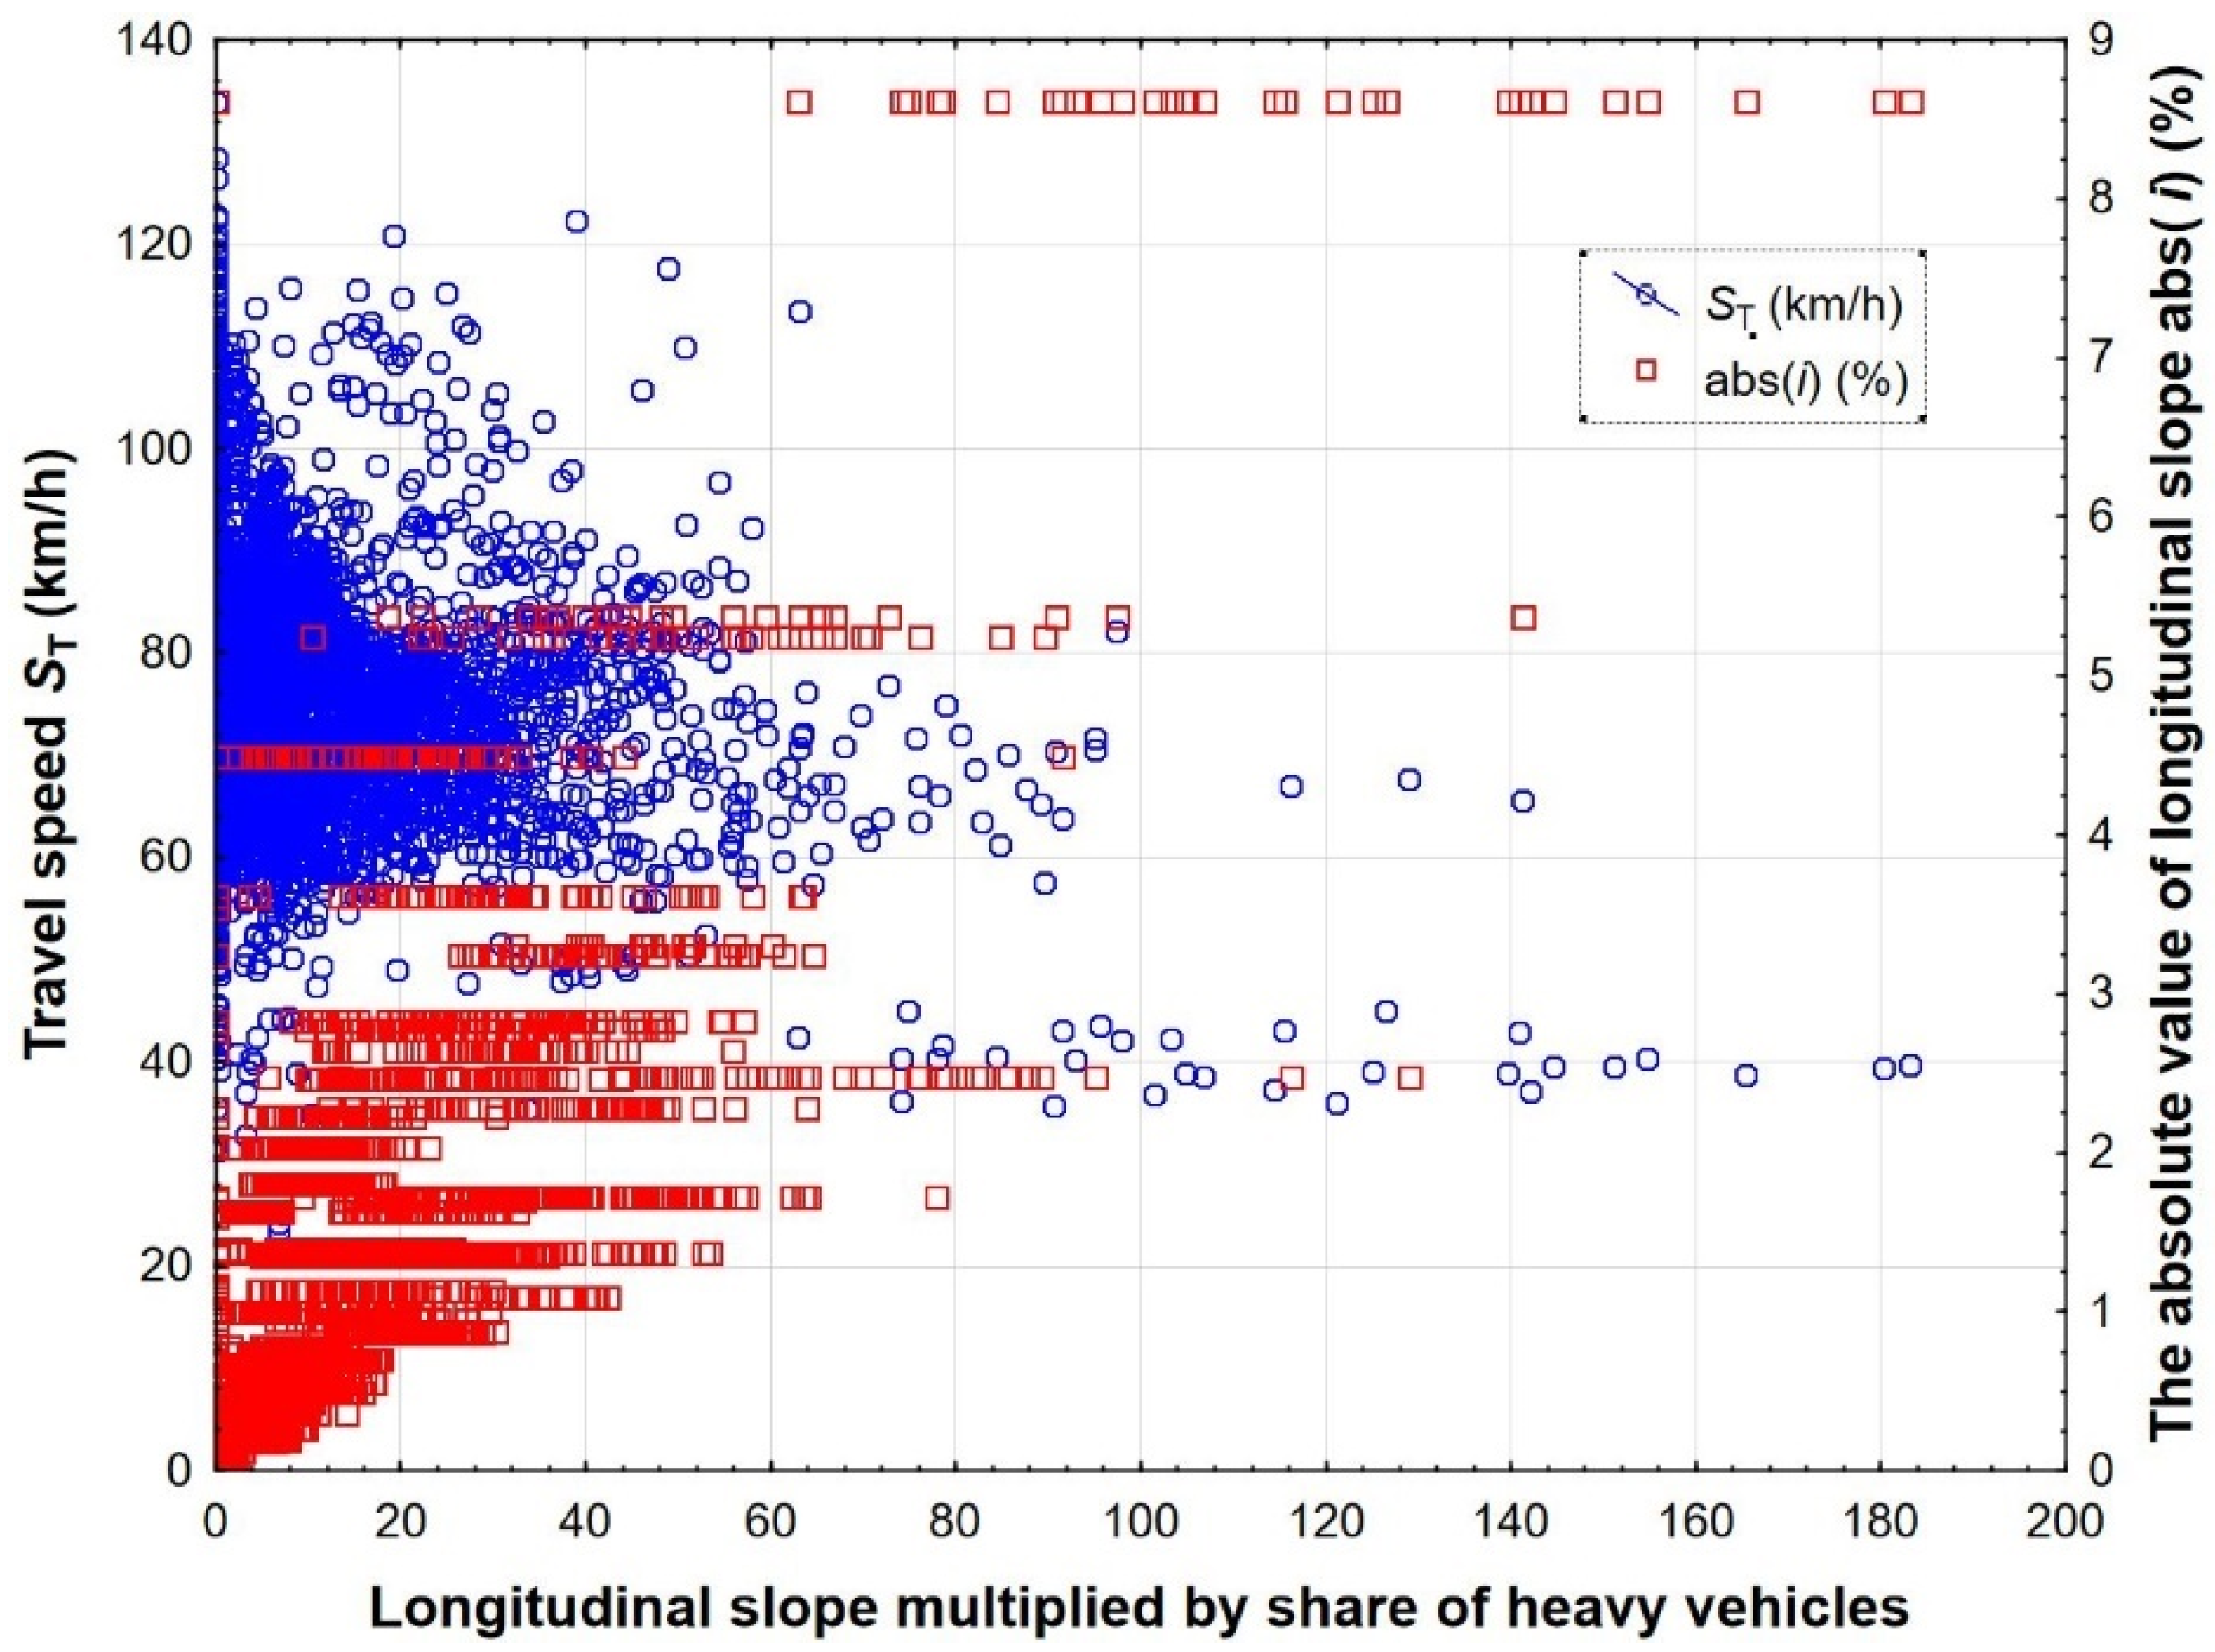
- Infrastructure, i.e., a road’s geometry and its standard, including the road’s curvature change rate CCR [49,50], longitudinal slope [51,52] and width [53,54] and traffic organization, including road works [55,56,57], temporary and permanent taper of the road’s cross-section, and the presence of traffic lights [58,59],
- Statistical methods,
- Buffer time methods,
- Late travel indicators,
- Probabilistic methods,
- Skewness methods (treated as part of statistical methods in the paper).
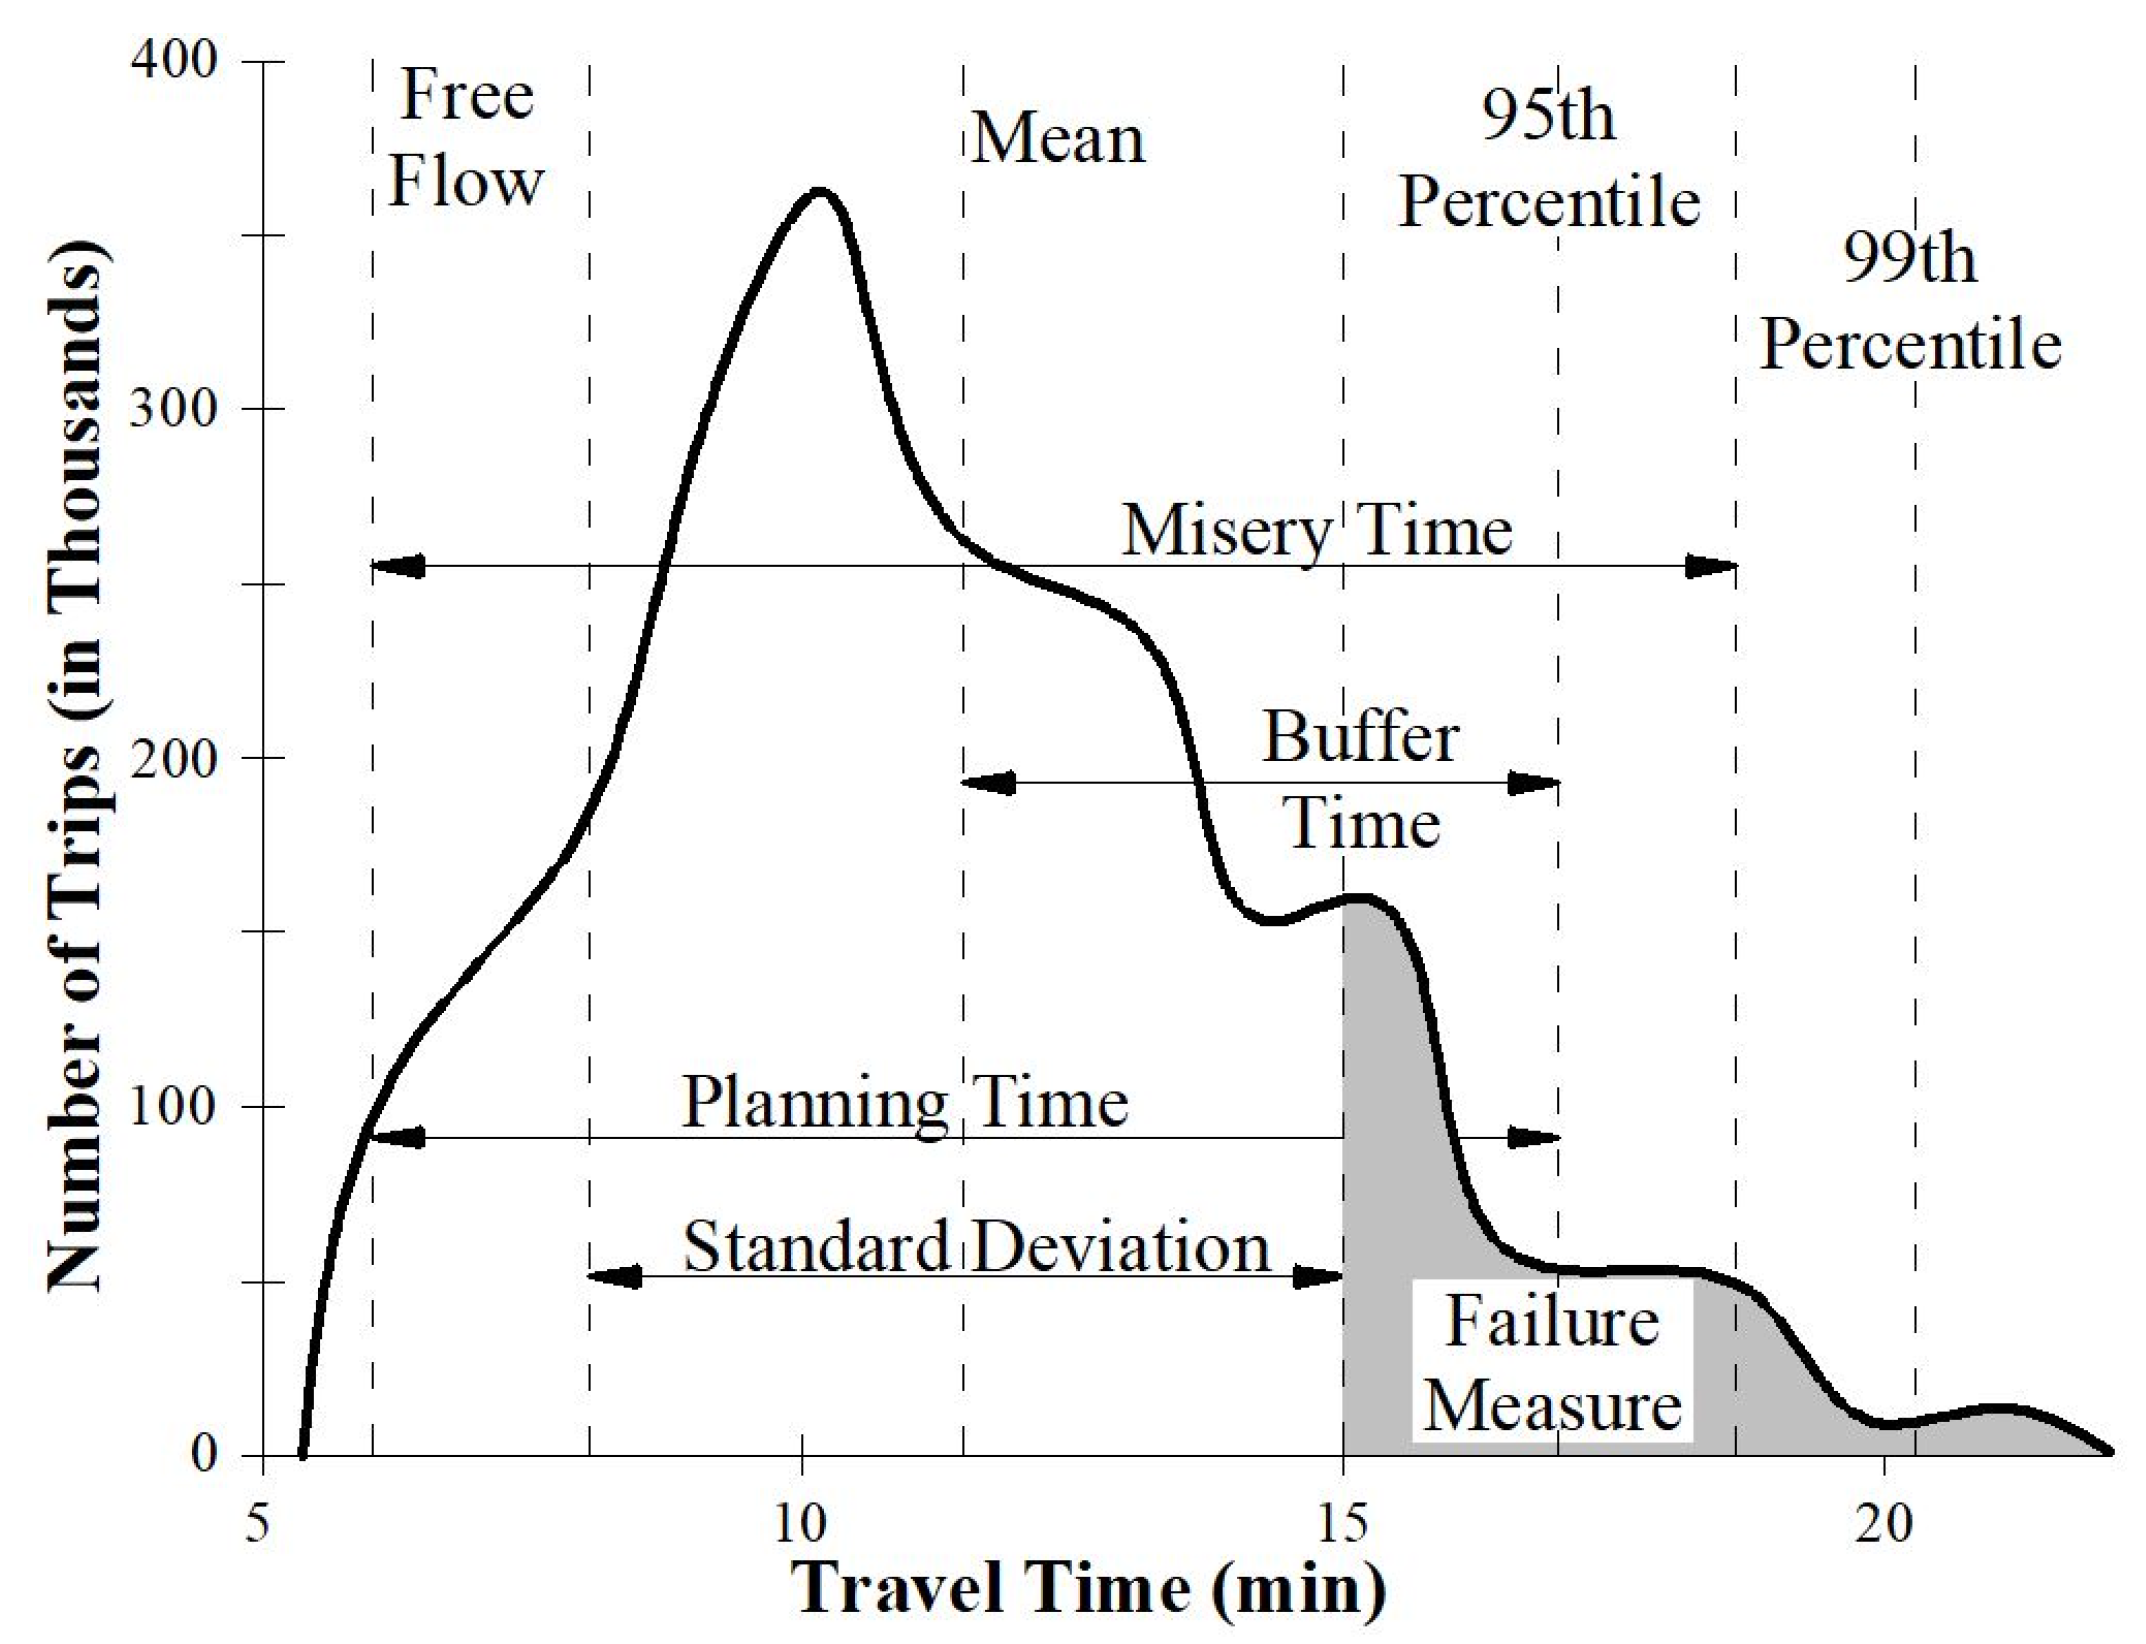
2.1.1. Statistical Methods
- n—number of travels,
- ti—i-travel time,
- —average travel time.
2.1.2. Buffer Time Methods
2.1.3. Planning Time
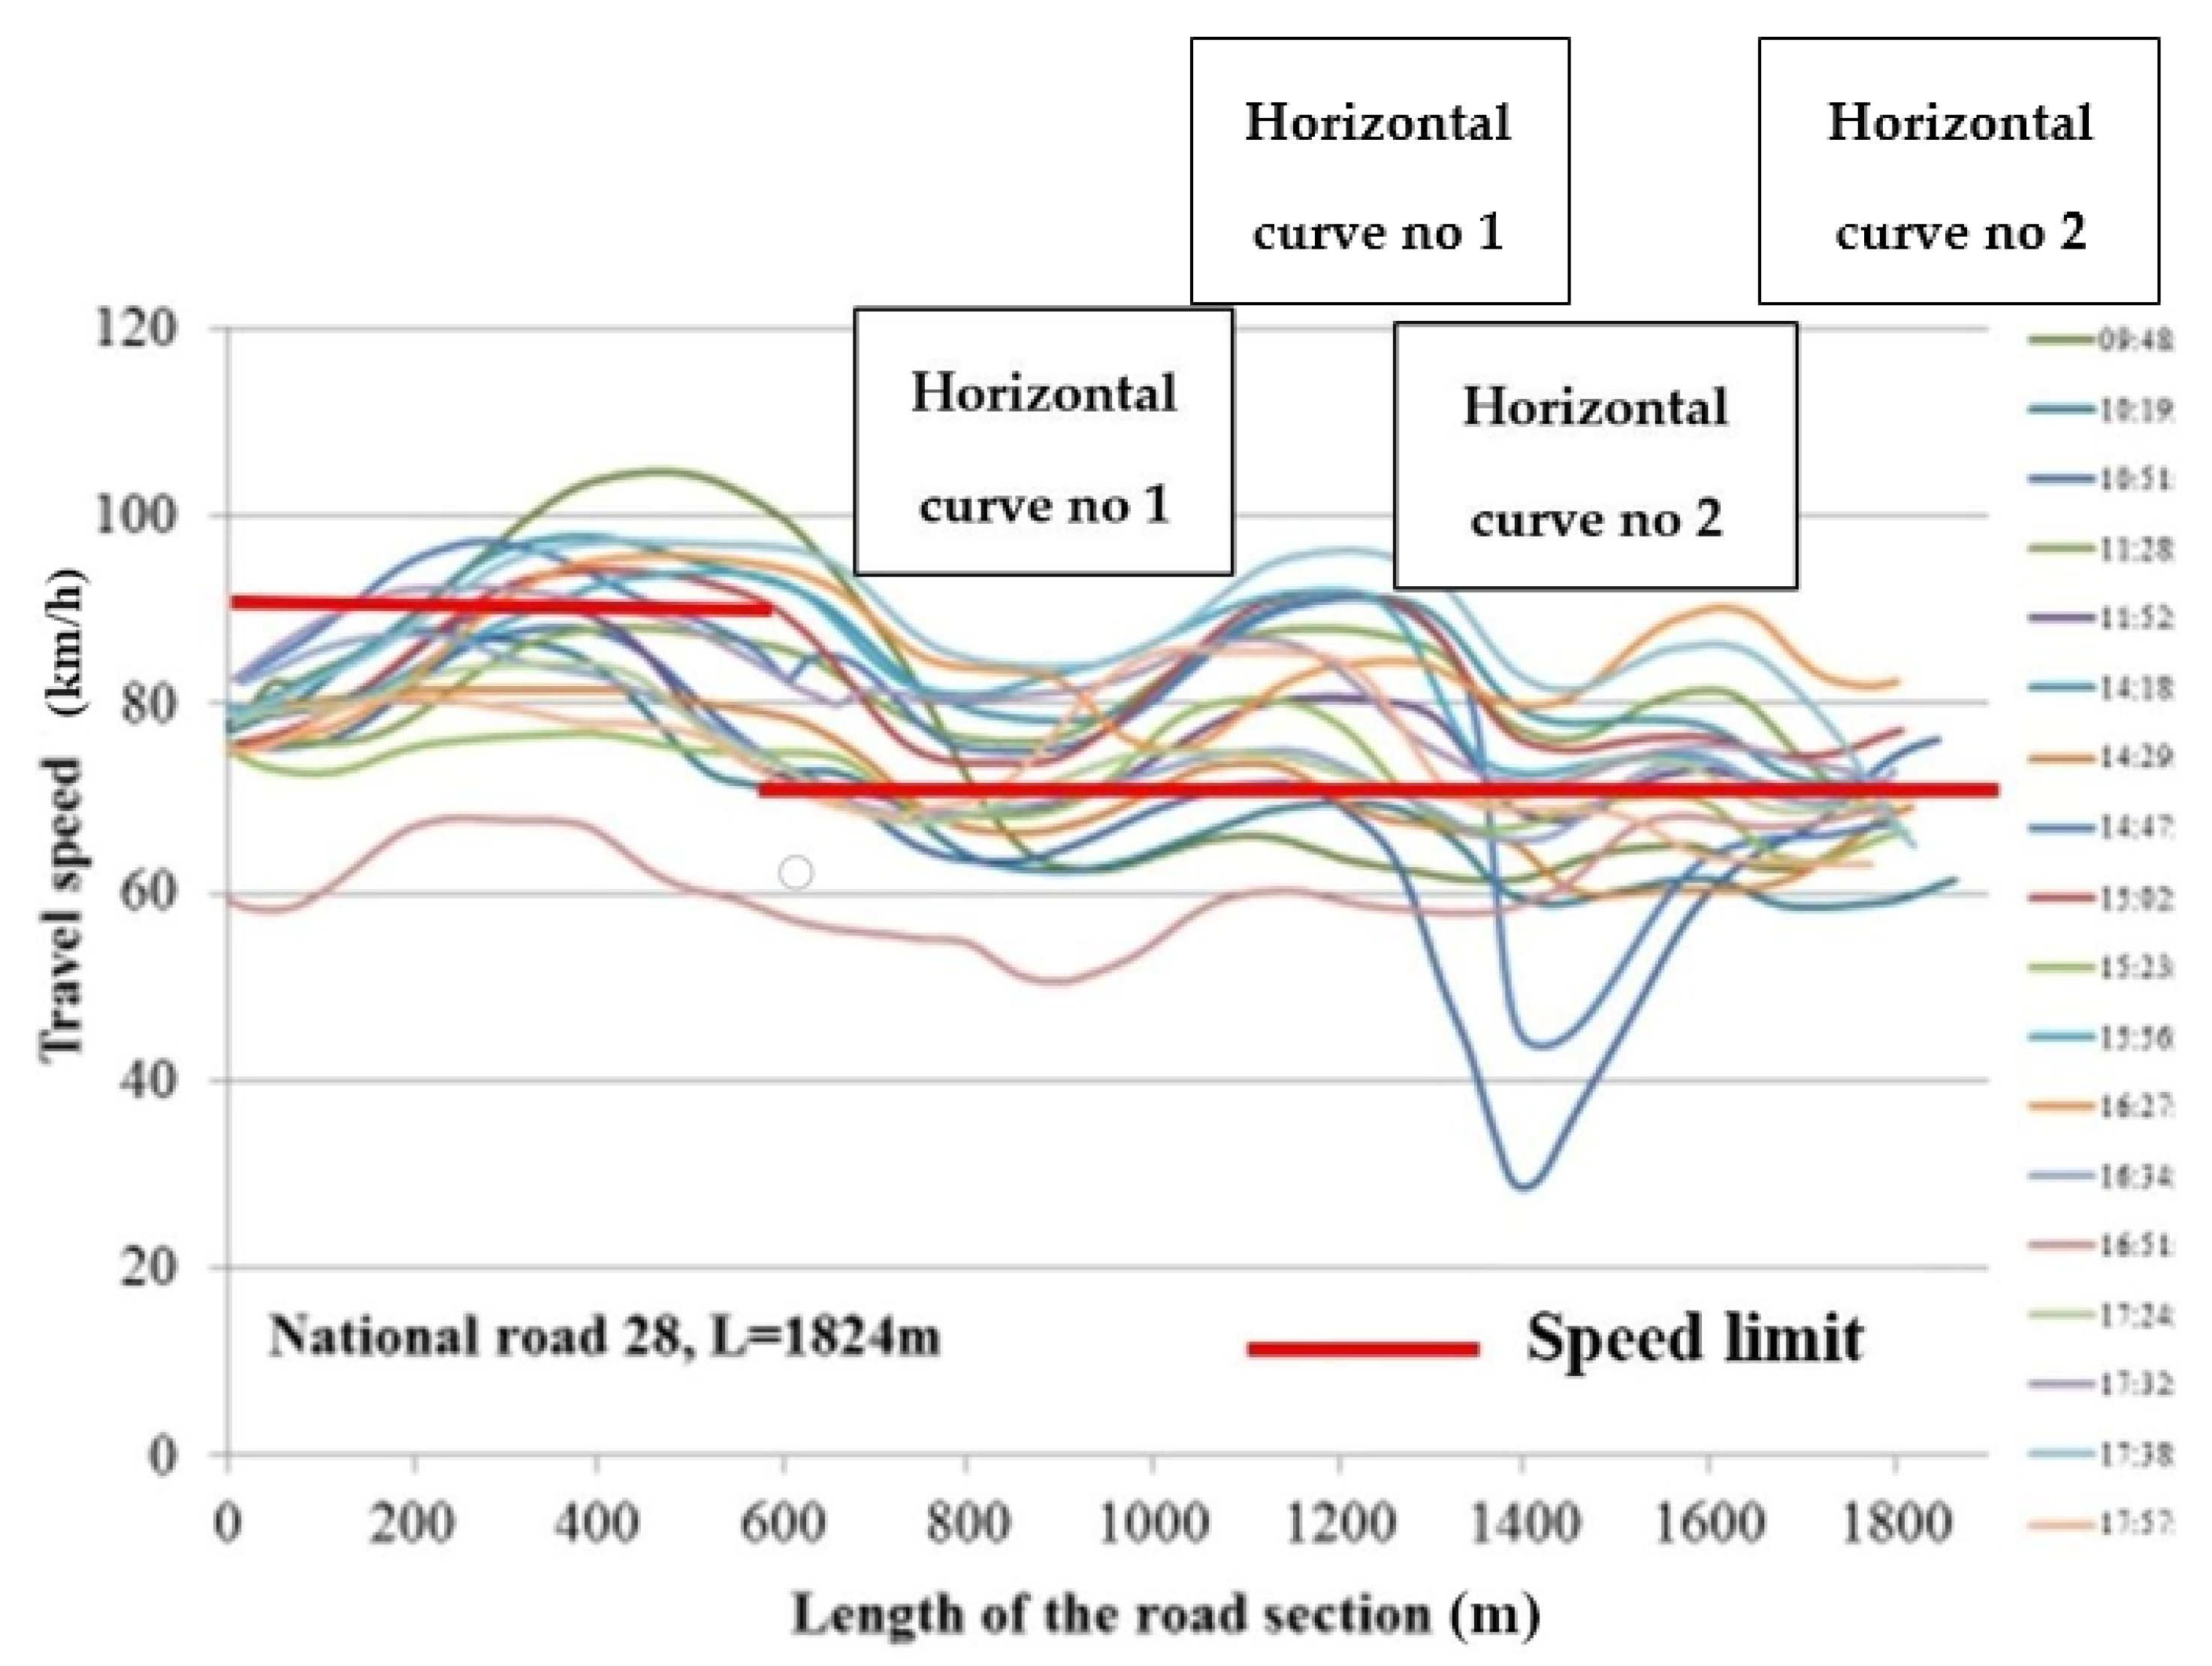
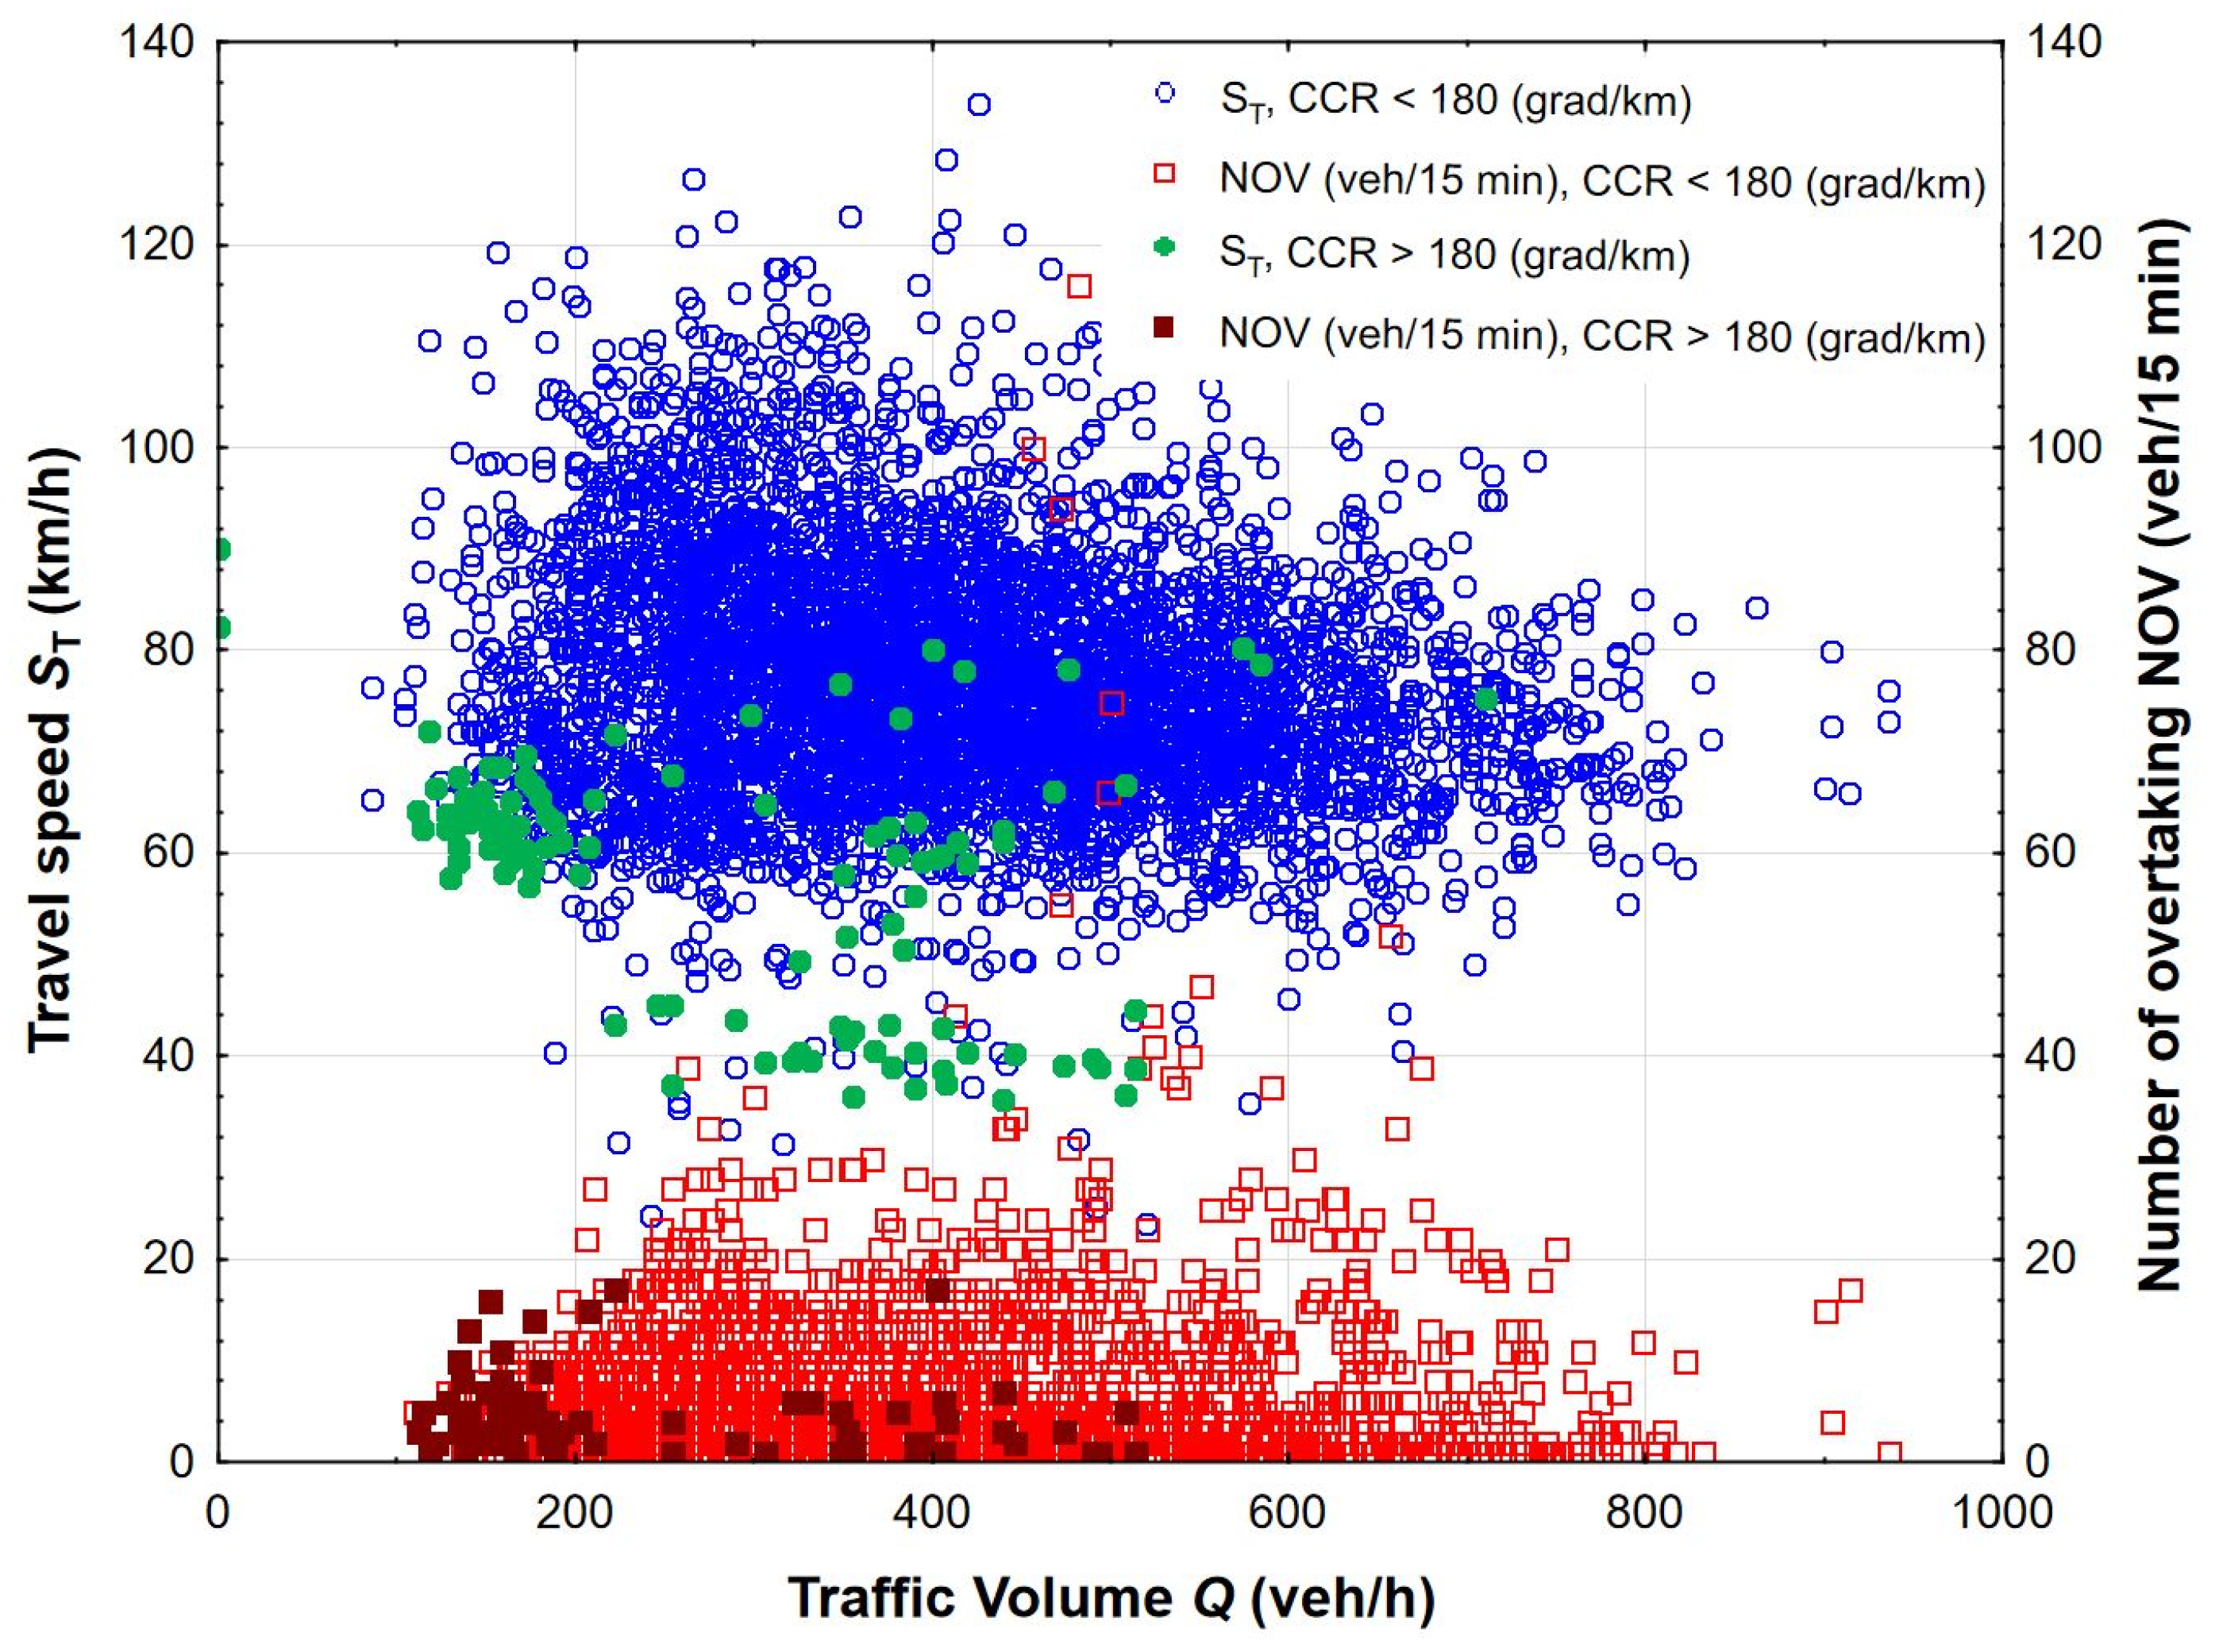
2.2. Travel Speed Research on Two-Lane Highways
3. Results and Discussion
3.1. Functional Reliability of Two-Lane Highways
3.2. Scenario Analysis and Reliability Measures of Two-Lane Highways
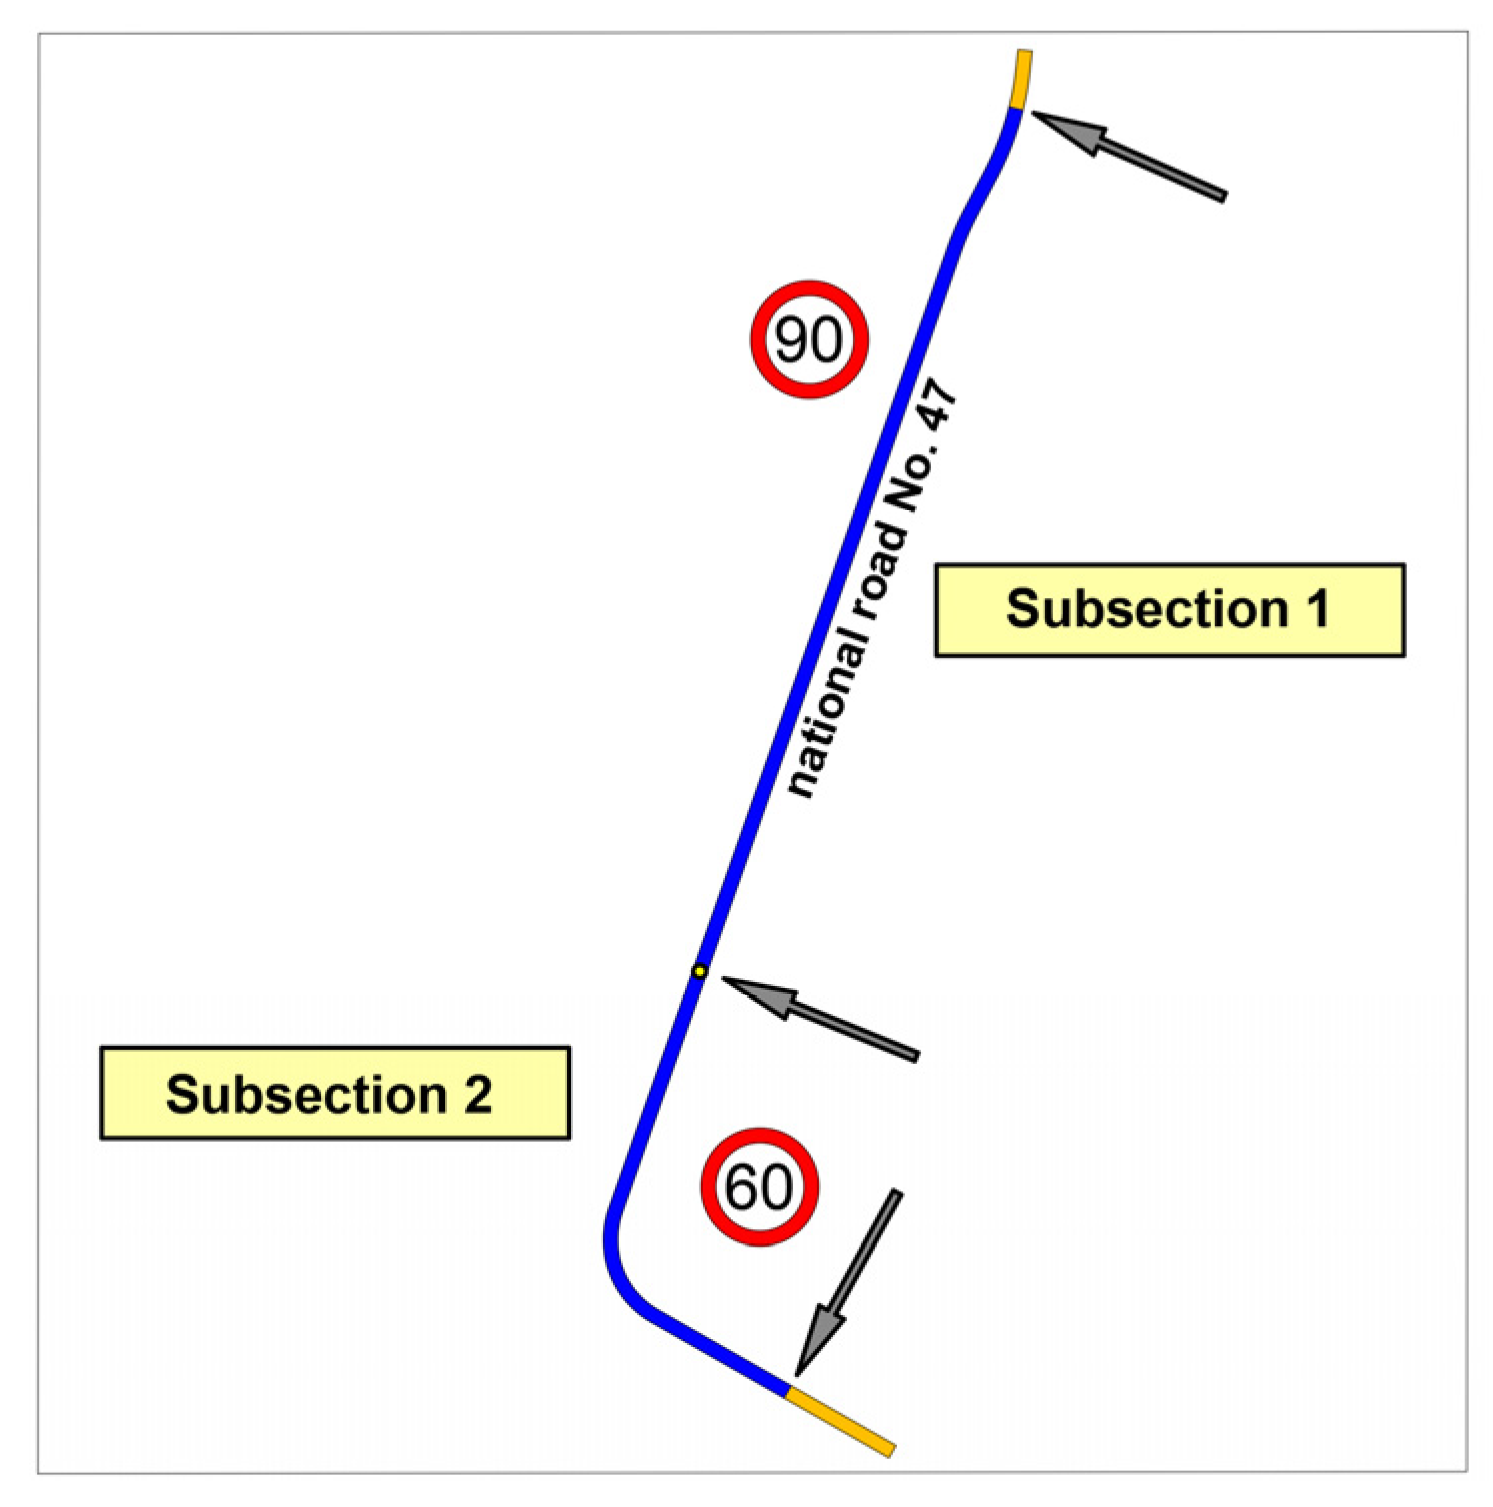
3.3. Sample Reliability Analysis for a Selected Road Section
4. Conclusions
Author Contributions
Funding
Institutional Review Board Statement
Informed Consent Statement
Data Availability Statement
Conflicts of Interest
References
- Hou, X.; Wang, Y.; Zhang, P.; Qin, G.; Hou, W. Qin Non-Probabilistic Time-Varying Reliability-Based Analysis of Corroded Pipelines Considering the Interaction of Multiple Uncertainty Variables. Energies 2019, 12, 1965. [Google Scholar] [CrossRef]
- Teslyuk, V.; Sydor, A.; Karovič, V.; Pavliuk, O.; Kazymyra, I. Modelling Reliability Characteristics of Technical Equipment of Local Area Computer Networks. Electronics 2021, 10, 955. [Google Scholar] [CrossRef]
- Coudray, R.; Mattei, J. System reliability: An example of nuclear reactor system analysis. Reliab. Eng. 1984, 7, 89–121. [Google Scholar] [CrossRef]
- Petkevičius, K.; Maskeliūnaitė, L.; Sivilevičius, H. Determining travel conditions on motorways for automobile trasport based on the case study for Lithuanian highways. Transport 2019, 34, 89–102. [Google Scholar] [CrossRef]
- Nicholson, A. Travel time reliability benefits: Allowing for correlation. Res. Transp. Econ. 2015, 49, 14–21. [Google Scholar] [CrossRef]
- Ji, X.-F.; Wu, Y.-X.; Yuan, H.-Z.; Yang, W.-C.; Hu, C.-Y.; Lu, H. Influences of Traffic Flow Characteristics on Accident Severity on Secondary Roads. Zhongguo Gonglu Xuebao/China J. Highw. Transp. 2020, 33, 135–145. [Google Scholar]
- Sun, J.; Sun, J. Proactive assessment of real-time traffic flow accident risk on urban expressway. Tongji Daxue Xuebao/J. Tongji Univ. 2014, 42, 873–879. [Google Scholar]
- Kustra, W.; Żukowska, J.; Budzyński, M.; Jamroz, K. Injury Prediction Models for Onshore Road Network Development. Pol. Marit. Res. 2019, 26, 93–103. [Google Scholar] [CrossRef]
- Ambros, J.; Jurewicz, C.; Chevalier, A.; Valentová, V. Speed-Related Surrogate Measures of Road Safety Based on Floating Car Data. Inventive Comput. Inf. Technol. 2021, 207, 129–144. [Google Scholar] [CrossRef]
- Lyman, K.; Bertini, R.L. Using Travel Time Reliability Measures to Improve Regional Transportation Planning and Operations. Transp. Res. Rec. J. Transp. Res. Board 2008, 2046, 1–10. [Google Scholar] [CrossRef]
- Meyer, M.D. Transportation Planning Handbook: Institute of Transportation Engineers; John Wiley & Sons, Inc.: Hoboken, NJ, USA, 2016. [Google Scholar]
- Brilon, W.; Geistefeldt, J.; Zurlinden, H. Implementing the Concept of Reliability for Highway Capacity Analysis. Transp. Res. Rec. J. Transp. Res. Board 2007, 2027, 1–8. [Google Scholar] [CrossRef]
- Bhouri, N.; Aron, M.; Scemama, G. Travel time reliability with and without the dynamic use of hard shoulder: Field assessment from a French motorway. J. Traffic Transp. Eng. Engl. Ed. 2016, 3, 520–530. [Google Scholar] [CrossRef][Green Version]
- Olszewski, P.; Dybicz, T.; Jamroz, K.; Kustra, W.; Romanowska, A. Assessing Highway Travel Time Reliability using Probe Vehicle Data. Transp. Res. Rec. J. Transp. Res. Board 2018, 2672, 118–130. [Google Scholar] [CrossRef]
- Romanowska, A.; Jamroz, K.; Olszewski, P. Review of methods for assessing traffic conditions on basic motorway and expressway sections. Arch. Transp. 2019, 52, 7–25. [Google Scholar] [CrossRef]
- Mehran, B.; Nakamura, H. Implementing Travel Time Reliability for Evaluation of Congestion Relief Schemes on Expressways. Transp. Res. Rec. J. Transp. Res. Board 2009, 2124, 137–147. [Google Scholar] [CrossRef]
- Farrag, S.G.; El-Hansali, M.Y.; Yasar, A.-U.-H.; Shakshuki, E.M.; Malik, H. A microsimulation-based analysis for driving behaviour modelling on a congested expressway. J. Ambient. Intell. Humaniz. Comput. 2020, 11, 5857–5874. [Google Scholar] [CrossRef]
- Adachi, T.; Ishida, T.; Yaginuma, H.; Asakura, Y. Empirical analysis for the effects of a new expressway section on travel time reliability and drivers route choice. In Proceedings of the 5th International Symposium on Transportation Network Reliability, Hong Kong, 18–19 December 2012. [Google Scholar]
- Tay, A.C.; Lee, H.F.; Zheng, Y. Traffic Assessment for Completion of Road Upgrading from Secondary Road to Dual Carriageway. IOP Conf. Ser. Mater. Sci. Eng. 2019, 495, 012098. [Google Scholar] [CrossRef]
- Varsha, V.; Pandey, G.H.; Rao, K.R.; Bindhu, B. Determination of Sample Size for Speed Measurement on Urban Arterials. Transp. Res. Procedia 2016, 17, 384–390. [Google Scholar] [CrossRef]
- Oskarbski, J.; Kamiński, T.; Kyamakya, K.; Chedjou, J.C.; Żarski, K.; Pędzierska, M. Assessment of the Speed Management Impact on Road Traffic Safety on the Sections of Motorways and Expressways Using Simulation Methods. Sensors 2020, 20, 5057. [Google Scholar] [CrossRef]
- Cafiso, S.; D’Agostino, C.; Kiec, M.; Pogodzinska, S. Application of an Intelligent Transportation System in a Travel Time Information System: Safety Assessment and Management. Transp. Res. Rec. J. Transp. Res. Board 2017, 2635, 46–54. [Google Scholar] [CrossRef]
- Kattan, L.; de Barros, A.G.; Saleemi, H. Travel behavior changes and responses to advanced traveler information in prolonged and large-scale network disruptions: A case study of west LRT line construction in the city of Calgary. Transp. Res. Part F Traffic Psychol. Behav. 2013, 21, 90–102. [Google Scholar] [CrossRef]
- Vivek. A new model to evaluate percent-time-spent-following on two-lane highways. Lect. Notes Civ. Eng. 2020, 45, 377–387. [Google Scholar]
- Raj, P.; Sivagnanasundaram, K.; Asaithambi, G.; Shankar, A.U.R. Review of Methods for Estimation of Passenger Car Unit Values of Vehicles. J. Transp. Eng. Part A Syst. 2019, 145, 04019019. [Google Scholar] [CrossRef]
- Pompigna, A.; Rupi, F. Lane-Distribution Models and Related Effects on the Capacity for a Three-Lane Freeway Section: Case Study in Italy. J. Transp. Eng. Part A Syst. 2017, 143, 05017010. [Google Scholar] [CrossRef]
- Harwood, D.W.; Bauer, K.M.; Potts, I.B. Development of Relationships between Safety and Congestion for Urban Freeways. Transp. Res. Rec. J. Transp. Res. Board 2013, 2398, 28–36. [Google Scholar] [CrossRef]
- Biswas, S.; Chakraborty, S.; Chandra, S.; Ghosh, I. Kriging-Based Approach for Estimation of Vehicular Speed and Passenger Car Units on an Urban Arterial. J. Transp. Eng. Part A Syst. 2017, 143, 04016013. [Google Scholar] [CrossRef]
- Ma, Y.; Gu, X.; Lee, J.; Xiang, Q. Investigating the Affecting Factors of Speed Dispersion for Suburban Arterial Highways in Nanjing, China. J. Adv. Transp. 2019, 2019, 1–11. [Google Scholar] [CrossRef]
- Lowe, W.U.A.; Mendis, H.S.A.; Sathyaprasad, I.M.S. A Comparative Study of Speed and Flow Measurements Methods as Applied to Four Lane Dual Carriageway Roads. Proc. EECE 2020 2019, 44, 211–223. [Google Scholar] [CrossRef]
- Guerrieri, M.; Parla, G.; Mauro, R. Traffic Flow Variables Estimation: An Automated Procedure Based on Moving Observer Method. Potential Application for Autonomous Vehicles. Transp. Telecommun. J. 2019, 20, 205–214. [Google Scholar] [CrossRef]
- Olia, A.; AbdelGawad, H.; Abdulhai, B.; Razavi, S.N. Optimizing the Number and Locations of Freeway Roadside Equipment Units for Travel Time Estimation in a Connected Vehicle Environment. J. Intell. Transp. Syst. 2017, 21, 296–309. [Google Scholar] [CrossRef]
- Pamula, T. Road Traffic Conditions Classification Based on Multilevel Filtering of Image Content Using Convolutional Neural Networks. IEEE Intell. Transp. Syst. Mag. 2018, 10, 11–21. [Google Scholar] [CrossRef]
- Gong, Y.; Abdel-Aty, M.; Park, J. Evaluation and augmentation of traffic data including Bluetooth detection system on arterials. J. Intell. Transp. Syst. 2019, 1–13. [Google Scholar] [CrossRef]
- Hoseinzadeh, N.; Liu, Y.; Han, L.D.; Brakewood, C.; Mohammadnazar, A. Quality of location-based crowdsourced speed data on surface streets: A case study of Waze and Bluetooth speed data in Sevierville, TN. Comput. Environ. Urban Syst. 2020, 83, 101518. [Google Scholar] [CrossRef]
- Villiers, C.; Nguyen, L.D.; Zalewski, J. Evaluation of traffic management strategies for special events using probe data. Transp. Res. Interdiscip. Perspect. 2019, 2, 100052. [Google Scholar] [CrossRef]
- Hu, H.; Lu, Z.; Wang, Q.; Zheng, C. End-to-End Automated Lane-Change Maneuvering Considering Driving Style Using a Deep Deterministic Policy Gradient Algorithm. Sensors 2020, 20, 5443. [Google Scholar] [CrossRef] [PubMed]
- Ural, S.; Shan, J.; Romero, M.A.; Tarko, A. Road and roadside feature extraction using imagery and lidar data for transportation operation. ISPRS Ann. Photogramm. Remote. Sens. Spat. Inf. Sci. 2015, II-3/W4, 239–246. [Google Scholar] [CrossRef]
- Soni, R.; Vasudevan, V.; Dutta, B. Analysis of overtaking patterns of Indian drivers with data collected using a LiDAR. Transp. Res. Part F Traffic Psychol. Behav. 2020, 74, 139–150. [Google Scholar] [CrossRef]
- Baskov, V.; Ignatov, A.; Gamayunov, P.; Igitov, S. Influence of elements of the “driver-car-road-environment” system on emergence of the transport jam. ARPN J. Eng. Appl. Sci. 2019, 14, 1093–1099. [Google Scholar]
- Ali, E.K.; Hashim, I.H.; Shwaly, S.A.; Zidan, Z.M.; El-Badawy, S.M. Risk assessment of horizontal curves using reliability analysis based on Google traffic data. Innov. Infrastruct. Solut. 2021, 6, 1–13. [Google Scholar] [CrossRef]
- Liu, T. Selpi Comparison of Car-Following Behavior in Terms of Safety Indicators between China and Sweden. IEEE Trans. Intell. Transp. Syst. 2020, 21, 3696–3705. [Google Scholar] [CrossRef]
- Ostrowski, K.; Dybicz, T.; Kustra, W.; Olszewski, P.; Chodur, J.; Jamroz, K. Modern methods of calculating the road capacity and assessment of traffic conditions of roads outside municipal agglomerations, including express roads. In Project RID-I-50. GDDKiA and NCBiR; Cracow, Warsaw; Gdansk, Poland; 2019; Available online: https://nauka.pk.edu.pl/index.php?option=com_content&task=view&id=32&Itemid=39&pokaz=projekt&id_pr=1196 (accessed on 8 June 2021).
- Transportation Research Record. TRB Highway Capacity Manual. In A Guide for Multimodal Mobility Analysis, 6th ed.; The National Academies of Sciences, Engineering, and Medicine: Washington, DC, USA, 2016. [Google Scholar]
- Baier, M.W.; Brilon, G.; Hartkopf, K.; Lemke, R.; Maier, M.S. HBS2015 Handbuch für die Bemessung von Straßenverkehrsanlagen, Forschungsgesellschaft für Straßen und Verkehrswesen; FGSV: Köln, Germany, 2015. [Google Scholar]
- HNTB Corporation; Strategic Highway Research Program Reliability Focus Area. Transportation Research Board Analytical Procedures for Determining the Impacts of Reliability Mitigation Strategies. Anal. Proced. Determ. Impacts Reliab. Mitig. Strateg. 2012. [Google Scholar] [CrossRef]
- Associates, I.K. Strategic Highway Research Program Reliability Focus Area; Transportation Research Board Evaluating Alternative Operations Strategies to Improve Travel Time Reliability. Eval. Altern. Oper. Strateg. Improv. Travel Time Reliab. 2013. [Google Scholar] [CrossRef]
- OECD. Improving Rellabillty on Surface Transport Networks; OECD: Paris, France, 2010. [Google Scholar]
- Lin, Y.; Niu, J. Effect of Curvature Change Rate of Highway Horizontal Curve in the Path of a Vehicle. ICTIS 2011 2011, 904–912. [Google Scholar] [CrossRef]
- Sil, G.; Nama, S.; Maji, A.; Maurya, A.K. Effect of horizontal curve geometry on vehicle speed distribution: A four-lane divided highway study. Transp. Lett. 2020, 12, 713–722. [Google Scholar] [CrossRef]
- Russo, F.; Biancardo, S.A.; Busiello, M. Operating speed as a key factor in studying the driver behaviour in a rural context. Transport 2016, 31, 260–270. [Google Scholar] [CrossRef]
- Vorobjovas, V. Assurance of the Function of Low-Volume Roads for the Improvement of Driving Conditions. Balt. J. Road Bridg. Eng. 2011, 6, 67–75. [Google Scholar] [CrossRef]
- Jensen, S.U. Car Drivers’ Experienced Level of Service on Freeways. Transp. Res. Rec. J. Transp. Res. Board 2017, 2615, 132–139. [Google Scholar] [CrossRef]
- Pinna, F. Free flow speed and drivers behavior in Italian arterial roads. Adv. Transp. Stud. 2020, 50, 31–48. [Google Scholar]
- Haseman, R.J.; Wasson, J.S.; Bullock, D. Real-Time Measurement of Travel Time Delay in Work Zones and Evaluation Metrics Using Bluetooth Probe Tracking. Transp. Res. Rec. J. Transp. Res. Board 2010, 2169, 40–53. [Google Scholar] [CrossRef]
- Bharadwaj, N.; Edara, P.; Sun, C.; Brown, H.; Chang, Y. Traffic Flow Modeling of Diverse Work Zone Activities. Transp. Res. Rec. J. Transp. Res. Board 2018, 2672, 23–34. [Google Scholar] [CrossRef]
- Kianfar, J.; Abdoli, S. Deterministic and Stochastic Capacity in Work Zones: Findings from a Long-Term Work Zone. J. Transp. Eng. Part A Syst. 2021, 147, 04020141. [Google Scholar] [CrossRef]
- Jeong, J.P.; Kim, J.; Hwang, T.; Xu, F.; Guo, S.; Gu, Y.J.; Cao, Q.; Liu, M.; He, T. TPD: Travel Prediction-based Data Forwarding for light-traffic vehicular networks. Comput. Netw. 2015, 93, 166–182. [Google Scholar] [CrossRef]
- Khattak, Z.H.; Magalotti, M.J.; Fontaine, M.D. Operational performance evaluation of adaptive traffic control systems: A Bayesian modeling approach using real-world GPS and private sector PROBE data. J. Intell. Transp. Syst. 2019, 24, 156–170. [Google Scholar] [CrossRef]
- Gu, Y.; Wang, Y.; Dong, S. Public Traffic Congestion Estimation Using an Artificial Neural Network. ISPRS Int. J. Geo-Inf. 2020, 9, 152. [Google Scholar] [CrossRef]
- Geistefeldt, J.; Shojaat, S. Comparison of Stochastic Estimates of Capacity and Critical Density for U.S. and German Freeways. Transp. Res. Rec. J. Transp. Res. Board 2019, 2673, 388–396. [Google Scholar] [CrossRef]
- Figliozzi, M.A.; Wheeler, N.; Albright, E.; Walker, L.; Sarkar, S.; Rice, D. Algorithms for Studying the Impact of Travel Time Reliability along Multisegment Trucking Freight Corridors. Transp. Res. Rec. J. Transp. Res. Board 2011, 2224, 26–34. [Google Scholar] [CrossRef]
- Samandar, M.S.; Williams, B.; Ahmed, I. Weigh Station Impact on Truck Travel Time Reliability: Results and Findings from a Field Study and a Simulation Experiment. Transp. Res. Rec. J. Transp. Res. Board 2018, 2672, 120–129. [Google Scholar] [CrossRef]
- Hojati, A.T.; Ferreira, L.; Washington, S.; Charles, P.; Shobeirinejad, A. Reprint of: Modelling the impact of traffic incidents on travel time reliability. Transp. Res. Part C Emerg. Technol. 2016, 70, 86–97. [Google Scholar] [CrossRef]
- Collins, A.; Foytik, P.; Frydenlund, E.; Robinson, R.M.; Jordan, C.A. Generic Incident Model for Investigating Traffic Incident Impacts on Evacuation Times in Large-Scale Emergencies. Transp. Res. Rec. J. Transp. Res. Board 2014, 2459, 11–17. [Google Scholar] [CrossRef]
- Tay, R.; Churchill, A.; De Barros, A.G. Effects of roadside memorials on traffic flow. Accid. Anal. Prev. 2011, 43, 483–486. [Google Scholar] [CrossRef]
- Hazim, N.; Shbeeb, L.; Abu Salem, Z. Impact of Roadside Fixed Objects in Traffic Conditions. Eng. Technol. Appl. Sci. Res. 2020, 10, 5428–5433. [Google Scholar] [CrossRef]
- Zhao, L.; Chien, S.I.-J. Analysis of Weather Impact on Travel Speed and Travel Time Reliability. CICTP 2012 2012, 1145–1155. [Google Scholar] [CrossRef]
- Kim, J.; Mahmassani, H.S.; Dong, J. Likelihood and duration of flow breakdown: Modeling the effect of weather. Transp. Res. Rec. 2010, 2188, 19–28. [Google Scholar] [CrossRef]
- Thakuriah, P.; Tilahun, N. Incorporating Weather Information into Real-Time Speed Estimates: Comparison of Alternative Models. J. Transp. Eng. 2013, 139, 379–389. [Google Scholar] [CrossRef]
- Sumalee, A.; Sumalee, A.; Watling, D.; Lecturer, S. Travel time reliability in a network with dependent link modes and partial driver response. J. East Asia Soc. Transp. Stud. 2003, 5, 1687–1701. [Google Scholar]
- Chodur, J.; Ostrowski, K.; Tracz, M. Variability of Capacity and Traffic Performance at Urban and Rural Signalised Intersections. Transp. Res. Procedia 2016, 15, 87–99. [Google Scholar] [CrossRef]
- Chodur, J.; Ostrowski, K.; Tracz, M. Impact of Saturation Flow Changes on Performance of Traffic Lanes at Signalised Intersections. Procedia Soc. Behav. Sci. 2011, 16, 600–611. [Google Scholar] [CrossRef]
- Ostrowski, K.; Tracz, M. Availability and reliability of a signalised lane. Transp. B Transp. Dyn. 2018, 7, 1044–1061. [Google Scholar] [CrossRef]
- Ostrowski, K.; Chodur, J. The impact of selected road and traffic features on travel speed on two lane highway. Road Rail Infrastruct. V 2018, 5, 1129–1135. [Google Scholar] [CrossRef]
- Haghani, A.; Zhang, Y.; Hamedi, M. Impact of Data Source on Travel Time Reliability Assessment; Grant DTRT12-G-UTC03; Mid-Atlantic Universities Transportation Center: University Park, PA, USA, 2014. [Google Scholar]
- Polus, A. A study of travel time and reliability on arterial routes. Transportation 1979, 8, 141–151. [Google Scholar] [CrossRef]
- Polus, A.; Shofer, J.L. Analytical Study of Freeway Reliability. Transp. Eng. J. ASCE 1976, 102, 857–870. [Google Scholar] [CrossRef]
- Available online: https://www.velaction.com/buffer-time/ (accessed on 6 May 2021).
- FHWA Final Report FHWA-HOP-05-018. Monitoring urban freeways in 2003. In Current Conditions and Trends From Archived Operations Data; Federal Highway Administration Office of Operations: Washington, DA, USA, 2004. [Google Scholar]
- US Department of Transportation Urban Congestion Reports-Operations Performance Measurement-FHWA Office of Operations. Available online: https://ops.fhwa.dot.gov/perf_measurement/ucr/ (accessed on 6 May 2021).
- Transportation Research Board. TRB S2-L05-RR-2. In Guide to Incorporating Reliability Performance Measures into the Transportation Planning and Programming Processes; The National Academies of Sciences, Engineering, and Medicine: Washington, DC, USA, 2014. [Google Scholar]
- Jamroz, K.R.; Krystek, A.; Cielecki, J.; Kempa, T.; Sandecki, J.; Sosin; Szczuraszek, T.; Zieliński, T.; Hoppe, L.M.; Michalski, L.; et al. Polish Guidelines on Rural Roads Capacity Estimation; Gdansk University of Technology: Gdańsk; Poland, 1986. [Google Scholar]
- Available online: https://www.google.pl/maps/dir///@49.7224264,20.6424265,15z/data=!4m2!4m1!3e0!5m1!1e1 (accessed on 6 May 2021).


| Agency | Reliability Metrics Used |
|---|---|
| Georgia Regional Transportation Authority and Georgia DOT | Buffer Index |
| Planning Time Index | |
| Southern California Association of Governments | On-Time Index |
| Buffer Index | |
| Washington State DOT | 95th Percentile Travel Time |
| National Transportation Operations Colation (NTOC) | Buffer Index |
| Maryland SHA | Travel Time Index |
| Planning Time Index |
| Reliability Performance | PTI (–) |
|---|---|
| good | ≤1.3 |
| fair | 1.3 ÷ 2.0 |
| poor | >2.0 |
| Road Design Parameter | Range of Parameters |
|---|---|
| Design speed Sd (km/h) | 40–100, road serpentine 15–30 |
| Speed limit SSL (km/h) | 40–90 |
| Technical class of road | Z–S |
| Horizontal curve radius RH (m) | 30–3200 |
| Vertical curve radius RV (m) | not specified |
| Type of cross-section | 1 × 2; 2 + 1 |
| Lane width s (m) | 3.0–3.5 |
| Hard shoulder width sup (m) | 0–1.5 |
| Average weighted longitudinal slope i (m) | 0.1–9.0 |
| Length of measured section L (m) | 400–3900 |
| Curvature change rate CCR (g/km) | 0–630 |
| Percentage of sections where overtaking is possible pw (%) | 0–100 |
| Access—point density Ap (Ap/km) | 0–42 |
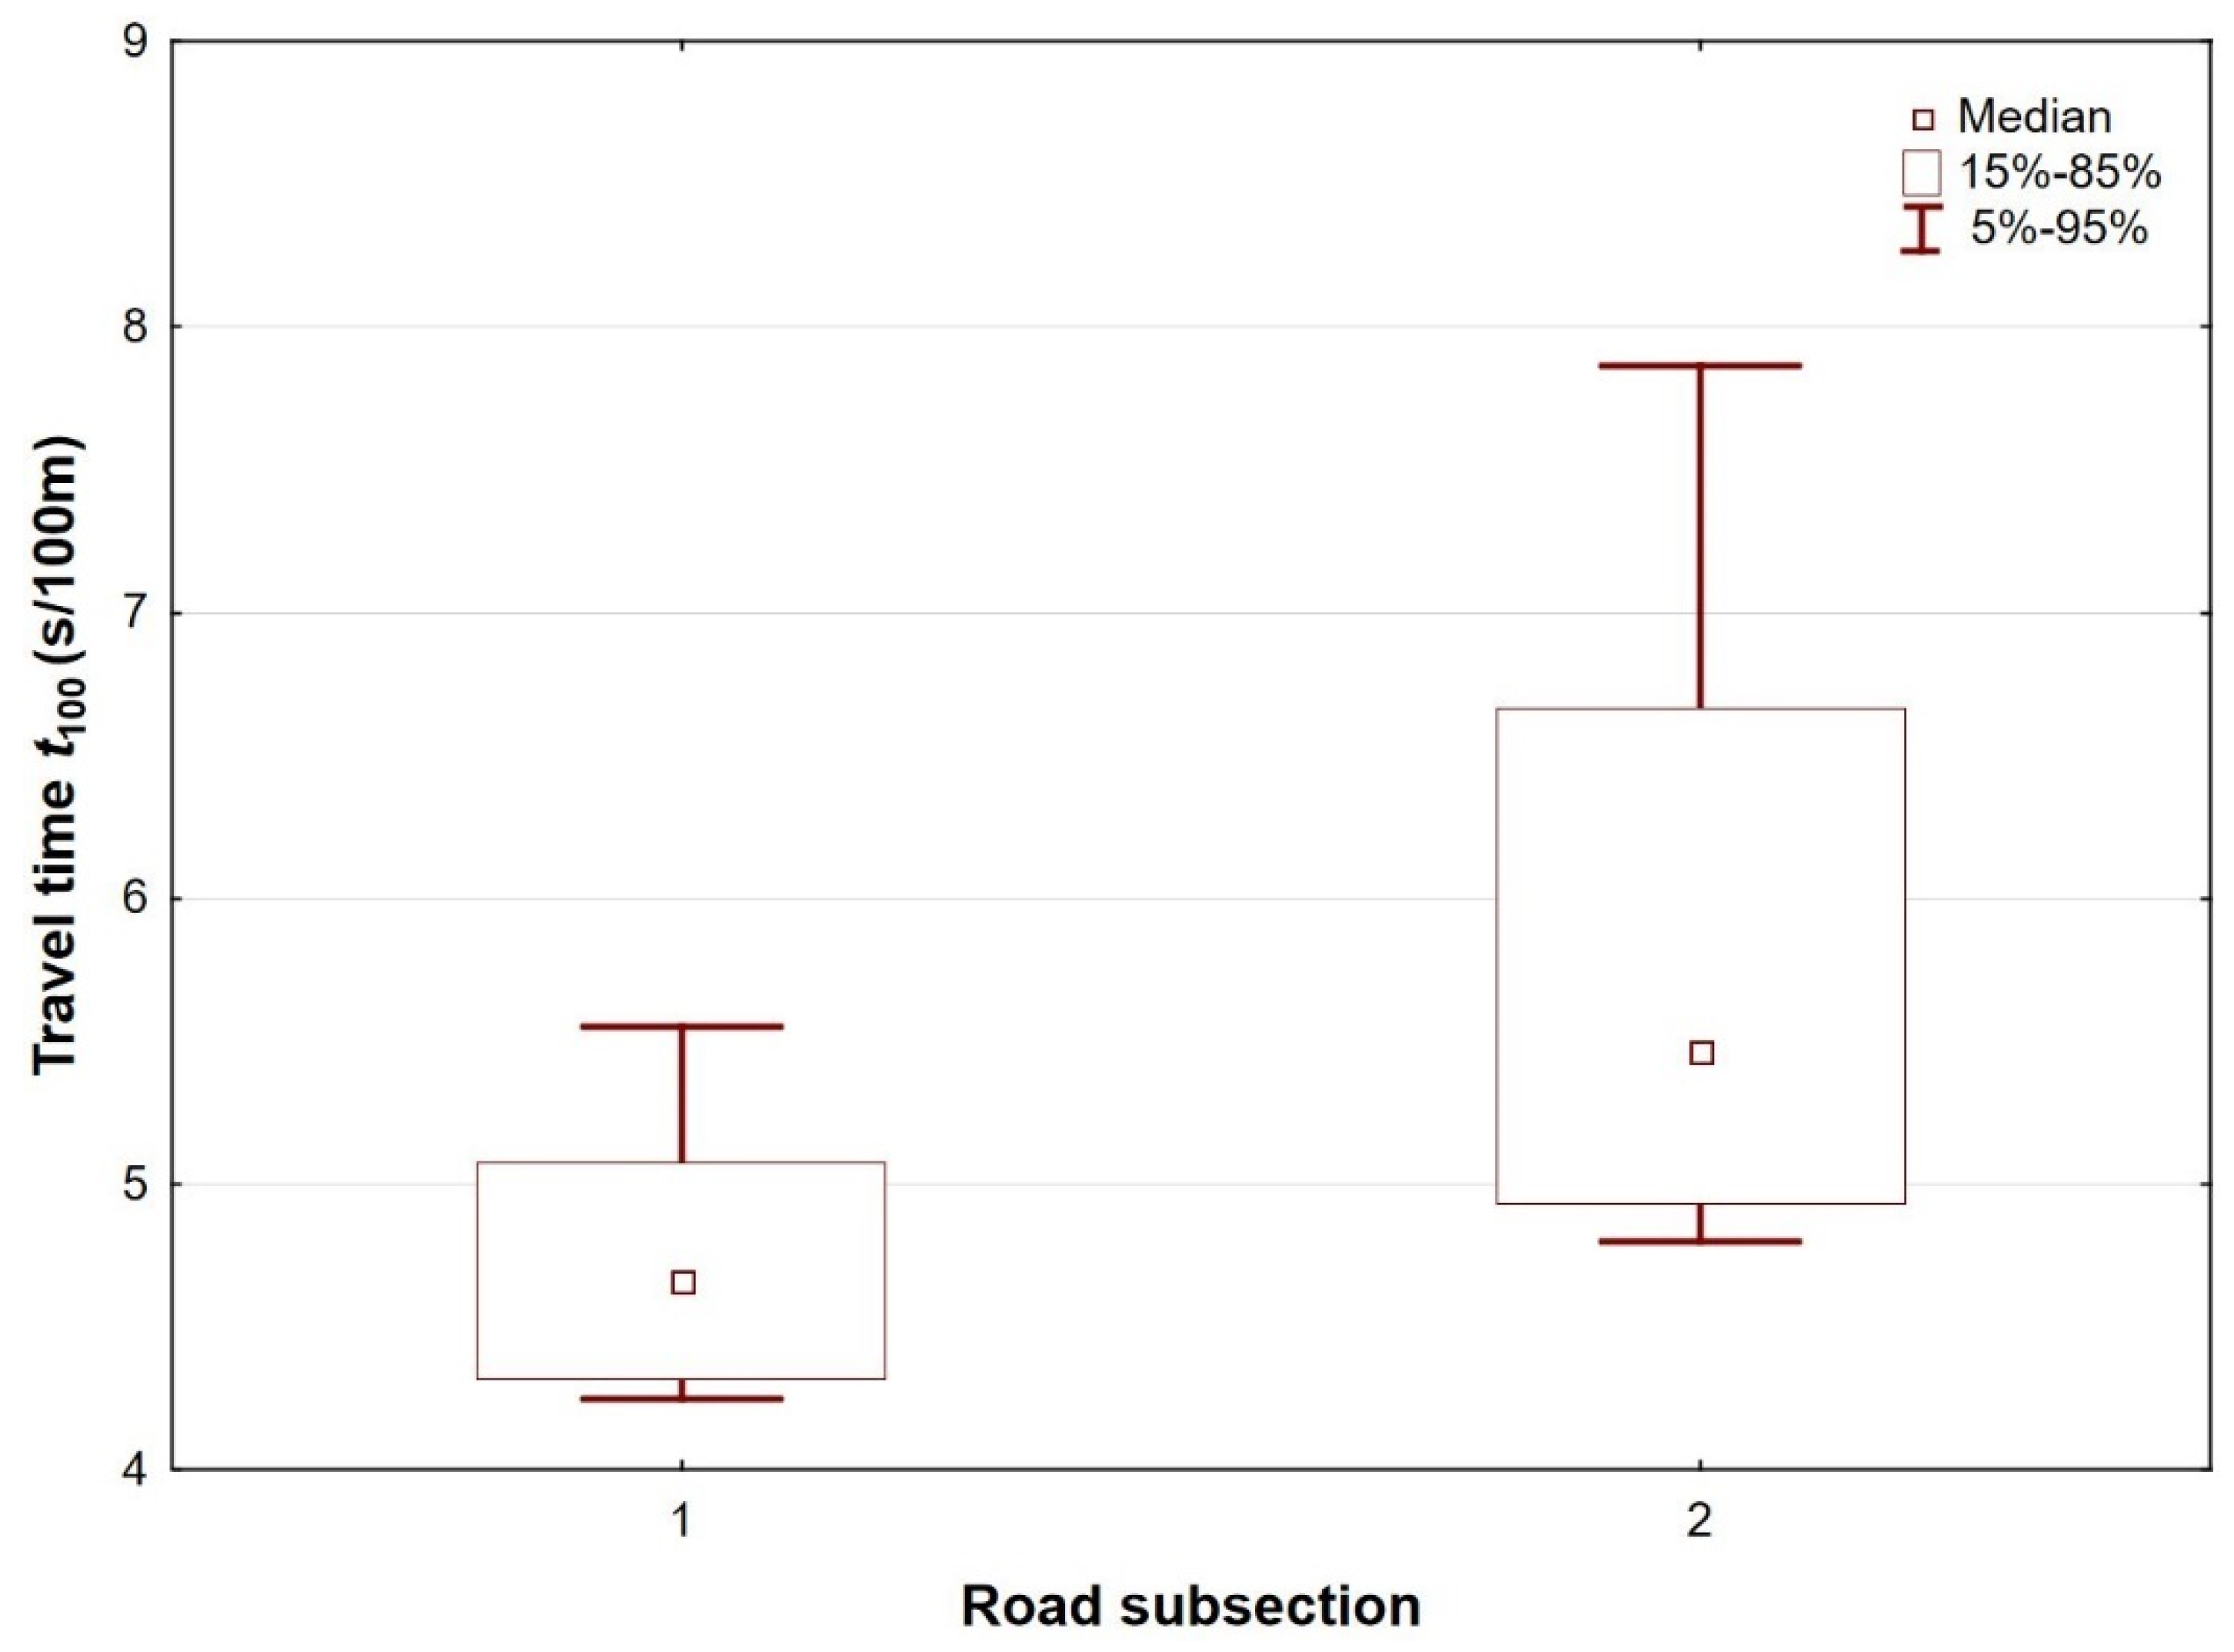
| Variable | Subsection | Sample Size | Average | Median | Min | Max | Percentile 5% | Percentile 95% | Standard Deviation | Coefficient of Variation |
|---|---|---|---|---|---|---|---|---|---|---|
| t100 (s/100 m) | 1 | 1090 | 4.7 | 4.7 | 4.0 | 11.0 | 4.2 | 5.6 | 0.61 | 12.9 |
| t (s) | 1 | 1090 | 69.2 | 68.0 | 58.0 | 160.0 | 62.0 | 81.0 | 8.96 | 12.9 |
| t100 (s/100 m) | 2 | 1090 | 6.0 | 5.5 | 4.4 | 35.0 | 4.8 | 7.9 | 2.1 | 35.2 |
| t (s) | 2 | 1090 | 44.8 | 41.0 | 33.0 | 264.0 | 36.0 | 59.0 | 15.8 | 35.2 |
| Subsection | t95 (s) | t0 (s) | PTI (Equation (9)) | tSL (s) | PTISL (Equation (13)) |
|---|---|---|---|---|---|
| 1 | 81.0 | 50.0 | 1.62 | 58.4 | 1.39 |
| 2 | 59.0 | 36.0 | 1.64 | 45.0 | 1.31 |
Publisher’s Note: MDPI stays neutral with regard to jurisdictional claims in published maps and institutional affiliations. |
© 2021 by the authors. Licensee MDPI, Basel, Switzerland. This article is an open access article distributed under the terms and conditions of the Creative Commons Attribution (CC BY) license (https://creativecommons.org/licenses/by/4.0/).
Share and Cite
Ostrowski, K.; Budzynski, M. Measures of Functional Reliability of Two-Lane Highways. Energies 2021, 14, 4577. https://doi.org/10.3390/en14154577
Ostrowski K, Budzynski M. Measures of Functional Reliability of Two-Lane Highways. Energies. 2021; 14(15):4577. https://doi.org/10.3390/en14154577
Chicago/Turabian StyleOstrowski, Krzysztof, and Marcin Budzynski. 2021. "Measures of Functional Reliability of Two-Lane Highways" Energies 14, no. 15: 4577. https://doi.org/10.3390/en14154577
APA StyleOstrowski, K., & Budzynski, M. (2021). Measures of Functional Reliability of Two-Lane Highways. Energies, 14(15), 4577. https://doi.org/10.3390/en14154577