Abstract
Lateral support systems in vehicles have a high potential for reduction of lane departure crashes. To profit from their full potential, such systems should function properly in adverse conditions. Literature indicates that their accuracy varies between day and night-time. However, detailed quantifications of the systems’ performance in these conditions are rare. The aim of this study is to investigate the differences in detection quality and view range of Mobileye 630 in dry daytime and night-time conditions. On-road tests on four rural road sections in Croatia were conducted. Wilcoxon signed-rank test was used to test the difference between the number of quality rankings while absolute average, average difference and standard deviation were used to analyse the view range. Also, a paired samples t-test was used to test the difference between conditions for each line on each road. The overall results confirm that a significant difference in lane detection quality view range exists between tested conditions. “Medium” and “high” detection confidence (quality level 3 and 2), increased by 5% and 8% during night-time compared to daytime while level 0 (“nothing detected”) decreased by 12%. The view range increased (almost 16% for middle line) during daytime compared to night-time. The findings of this study expand the existing knowledge and are valuable for research and development of machine-vision systems but also for road authorities to optimize the markings’ quality performance.
1. Introduction
Lane departure crashes are one of the most common types of road accidents. In the US alone, 51% of all fatal accidents are caused by lane departure, i.e., a vehicle crossing the edge or the centre line [1]. There is a variety of contributing factors involving the driver, the vehicle, the road and its surroundings (the environment) but it is proven that rural roads with low traffic volume and density are more likely to contribute to road departure accidents [2]. This is mainly due to higher travelling speed, distracted driving and/or fatigue. Different safety measures have shown positive results in decreasing lane departure accidents [3,4,5], yet the overall problem still exists.
A potentially promising solution to the aforementioned problem lies in automated driving and Advanced Driver Assistance Systems (ADAS), which perceive the static and the dynamic content of the environment around the vehicle and thus assist the human driver in driving. An important task during environment perception is lane detection needed for Lateral Support Systems (LSS), which comprise of lane departure warning and/or lane keeping assistance. The main purpose of LSS is to prevent road accidents caused by road departure or entrance in the lane of other vehicles. Due to high fatality rate in such accidents, the use of different LSS could significantly improve the overall road safety [6,7,8,9].
In literature, two main technologies for LSS are reported: LIDARs (Light Detection and Ranging) and vision-based cameras. The main advantage of LIDAR is the fact that it uses an active light source and thus does not rely on the variabilities associated with external/natural lighting as do regular vision-based cameras [10]. However, LIDAR technology is usually used for adaptive cruise control, while lane detection is only partially feasible and mainly used in expensive demonstrator vehicles for highly automated driving [11]. Therefore, current market-ready systems use passive vision-based cameras and image processing to collect and analyse the data from roads [12]. In general, camera-based lane detection starts from image pre-processing which includes different corrections of the collected image (such as exposure correction and shadow removal) and feature extraction. This is then followed by feature detection and model fitting, and then time integration to keep temporal and position consistency [13].
The proper function of LSS depends on several factors [11,14,15]: the quality of the camera (focal distance and camera velocity), condition, colour, width and visibility of lane markings (daytime visibility, night-time visibility—retroreflection and contrast to pavement), lane marking configuration (full/dashed, length of dashed lines), driving speed, weather conditions, general visibility of the environment, sun direction, pavement characteristics (type, condition and texture), geometry of the road, type of road edge (structured/unstructured) and combinations of the above factors.
Several studies have investigated how lane markings’ characteristics affect the accuracy of lane detection under different conditions. One of the first such studies was conducted in Sweden in 2010 with the aim of testing various types of lane markings (flat/profiled, new/existing) under different weather and lighting conditions [16]. The study concluded that in dry daytime conditions, the luminance coefficient must be at least 5 mcd/lx/m2 higher than the road surface and that it should be at least 85 mcd/lx/m2. Furthermore, the study also found that roads wider than seven meters need to have a centre line in order for LSS to become active. Finally, the study highlighted the importance of increased visibility of lane markings in wet and rainy conditions. In 2016, a research was conducted with the aim of identifying the effects of lane markings’ characteristics (width, colour and retroreflectivity) on the performance of a machine-vision system [17]. The study concluded that the view range of the investigated machine-vision (Mobileye) is between 6–18 m in front of the vehicle and that, at night-time, the retroreflectivity of lane markings affected the reading quality. Namely, lane markings with higher retroreflectivity increased the reading level and confidence. Also, wider lane markings (15 cm width) were read better when compared with narrower markings (10 cm width), regardless of stripe colour. Similar results were obtained in a 2017 study [18]. The results indicated that the machine-vision (Mobileye) detection of lane markings generally increased with the increase of retroreflection and contrast ratio. However, the authors highlighted that factors such as light bloom from a low-angled sunlight or visual occlusion from rain, snow, or fog may also influence the detection and readability of machine-vision. Furthermore, such systems generally detect markings with the minimal retroreflectivity of 100 mcd/lx/m2 but do not necessarily provide the strongest detection. An extensive study, which consisted of interviews of stakeholders and on-road and off-road testing, was conducted in Australia in order to determine the implications of road markings for machine vision [11]. Testing scenarios included several test cases which included the impact of different road markings’ characteristics (daytime dry luminance coefficient—Qd, daytime dry contrast ratio, day wet contrast ratio, night dry retroreflectivity—RL, night dry contrast ratio, night wet (recovery) retroreflectivity—RL, night wet contrast ratio width, marking width), different complex situations (such as road markings’ perceptual measures), non-marked edge line, road curvation etc. The authors used several vehicles and a Mobileye camera to test lane detection depending on different scenarios. Based on data analysis, it was concluded that machine-vision detection of solid lines is “better” when compared to dashed lines with same characteristics (equal width, brightness and maintenance). Weather conditions also impacted machine-vision readings differently. Namely, minimal ambient lighting (such as streetlights or low-angled sunlight) may improve the contrast ratio due to reduced specular diffusion and, thus improve line detection. On the other hand, with excessive ambient lighting, machine-vision systems can suffer from ‘light bloom’. Furthermore, the contrast ratio for night-time visibility of between 5-to-1 and 10-to-1 between lane markings and the surrounding substrate is needed for proper functioning of the machine-vision system. Also, lane detection during the day was generally less effective than at night-time due to the complexity of visual clutter evident during daylight hours and the fact that retroreflective properties of well-maintained lane markings provide greater contrast during night-time. In addition, the study found that several other factors, such as driving speed, marking width, maintenance practices etc. influence the accuracy of machine-vision.
Most recently, a researcher at the Department of Civil Engineering and Architecture at the University of Catania used Automatic Road Analyzer (ARAN) and Mobileye 6.0 system to investigate how different road factors (road characteristics and conditions) impact the performance of the LSS system [19]. The ARAN was used to obtain measures of road geometric characteristics (cross section, gradients, horizontal and vertical alignment) which were then synchronised with the Mobileye. In addition, the luminance coefficient of the lane marking in diffuse lighting conditions (Qd) was detected with a portable retroreflectometer. Based on the data analysis using a Decision Tree Method, authors concluded that when daytime visibility (Qd) of road markings is lower than 153 mcd/lx/m2, the probability of LSS failing rises to 11.4% for the calibration sample and 14.35% for the validation sample. Also, curved road sections (with R < 141 m) showed a higher percentage of faults than the average 3% in the test conditions. On the other hand, the average driving speed did not result in any significant changes in LSS accuracy. Overall, the results suggest that a Qd higher than 153 mcd/lx/m2 improves the detection of lane markings using a Mobileye lane detection system.
Based on literature findings, one can conclude that the function of LSS is influenced by a number of factors and their interaction. However, it is still largely unknown to what extent each factor influences LSS, precisely due to their high number and their interaction (one factor may significantly influence another one in certain conditions). The aforementioned can be seen from the example of “visibility factor”, i.e., lane detection between daytime and night-time. Several studies indicated that the accuracy of lane detection varies between day and night-time, however it is still largely unknown to what extent these differences go. For this reason, the aim of this study is to conduct on-road tests in order to determine and compare the detection quality and view range of the machine-vision system during dry daytime and night-time conditions. Based on the aforementioned aim and literature review, the hypotheses of the study are as follows:
- -
- A statistically significant difference of detection quality and view range of lane detection system exists between daytime and night-time conditions;
- -
- Detection quality of lane markings is “better” during night-time compared to daytime;
- -
- View range of the machine-vision system will be longer during daytime compared to night-time.
The results of the study are important for two reasons. First, they provide a valuable input to researchers and developers regarding the “real-world” functioning of machine-vision lane detection. The insight into the variations of lane detection accuracy in different visibility conditions may help further development of such systems. Second, the results may help road authorities in optimizing the quality performance of road markings. Namely, it is still not entirely clear what the minimal quality requirements for road markings are in order to provide adequate accuracy of machine-vision. However, knowing which visibility conditions are more problematic for machine-vision may help road authorities in prioritizing maintenance activities as well as defining minimal visibility levels of road markings.
The manuscript is structured in five main sections. Section 1 presents the research problem and literature findings related to the impact of road markings quality on LSS. Section 2 describes the research equipment, testing procedure, road sections chosen for the purpose of this research and data analysis. The results of on-road tests are divided into two subsections presented in Section 3: Quality of lane markings’ detection and view range of lane markings. In Section 4 the obtained results are discussed and compared to findings from previous studies, including limitations and suggestions for future studies. The last section (Section 5) presents the conclusion of the study and provides potential practical application for the obtained results.
2. Materials and Methods
2.1. Apparatus
The data related to lane detection was recorded using Mobileye 630 system implemented in the testing vehicle (BMW640i) of the Institute of Automotive Engineering, Graz University of Technology (Figure 1). The system is developed by a leading supplier of camera systems for ADAS and it was previously used in several studies [11,14,17,19]. The Mobileye 630 system uses a digital camera with the 38 degrees horizontal and 28 degrees vertical field of view located behind the front windshield inside the vehicle. Using image processing chips, the camera enables high-performance real-time image processing (15 frames per second) of different objects on roads such as lane markings, pedestrians etc. The system, among others, conforms to the Directive 72/245/EEC for electronic equipment which can be built in road vehicles and enables extraction of recorded data for further processing. For the purpose of this study, we recorded the data related to the type of detected longitudinal marking (continuous or dashed), approximate marking width, view range and the quality of the marking both for middle and edge lines. The vehicle was also equipped with a precise measurement system to record the vehicle’s trajectory by a combination of GPS localization (Novatel OEM-6–RT2 receiver) and inertial measurement unit (GENESYS ADMA G-III).
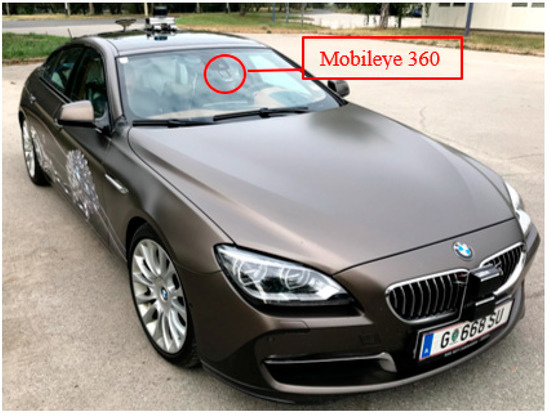
Figure 1.
Testing vehicle with Mobileye 360 implemented behind the front windshield inside the vehicle.
2.2. Test Road Sections and Procedure
The study was conducted on four rural road sections in Croatia in total length of 120.8 km. The roads were two-way roads with 3.5 m lane width and low traffic volumes. Three road sections were marked with the middle line and partially with edge lines while the fourth road had only the middle line. All markings were white, 15 cm wide and made from solventborne paint (Type I). The main characteristics of the road sections are presented in Table 1.

Table 1.
Characteristics of test road sections.
The roads were selected based on the fact that they are rural with low traffic volumes. Rural roads with low traffic volumes have higher risk of road departure accidents [2] and thus the importance of LSS is increased. Also, roads were selected since they have the recommended width of lane markings for LSS [20,21,22] and on the majority of their length, there is no road lighting. Road lighting was present only on short sections located in populated areas. However, these sections were excluded from the analysis (see Section 2.3).
Each road was “measured” twice: once during daytime and once during night-time. The measurements for night-time conditions were conducted on 21 September 2020 and on 22 September 2020 for daytime conditions. The measurements were done between 10:15 h and 13:00 h during daytime and between 19:20 h and 22:20 h during night-time. In both conditions, the weather was dry and the sky clear. The driving speed was in accordance with the speed limit and differed between 60 km/h and 80 km/h. In this way, we tried to control the impact of speed on the detection of markings since literature suggests that speed has a varying impact on machine-vision (some improve at higher speeds, some degrade) [11].
2.3. Data Analysis
Raw data from the Mobileye device was extracted using Control Area Network (CAN) bus interface separately for each road. As stated in Section 2.1, the data was recorded with Mobileye, and two main variables were analysed: view range and the detection quality of the markings. View range was determined in meters (maximal value 80 m) while the quality level was ranked on the scale from 0 to 3, where 0 equalled “nothing detected”, 1 presented “low detection confidence”, 2 “medium detection confidence” and 3 “high detection confidence”. The thresholds for each quality level are not known to the authors since this information is a “know-how” of the manufacturer. The sampling rate of the camera was set at 100 Hz and GPS coordinates were recorded for each sample.
Since smaller parts of the roads are passing through settlements with road lighting, we have excluded those sections from the analysis in order to eliminate the impact of such environmental lighting on Mobileye during night-time. Also, since edge markings were not located on the whole length of the analysed roads, sections without edge lines are also excluded from the analysis.
The results of the “measurements” between day and night conditions were correlated based on the GPS coordinates. Two analyses were conducted: (1) quality of lane marking detection; and (2) view range. With respect to (1), the number of samples per each quality level was calculated for each road. Wilcoxon signed-rank test was used to test the difference in the number of quality rankings on each road during daytime and night-time. The Wilcoxon signed-rank test is a non-parametric equivalent of the dependent t-test, meaning that it is based on the differences between scores in the two comparing conditions. Once the differences are calculated, they are ranked and the sign of the difference (positive or negative) is assigned to the rank [23]. To calculate the significance of the test statistic (T), the mean ( and the standard error () are used as shown in the following equation:
Based on the test statistic, the mean of the test statistic and the standard error, z-score is calculated using the Equation (3):
The view range analysis included the calculation of the absolute averages for each road, line and visibility conditions as well as the average difference and standard deviation when daytime reading quality was higher compared to night-time and vice versa for both markings (middle and edge). Finally, a paired samples t-test was used to test the difference between night-time and daytime conditions for each line on each road. In general, a paired samples t-test compares the means of two measurements taken from the same individual object, or related units. These “paired” measurements can represent a measurement taken at two different times, a measurement taken under two different conditions or measurements taken from two halves or sides of a subject or experimental unit. The test compares the mean difference between samples () to the difference that is expected to be found between population means (), and then takes into account the standard error of the differences (/), as shown in the following equation:
If the null hypothesis is true, then it is expected that there is no difference between the population means ( = 0). The purpose of the test is to determine whether there is statistical evidence that the mean difference between paired observations is significantly different from zero [23].
In both tests (Wilcoxon signed-rank and paired samples t-test), the significant level was set at 0.05. IBM SPSS 26 was used for statistical analysis.
3. Results
As described in Section 2.3, raw data for each road was purified after extraction in order to exclude road sections without edge markings as well as parts with road lighting. The final data used in the analysis included 2,649,472 samples and for each sample the quality of the detection and the view range were recorded. The total number of samples per each quality level, line type (middle/edge) and visibility conditions (night-time/daytime) is presented in Table 2.
Table 2.
Number of analysed samples.
Further analysis is divided into two subsections: Quality of lane markings’ detection and view range of lane markings, and presented in the following chapters.
3.1. Quality of Lane Markings’ Detection
During night-time, 69% of all readings of the middle line were ranked as level 3, i.e., “high detection confidence”. Around 18% of middle markings were not detected (level 0), almost 2% had “low detection confidence” (level 1) while 10% had “medium detection confidence” (level 2). On the other hand, night-time readings for the edge line are as follows: 31% level 3, 20% level 2, 1% level 1 and 48% level 0.
The overall results for the middle line show that the number of samples classified as level 3 and 0 differed around 2% between daytime and night-time with lower number of samples recorded during daytime. On the other hand, the number of samples classified as level 2 during daytime increased by reaching 3.5% difference compared to night-time, while level 1 varied slightly between the two conditions. A similar result was found for the edge marking. During daytime, the number of level 3 and 2 samples decreased compared to night-time, with differences of around 3% and 7% respectively. The number of level 1 samples increased during daytime and differed by 10.7% to the night-time, while level 1 stayed approximately the same.
The afore-presented results are shown in Figure 2.
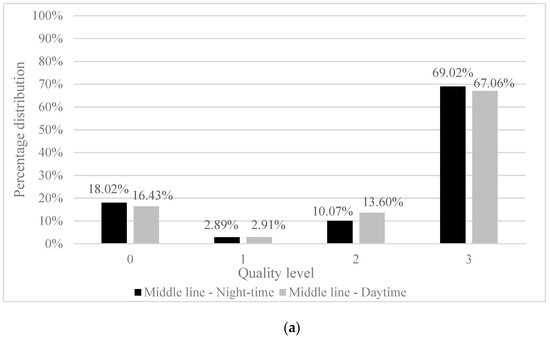
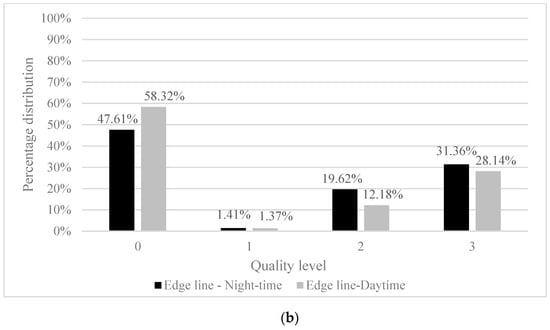
Figure 2.
Comparison of the Mobileye readings (quality level) between night-time and daytime quality measurements for middle (a) and edge lines (b).
Overall, when analysing all roads and lines together, on average 50% of daytime readings were classified as level 3, 13% as level 2, 2.2% as level 1 and 34% as level 0. On the other hand, those averages changed to some extent during night-time as visible from the Figure 3. Namely, the average number of level 3 readings decreased by almost 5% in daytime compared to night-time conditions. It is similar for level 2 where the decrease is 8% while the number of level 1 readings decreased slightly (0.28%). On the other hand, the number of level 0 readings in daytime increased by 12% compared to night-time.
Figure 3.
Number of overall reading qualities during daytime and night-time as well as their differences (day–night).
When looking at each road separately, the results show that on all the roads the percentage of level 3 readings is higher during night-time when compared to daytime, reaching the maximum difference on road four—3.52%. On two roads (one and four), the percentage of level 2 daytime readings is higher compared to night-time and lower on other two roads (two and three). The percentages of level 1 readings remained approximately the same in both conditions while the number of level 0 readings is higher during daytime on three roads (one, two and three) with the maximum of 6.86%. The results for each road are presented in Table 3.
Table 3.
Frequencies and percentages of samples by each marking quality rank for middle and edge lines during night-time.
In order to test the statistical difference between the detection quality of lane markings during daytime compared to night-time, a Wilcoxon signed-rank test was used. Table 4 presents the results of the aforementioned tests, separately for middle and edge lines on all four roads. Although the majority of samples had “equal readings” in both conditions (day = night), it can be concluded that for all four roads a statistically significant difference in the number of samples between visibility conditions still exists (p < 0.05). Roads 1 and 4 have more samples which had higher readings during night-time compared to daytime, while it is the opposite on roads 2 and 3.
Table 4.
Results of Wilcoxon signed-rank test for middle and edge lines on analysed roads.
3.2. View Range of Lane Markings
Overall, the absolute average of Mobileye’s view range for the middle line during night-time was 34.07 ± 22.23 m. During daytime, the view range increased and averaged 39.42 ± 25.36 m. On the other hand, the range for the edge lines was lower compared to the middle lines in both daytime and night-time conditions, averaging 17.69 ± 24.38 m and 17.01 ± 20.48 m, respectively. Absolute averages of the view range for each road, line and visibility condition is presented in Table 5.
Table 5.
Absolute averages of the view range for each road, line and visibility condition.
Furthermore, we calculated the average difference and the standard deviation of the view range when daytime reading quality was higher compared to night-time and vice versa for both markings (middle and edge). On average, the difference in the view range for the middle line when daytime had higher reading quality was around 29 m with the standard deviation of around 21 m. On the other hand, when reading quality was higher during night-time, a slight decrease of the view range difference and standard deviation was recorded. There is a similar trend for the edge line as well but the difference in view range for “Daytime > Night-time” is almost 40 m and “Night-time > Daytime” around 27 m as shown in Table 6.
Table 6.
Average differences in view range of middle and edge lines for each road and condition.
In addition, a paired samples t-test was used to test whether a significant difference between night-time and daytime conditions for each line on each road exists. In total 7 pairs were made as shown in Table 7. The results of the t-test show that the view range between all pairs is statistically different (p < 0.05), i.e., that Mobileye view range differed for all test cases between daytime and night-time conditions.
Table 7.
Results of paired samples t-test.
4. Discussion
Although several studies [11,14,15] investigated how different factors affect lane detection and thus proper functioning of LSS, gaps in literature still exist. Mainly, these gaps are related to determining the adequate levels of lane markings’ visibility in different conditions. For this reason, an on-road test was conducted to determine and compare the detection quality and view range of machine-vision system during daytime and night-time.
The overall results show that the number of each quality level (0–3) as output from the camera differed between visibility conditions. Namely, the average number of level 3 and 2 readings decreased by 5% and 8% in daytime compared to night-time conditions. The share of level 1 remained approximately the same (slight decrease—0.28%) while the number of level 0 readings in daytime increased by 12% compared to night-time indicating potential failures in lane detection during daytime. Although the conducted tests show that a significant difference of quality readings between visibility conditions exists, it has to be noted that differences are relatively small and may not influence the functioning of the lane detection system. The main concern from the practical point is related to the 12% increase of level 0 readings during daytime compared to night-time. Since level 1 readings in both conditions stayed approximately the same, it is reasonable to conclude that in some cases markings were not detected by Mobileye (level 0) during daytime while during night-time they were detected with medium (level 2) or high detection confidence (level 3). Since the driving speed, the sun direction in daytime conditions and the impact of road lightning in night-time conditions were controlled, the potential reason for such results is related to the difference in visual complexity between the two conditions (day vs night-time). Due to the complexity of visual clutter during daytime, the contrast ratio between the marking and the road may differ and decrease thus affecting the proper functioning of lane detection. This is also suggested by previous studies in which it was found that the optimum contrast between marking and road surface should be around 3:1 during daytime [11,19]. On the other hand, the aforementioned contrast ratio during night-time is generally much higher due to the fact that the surrounding environment is dark and the visibility of lane markings is achieved with the use of retroreflective materials, i.e., glass beads which return the incoming light ray from the vehicle headlights back to the source (driver) [24]. In addition, the number of samples classified as level 0 detection quality was much higher for edge markings compared to middle markings, both during daytime and nigh-time. This suggests that the quality of the marking plays an important role. On three roads the middle line was relatively new (<6 months,) and on one road it was older than one year. On the other hand, edge markings on all three roads were older than one year. Several studies proved that age affects visibility properties (daytime and night-time visibility) of lane markings, especially for paint markings [25,26,27,28]. Since the service life of paint markings is usually around one year, it is reasonable to conclude that the visibility properties of edge lines in this study were lower compared to newer middle lines.
Although the detection quality slightly decreased in daytime compared to night-time, the view range increased, however differently for middle and edge lane marking: the absolute average and the standard deviation of the view range for the middle line during daytime was 39.42 ± 25.36 m compared to 34.07 ± 22.23 m in night-time conditions. The range for edge lines was shorter compared to middle lines in both daytime and night-time conditions averaging 17.69 ± 24.38 m and 17.01 ± 20.48 m, respectively. Such results are lower compared to the study [17]. However, this is mainly due to the different methodology. The aforementioned study tested lane detection in a static environment with consistent parameters (new markings, lighting, road surface retroreflectivity, etc.) and used older version of Mobileye (560). Overall, form the practical point of view, the differences of the results between visibility conditions are, as in the case of detection quality, relatively small. However, there is a much higher difference between the view range of middle and edge markings. This may be due to the markings’ age. As described in previous paragraph, the age of the marking affects its visibility properties (daytime and night-time visibility). Since edge lines in this study were older compared to the middle lines, it is reasonable to conclude that their visibility properties were lower compared to newer middle lines. Furthermore, relatively high standard deviations of the view range (around 20 m) for all markings suggest that, beside the markings age and its visibility, road geometry plays an important role in lane marking detection. Since Mobileye camera is fixed to the vehicle windshield, it is not moving like human drivers’ head and eyes would, meaning that it “looks” at a relatively fixed area at the more or less the same angle, i.e. the viewing area and angle are changed only with the change of the vehicles movement. This indicates that with the change of road geometry such as curves, dips, slopes etc., middle and edge lane markings will be “seen” by the “fixed” machine-vision at different distances. The aforementioned findings further support the findings from literature [11,14,15].
Although this study provided valuable results, there are several limitations. First, lane markings’ visibility properties were not taken into account due to the fact that the main objective of the study is to compare the detection quality and view range of a machine-vision system during daytime and night-time and to analyse how these values change depending on the visibility conditions alone. Further research is needed to determine the relationship between daytime and night-time visibility on the detection quality and view range of LSSs. Furthermore, we did not evaluate how different road geometry and lane markings’ configurations (dashed vs solid) affect the detection of markings. Existing literature indicates that both road geometry and configuration of lane markings are potential influencing factors [11]. However, due to the lack of data related to the road geometry (curves, dips, slopes etc.) and exact location of each type of dashed lines, such analysis was not conducted. Also, the daytime measurements were conducted between 10:15 h and 13:00 h which may have, to some extent, affected the results since the sun direction is one of the factors that affects lane markings’ detection by machine-vision systems [11,14,15]. However, all measurements were conducted on the same day under the clear sky and on roads whose direction is not in the direction of the sun (north-south direction) so the effect of the aforementioned factor is limited and negligible. The effect of driving speed was also not analysed, although the literature suggests that vehicle speed has a varying impact on machine-vision systems—some improve at higher speeds and some degrade [11]. Since the tests in this study were conducted on rural roads, the driving speed was in accordance with the speed limit (between 60 km/h and 80 km/h) and thus the impact of speed was controlled. Lastly, only one machine-vision system (Mobileye 630) was tested and overall results may not be applicable to other such systems.
Since the differences between lane markings’ detection found in this study are relatively small, more studies are needed to further validate here presented results. Besides determining the relationship between daytime and night-time visibility on the detection quality and view range of LSS, future studies should focus on detailed investigation of the influence of other factors on the LSS such as weather conditions, road geometry (curves, dips, slopes etc.), markings’ characteristics (colour, width, configuration), driving speed, road surface characteristics (type, condition and texture) etc., as well as combinations of these factors. Therefore, we propose that future research combines the field and on-road tests in order to further expand the existing knowledge and thus improve the overall quality of machine-vision systems as well as to determine adequate properties of lane markings.
5. Conclusions
The results of this study indicate that lane marking detection quality and view range by machine-vision system differs to some extent between dry daytime and night-time conditions. The field test results show that detection quality of lane markings is “better” during night-time compared to daytime. However, it has to be noted that the aforementioned differences are relatively small and may not critically influence the functioning of the lane detection system. Nevertheless, the results presented here support previous findings and provide further proof that visibility conditions play an important role in lane detection and that, during daytime, the complexity of visual clutter decreases the contrast ratio between the marking and the road surface and thus affects the detection quality and view range of machine-vision. In addition, the results suggest that other factors such as road geometry, markings’ age and quality are also influential and should be further evaluated.
Overall, the findings of this study provide a quantization of the effect of surrounding visibility on lane detection and thus contribute to expanding the existing knowledge regarding lane detection by machine-vision. Here presented methodology and results may be useful for researchers in designing and evaluating similar studies. Furthermore, the results may be useful to road authorities. Although, the study did not evaluate how different visibilities of road markings affect their detection by machine-vision, the results support previous findings which indicate that the detection of lane markings is much more problematic for machine-vision during daytime compared to night-time. This finding is useful for road authorities and may help them in prioritizing and optimizing road marking maintenance activities. Depending on the weather and traffic conditions and general road characteristics (type of the road, width, general road geometry, surface condition etc.), road authorities should adopt different maintenance policies to ensure proper and timely maintenance and thus adequate quality of road markings needed for both for human drivers as well as machine-vision systems. Finally, the presented findings may help the developers of machine-vision systems in detecting critical situations and conditions which negatively affect lane marking detection.
Author Contributions
Conceptualization, D.B. (Darko Babić), D.B. (Dario Babić) and M.F.; methodology, D.B. (Darko Babić), D.B. (Dario Babić) and M.F.; formal analysis, D.B. (Dario Babić) and M.F.; investigation, D.B. (Darko Babić), D.B. (Dario Babić), M.F., A.E. and Z.F.M.; resources, D.B. (Darko Babić) and A.E.; data curation, D.B. (Dario Babić) and Z.F.M.; writing—original draft preparation, D.B. (Dario Babić), M.F., A.E.; visualization, D.B. (Dario Babić); supervision, D.B. (Darko Babić); project administration, D.B. (Darko Babić); funding acquisition, D.B. (Darko Babić). All authors have read and agreed to the published version of the manuscript.
Funding
This research was a part of the project entitled “Establishing a Methodology for Testing and Evaluating the ADAS Systems” funded by University of Zagreb (Potpore za temeljno financiranje znanstvene i umjetničke djelatnosti Sveučilišta u Zagrebu u ak. god. 2019/2020).
Institutional Review Board Statement
Not applicable.
Informed Consent Statement
Not applicable.
Data Availability Statement
The data used to support the findings of this study are available from the corresponding author upon request.
Conflicts of Interest
The authors declare no conflict of interest.
References
- Federal Highway Administration. Roadway Departure Safety. 2020. Available online: https://safety.fhwa.dot.gov/roadway_dept/ (accessed on 20 December 2020).
- Xiong, X.; Chen, L.; Liang, J. Analysis of roadway traffic accidents based on rough sets and Bayesian networks. Promet Traffic Transp. 2018, 30, 71–81. [Google Scholar] [CrossRef]
- National Cooperative Highway Research Program. Best Practices in Lane-Departure Avoidance and Traffic Calming. Project 20-68A, USA. 2011. Available online: http://onlinepubs.trb.org/onlinepubs/nchrp/docs/NCHRP20-68A_09-03.pdf (accessed on 11 December 2020).
- American Association of State Highway and Transportation Officials. Driving down Lane-Departure Crashes. Report, USA. 2008. Available online: http://www.virginiadot.org/business/resources/LocDes/Lane_Departures_PLD-1.pdf (accessed on 11 December 2020).
- Babić, D.; Fiolić, M.; Babić, D.; Timothy, G. Road markings and their impact on driver behaviour and road safety: A systematic review of current findings. J. Adv. Transp. 2020, 7843743. [Google Scholar] [CrossRef]
- Eichberger, A.; Rohm, R.; Hirschberg, W.; Tomasch, E.; Steffan, H. RCS-TUG Study: Benefit potential investigation of traffic safety systems with respect to different vehicle categories. In Proceedings of the 22nd International Conference on the Enhanced Safety of Vehicles (ESV), Washington, DC, USA, 13–16 June 2011. [Google Scholar]
- Sternlund, S. The safety potential of lane departure warning systems—A descriptive real-world study of fatal lane departure passenger car crashes in Sweden. Traffic Injury Prev. 2017, 18, 18–23. [Google Scholar] [CrossRef] [PubMed] [Green Version]
- Sternlund, S.; Strandroth, J.; Rizzi, M.; Lie, A.; Tingvall, C. The effectiveness of lane departure warning systems—A reduction in real-world passenger car injury crashes. Traffic Injury Prev. 2017, 18, 225–229. [Google Scholar] [CrossRef] [PubMed]
- Penmetsa, P.; Hudnall, M.; Nambisan, S. Potential safety benefits of lane departure prevention technology. IATSS Res. 2019, 43, 21–26. [Google Scholar] [CrossRef]
- Hata, A.Y.; Wolf, D. Road marking detection using LIDAR reflective intensity data and its application to vehicle localization. In Proceedings of the 17th International IEEE Conference on Intelligent Transportation Systems (ITSC), Qingdao, China, 8–11 October 2014. [Google Scholar] [CrossRef]
- Austroads. Implications of Pavement Markings for Machine Vision. Research Report AP-R633-20. 2020. Available online: https://austroads.com.au/publications/connected-and-automated-vehicles/ap-r633-20 (accessed on 20 December 2020).
- Nguyen, V.; Kim, H.; Jun, S.; Boo, K. A study on real-time detection method of lane and vehicle for lane change assistant system using vision system on highway. Eng. Sci. Technol. 2018, 21, 822–833. [Google Scholar] [CrossRef]
- Hillel, A.B.; Lerner, R.; Levi, D.; Raz, G. Recent progress in road and lane detection: A survey. Mach. Vis. Appl. 2014, 25, 727–745. [Google Scholar] [CrossRef]
- Texas A&M Transportation Institute. Road Markings for Machine Vision, NCHRP Project 20-102(6). 2016. Available online: http://sp.scote.transportation.org/Documents/2016%20SCOTE%20Meeting/Tuesday%207JUN17/NCHRP%2020-102(6)%20update.pdf (accessed on 20 December 2020).
- Mistry, V.H.; Makwana, R. Survey: Vision based road detection techniques. Comput. Sci. Inf. Technol. 2014, 5, 4741–4747. [Google Scholar]
- Lundkvist, S.O.; Fors, C. Lane Departure Warning System—LDW; VTI: Linköping, Sweden, 2010. [Google Scholar]
- Potters Industry and Mobileye. Pavement Markings Guiding Autonomous Vehicles—A Real World Study. 2016. Available online: https://higherlogicdownload.s3.amazonaws.com/AUVSI/14c12c18-fde1-4c1d-8548-035ad166c766/UploadedImages/documents/Breakouts/20-2%20Physical%20Infrastructure.pdf (accessed on 20 December 2020).
- Carlson, P.J.; Poorsartep, M. Enhancing the roadway physical infrastructure for advanced vehicle technologies: A case study in pavement markings for machine vision and a road map towards a better understanding. In Proceedings of the 96th Annual Meeting Transportation Research Board, Washington, DC, USA, 8–12 January 2017. [Google Scholar]
- Pappalardo, G.; Cafiso, S.; Di Graziano, D.; Severino, A. Decision tree method to analyze the performance of lane support systems. Sustainability 2021, 13, 846. [Google Scholar] [CrossRef]
- European Union Road Federation. Marking the Way towards a Safer Future; ERF: Brussels, Belgium, 2013. [Google Scholar]
- American Traffic Safety Services Association. ATSSA Policy on Road Markings for Machine Vision Systems. 2019. Available online: https://www.reflective-systems.com/wp-content/uploads/2019/04/Policy-re-Road-Markings-for-Machine-Vision-Systems.pdf (accessed on 20 December 2020).
- EuroRAP. Roads That Cars Can Read. 2011. Available online: http://www.eurorap.org/wp-content/uploads/2015/04/20110629-Roads-That-Cars-Can-Read-June-2011.pdf (accessed on 20 December 2020).
- Howell, C.D. Statistical Methods for Psychology, 7th ed.; Cengage Learning: Belmont, CA, USA, 2010. [Google Scholar]
- Babić, D.; Ščukanec, A.; Babić, D. Determining the correlation between daytime and night-time road markings visibility. Balt. J. Road Bridge Eng. 2016, 11, 283–290. [Google Scholar] [CrossRef] [Green Version]
- Babić, D.; Ščukanec, A.; Babić, D.; Fiolić, M. Model for predicting road markings service life. Balt. J. Road Bridge Eng. 2019, 14, 341–359. [Google Scholar] [CrossRef]
- Sitzabee, W.E.; Hummer, J.E.; Rasdorf, W. Pavement Marking degradation modelling and analysis. J. Infrastruct. Syst. 2009, 15, 190–199. [Google Scholar] [CrossRef]
- Hummer, J.E.; Rasdorf, W.; Zhang, G. Linear mixed-effects models for paint pavement-marking retroreflectivity data. J. Transp. Eng. 2011, 137, 705–716. [Google Scholar] [CrossRef]
- Mull, D.M.; Sitzabee, W.E. Paint pavement marking performance prediction model. J. Transp. Eng. 2011, 138, 618–624. [Google Scholar] [CrossRef]
Publisher’s Note: MDPI stays neutral with regard to jurisdictional claims in published maps and institutional affiliations. |
© 2021 by the authors. Licensee MDPI, Basel, Switzerland. This article is an open access article distributed under the terms and conditions of the Creative Commons Attribution (CC BY) license (https://creativecommons.org/licenses/by/4.0/).