Article

Thermal Stability and Reliability Test of Some Saturated Fatty Acids for Low and Medium Temperature Thermal Energy Storage

1
Non-Conventional Energy Laboratory, Rajiv Gandhi Institute of Petroleum Technology, Jais 229304, India
2
Institut Pascal, Université Clermont Auvergne, CNRS, Clermont Auvergne INP, 63000 Clermont-Ferrand, France
3
Advanced Materials and Technologies Laboratory, Department of Mechanical Engineering, Virginia Tech, Blackburg, VA 24061-0238, USA
4
Department of Mechanical Engineering, Kun Shan University, 949 Da-Wan Road, Tainan 710, Taiwan
*
Author to whom correspondence should be addressed.
Energies 2021, 14(15), 4509; https://doi.org/10.3390/en14154509
Submission received: 2 June 2021 / Revised: 7 July 2021 / Accepted: 23 July 2021 / Published: 26 July 2021
(This article belongs to the Special Issue Thermal Energy Storage and Solar Thermal Energy Systems)

Abstract

:
Phase change materials have been overwhelmingly used for thermal energy storage applications. Among organics, fatty acids are an important constituent of latent heat storage. Most of the saturated fatty acid PCMs so far studied are either unary or binary constituents of pure fatty acids. In the present study, ternary blends of saturated fatty acids i.e., capric, lauric, myristic, stearic, and palmitic acids have been developed with different weight proportions. A series of 28 ternary blends viz. CA-LA-MA, CA-LA-PA, CA-LA-SA, CA-MA-PA, CA-MA-SA, and CA-PA-SA were prepared and analyzed with differential scanning calorimetry, thermal gravimetric analysis, and Fourier transform infrared spectroscopy. DSC analysis revealed that the prepared materials lie in the 15–30 °C temperature range. Also, 300 thermal melt/freeze cycles were conducted which showed ±10% variation in terms of the melting peak for most of the PCMs, with the average latent heat of fusion between 130 and 170 kJ/kg. The TGA analysis showed that most of the PCMs are thermally stable up to 100 °C and useful for medium-low storage applications, and FTIR analysis showed that the materials are chemically stable after repeated thermal cycles. Based on cycle test performances, the developed materials were found to be reliable for long-term use in building and photovoltaic applications.

1. Introduction

Thermal energy storage is an important energy storage technique. There are three most prevalent methods by which thermal energy can be stored i.e., sensible, latent, or thermochemical storage. Latent heat storage using PCMs is the most common and widely used method among the three [1]. PCMs provide a unique way to store and utilize thermal energy. The energy is stored or released through isothermal phase change phenomena during melting and solidification. PCMs offer storage over a broad range of temperatures viz. low, medium, and high-temperature applications [2,3].
However, the selection of PCMs for thermal energy storage applications is a challenging task. Several aspects of PCMs have to be kept in mind while selecting for a particular application. The selected PCM should be in the desired temperature range. It should have a high latent heat of fusion, high thermal conductivity, a low volume change during the phase transition, and a low vapor pressure. PCMs should also be non-flammable, non-toxic, and have minimal health hazards. Those PCM’s which have a low cost, compatibility with the construction material, and recyclability are advantageous from an economic and environmental perspective [4,5]. The effectiveness of a PCM can be improved by employing several methods such as encapsulation, shape-stabilization, using a cascaded thermal energy storage system, conductivity enhancement, maintaining a high energy density, and chemical inertness over a long period [6]. Therefore, the selection of a PCM for a particular application involves several critical sets of parameters that are not always easy to recognize and often conflict with each other [7].
One of the essential requirements for a PCM in a thermal system is the life of the storage material which relies on consistent thermophysical properties with time i.e., the phase transition temperature and latent heat storage capability over repeated melt/freeze cycles [8,9]. Commercial-grade PCMs are preferably used in latent heat storage systems (LHSS) due to their abundant availability and low cost. However, commercial-grade PCMs (95–98% purity) show a large deviation in thermophysical properties in comparison to their laboratory-grade (>99.5% purity) counterparts [10]. PCMs also deteriorate due to several other physical and chemical phenomena, and prominent ones include moisture absorption, breaking of the aliphatic chain of the molecules, formation of a new chemical compound, impurities, phase separation, polymorphism, etc. with continuous heat and cold treatment. As a result, the material loses its stable thermophysical properties, which are reflected in deviations from its melting and solidification temperature and its latent heat storage capability. Therefore, it is particularly important to test the stability of the developed material before its application to the real thermal system [11].
There are various categories of PCMs such as organic, inorganic, and eutectic. Organic PCMs are profusely used in thermal systems due to their lack of corrosiveness, supercooling, and phase segregation behavior. In the organic class, fatty acids are the most prevalent among nonparaffins due to their large availability [12]. The most interesting features of fatty acids are that they are derived from bio-based sources, such as tropical oils and animal fats. They can also be obtained from feedstock wastes, waste cooking oils, and waste fats from animals. As the raw materials are obtained from a natural source, they are biodegradable, sustainable, and environmentally friendly [5]. In the past, several authors have developed fatty acid based PCMs and their eutectics and composites, and have undertaken cycle tests to understand their thermal stability after several melt/freeze cycles. Sharma et al. [13] conducted an accelerated cycle test of SA. These PCMs were subjected to 300 heating/cooling cycles. The authors found that SA was quite stable after the thermal cycle test. Zhang et al. [14] prepared a binary mixture of fatty acids. The authors found that a 22.95% LA-PA binary system had similar DSC curves after numerous melt/freeze cycles. The mixture was found to be stable for up to 100 test cycles. Ahmet Sari [9] performed a reliability test on industrial-grade LA, PA, SA, and MA and conducted 1200 accelerated thermal cycles. The total variation in the MT and LHF was in the range of 0.07 °C–7.87 °C and −1.0% to 27.7%, respectively. Sari et al. [15] showed that eutectic blends of LA-SA (75.5:24.5 wt.%), MA-PA (58:42 wt.%), and PA-SA (64.2:35.8 wt.%) were stable for up to 360 cycles. The variation in MT and LHF was found to be irregular during the progression of thermal cycles. Sharma and Shukla [10] developed binary eutectics of some fatty acids. An extensive thermal cycle test of up to 1200 cycles was performed. The result showed a −1.69 °C to 4.33 °C variation in the MT and a −35% to 25% variation in the LHF. Zhang et al. [16] prepared a composite of a ternary eutectic of CA, PA, and SA with expanded graphite (EG) (i.e., CA-PA-SA/EG). The weight ratio of CA-PA-SA was 79.3:14.7:6.0. They conducted 500 thermal cycles on the prepared composite which confirmed that the PCM was thermally stable. Sharma et al. [17] prepared a novel composite of PA and TiO2 nanoparticles. The authors performed 1500 thermal cycles on this composite. The result showed excellent thermal reliability of the developed PCM. Wen et al. [18] prepared a CA-LA/diatomite composite employing the vacuum impregnation method, and 200 thermal cycles revealed that the PCM had excellent thermal stability. Chen et al. [19] developed a complex of SA and multi-walled carbon nanotubes (SA@MWCNTs), and with 50 thermal melt/freeze cycles, it showed no alteration in the phase transition temperature. Sari et al. [20] prepared a silica fume/CA-PA composite PCM doped with CNT. The 1000th cycle thermogram was compared with that of the virgin composite. The two thermograms obtained were quite similar.
The literature survey suggests that knowledge of thermal stability is important for the overall performance of a thermal system which also ensures the long-term reliability of the PCM without deterioration [10]. In the present investigation, ternary blends of saturated fatty acids were prepared and their thermophysical properties were obtained using DSC analysis. To test the thermal stability of the developed PCMs, 300 melt/freeze cycles were conducted using thermostatic chambers. Further, TGA analysis was also conducted to test the width of temperature range stability of the developed PCMs. FTIR analysis was undertaken to confirm any changes in chemical structure and functional groups after 300 thermal cycle tests.
The novelty can be explained on the basis that this study is related to the previously conducted development of PCMs by the authors’ group [21]. However, the thermal stability with respect to the cycle test has not been undertaken so far which is also equally important for the long-term performance of the PCM in any kind of thermal system. The thermal stability of the PCM has a prevailing impact on the energy and the financial payback period, energy savings, greenhouse gas emission reduction, and revenue generated with such an addition. A thermal system is generally costly and the addition of a PCM further escalates the cost. The thermal stability of PCMs concerning a large number of thermal cycles is very much essential to analyze and determine if such PCMs have good synchronization with the thermal system and the ambient environment or not. Besides this, other factors, such as the heating/cooling rate, energy demand, heat exchanger design, useful temperature range, and automation engineering of a TES equipment-device, are equally important [6,22]. Therefore, a similar study was planned and conducted in a well-constructed thermostatic chamber and presented in this manuscript. The developed PCMs are new, and these exact types of PCMs are not available in the open literature. A cost analysis was also performed, which showed that the developed PCMs have a low cost and can be easily afforded by the consumer as per their convenience.

2. Material Preparation and Investigational Approach

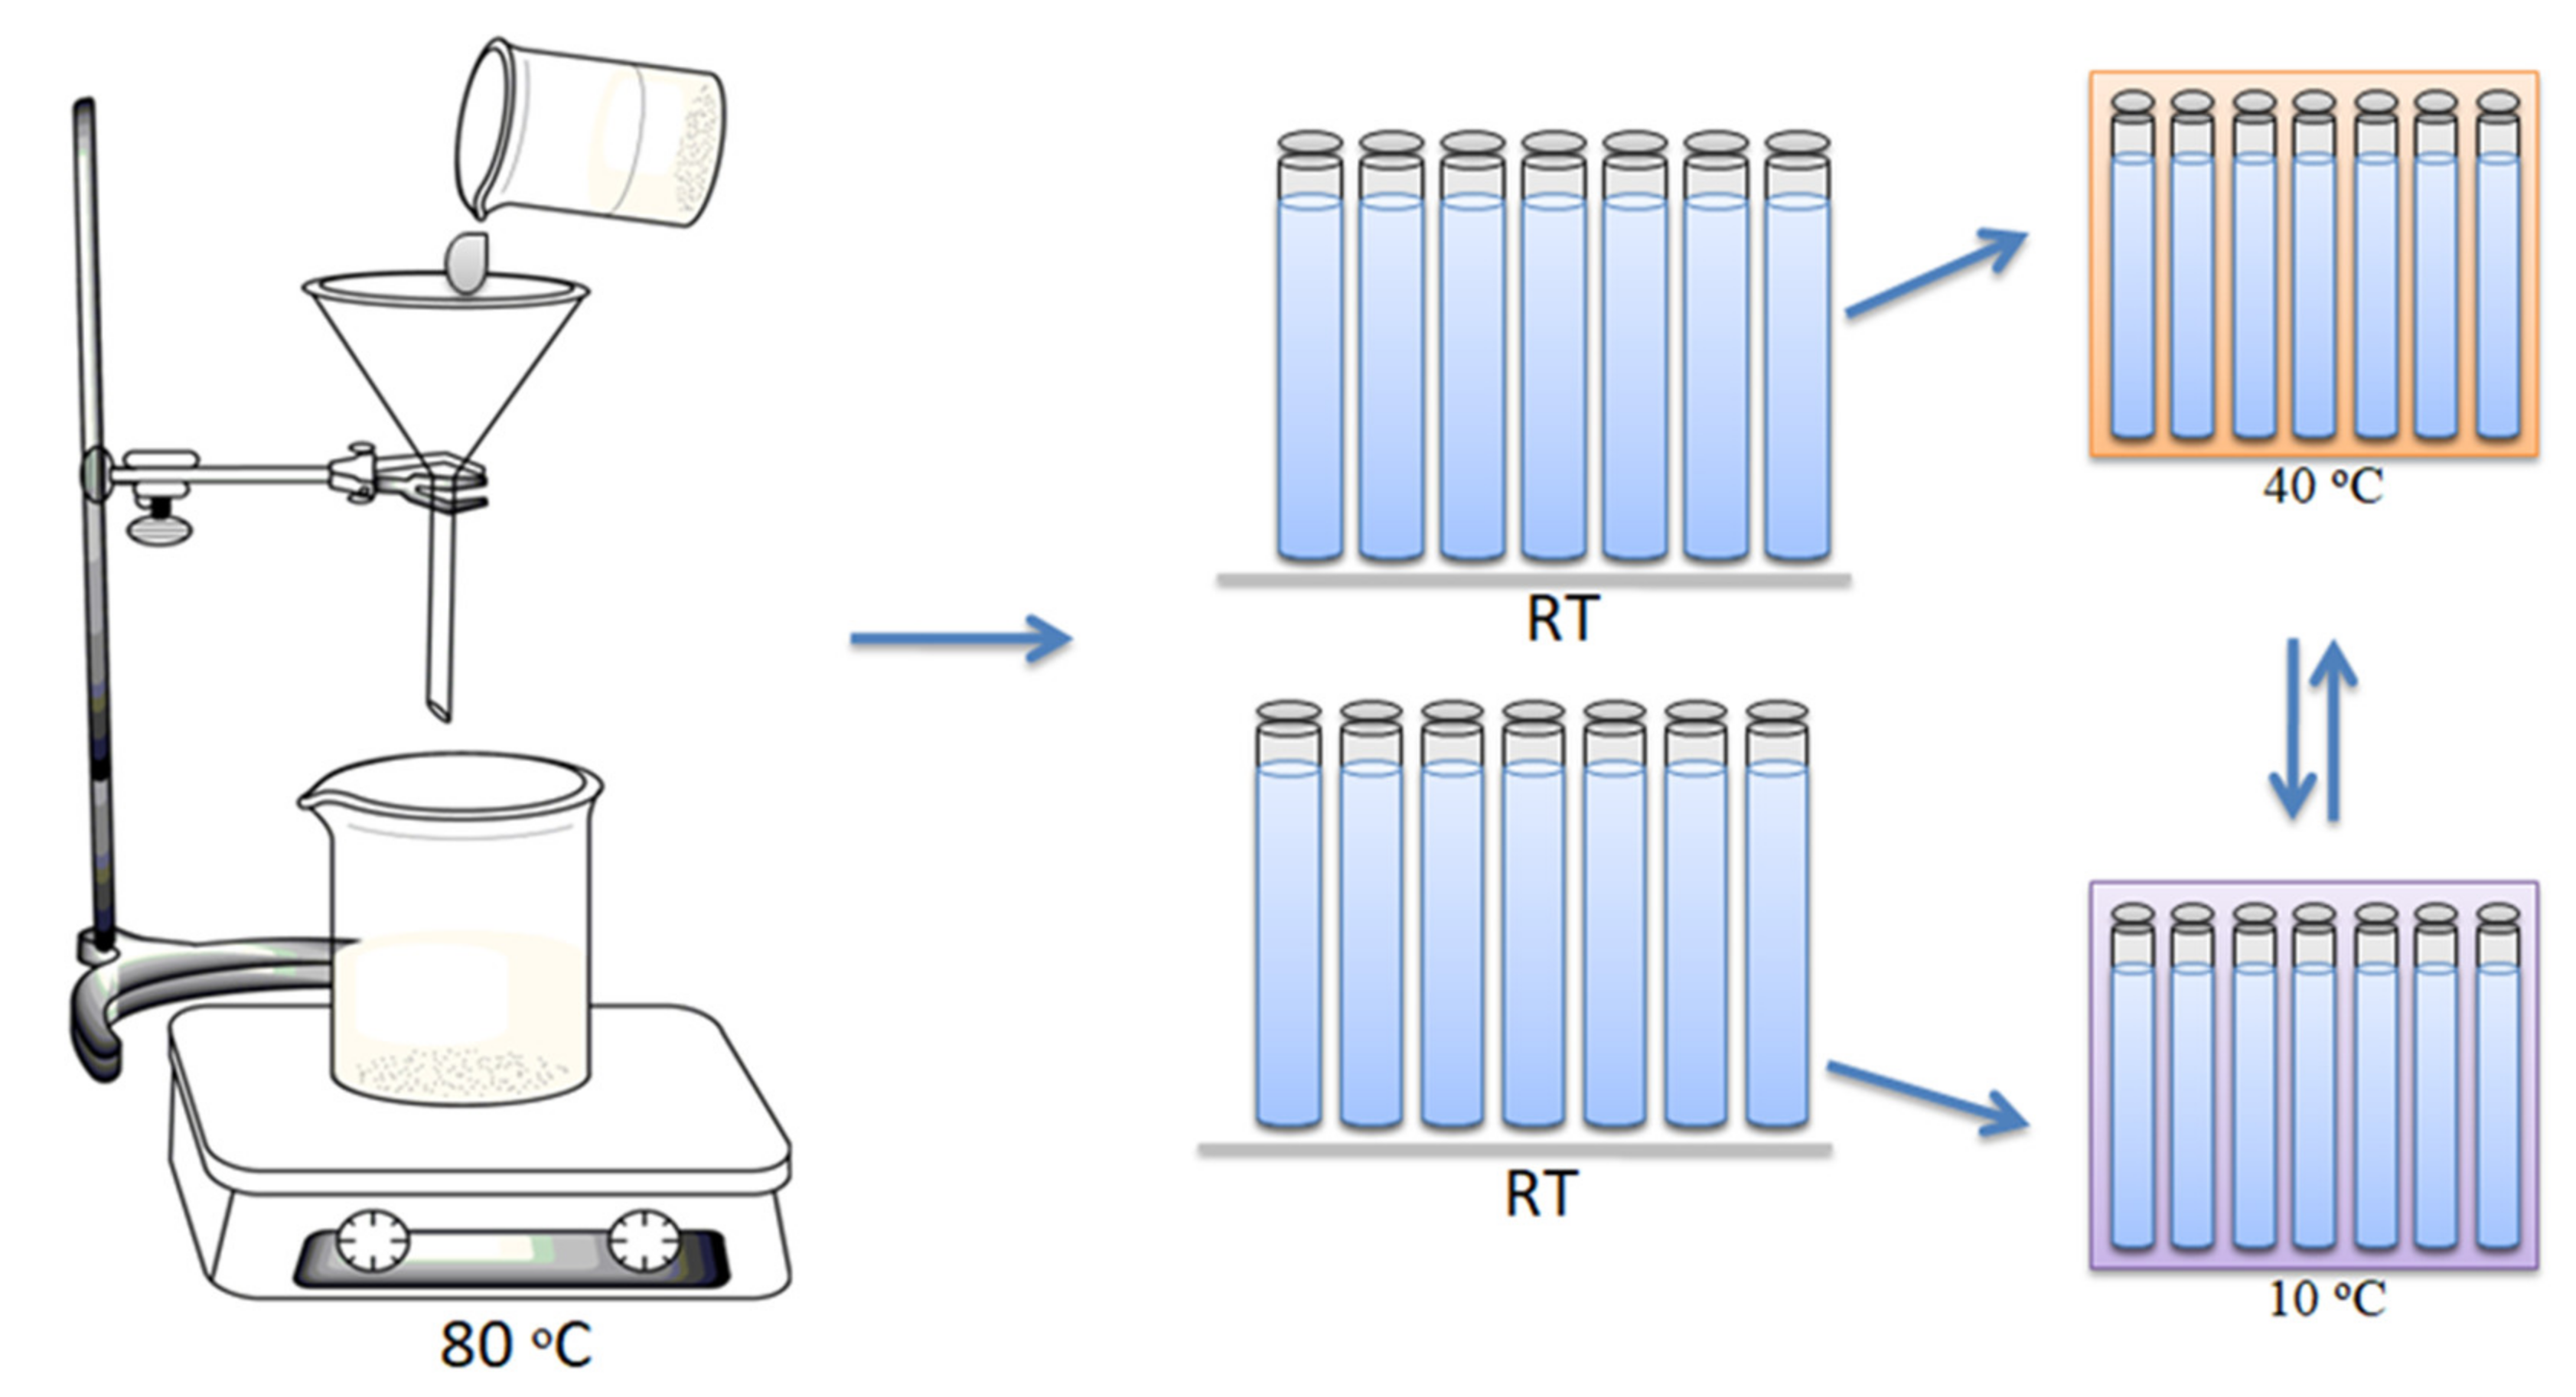
2.1. Material Preparation

All the saturated acids (purity > 98%) were purchased from the Burgoyne Pvt. Ltd. firm. Primarily, fifty-four ternary blends were prepared i.e., CA-LA-MA, CA-LA-PA, CA-LA-SA, CA-MA-PA, CA-MA-SA, and CA-PA-SA with different weight compositions (90/5/5, 80/10/10, 70/15/15, 60/20/20, 50/25/25, 40/30/30, 30/35/35, 20/40/40 and 10/45/45). These concoctions were then poured into a flask which was heated to 40 °C and stirred for about one hour for uniform mixing. The sample was then kept at ambient temperature for tender cooling. The thermophysical properties viz. MT and LHF were obtained using DSC analysis. The data relating to the primary investigation has already been published in the recent work of Anand et al. [21]. Based on the primary results, 28 samples were selected for the cycle testing, being those with a sharp MT and enormous LHF value.
The thermal system where this PCM is employed undergoes at least one melt/freeze cycle during an entire day. However, this process is too slow to test the thermal stability and such an assessment takes a large amount of time. The same melt/freeze phenomena can be recreated in the laboratory using a thermostatic system where a cycle test of the PCM can be effectually carried out. Such an arrangement is faster and can deliver quick results. The thermal stability is measured in the percentage deviation from its transition temperature and latent heat of fusion from the 0th cycle. Constant and stable thermophysical properties of PCMs, viz. MT and LHF, are important for the precise working of a thermal system. Any drastic deviation from the 0th cycle value renders the material useless and it cannot be recommended for thermal systems [8].
For the thermal cycle analysis, 40 mL of the sample was poured into a glass tube with a 25 mm × 150 mm configuration. Each sample was then mounted on a glass tube stand, separated into two lots and immersed into the chilling bath and heating bath separately. The material preparation and distribution methods are presented in Figure 1.

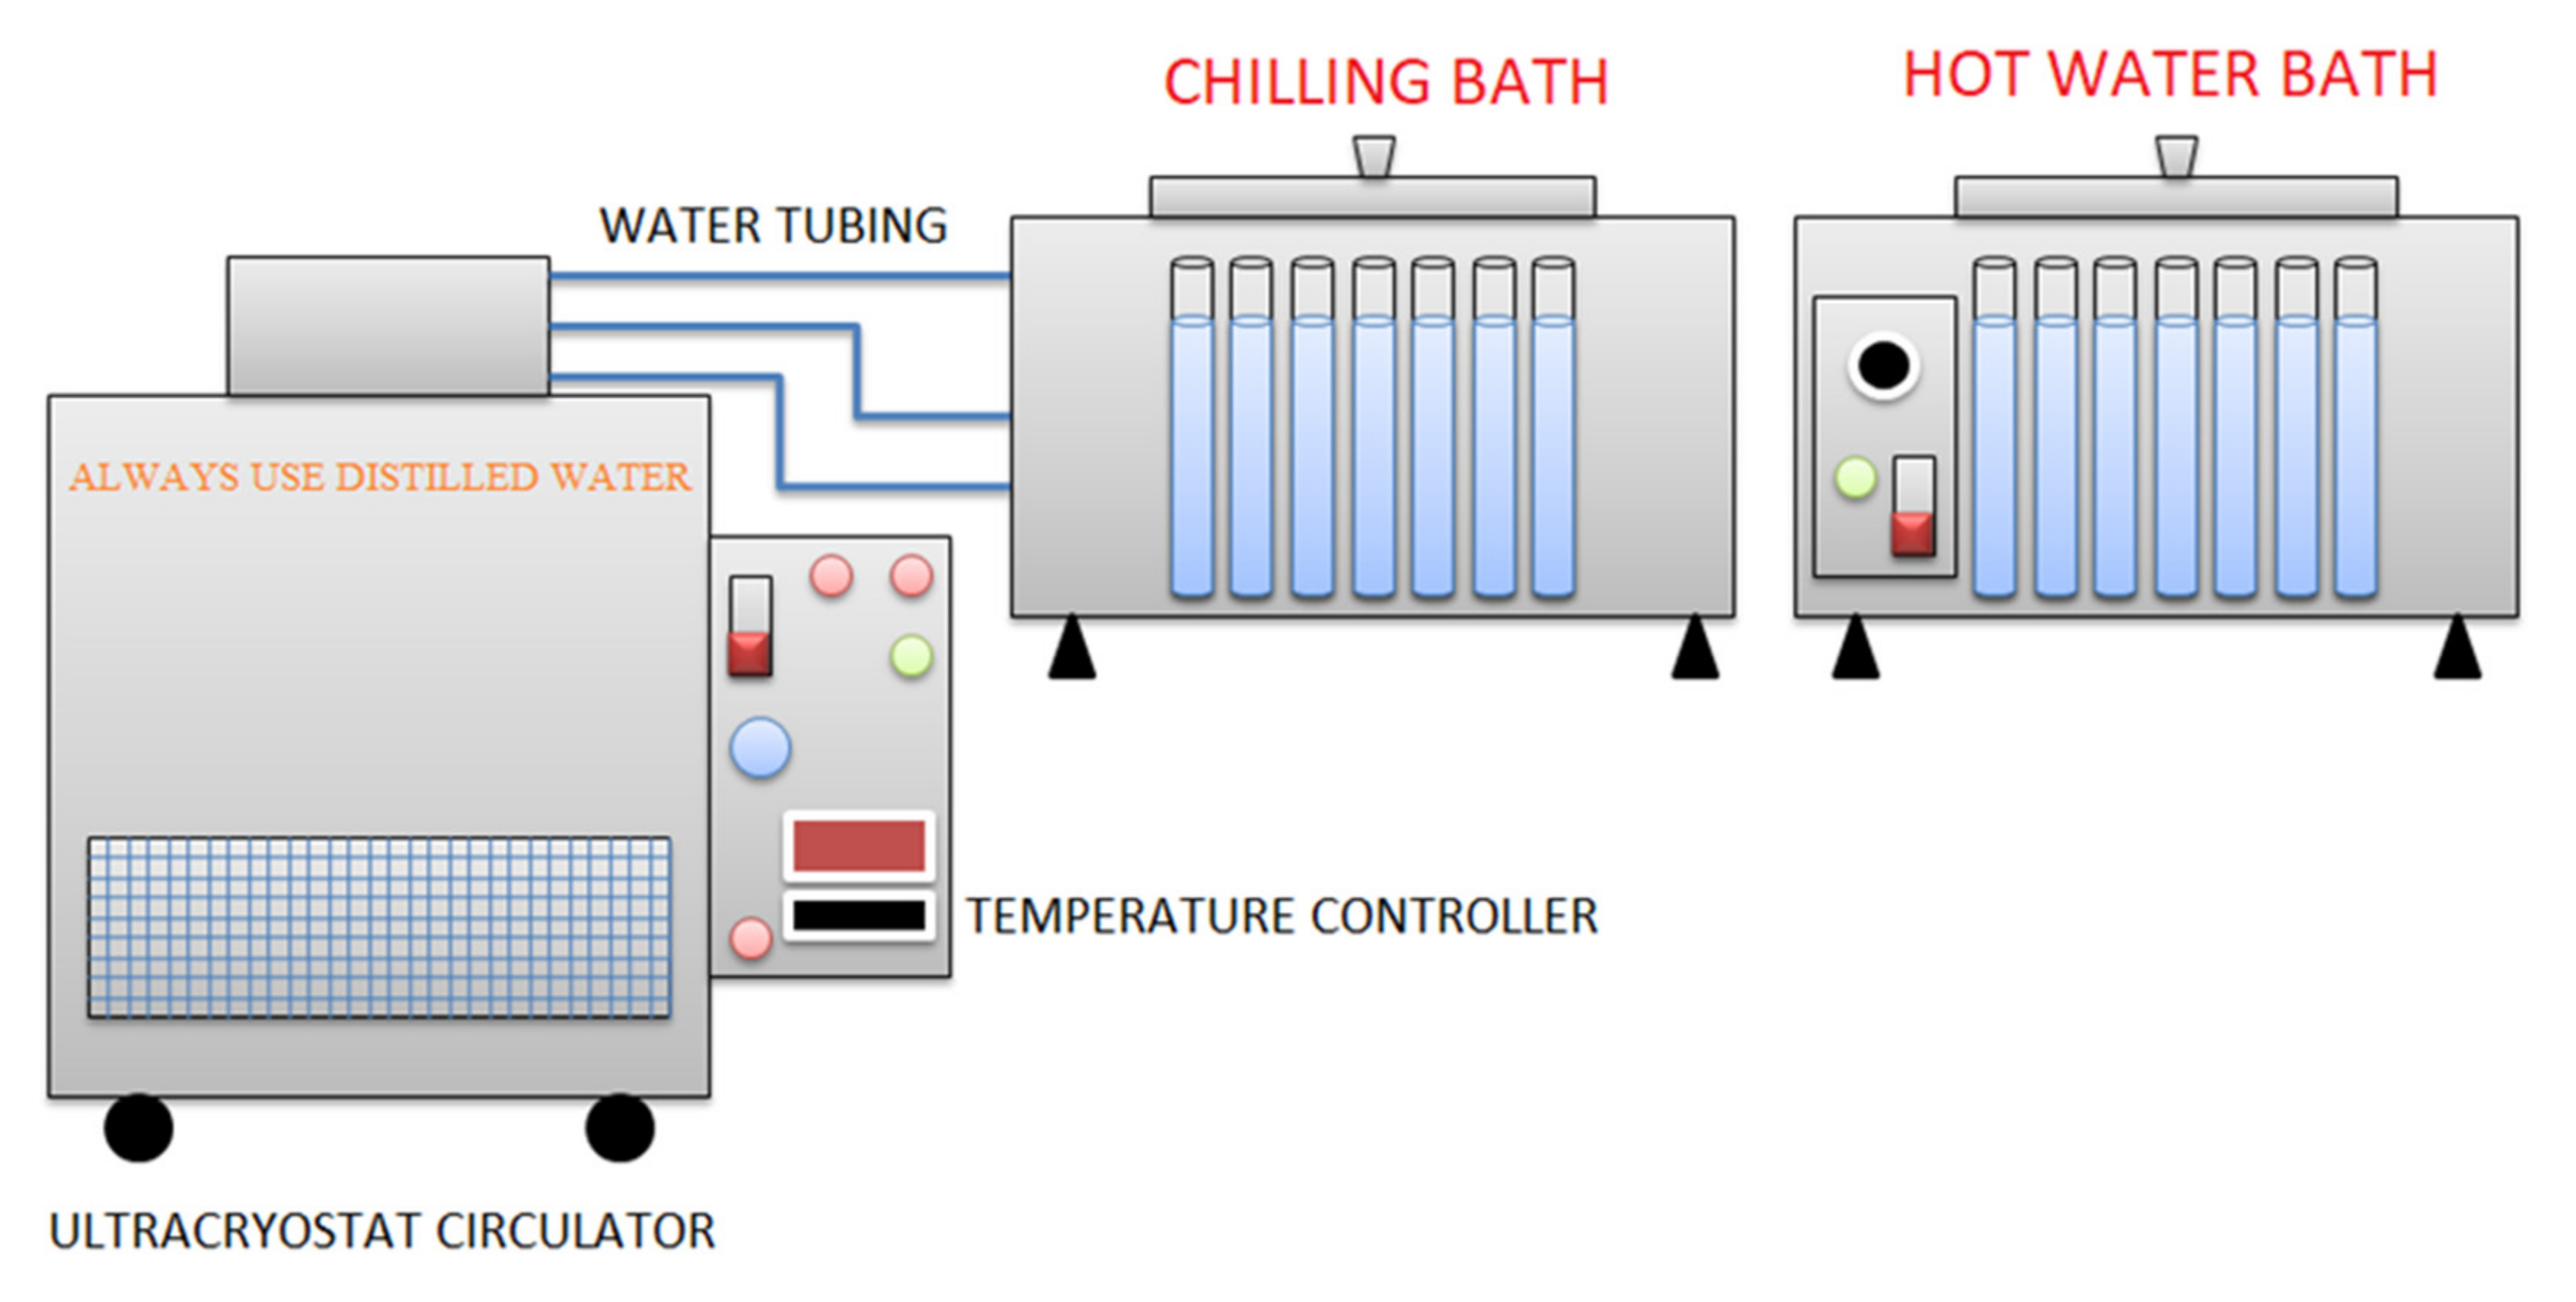
2.2. Thermal Cycle Test Unit

The thermal cycle testing unit has a cryostat circulator strapped to a water bath with a capacity of about 20 L. Using an in-built temperature regulator the circulator can be adjusted from −20 °C to 80 °C with a ±0.1 °C temperature stability and ±0.1 °C accuracy. The chilling bath to which the circulator was connected was fixed at 10 °C. The heating bath had a temperature adjustable range from 40 °C to 300 °C which was set at 40 °C throughout the cycle test process. One cycle was said to be completed when a material underwent one complete melting and freezing in the respective heating and freezing chamber. After one complete cycle, the glass stand containing the glass tube was swapped between the chilling and heating bath. At each juncture of the 50th cycle, the DSC of the sample was performed to obtain its onset, peak, and LHF. The same process was repeated until the 300th cycle was reached. A model description of the thermal cycle unit used during the experiment is shown in Figure 2.

2.3. Differential Scanning Calorimeter (DSC)

DSC was performed with a PerkinElmer DSC 4000 from 0 °C to 60 °C at a scan rate of 2 °C/min with an incessant stream of 20 mL/min of nitrogen. For this, 10 mg of the sample was taken which was measured using a semi-analytical balance having an accuracy of about ±0.00001 g. The sample was then placed on the aluminum pan which acted as a test sample and lowered into the DSC oven adjacent to the reference sample. In the DSC analysis, the difference in the heat flow between the reference and the test sample was recorded as a function of temperature. The accuracy in the temperature and enthalpy measurement was ±0.1 °C, and ±2% respectively [23]. In the DSC analysis, the area under the curve provides the latent heat of fusion and crystallization, and the tangent at the point of highest slope provides the onset melting and freezing point. The point at the maximum heat absorption or release provides the melting or crystallization peak, respectively.

2.4. Thermogravimetric Analysis (TGA)

Thermogravimetric analysis (TGA) was performed using a Linseis PT1000 instrument from an ambient temperature to 400 °C at a scan rate of 10 °C/min with a stream of 50 mL/min of nitrogen. For TGA analysis 20 mg of the sample was taken in a crucible and placed in the TGA furnace. The temperature was then gradually raised. The mass loss was recorded as a function of temperature. The instrument had a resolution of 5 µg.

2.5. Fourier Transform Infrared Spectroscopy (FTIR)

The FTIR was performed using a PerkinElmer Spectrum Two FTIR Spectrometer. The sample can be used either in a solid or thin-film form. For recording the data, the ATR mode was used. The equipment was equipped with a PIKE MIRacle single reflection horizontal ATR accessory fitted with a ZnSe ATR crystal.

3. Results and Discussion

3.1. DSC Analysis

The thermophysical properties viz. MT, FT, LHF, LHC of all crude fatty acids were measured using the DSC technique and are presented in Table 1.
Originally, 54 samples were prepared with the series codes CA-LA-MA, CA-LA-PA, CA-LA-SA, CA-MA-PA, CA-MA-SA, and CA-PA-SA, each having a different weight composition. Only 28 samples were found promising after DSC analysis. The thermophysical properties viz. MT and LHF are presented in Table 2. After the preliminary investigation, the cycle testing of the material was performed which was essential to confirm any variation in MT and LHF after repeated exposure to continuous melt/freeze cycles. The cycle testing mimics the thermal system where the PCM is placed and undergoes at least one melt/freeze cycle during the entire day. This is essential for the long-term stability and effective utility of the PCM material in any thermal system. For this purpose, 300 accelerated thermal cycles were performed. The obtained result viz. onset, peak and LHF at each interval of 50 cycles were noted and presented in Table 3, Table 4, Table 5, Table 6, Table 7, Table 8, Table 9, Table 10, Table 11 and Table 12.

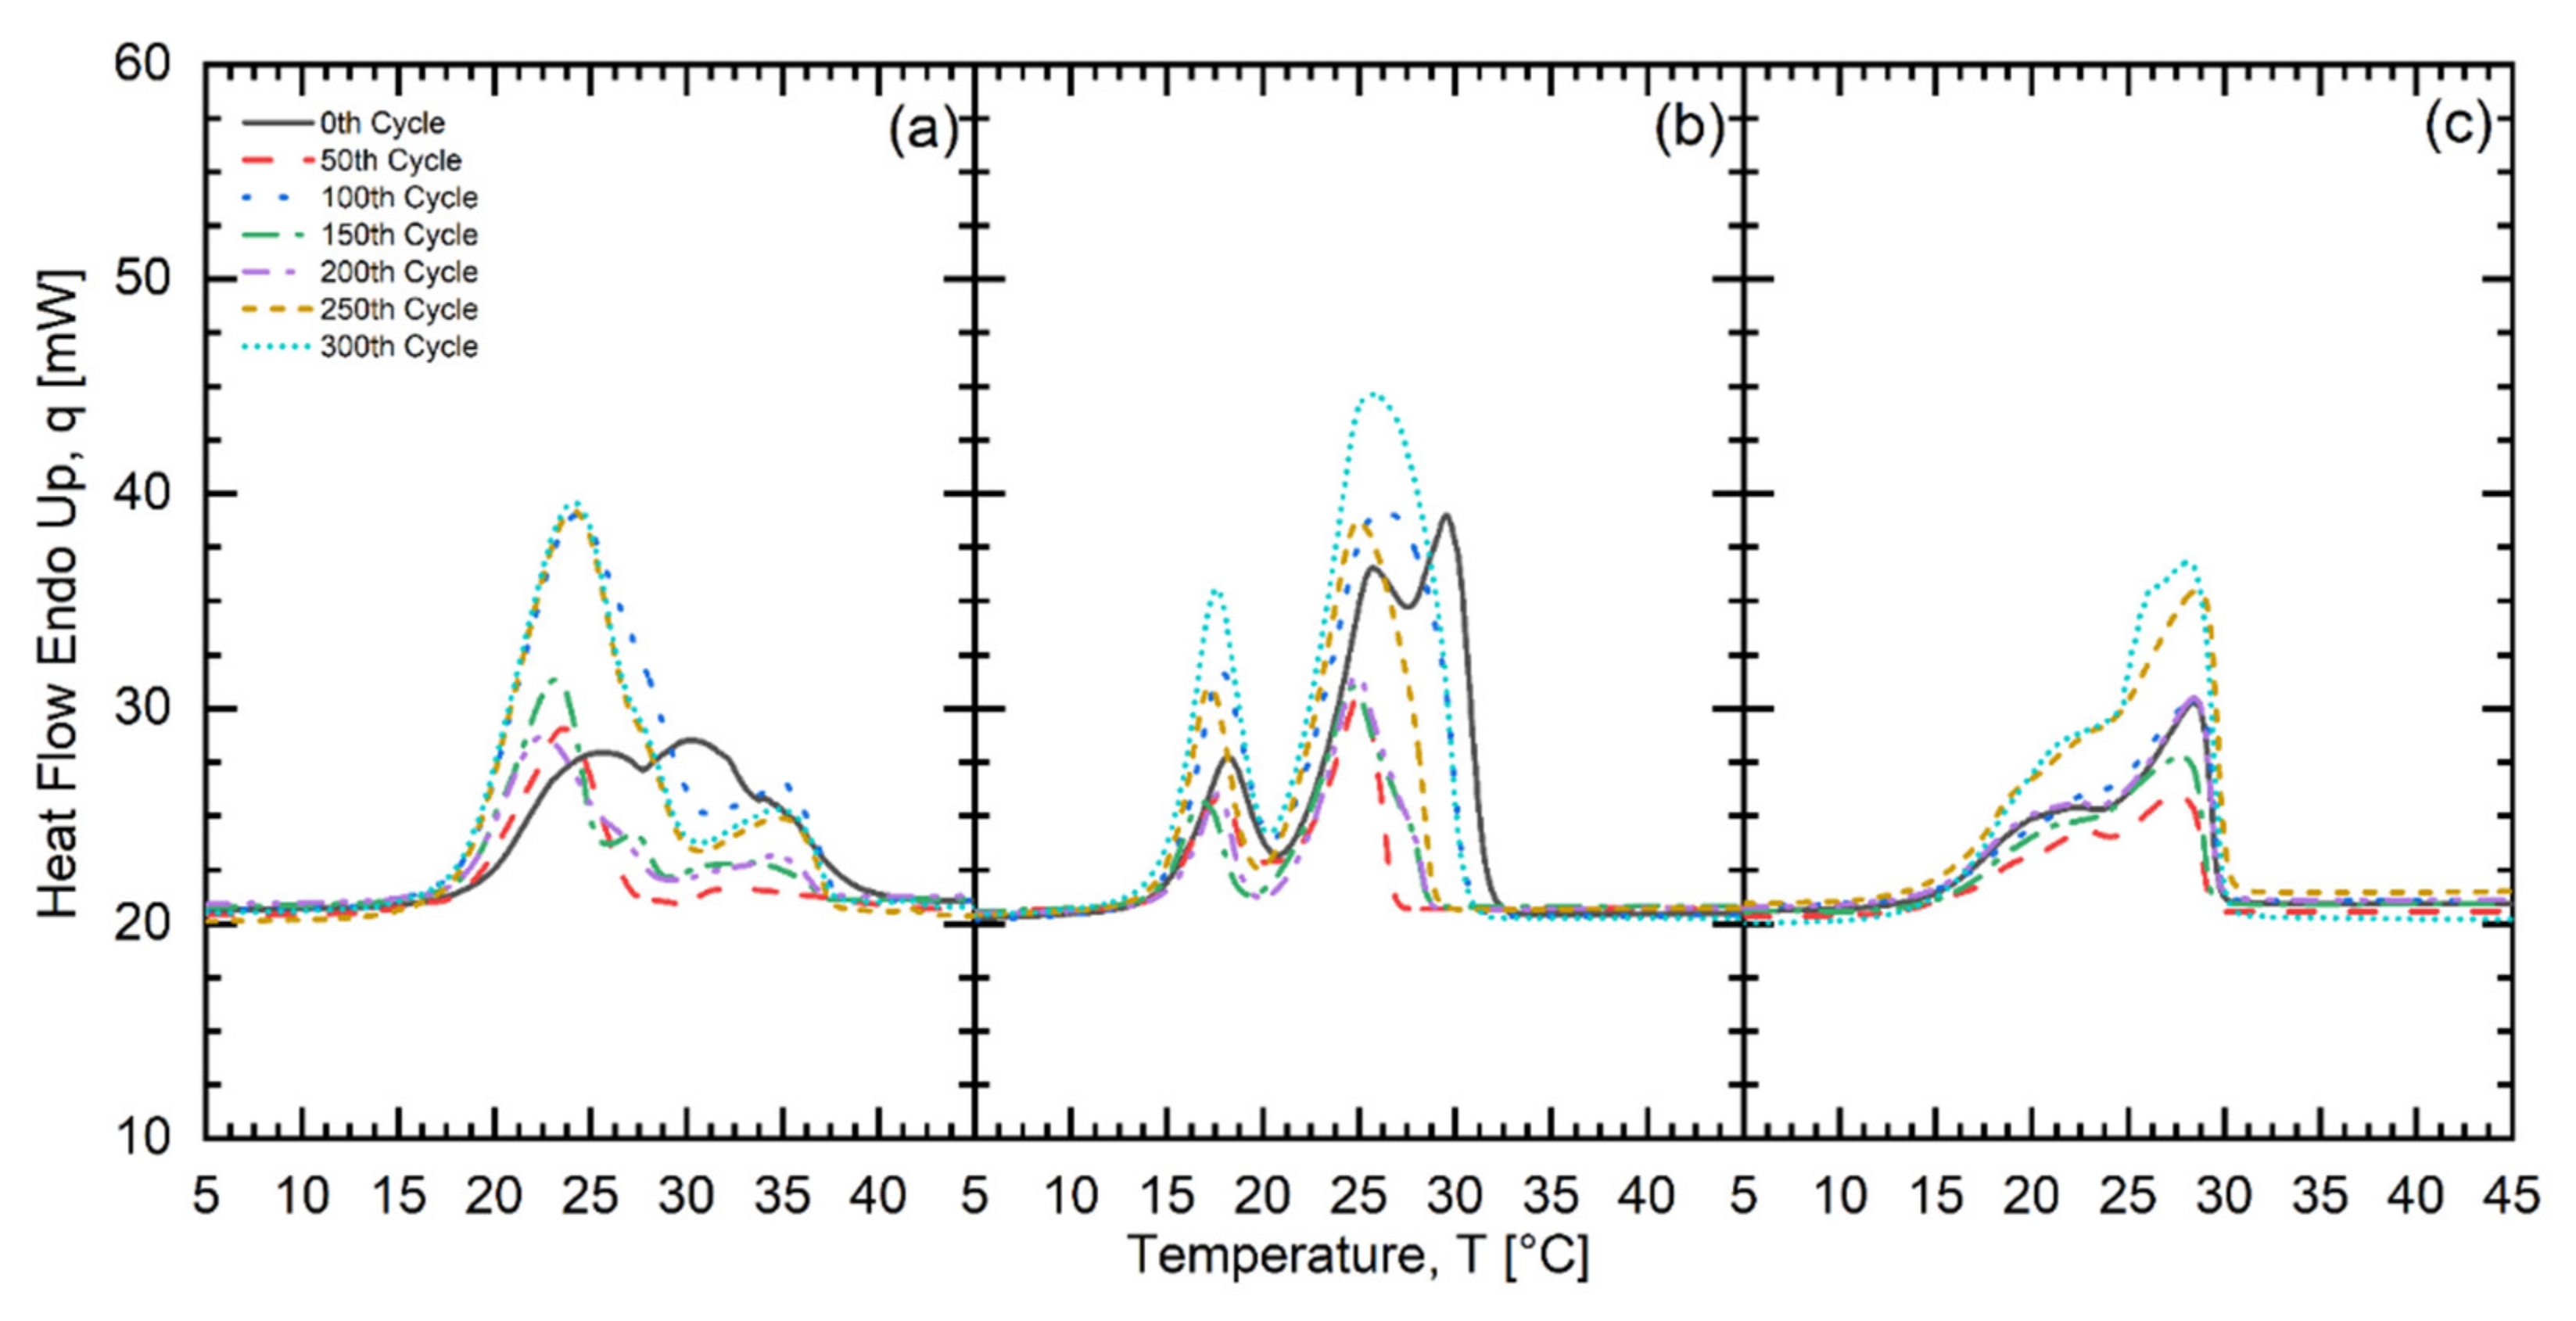
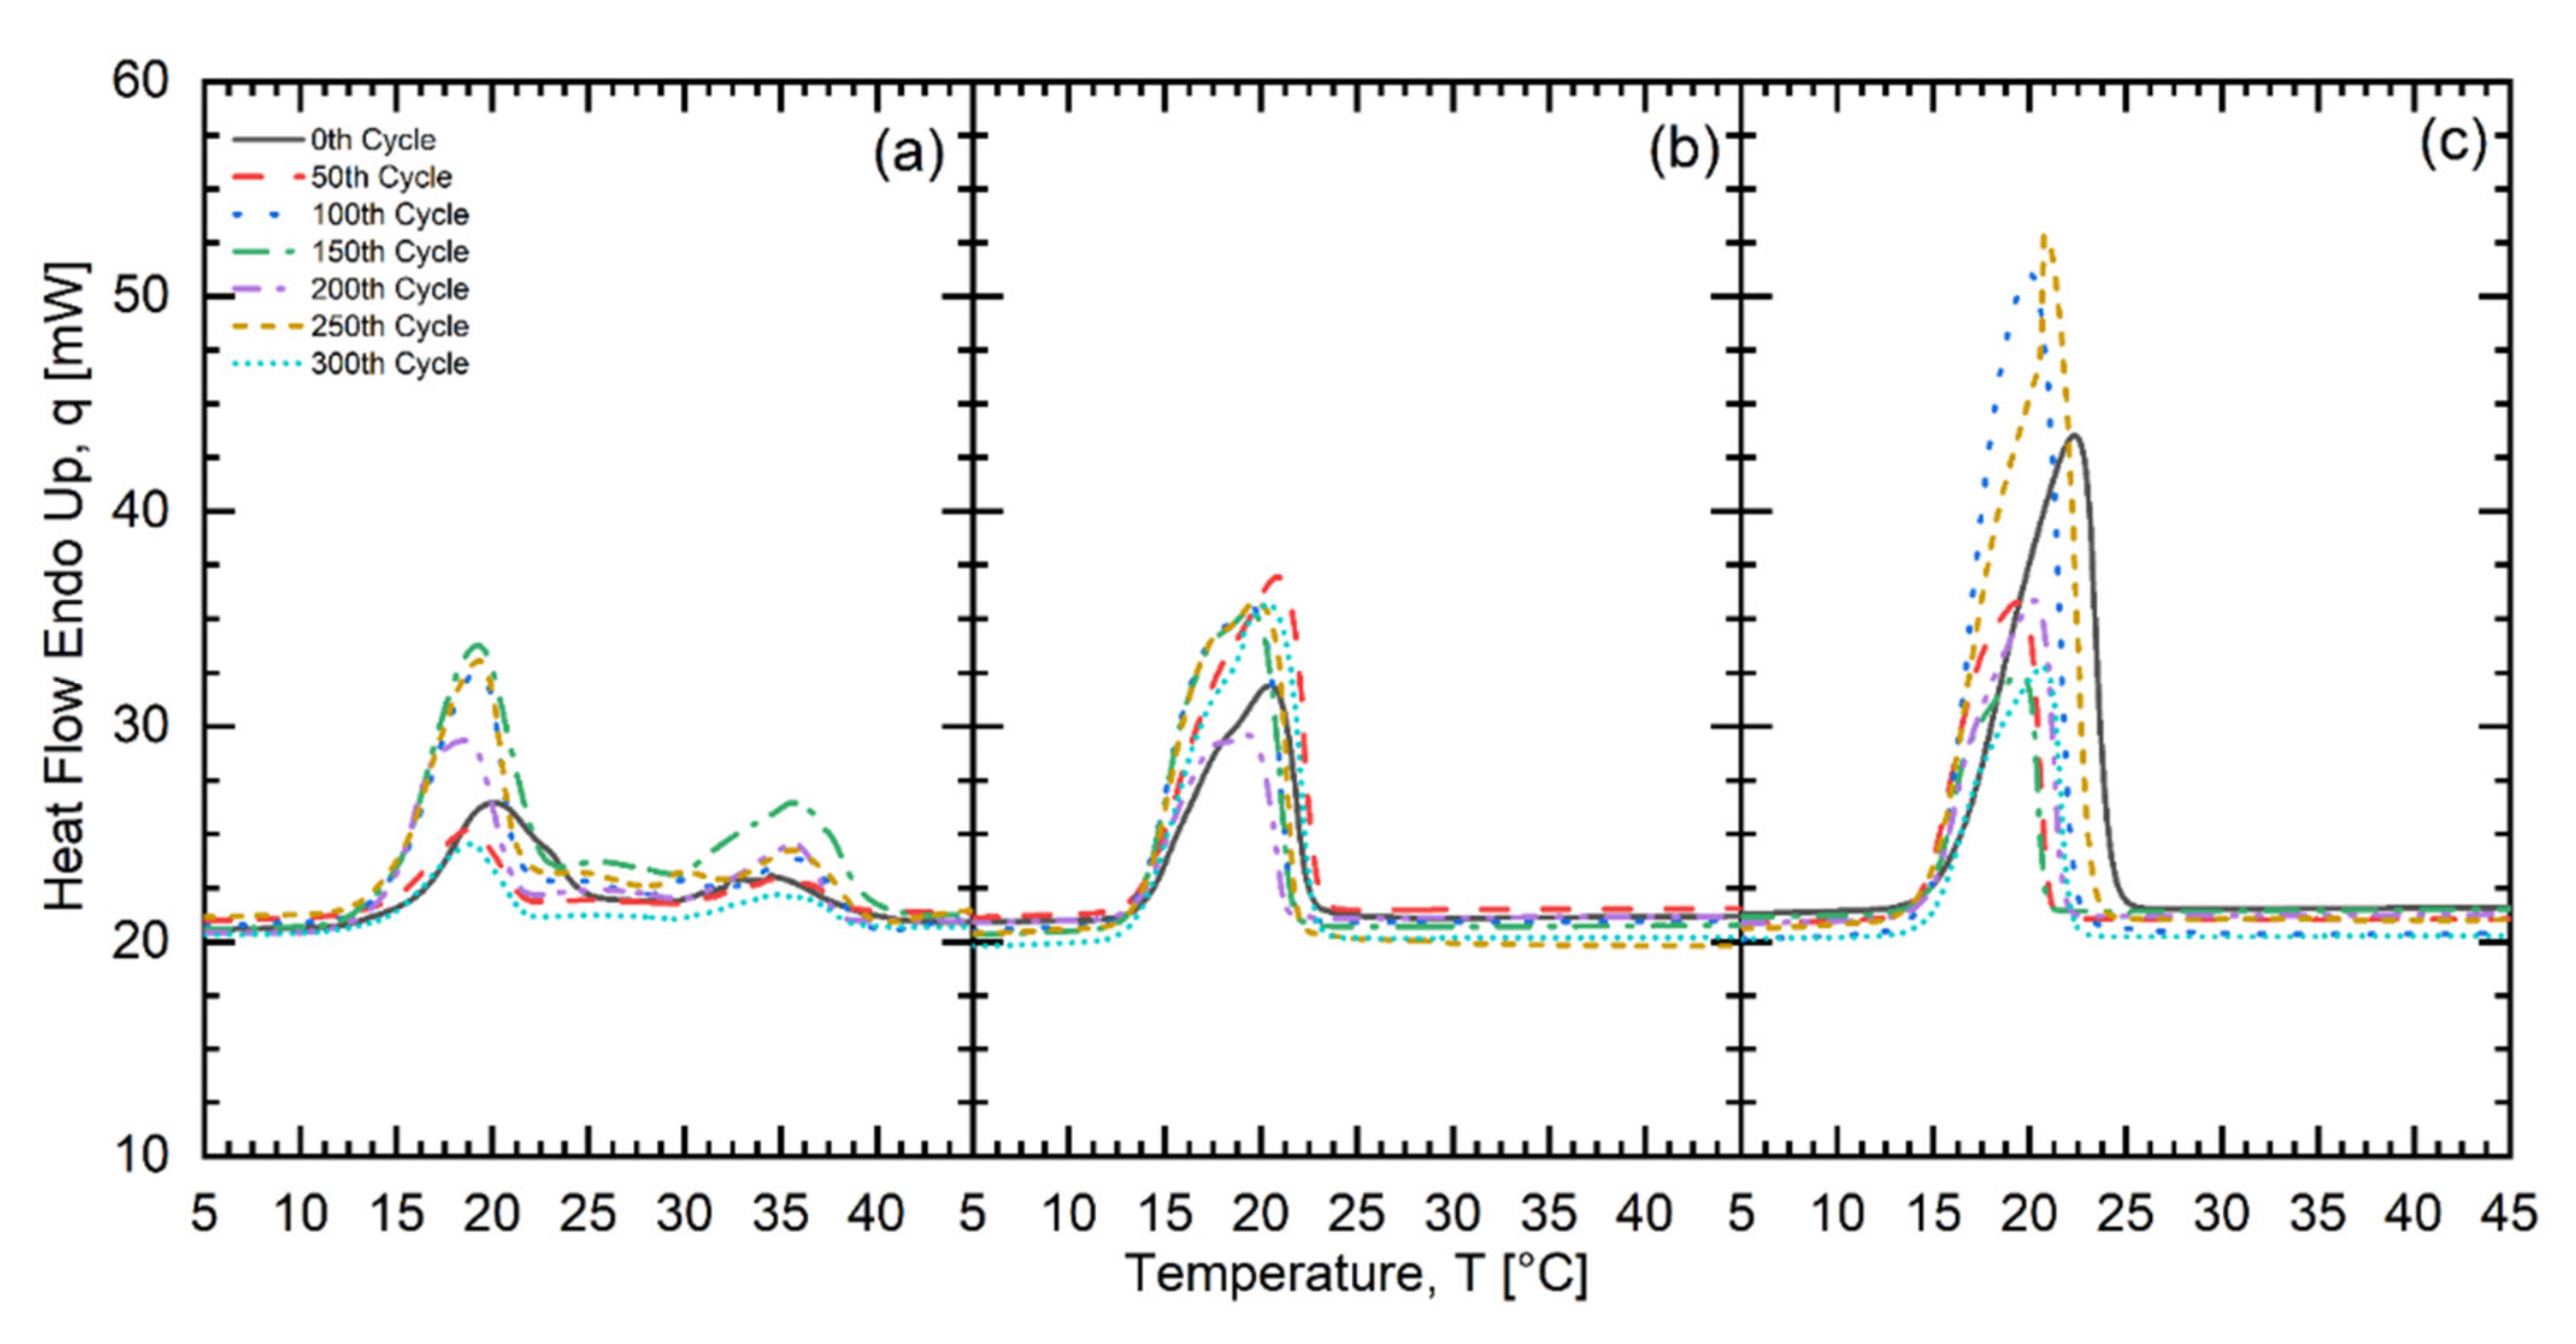
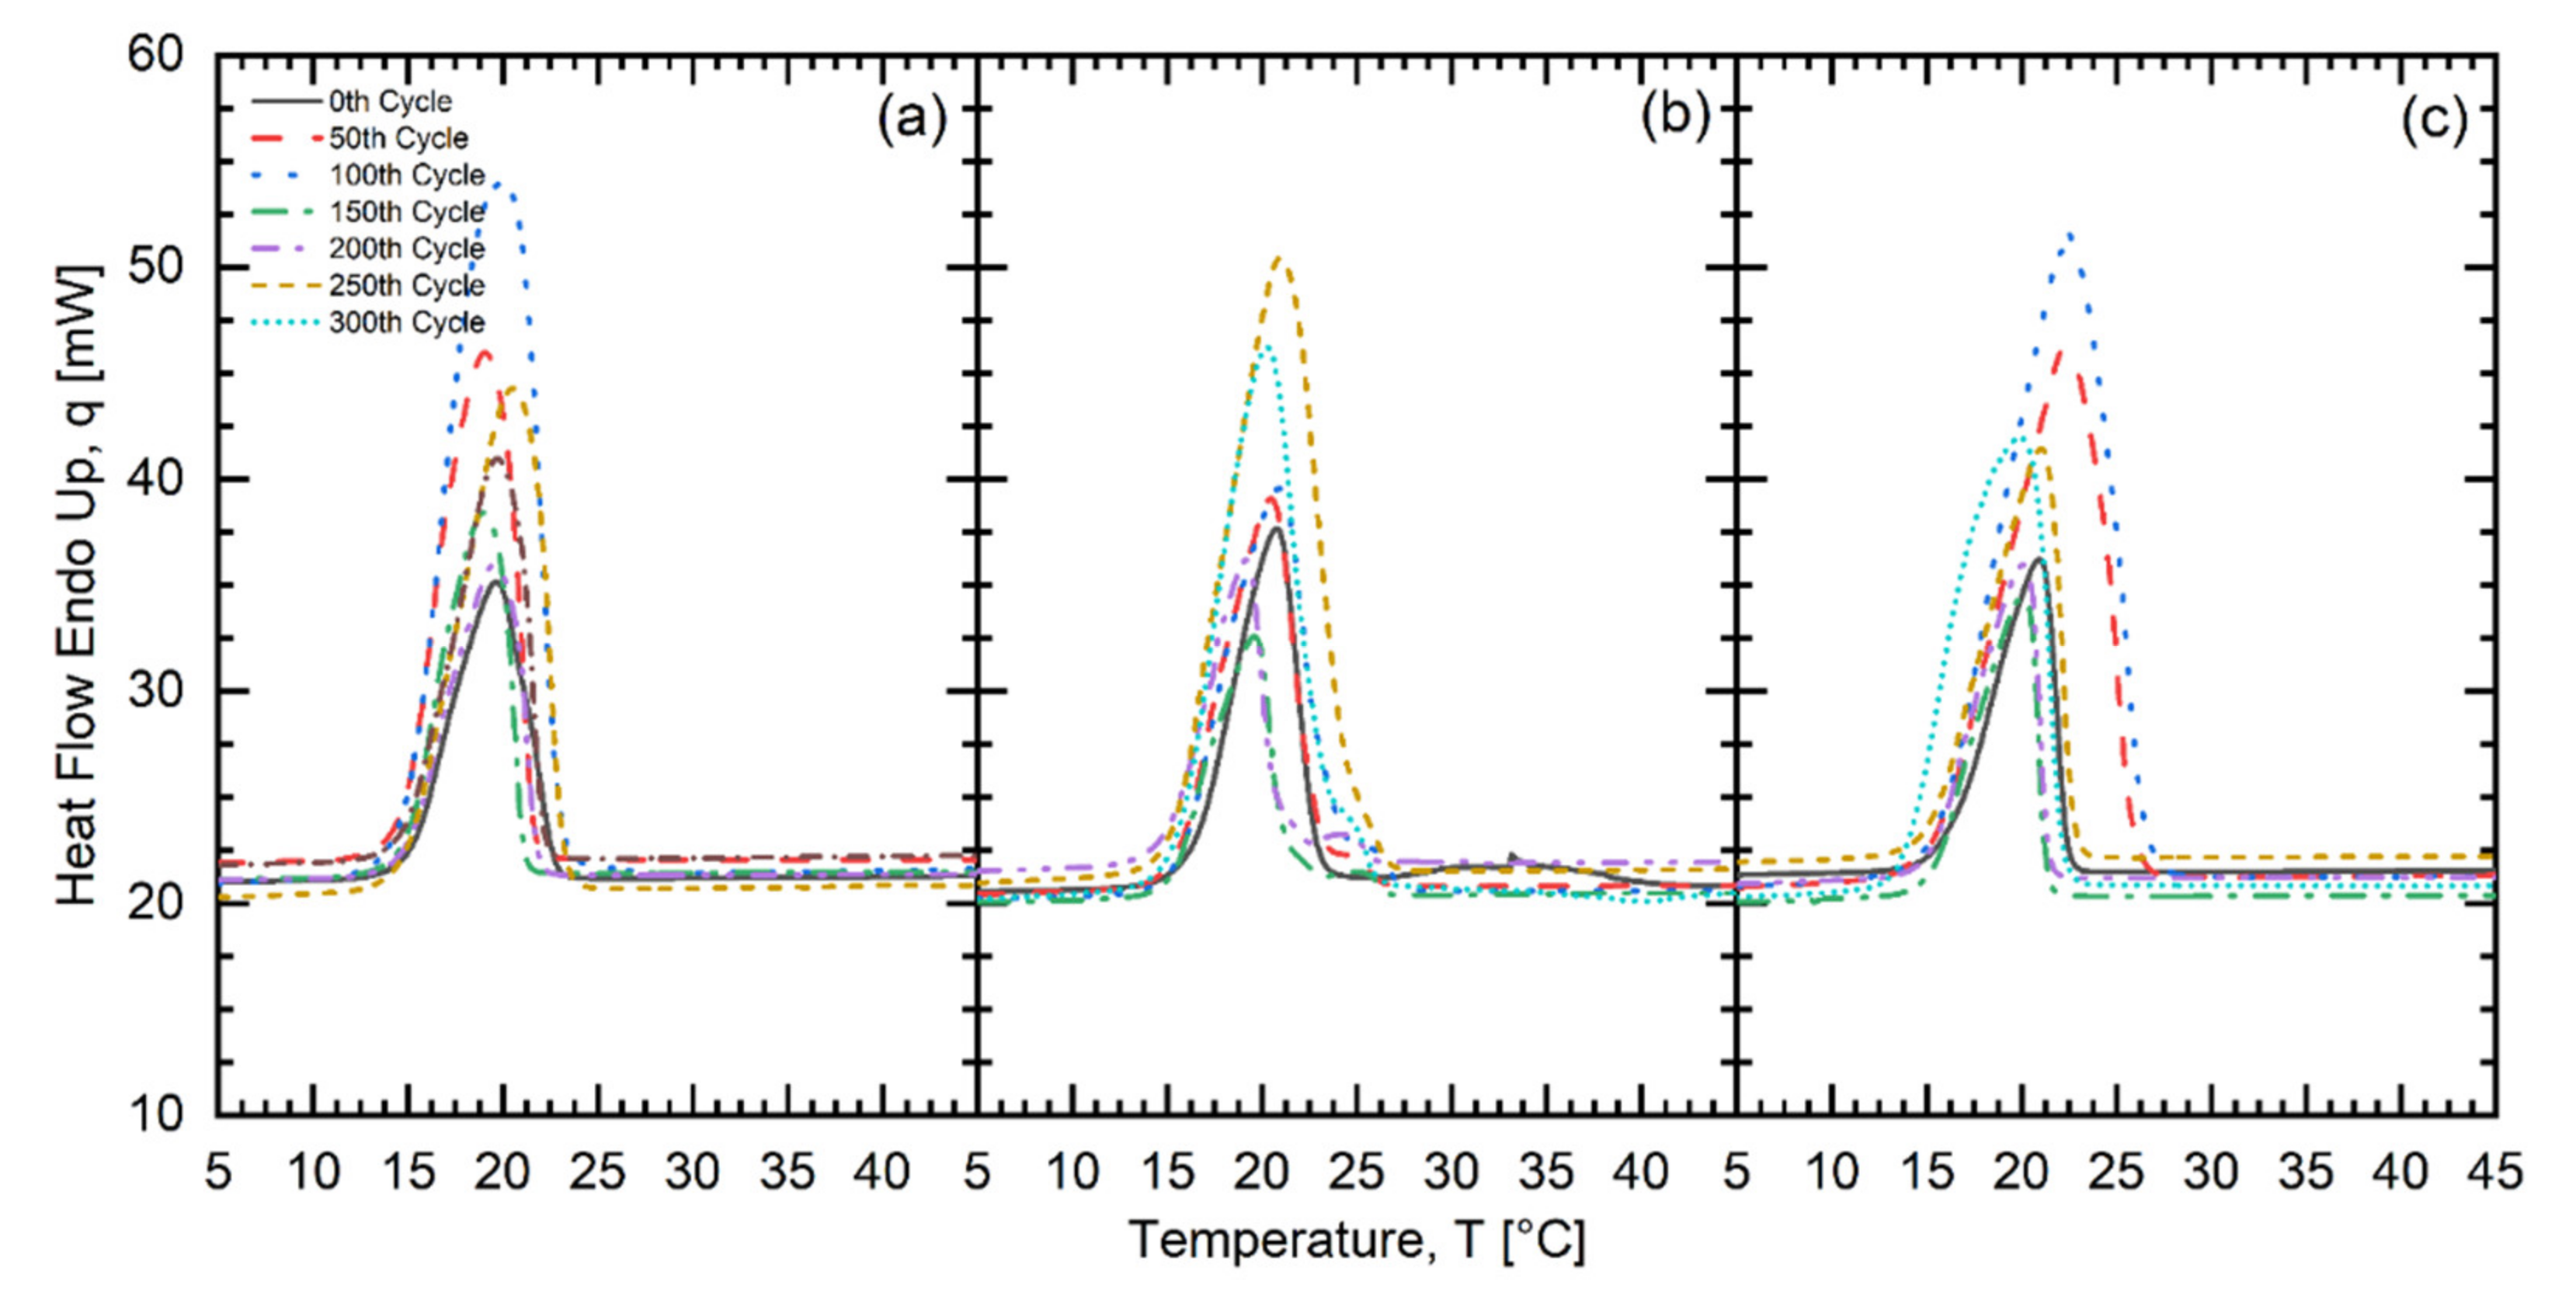
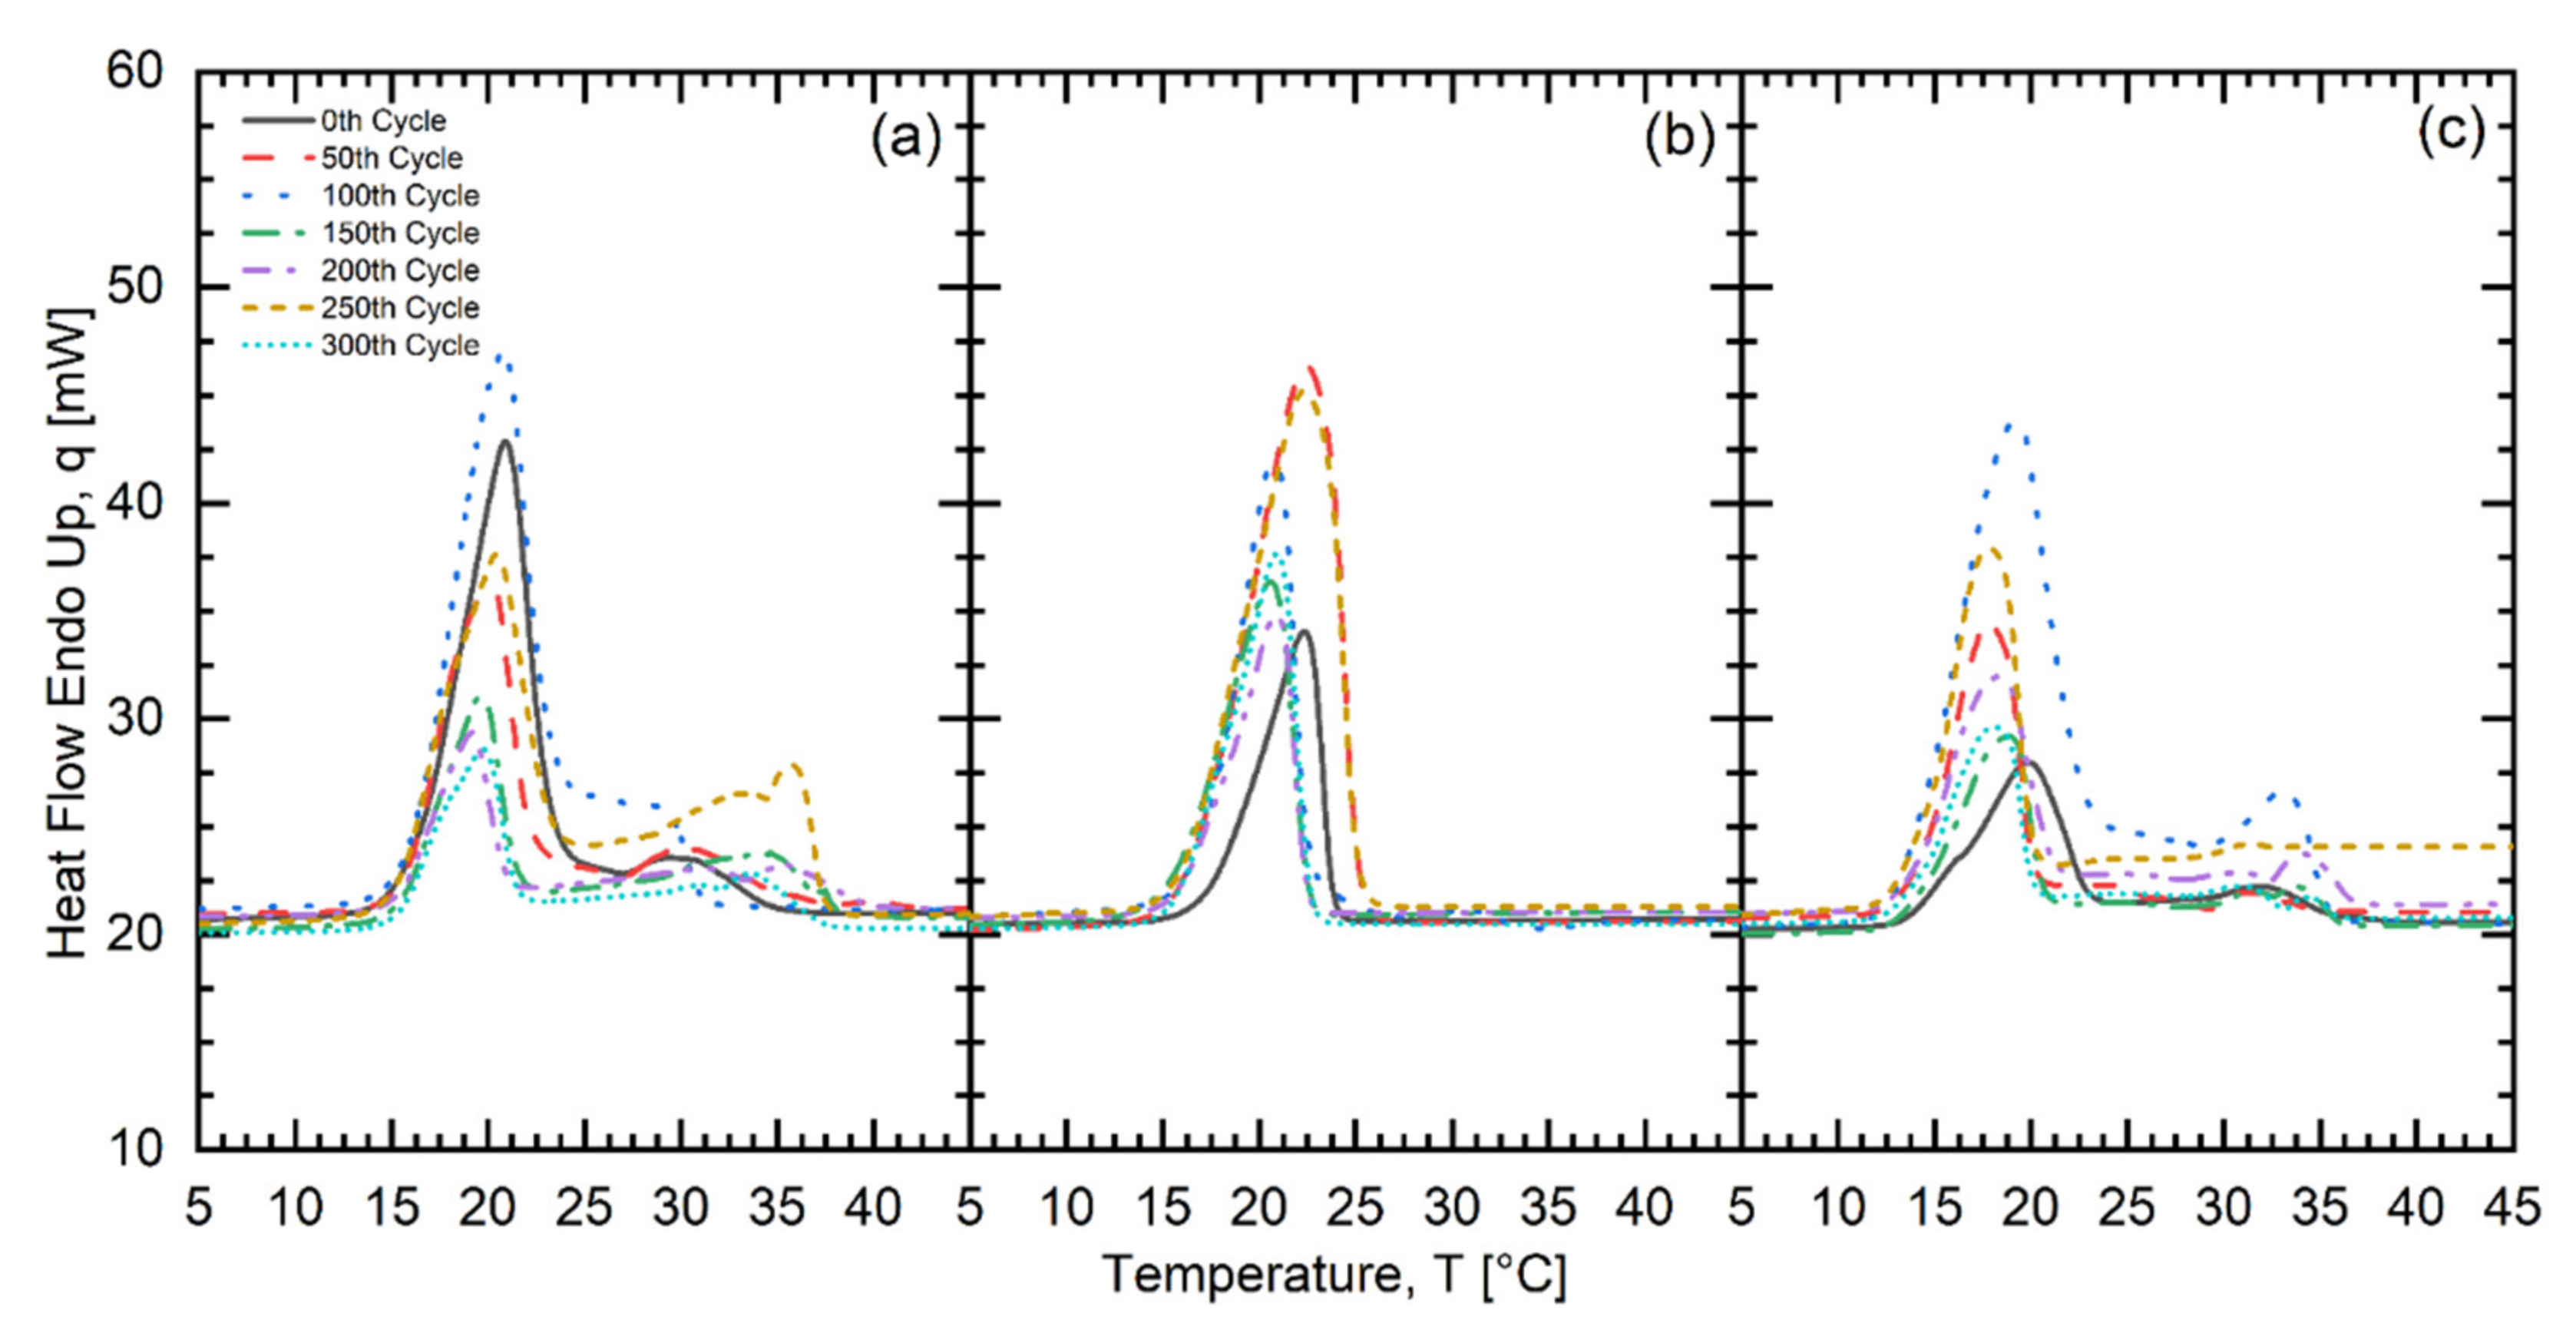
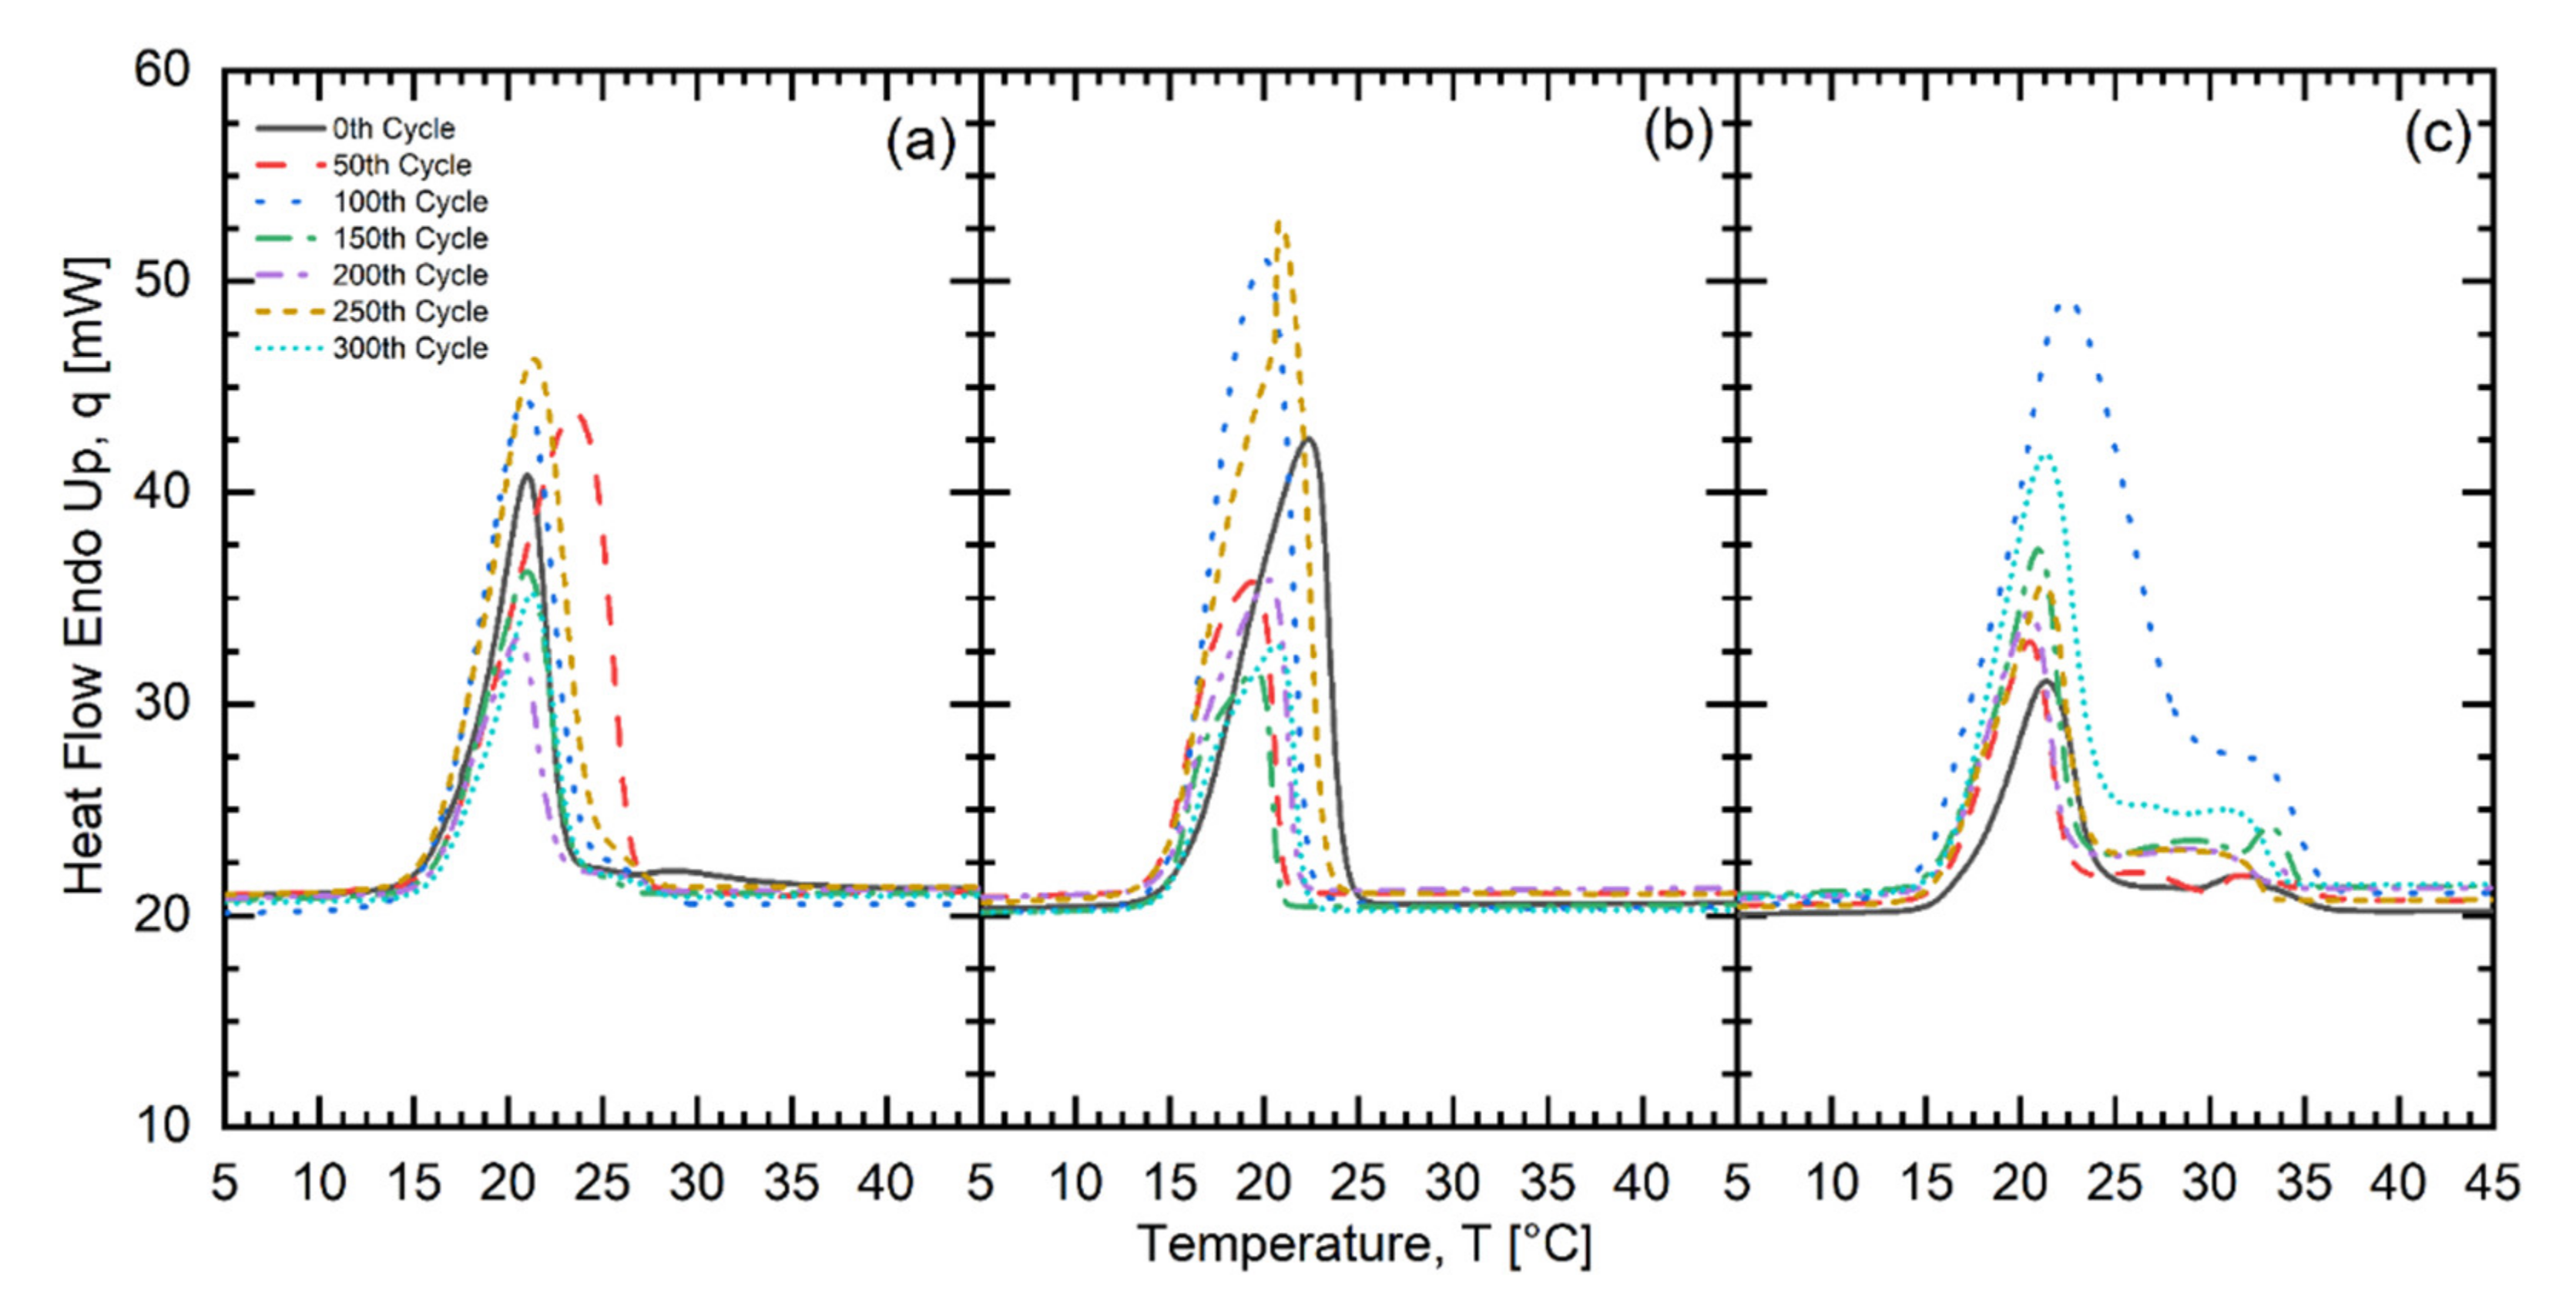
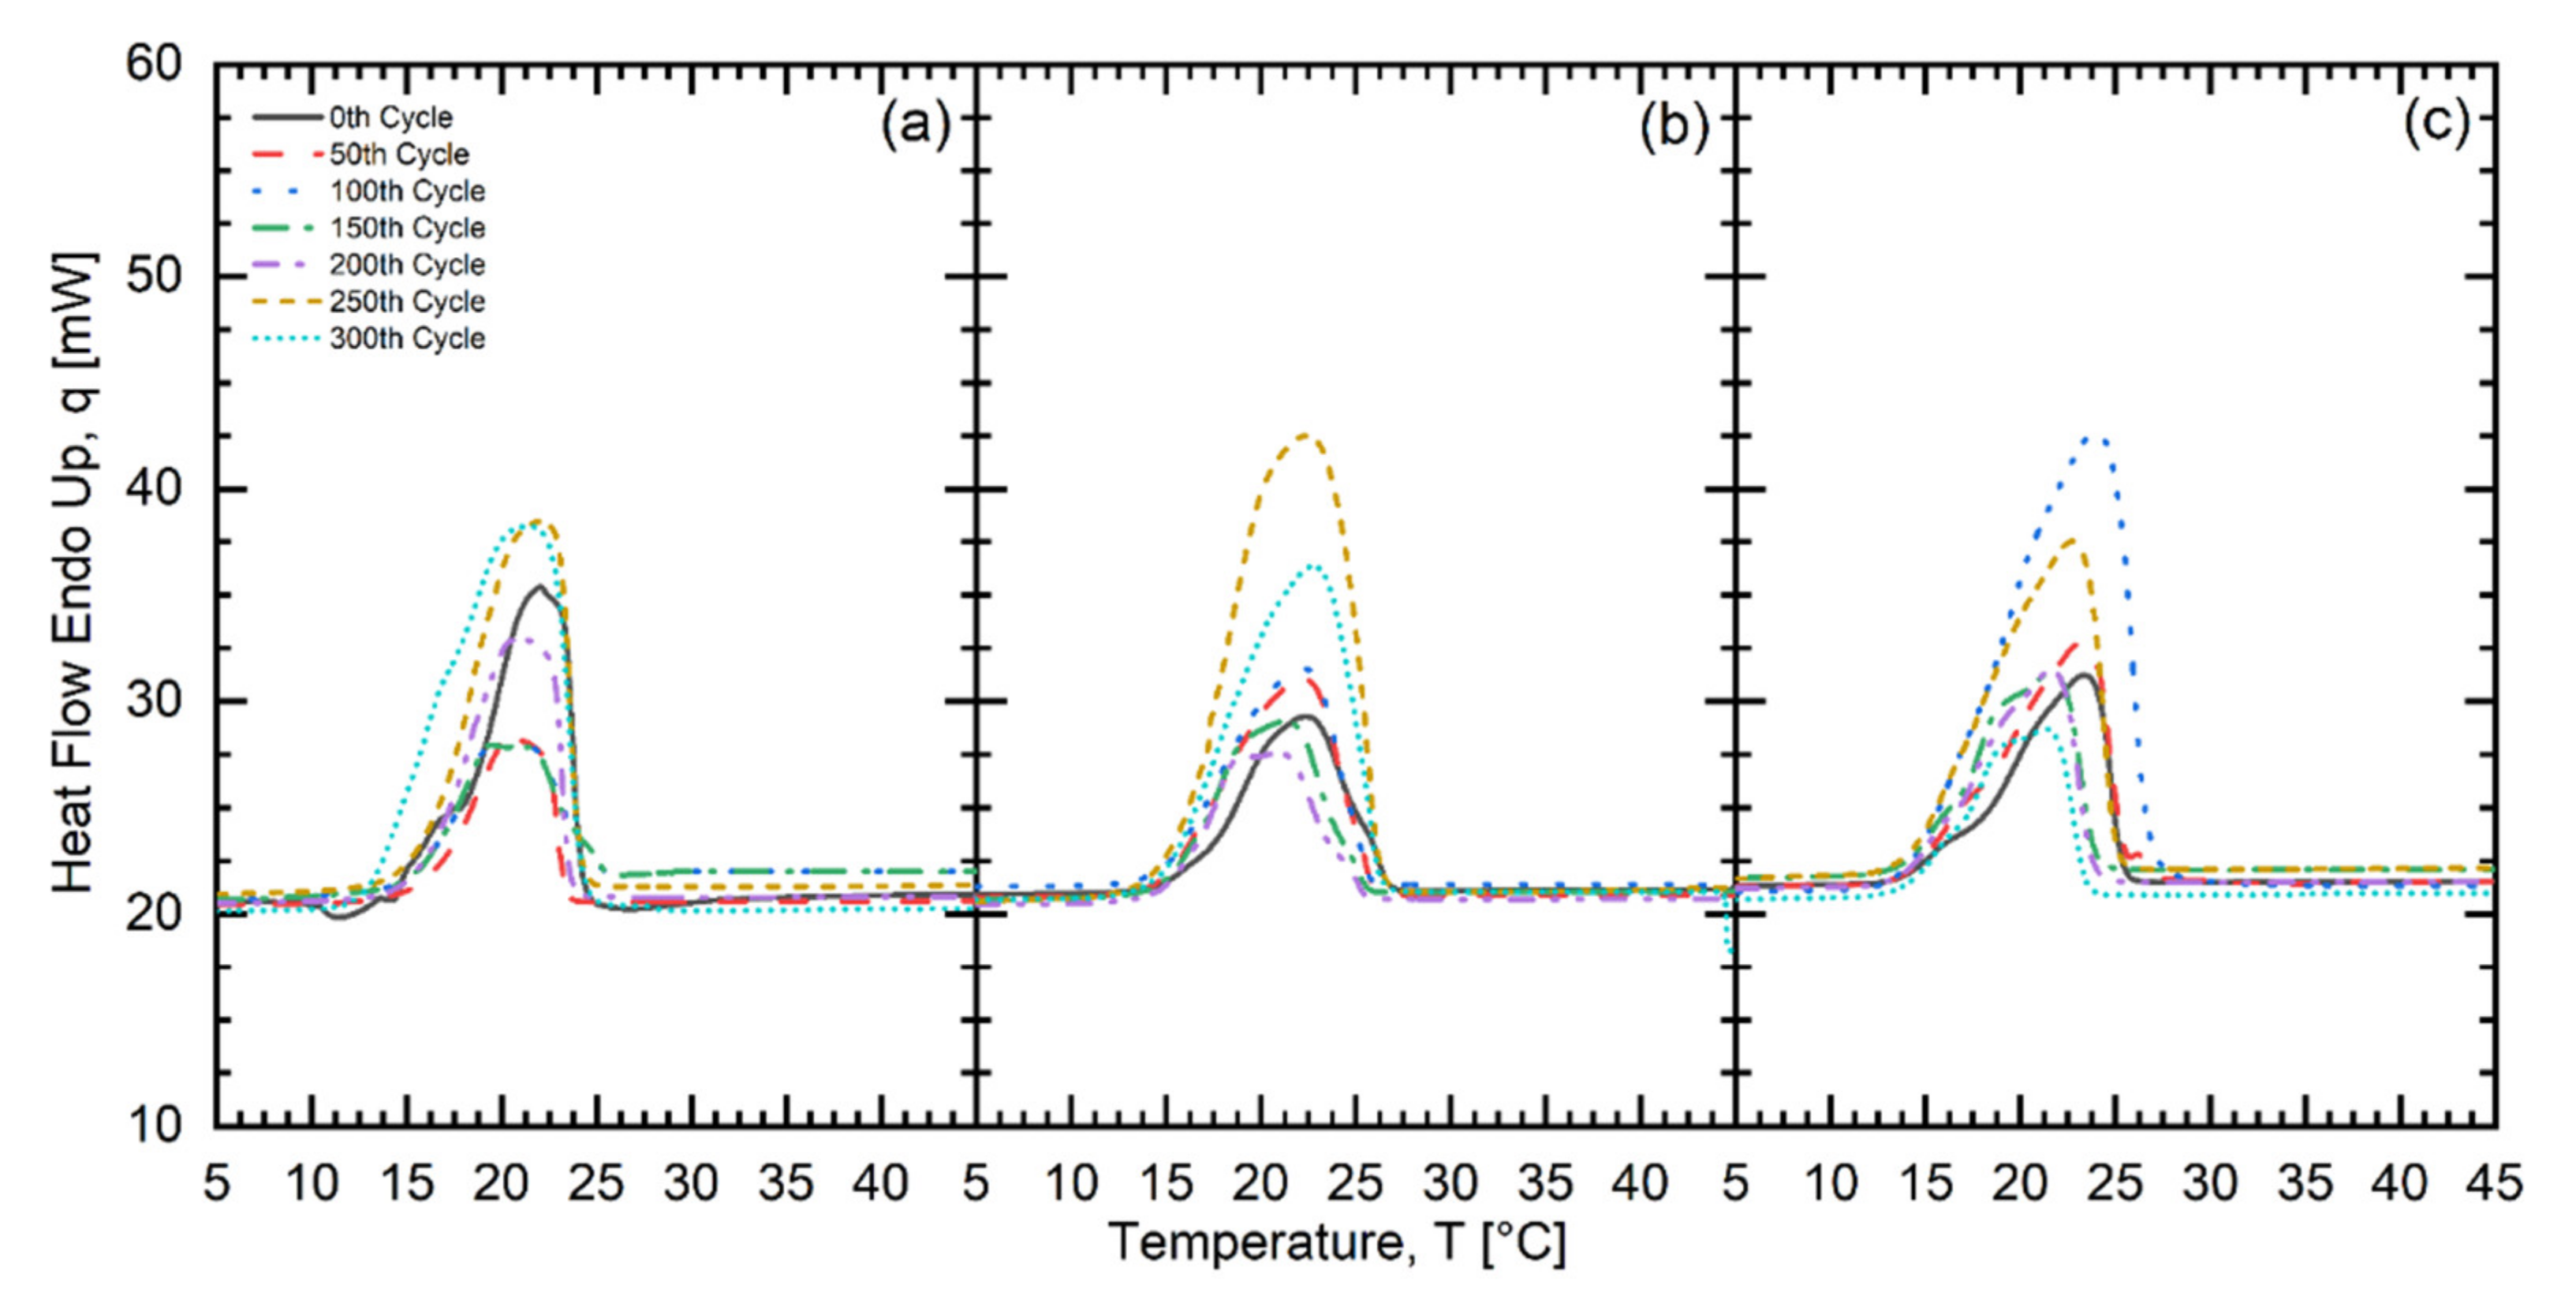
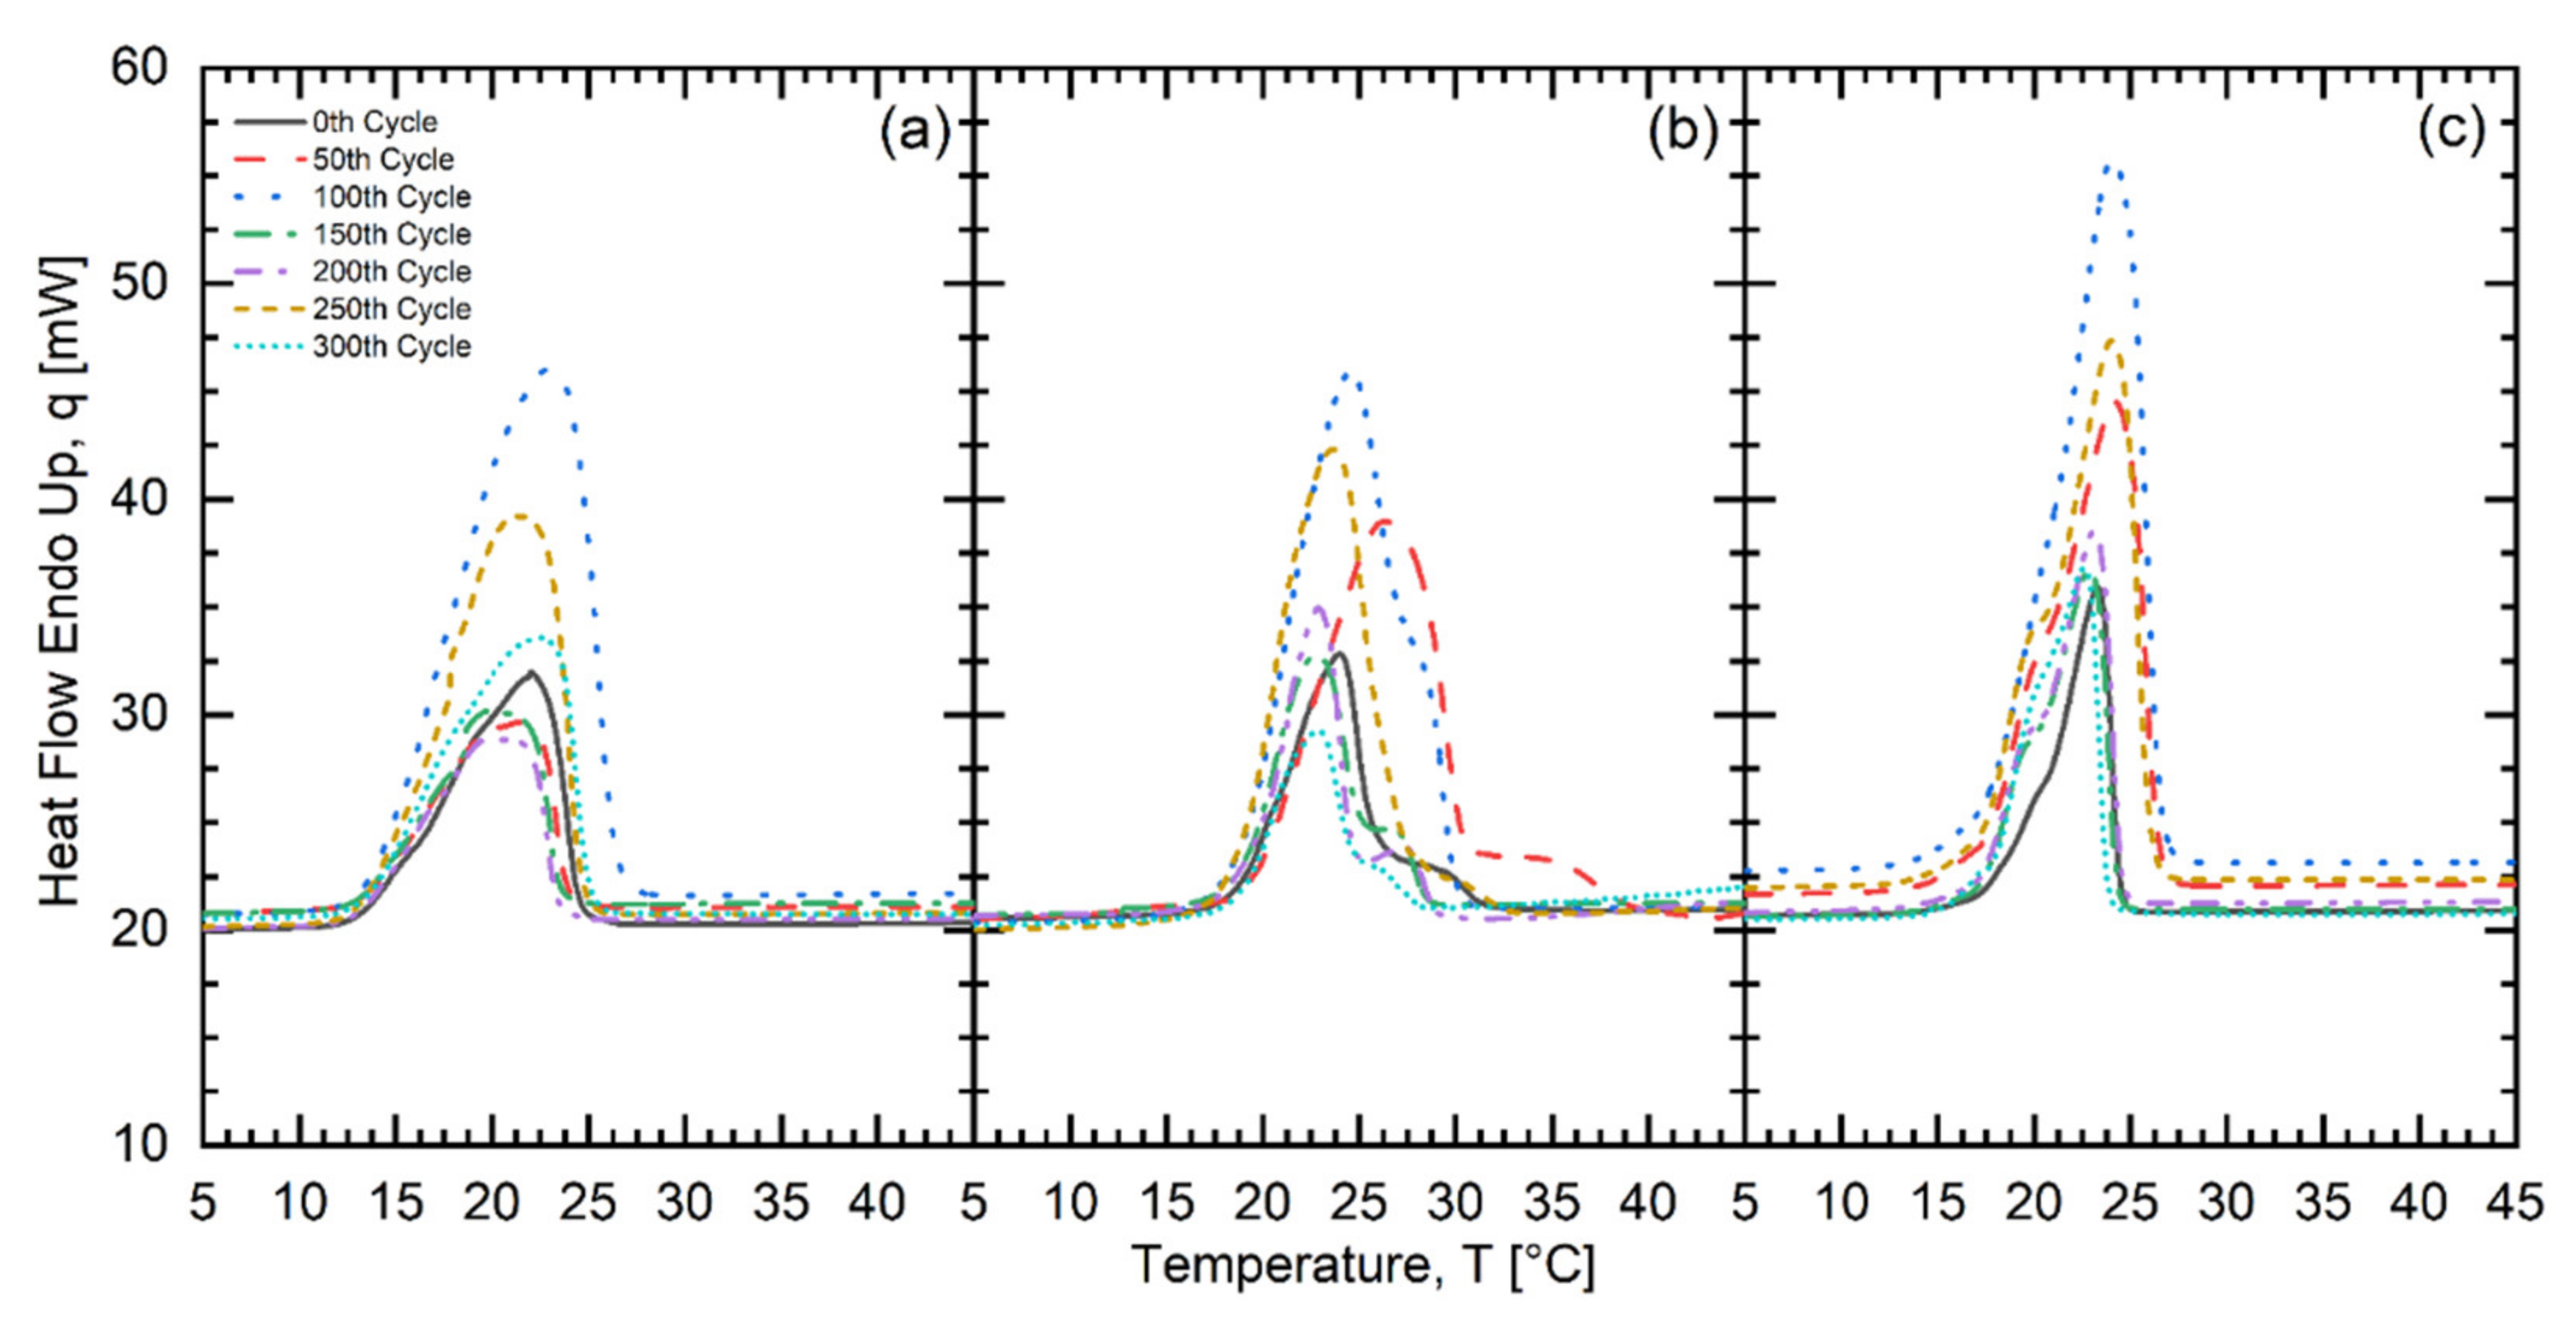
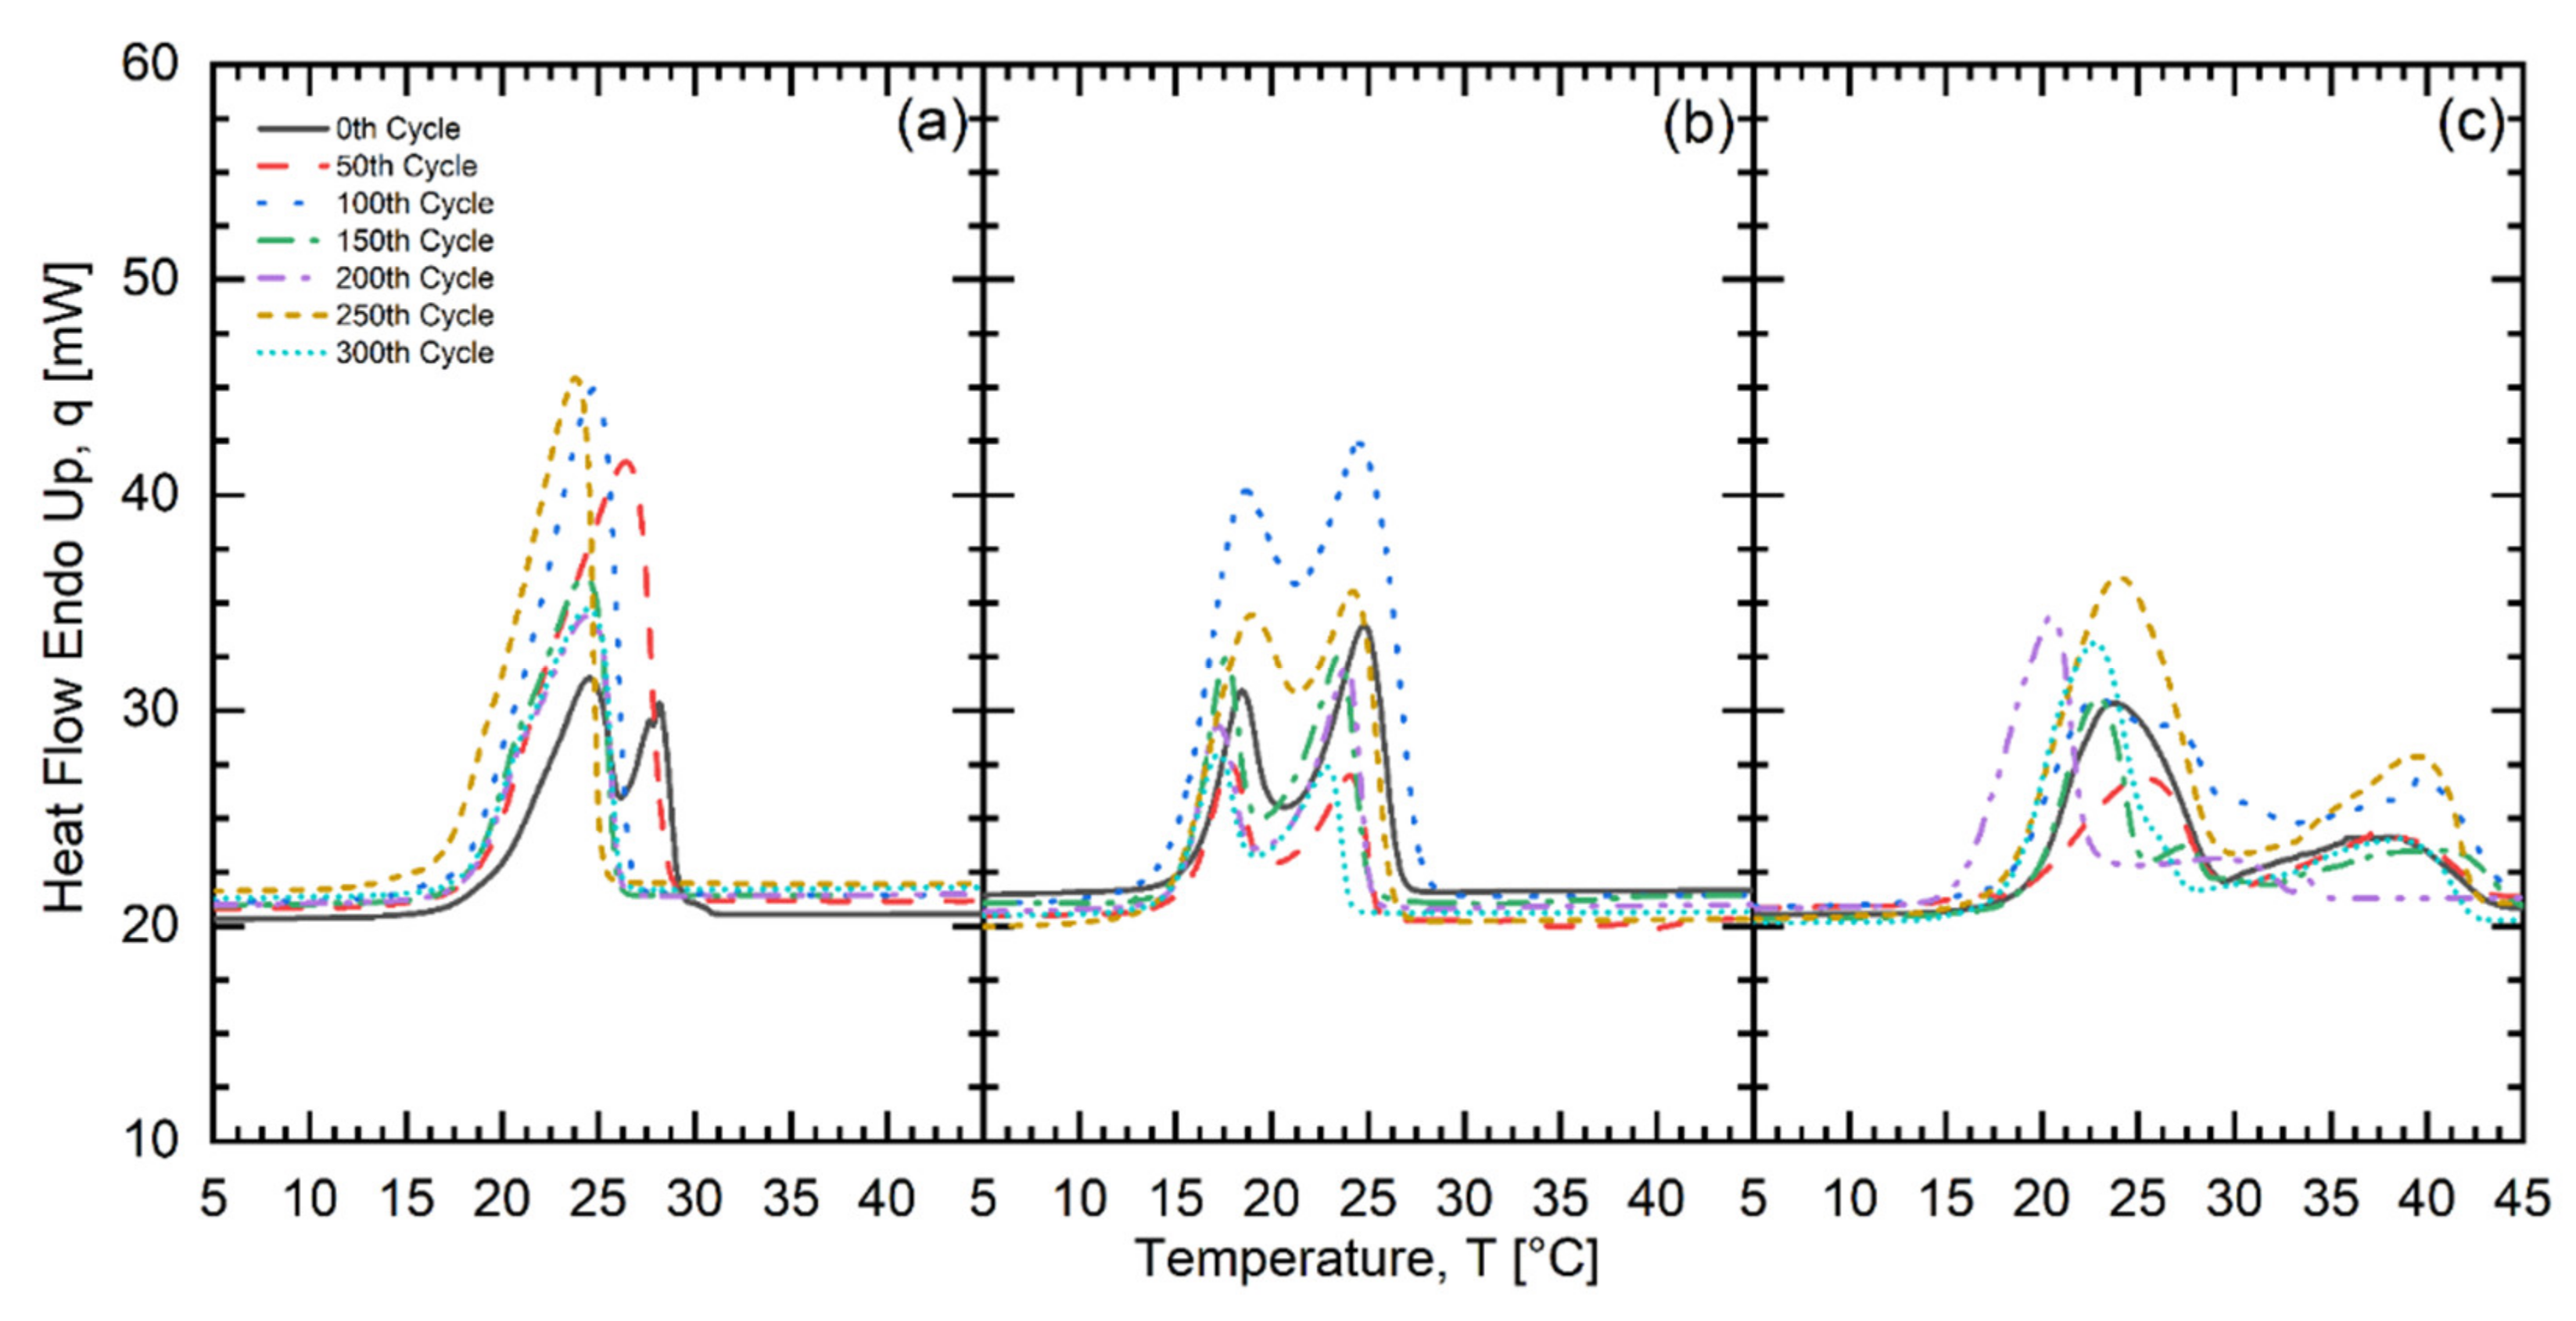
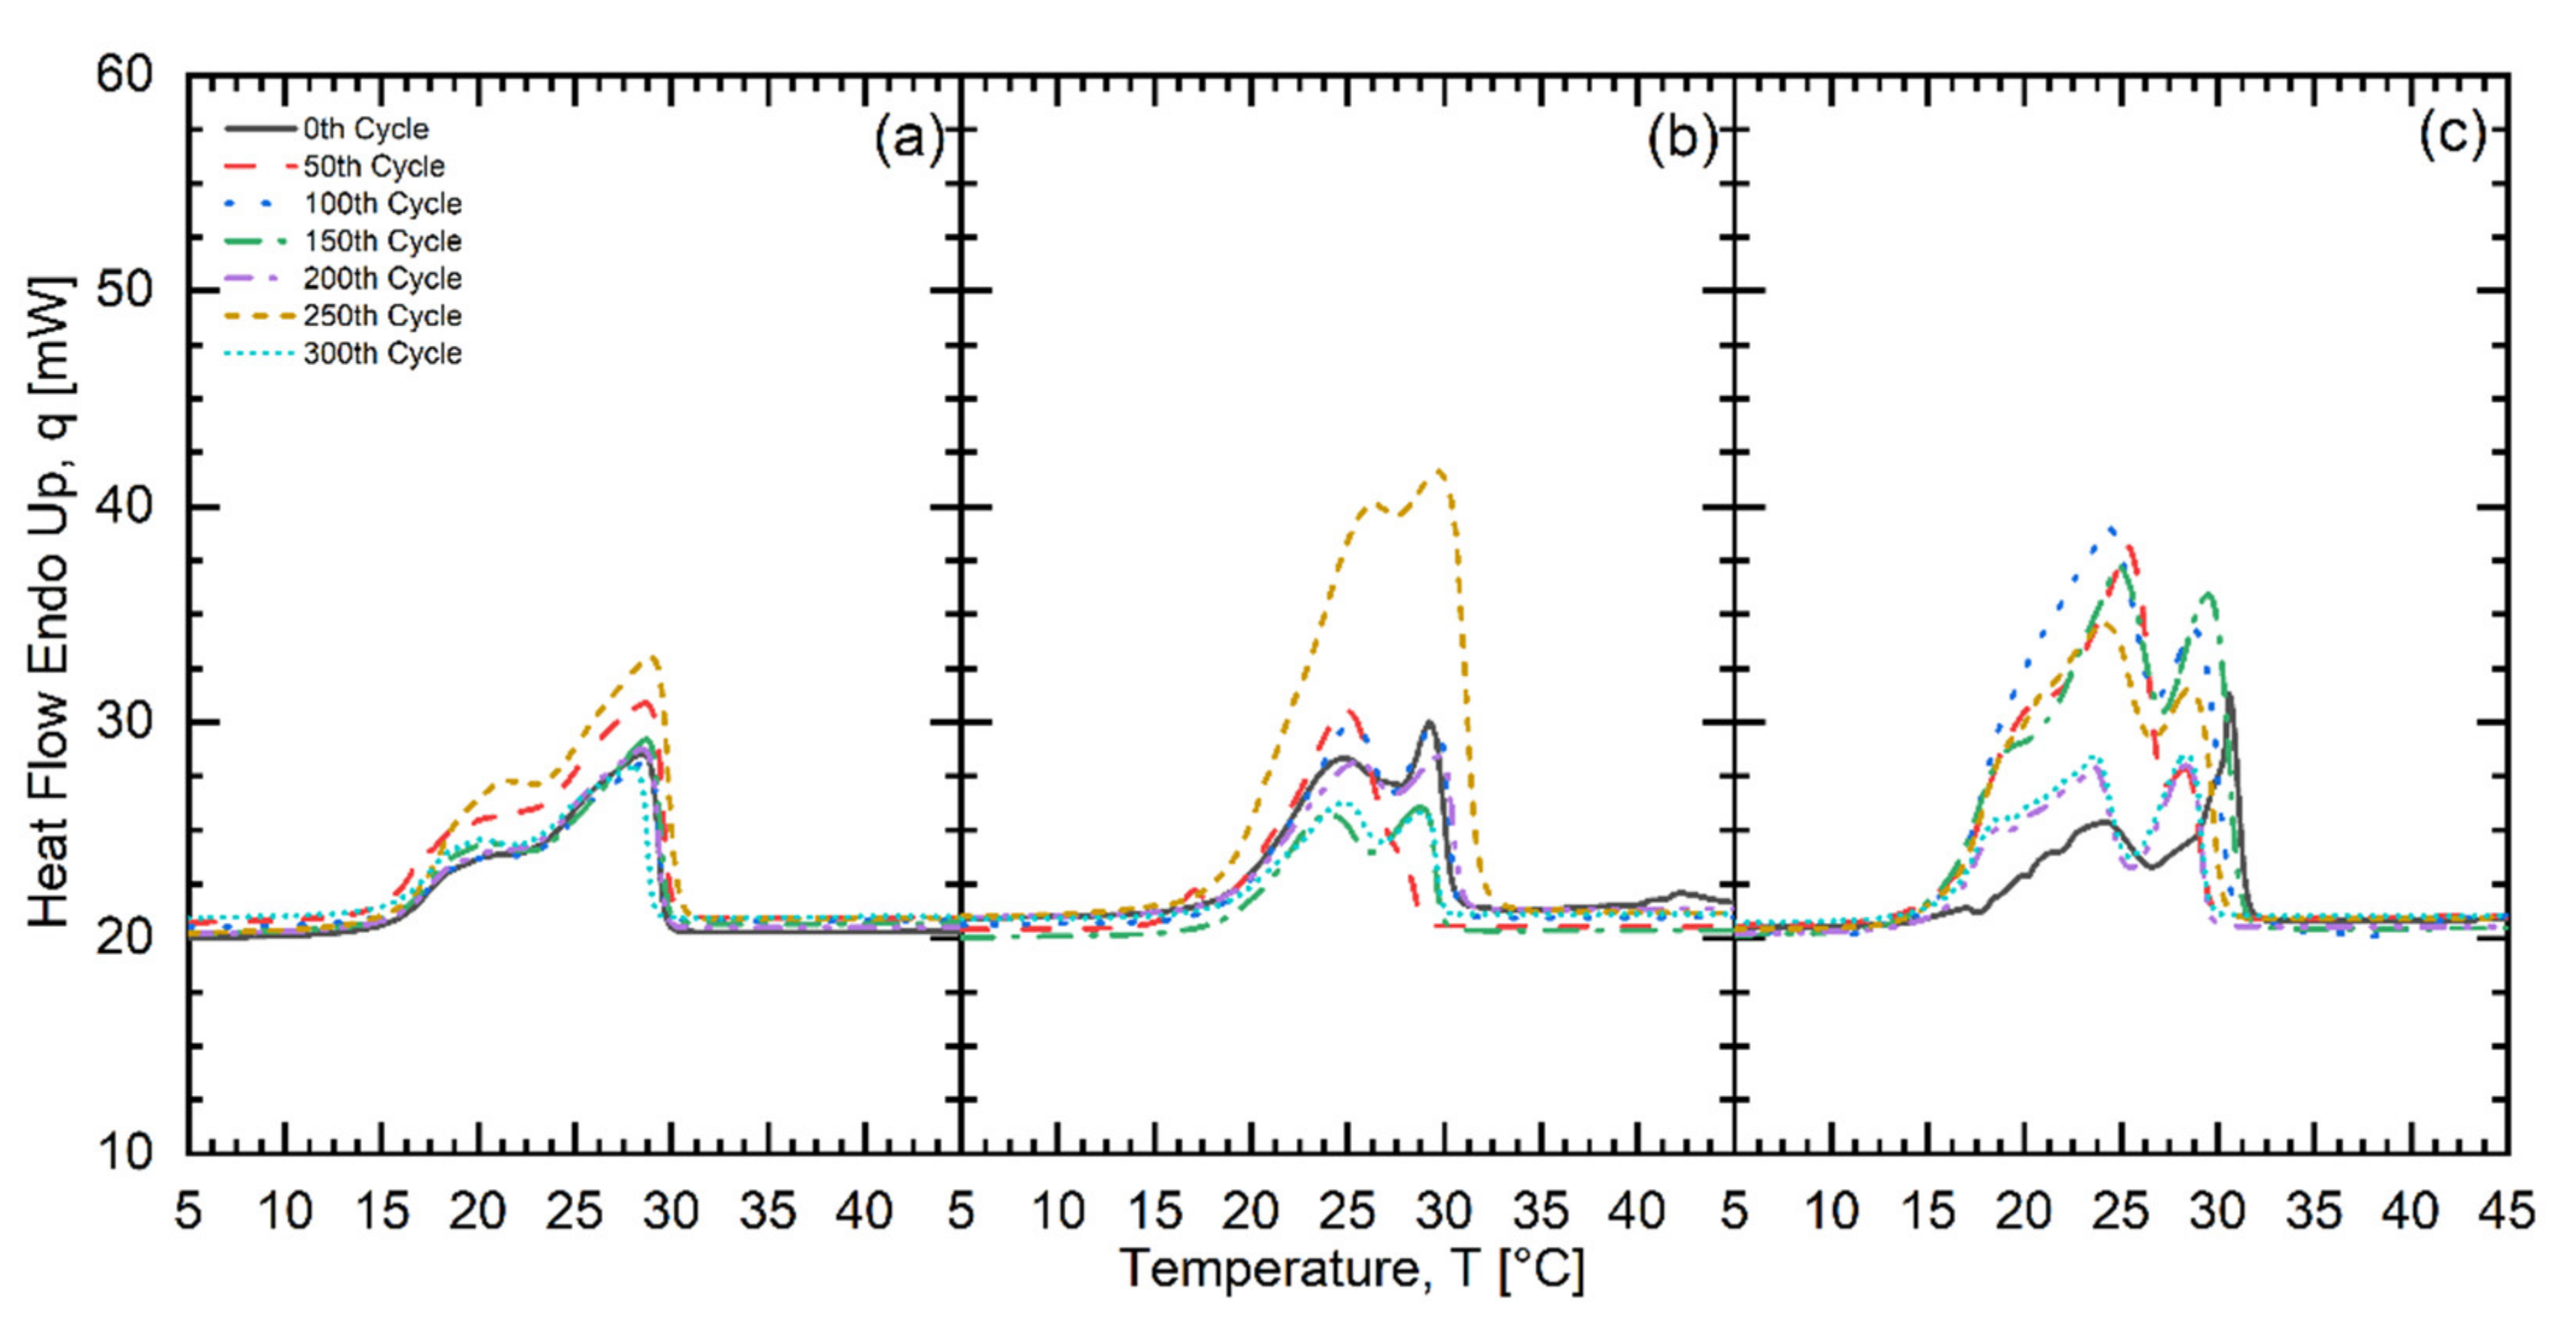
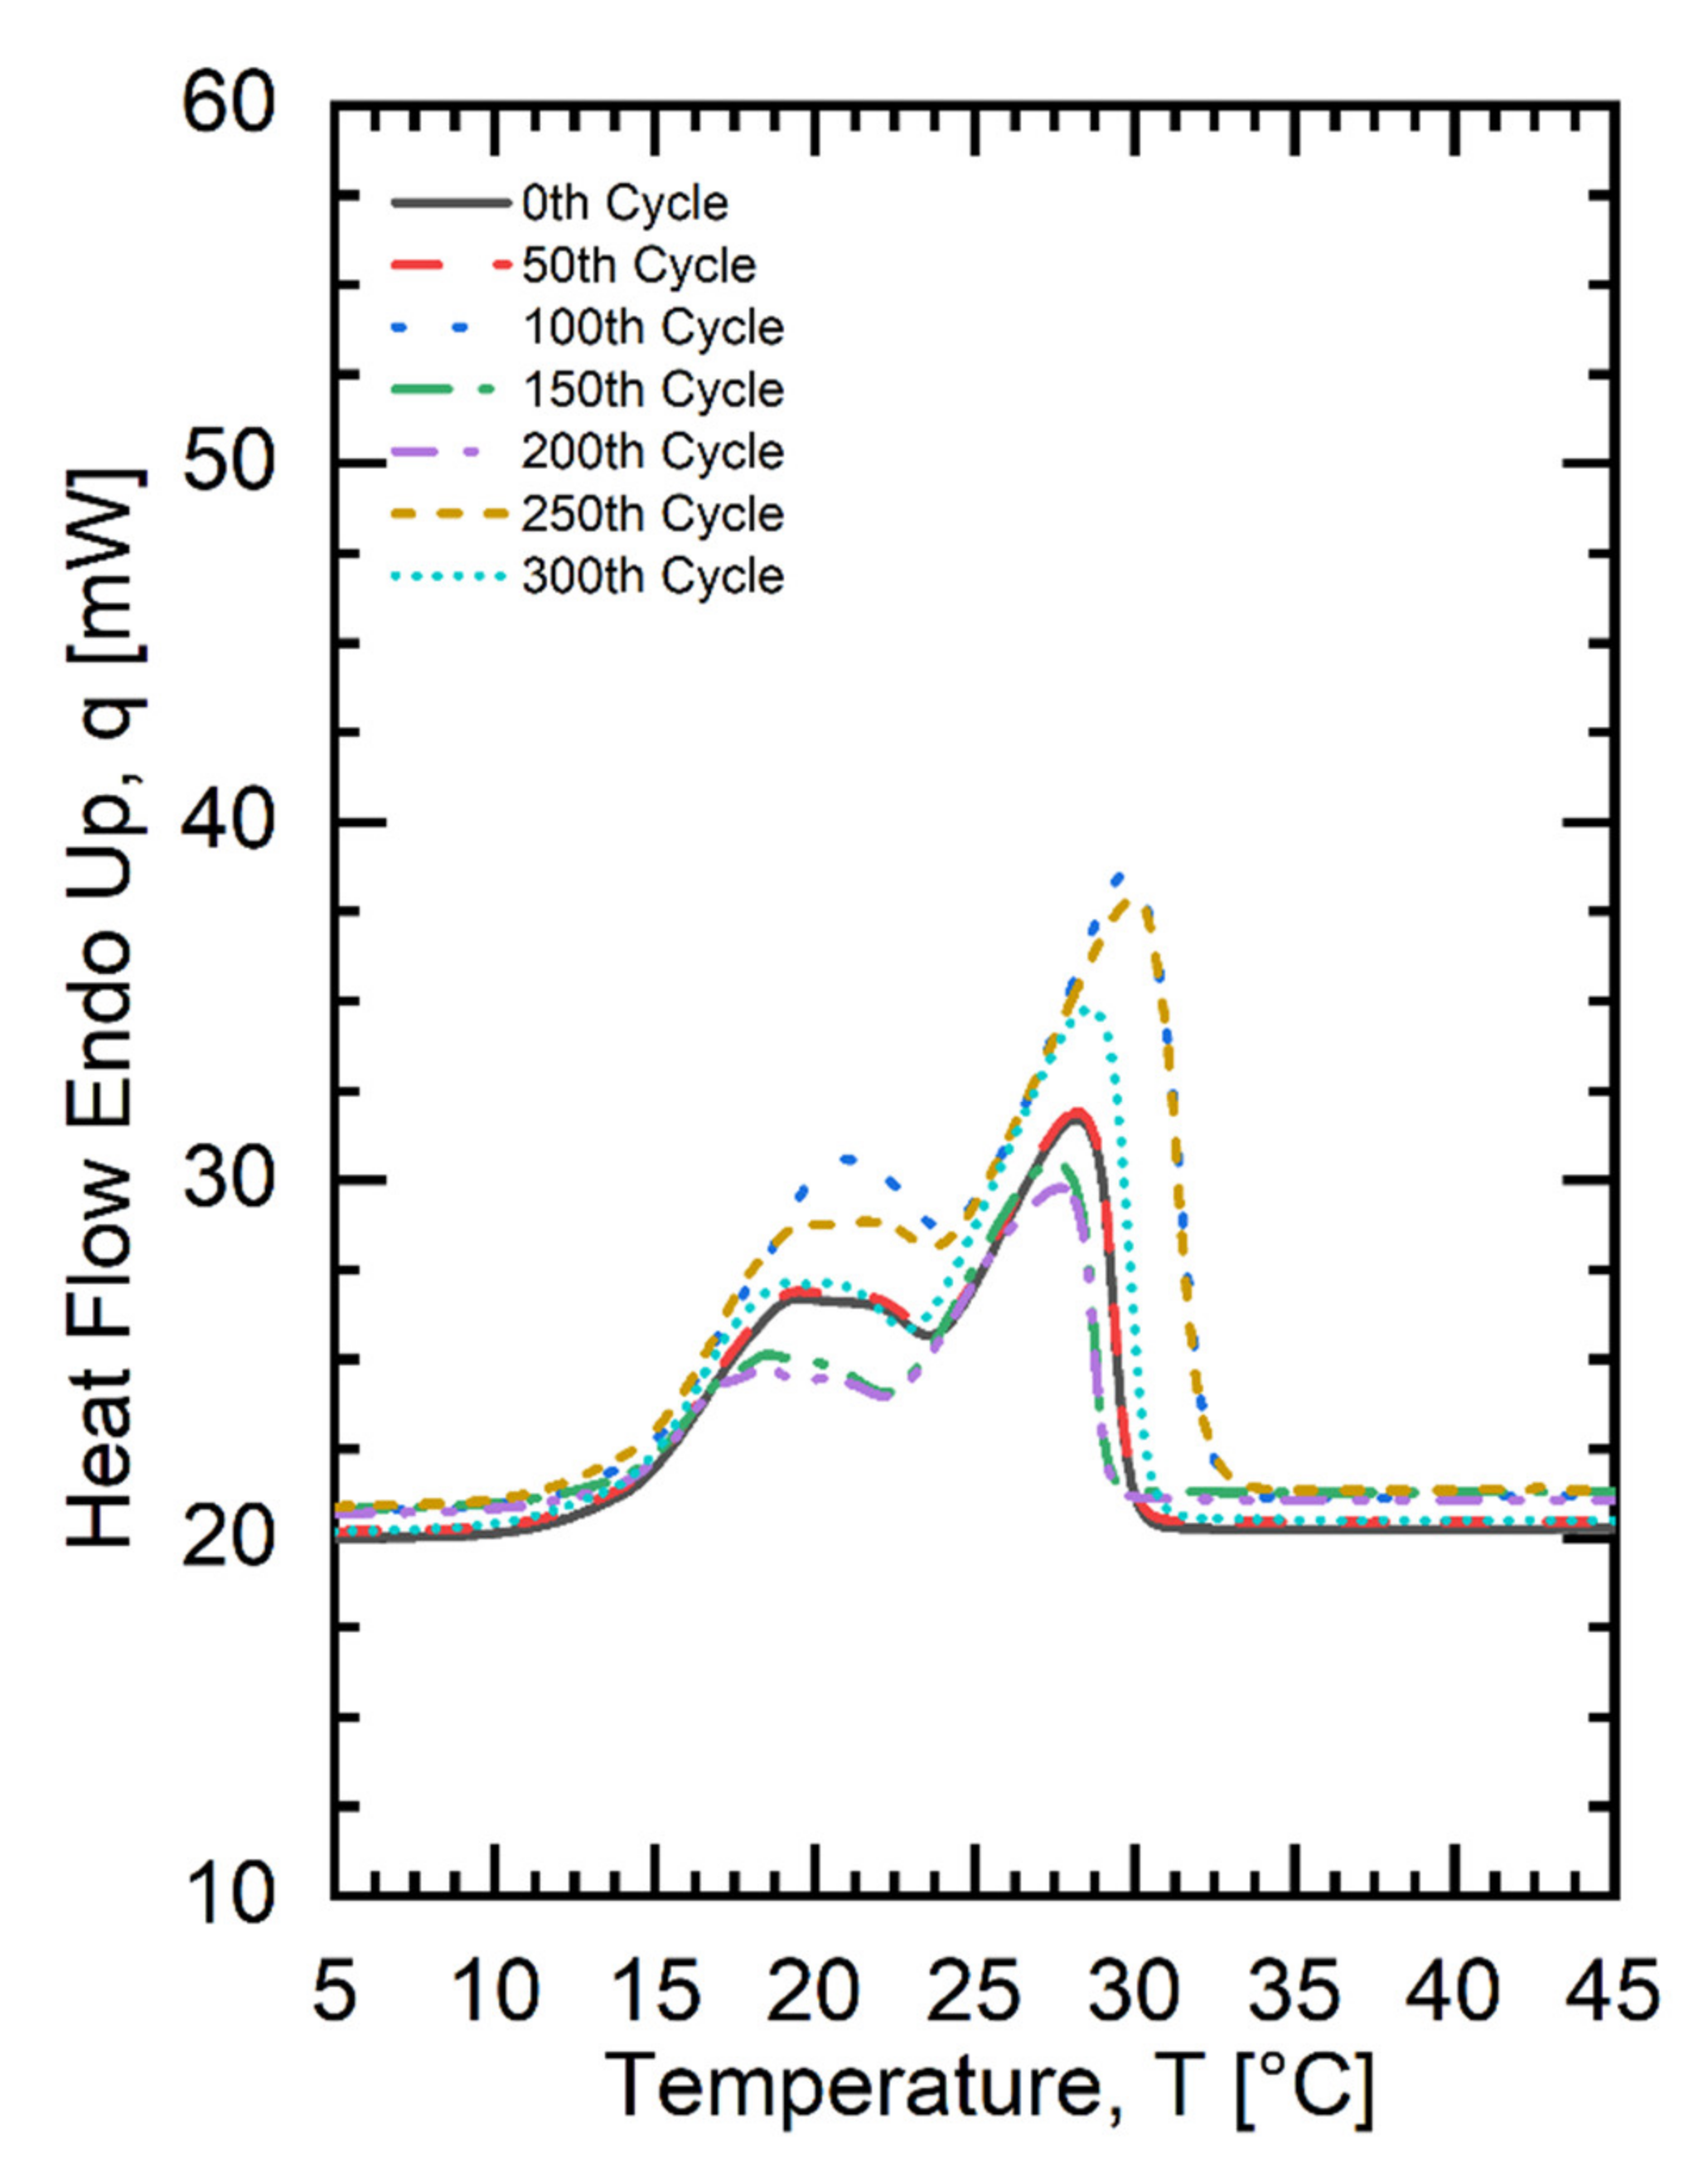
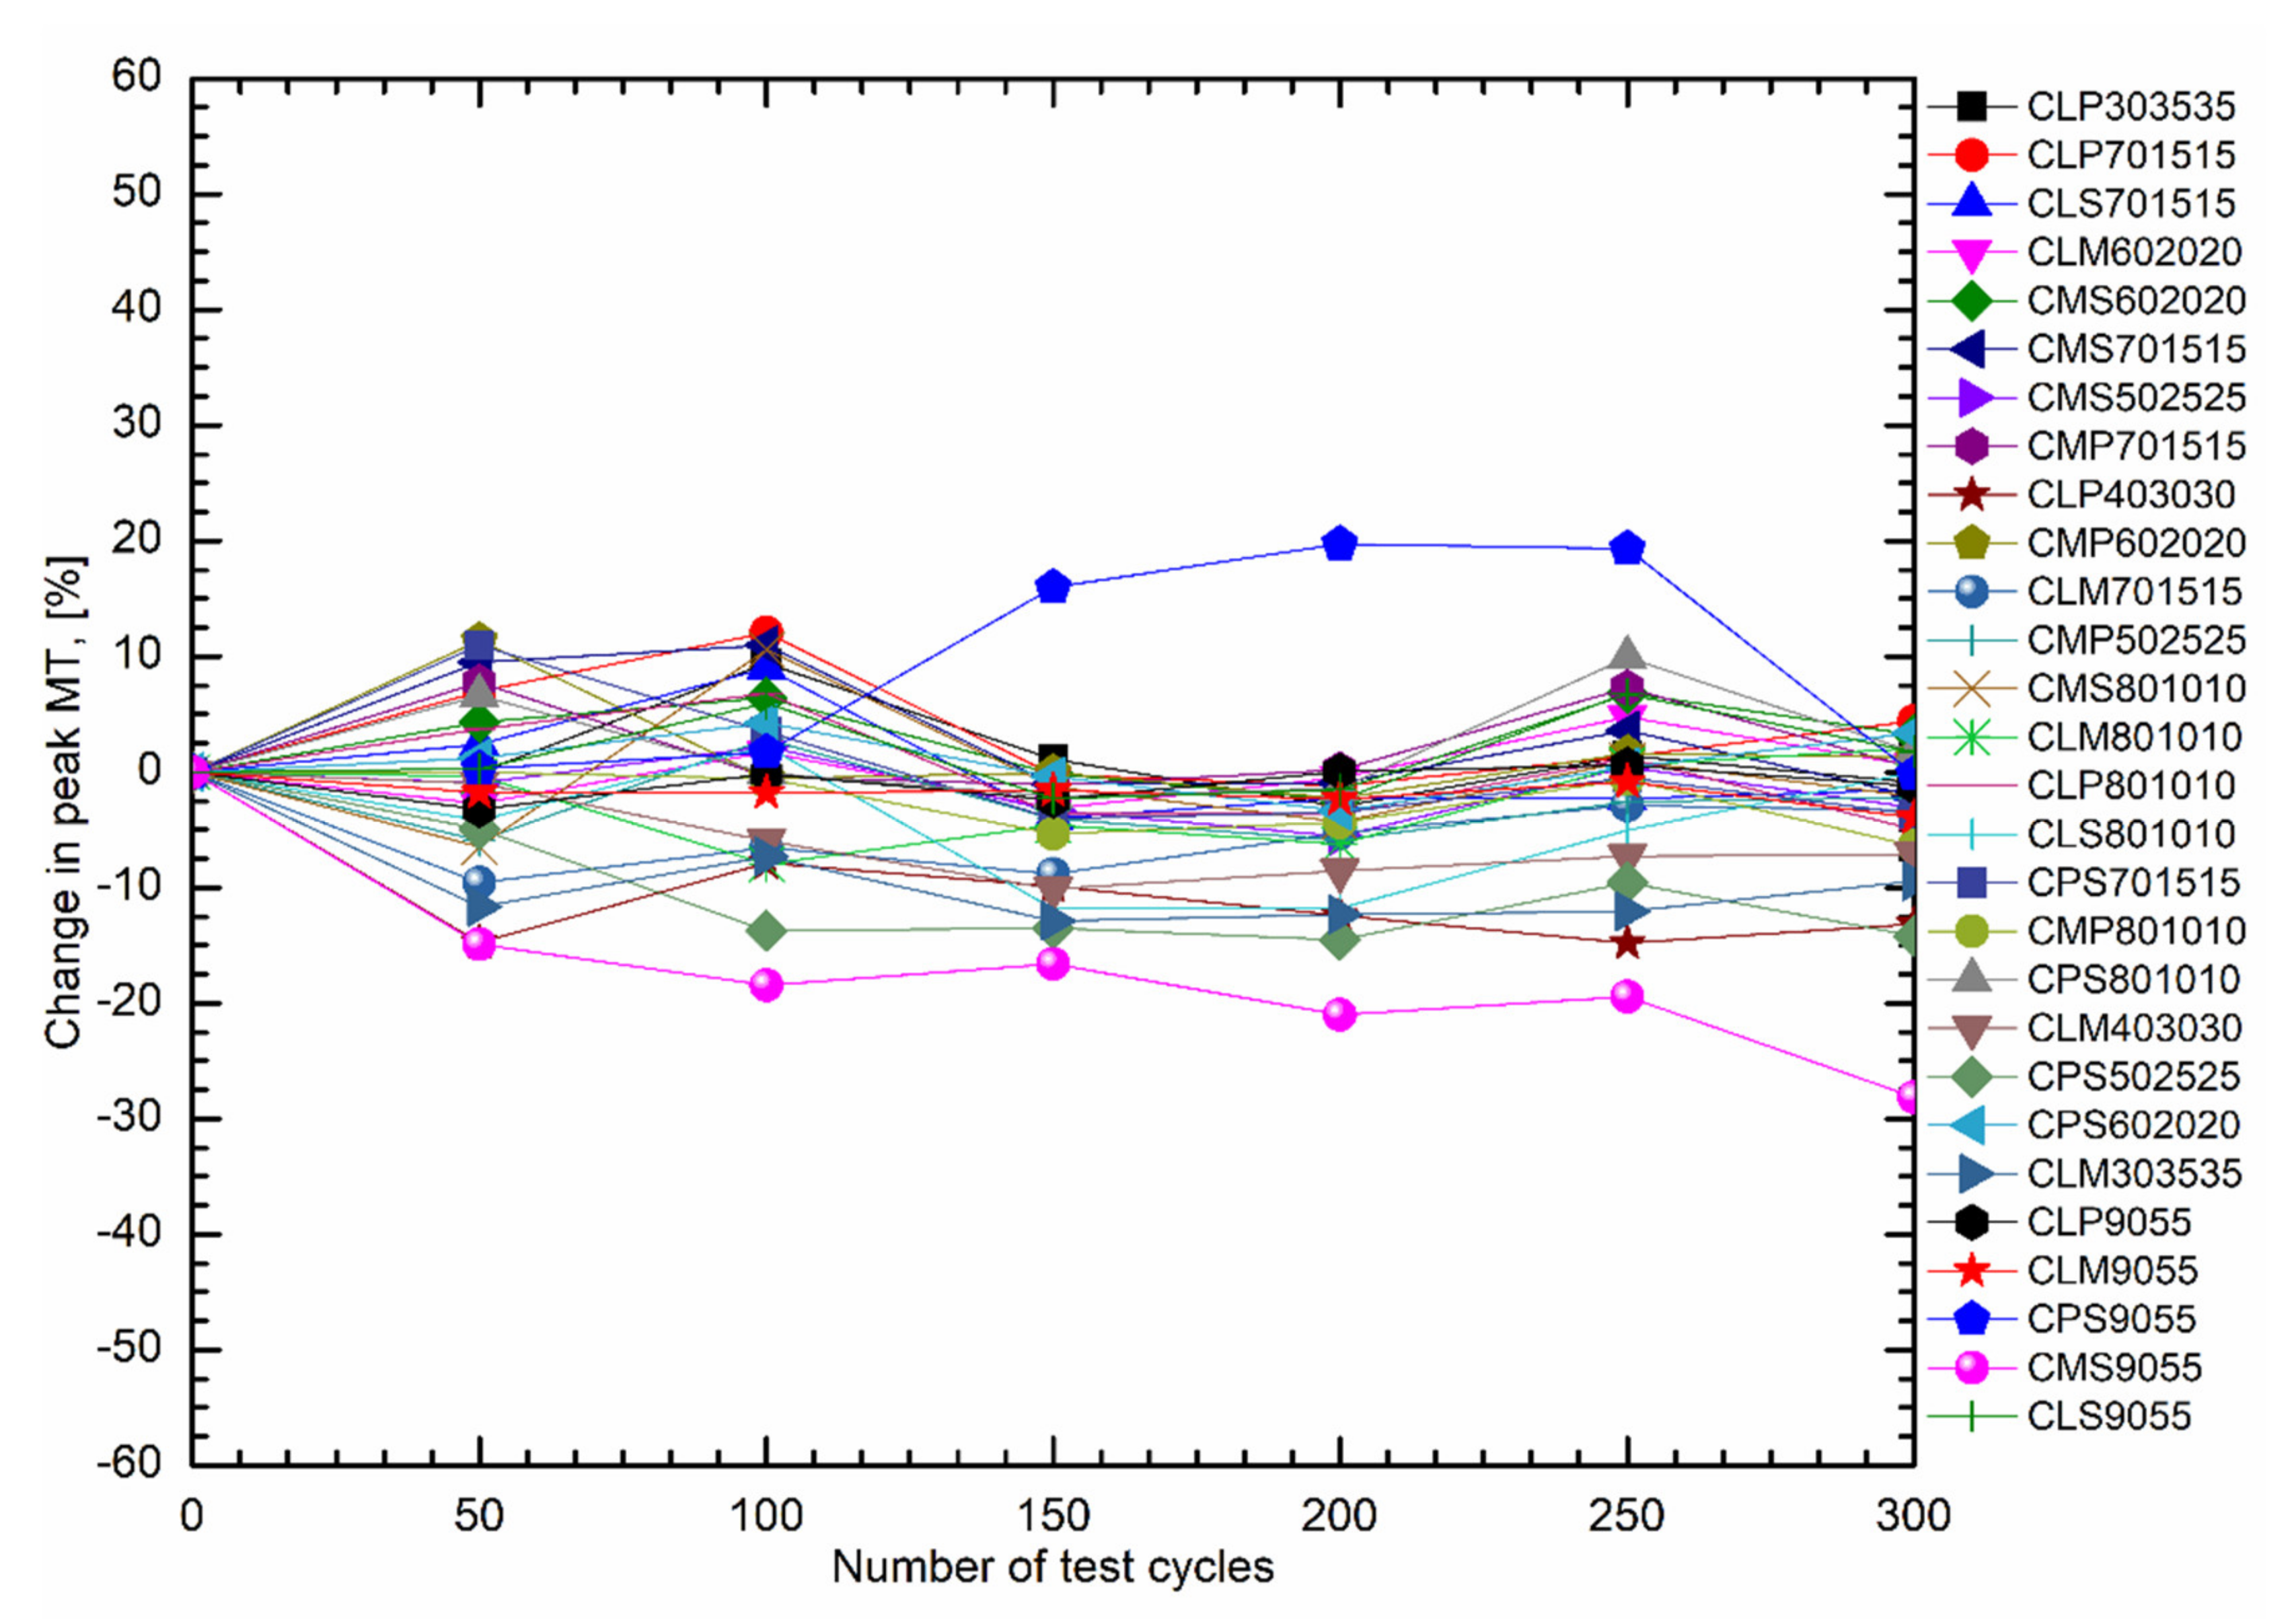
3.2. Thermal Cycle Test Analysis

The thermal cycle test result was reported as the relative percentage difference (RPD). In this method the initial thermophysical properties were taken as the reference and compared to the value of the thermophysical properties taken after the cycle test, which can be represented as:
RPD (%) = (Pf − Po)/Po × 100
where Pf is the final thermophysical property and Po is the initial thermophysical property.
Table 3 shows CLP303535, CLP701515, and CLS701515 mixtures. The melting peak and LHF obtained at the 0th cycle, were 19.01, 19.51, 19.56 °C, and 151.92, 108.13, 82.97 kJ/kg, respectively. The melting peak showed a slight tendency to drop with increasing cycles. The melting peak and LHF range obtained were 18.44–20.80, 19.28–21.86, 18.78–21.32 °C and 148.49–201.69, 104.25–165.26, 133.58–162.78 kJ/kg, respectively after 300 cycles. The melting peak varied from −3.00% to +9.42%, −1.18% to +12.05%, −3.99 to +9% while the LHF varied from −2.26% to +32%, −3.59% to +52.83%, −61% to +96.19%, respectively. Figure 3 shows the DSC thermograms at the 0th, 50th, 100th, 150th, 200th, 250th, and 300th cycle which showed only a slight variation in the melting peak compared to that of the 0th cycle, and the thermogram behavior in all the cases remained the same which also confirmed that the thermal behavior of the respective PCMs at different cyclic stages remained identical. However, due to the large deviation in the LHF of CLS701515, this PCM cannot be recommended for thermal application. However, the other two PCMs could be useful for radiative and free cooling, and air conditioning applications.
Table 4 shows CLM602020, CMS602020, and CMS701515 mixtures with a melting peak of 19.59, 19.63, 20.30 °C and LHF of 156.38, 175.16, 169.74 kJ/kg, respectively at the 0th cycle. The variation obtained after the 300th cycle was −3.16% to +4.75%, −2.39 to +6.83%, −2.07% to +10.99% in the melting peak and −11.78% to +7.12%, −21.75% to 0%, −24.48% to 0% in the LHF, respectively. All three PCMs showed excellent stability in terms of their thermophysical properties. Figure 4 shows the DSC thermograms at different cyclic stages which were almost identical, and very little variation in the melting peak compared to the 0th cycle was observed which also confirmed the thermal stability of these PCMs up to 300 cycles. The MT of these PCMs was in the desired range and also contained an enormous amount of LHF for free cooling and building applications.
Table 5 shows CMS502525, CMP701515, and CLP403030 mixtures. The melting peak and LHF obtained were 20.34, 20.83, 20.89 °C, and 148.95, 154.24, 116.65 kJ/kg, respectively. The melting peak and LHF ranges obtained after the 300th cycle, were 19.21–20.79 °C, 20.60–22.45 °C, 17.80–19.25 °C, and 146.43–179.66, 131.49–190.75, 98.48–171.31 kJ/kg, respectively. The variation obtained was −5.56% to +2.21%, −1.10% to +7.78%, −14.79% to 0% in the melting peak and −1.69% to +20.62%, −14.75% to +23.67%, −15.58% to +46.86% in the LHF, respectively. Figure 5 shows the DSC thermogram of the developed PCM at different thermal cycles. The thermograms obtained were almost similar at various thermal cycles. These PCMs can be recommended for free cooling and building applications.
Table 6 Shows CMP602020, CLM701515, and CMP502525 mixtures. The melting peak and LHF obtained were 21.02, 21.41, 21.80 °C, and 138.53, 103.22, 170.37 kJ/kg, respectively at the 0th cycle. The melting peak and LHF ranges were 20.54–23.41, 19.36–20.79, 20.51–22.42 °C and 139.77–162.64, 128.87–188.39, 135.43–195.33 kJ/kg, respectively. The deviation obtained was −2.28% to +11.37%, −9.57 to 0%, −5.92 to +2.84% in the melting peak and 0% to +17.40%, 0% to +82.51%, −20.51% to +14.65% in the LHF, respectively. Figure 6 shows the DSC thermogram of the PCMs at various thermal cycles. Owing to the large deviation in the LHF value of CLP403030 it cannot be recommended for a thermal application. The thermograms of the other two PCMs obtained were identical. These two PCMs are suitable for free cooling and building applications.
Table 7 shows CMS801010, CLM801010, and CLP801010 mixtures. The melting peak and LHF obtained were 21.81, 22.30, 22.43 °C, and 178.45, 172.65, 99.43 kJ/kg, respectively. The melting peak and LHF obtained ranges were 20.40–24.12, 20.52–22.76, 21.32–23.96 °C and 134.166.74, 127.09–152.5, 99.43–167.38 kJ/kg, respectively. The variation obtained was −6.46% to +10.59%, −7.98% to +2.06%, −4.95% to +6.82% in the melting peak and −24.79% to 0%, −26.39 to 0%, 0% to +68.34% in the LHF, respectively. Looking at the DSC thermogram presented in Figure 7, it can be visualized that similar trends were obtained at various thermal cycles. The variation in the melting peak during cycle testing was also within the controlled limits. These PCMs have enough latent heat and the desired MT range and can be recommended for free cooling and building applications.
Table 8 shows CLS801010, CPS701515, and CMP801010 mixtures. The melting peak and LHF obtained were 22.49, 23.73, 24.18 °C, and 162.89, 146.65, 131.72 kJ/kg, respectively. The melting peak and LHF ranges obtained after the 300th cycle, were 19.83–22.99, 22.78–26.33, 22.63–24.18 °C and 116.5–165.52, 118.06–166.75, 113.21–175.86 kJ/kg, respectively. The deviation obtained was from −11.83% to +2.22%, −4.00% to +10.96%, −6.41% to 0% in the melting peak and −28.47% to +1.61%, −19.50% to +13.71%, 0% to +33.51% in the LHF, respectively. Figure 8 shows the DSC thermogram which showed similar trends during each stage of the cycle testing. It was evident that only a slight variation in MP was observed. The PCM was quite stable with respect to continuous heat and cold treatment and suitable for thermal applications. These PCMs could be applied in building applications and free cooling.
Table 9 shows CPS801010, CLM403030, and CPS502525 mixtures. The melting peak and LHF obtained at the 0th cycle, were 24.79, 26.09, 26.52 °C, and 162.40, 154.25, 183.11 kJ/kg, respectively. The melting peak and LHF ranges obtained after the 300th cycle were 24.27–27.25, 17.20–24.54, 22.67–25.21 °C and 141.34–176.39, 65.09–162.47, 144.49–181.72 kJ/kg, respectively. The variation obtained was −2.10% to +9.92%, −10.11% to 0%, −14.52% to 0% in the melting peak and −12.97% to +8.61%, −57.80% to +5.33%, and −21.09% to 0% in the LHF, respectively. The DSC thermogram presented in Figure 9 showed a similar trend during all the thermal cycles. The PCMs were found to be suitable for building and PV/T applications.
Table 10 shows CPS602020, CLM303535, CLP9055 mixtures. The melting peak and LHF obtained were 23.30, 28.40, 28.41 °C, and 164.80, 136.52, 140.03 kJ/kg, respectively. The melting peak and LHF ranges obtained were 22.52–24.29, 24.74–26.32, 27.49–28.58 °C, and 133.72–178.85, 131.13–206.21, 124.76–164.27 kJ/kg, respectively. The variation obtained was −3.35 to +4.24%, −12.89% to 0%, −3.24% to +0.60% in the melting peak, and −18.86% to +8.53%, −3.95% to +51.05%, −10.90% to +17.31% in the LHF, respectively. Figure 10 shows the DSC thermogram at various thermal cycles of the PCMs. The trend observed at each thermal cycle was similar. These PCMs were found suitable for solar absorption chillers, PV/T, and building applications. The variation obtained was within the recommended range and could be suitable for the above-mentioned thermal applications.
Table 11 Shows CLM9055, CPS9055, and CMS9055 mixtures. The melting peak and LHF obtained were 29.16, 24.83, 29.83 °C, and 124.64, 128.09, 160.71 kJ/kg, respectively. The melting peak and LHF ranges obtained were 28.01–28.92, 24.78–29.73, 21.44–25.39 °C, and 133.90–147.96, 125.54–156.04, 124.56–236.78 kJ/kg, respectively. The variation was from −3.94% to 0%, −0.20% to +19.73%, −28.13% to 0% in the melting peak and 0% to +18.71%, −1.99% to +21.82%, −13.26% to +47.33% in the LHF, respectively. Figure 11 shows the DSC thermograms of the PCMs at different thermal cycles which were very similar in appearance. These PCMs can be recommended for PV/T and building applications.
Table 12 shows the CLS9055 mixture. The melting peak and LHF obtained were 28.10 °C and 131.86 kJ/kg, respectively. The melting peak and LHF range obtained after the 300th cycle, were 27.45–29.99 °C and 128.35–195.55 kJ/kg, respectively. The variation recorded was −2.31% to 6.72% in the melting peak, and −11.42 to +34.94% in the LHF, respectively. Figure 12 shows the DSC thermogram at various thermal cycles. The obtained thermogram was similar in each case. These PCMs were found to be appropriate for PV/T and building applications.
The DSC thermogram shows an irregular trend concerning the melting peak and LHF of the developed PCM. The thermal cycle up to 300 does not show any drastic deviation in the melting peak and LHF from their 0th cycle values. The irregular variation in the melting peak and LHF with an increasing number of the thermal cycles can be attributed to the fact that the developed PCM was composed of mixtures of fatty acids. The fatty acids used in the experiments were saturated acids with differing numbers of carbon atoms: C10 (CA), C12 (LA), C14 (MA), C16 (PA), and C18 (SA). These fatty acids exist in different crystal structures often called polymorphs. For the even number of carbon atoms, seven such forms have been identified. The appearance of the particular crystal structure depends on the temperature and rate of crystallization, purity, and the nature of the solvent [24,25]. The crystal structure formed during the first thermal cycles was not the same during the subsequent thermal cycles. The crystal structure and packaging in the unit cells determine the physical properties viz. MT and LHF. Moreover, with an increasing number of thermal cycles, the PCM began to chemically degrade [26]. The crystal structure formed after solidification was not the same as the first crystal structure. After a large number of melt/freeze cycles, some fresh and new compounds with different thermophysical properties began to appear. The presence of impurities in the mixtures also imparted the degradation of the PCM.

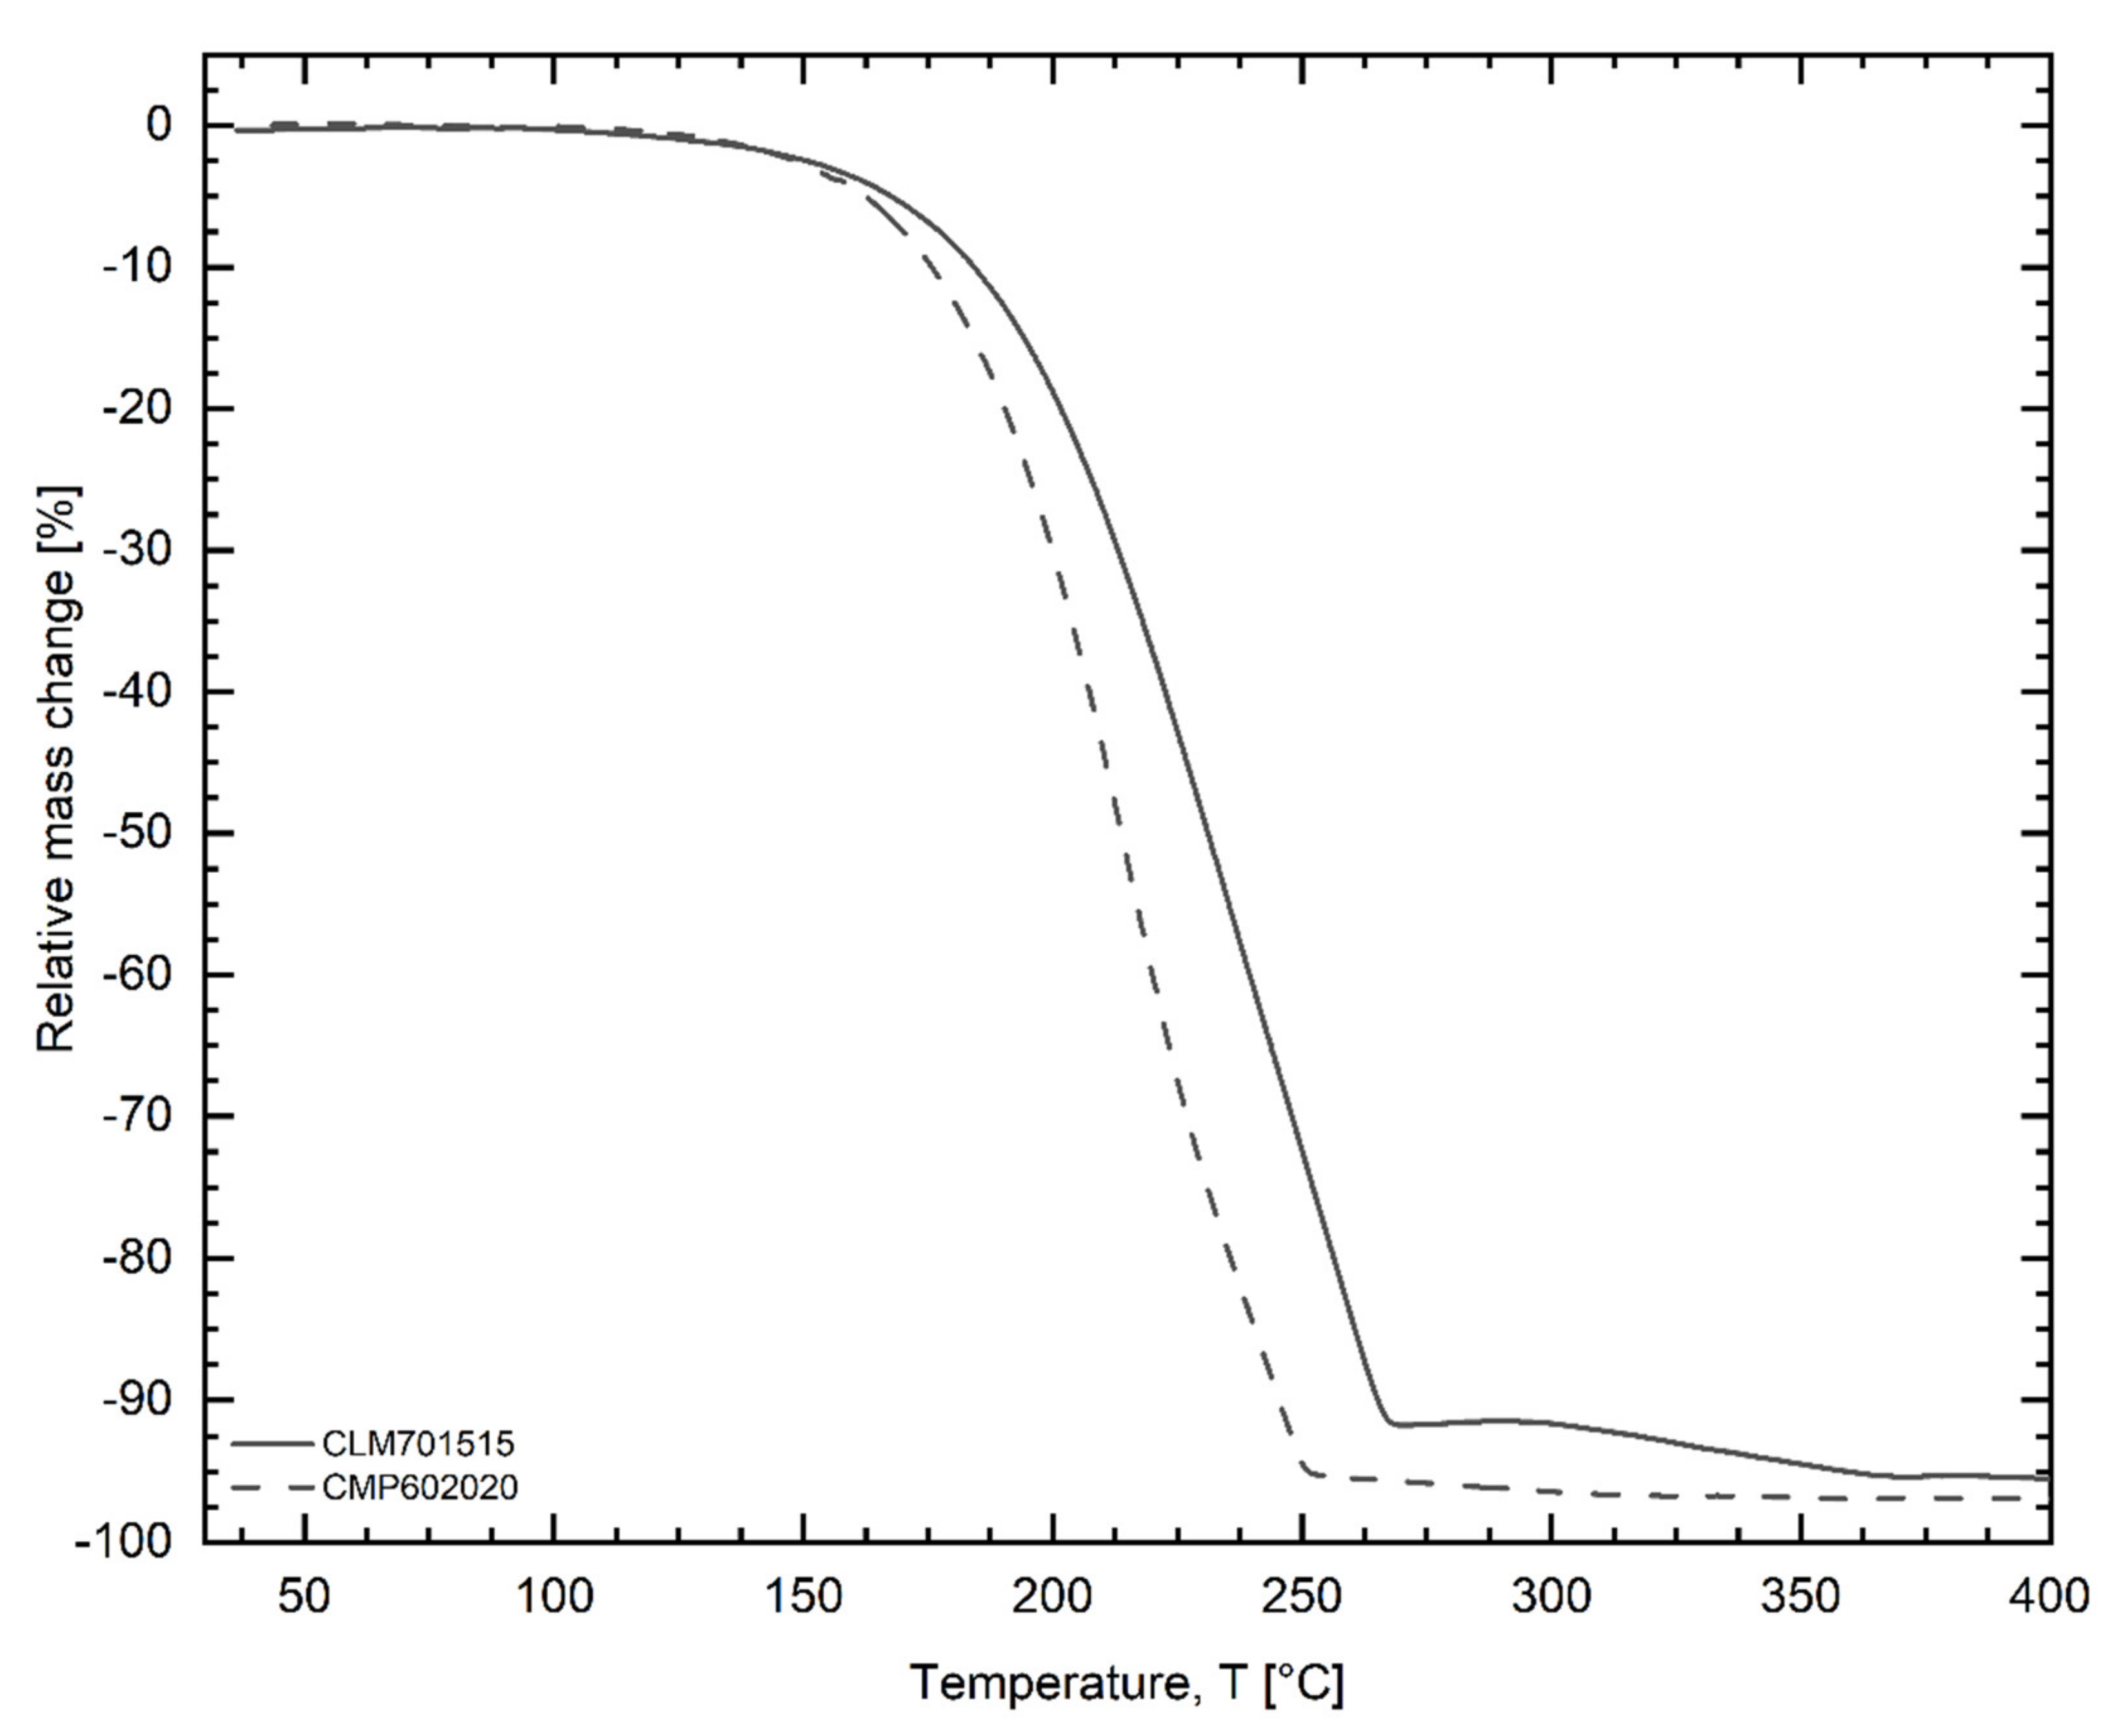
3.3. Thermogravimetric Analysis (TGA)

Table 13 shows Tonset, Tmax, and Toffset temperatures, and the percentage mass loss of the different developed PCM materials. The Tonset was the temperature from which the degradation started, Tmax was the temperature of maximum degradation and Toffset was the temperature at which the PCM degradation lasts. It is visible from the table that all the developed PCMs were thermally stable in the working temperature range for medium–low temperature storage applications. No significant mass loss was observed in the PCMs up to 100 °C. The initial mass loss was observed due to the evaporation of moisture or the loss of the hydroxyl group. This loss was very gradual up to the Tonset. Once the Tonset was reached, sharp degradation in mass with rising temperature was observed up to the Toffset. This loss was due to the breaking of the long aliphatic chain and formation of the lower alkane. The lower alkanes then eventually were evaporated. It was also noticed that the whole degradation process was only one step, which signifies the presence of only fatty acids in the developed PCMs. The residual mass left was due to the presence of non-volatile material or due to the presence of impurities. In a few cases, the mass loss reported was even more than the PCMs themselves. This could be due to the absorption of moisture by the PCM. The developed PCMs can be used for medium–low temperature applications over a large number of repeated cycles. However, these PCMs cannot be recommended for high-temperature applications as the PCMs were not stable in the high-temperature range. The relative mass loss of the PCMs (CLM701515 and CMP602020) with increasing temperatures is presented in Figure 13.

3.4. FTIR Analysis

Figure 14 shows the FTIR spectra of CLM701515 at the 0th and 300th cycle. At the 0th cycle, the peak at 2923 cm−1 appeared due to the stretching of –CH3, and at 2854 cm−1 due to the stretching of –CH2. The absorption peak at 1708 cm−1 was due to =CO stretching. The peak at 1465 cm−1 and 1282 cm−1 was due to the bending vibration caused by –CH3 and –CH2 groups. The peak at 936 cm−1 was due to the out-of-plane rocking vibration of the –OH group and the peak at 722 cm−1 appeared due to the rocking vibration of –CH2 in the same plane. When these spectra were compared with those that appeared at the 300th cycle, a similar trend was observed. This clearly showed that thermal cycling has no impact on the chemical structure and functional groups. There was no other peak that appeared after cycle testing which also confirmed that there was no possibility of a chemical reaction during the thermal cycling.
Table 14 shows the overall variation in the melting peak with the mean value of LHF after the 300-cycle test. It can be seen that for most of the materials the variation in the melting peak was within a ±10% limit, except for few, which is also evident from Figure 15. The average LHF value was between 130–170 kJ/kg and was suitable for various kinds of thermal applications. As per the data presented in the table, the developed PCMs have been categorized into “promising”, “least promising”, and “not promising” based on their cycle test performance. The “promising” PCM is one with little deviation in MT and LHF, the least promising is one with a medium level of deviation in MT and LHF, and “not promising” PCMs have a large deviation in MT and LHF. Based on these criteria, twenty PCMs were identified as “promising”, six PCMs were “least promising”, and two were “not promising”.
In terms of the cost analysis, the authors’ developed PCMs can be made available at 5–17 USD/kg in commercial markets and are cheaper than other available PCMs in a similar temperature range. The other available PCM in this range is typically expensive, without cycle verification and unreliable for long-term thermal applications. Therefore, it is essential to choose a low-priced, reliable, and thermally stable PCM for a thermal system when other available PCMs are high priced and add an extra cost which also affects the payback period. This price can even be lowered to about 2–5 USD/kg when the authors’ developed PCM is produced and sold in a bulk quantity.

4. Conclusions

This paper deals with the development and thermal cycle test of ternary developed PCMs. A thermal cycle test, up to 300 cycles was conducted for the 28 developed PCMs. The variation obtained with respect to the melting peak was ±10% with an average storage capability between 130 and 170 kJ/kg. These PCMs are available within the 19–31 °C temperature range which can be suitable for building, photovoltaic/thermal, and other similar kinds of applications. The thermal gravimetric analysis revealed that these PCMs were stable in their working temperature ranges. No significant mass loss was observed up to 100 °C for almost all the PCMs. Fourier transform infrared spectroscopy showed that the thermal cycle test has no impact on the chemical structure and functional groups. Variations in the observed thermophysical properties were due to different polymorphs, crystal structures, and impurities associated with the PCMs. It can be concluded that the developed PCMs can be used for one year without thermal deterioration when subjected to a single melt/freeze cycle during the entire day. The developed PCMs lie in the price range of 5–17 USD/kg which can be made available to users at an even cheaper price of 2–5 USD/kg when produced in bulk. These PCMs can also be used as a base material for encapsulation, impregnation into matrix and fibers, doping, and nanoparticle enhancement.

Author Contributions

Conceptualization, Data curation, Formal analysis, Investigation, Methodology, Software, Validation, Visualization, Writing (A.A., K.K.); Fund acquisition, Project administration, Resource, Supervision (A.S. (Amritanshu Shukla), A.S. (Atul Sharma), C.-R.C.). All authors have read and agreed to the published version of the manuscript.

Funding

The author (A.A.) is highly obliged to the University Grants Commission (UGC) and Ministry of Education, Government of India, New Delhi for providing the Senior Research Fellowship (SRF). Further, the authors are also thankful to the Council of Science and Technology, UP (Reference No. CST 3012-dt.26-12-2016) for providing research grants to carry out the work at the institute.

Institutional Review Board Statement

Not applicable.

Informed Consent Statement

Not applicable.

Data Availability Statement

Not applicable.

Conflicts of Interest

The authors declare no conflict of interest.

Nomenclature

CACapric acid
LALauric acid
MAMyristic acid
SAStearic acid
PAPalmitic acid
DSCDifferential scanning calorimetry
TGAThermal gravimetric analysis
FTIRFourier transform infrared spectroscopy
MTMelting temperature
LHFLatent heat of fusion
FTFreezing temperature
LHCLatent heat of crystallization

References

  1. Nitsas, M.T.; Koronaki, I.P. Thermal Analysis of Pure and Nanoparticle-Enhanced PCM—Application in Concentric Tube Heat Exchanger. Energies 2020, 13, 3841. [Google Scholar] [CrossRef]
  2. Kant, K.; Shukla, A.; Sharma, A. Ternary mixture of fatty acids as phase change materials for thermal energy storage applications. Energy Rep. 2016, 2, 274–279. [Google Scholar] [CrossRef] [Green Version]
  3. Karaipekli, A.; Sari, A. Capric-myristic acid/expanded perlite composite as form-stable phase change material for latent heat thermal energy storage. Renew. Energy 2008, 33, 2599–2605. [Google Scholar] [CrossRef]
  4. Nascimento Porto, T.; Delgado, J.M.P.Q.; Guimarães, A.S.; Fernandes Magalhães, H.L.; Moreira, G.; Brito Correia, B.; Freire de Andrade, T.; Barbosa de Lima, A.G. Phase Change Material Melting Process in a Thermal Energy Storage System for Applications in Buildings. Energies 2020, 13, 3254. [Google Scholar] [CrossRef]
  5. Okogeri, O.; Stathopoulos, V.N. What about greener phase change materials? A review on biobased phase change materials for thermal energy storage applications. Int. J. Thermofluids 2021, 10, 100081. [Google Scholar] [CrossRef]
  6. Jouhara, H.; Żabnieńska-Góra, A.; Khordehgah, N.; Ahmad, D.; Lipinski, T. Latent thermal energy storage technologies and applications: A review. Int. J. Thermofluids 2020, 5–6, 100039. [Google Scholar] [CrossRef]
  7. Gasia, J.; Martin, M.; Solé, A.; Barreneche, C.; Cabeza, L. Phase Change Material Selection for Thermal Processes Working under Partial Load Operating Conditions in the Temperature Range between 120 and 200 °C. Appl. Sci. 2017, 7, 722. [Google Scholar] [CrossRef] [Green Version]
  8. Shukla, A.; Buddhi, D.; Sawhney, R.L. Thermal cycling test of few selected inorganic and organic phase change materials. Renew. Energy 2008, 33, 2606–2614. [Google Scholar] [CrossRef]
  9. Sari, A. Thermal reliability test of some fatty acids as PCMs used for solar thermal latent heat storage applications. Energy Convers. Manag. 2003, 44, 2277–2287. [Google Scholar] [CrossRef]
  10. Sharma, A.; Shukla, A. Thermal cycle test of binary mixtures of some fatty acids as phase change materials for building applications. Energy Build. 2015, 99, 196–203. [Google Scholar] [CrossRef]
  11. Anand, A.; Shukla, A.; Kumar, A.; Buddhi, D.; Sharma, A. Cycle test stability and corrosion evaluation of phase change materials used in thermal energy storage systems. J. Energy Storage 2021, 39, 102664. [Google Scholar] [CrossRef]
  12. Mousa, M.M.; Bayomy, A.M.; Saghir, M.Z. Experimental and Numerical Study on Energy Piles with Phase Change Materials. Energies 2020, 13, 4699. [Google Scholar] [CrossRef]
  13. Sharma, S.D.; Buddhi, D.; Sawhney, R.L. Accelerated thermal cycle test of latent heat-storage materials. Sol. Energy 1999, 66, 483–490. [Google Scholar] [CrossRef]
  14. Zhang, J.J.; Zhang, J.L.; He, S.M.; Wu, K.Z.; Liu, X. Di Thermal studies on the solid-liquid phase transition in binary systems of fatty acids. Thermochim. Acta 2001, 369, 157–160. [Google Scholar] [CrossRef]
  15. Sari, A.; Sari, H.; Önal, A. Thermal properties and thermal reliability of eutectic mixtures of some fatty acids as latent heat storage materials. Energy Convers. Manag. 2004, 45, 365–376. [Google Scholar] [CrossRef]
  16. Zhang, H.; Gao, X.; Chen, C.; Xu, T.; Fang, Y.; Zhang, Z. A capric–palmitic–stearic acid ternary eutectic mixture/expanded graphite composite phase change material for thermal energy storage. Compos. Part A Appl. Sci. Manuf. 2016, 87, 138–145. [Google Scholar] [CrossRef]
  17. Sharma, R.K.; Ganesan, P.; Tyagi, V.V.; Metselaar, H.S.C.; Sandaran, S.C. Thermal properties and heat storage analysis of palmitic acid-TiO 2 composite as nano-enhanced organic phase change material (NEOPCM). Appl. Therm. Eng. 2016, 99, 1254–1262. [Google Scholar] [CrossRef]
  18. Wen, R.; Zhang, X.; Huang, Z.; Fang, M.; Liu, Y.; Wu, X.; Min, X.; Gao, W.; Huang, S. Preparation and thermal properties of fatty acid/diatomite form-stable composite phase change material for thermal energy storage. Sol. Energy Mater. Sol. Cells 2018, 178, 273–279. [Google Scholar] [CrossRef]
  19. Chen, Y.; Zhang, Q.; Wen, X.; Yin, H.; Liu, J. A novel CNT encapsulated phase change material with enhanced thermal conductivity and photo-thermal conversion performance. Sol. Energy Mater. Sol. Cells 2018, 184, 82–90. [Google Scholar] [CrossRef]
  20. Sarı, A.; Bicer, A.; Al-Ahmed, A.; Al-Sulaiman, F.A.; Zahir, M.H.; Mohamed, S.A. Silica fume/capric acid-palmitic acid composite phase change material doped with CNTs for thermal energy storage. Sol. Energy Mater. Sol. Cells 2018, 179, 353–361. [Google Scholar] [CrossRef]
  21. Anand, A.; Shukla, A.; Kumar, A.; Sharma, A. Development and characterization of ternary mixture series of medium- and long-chain saturated fatty acids for energy applications. Energy Storage 2020, 2. [Google Scholar] [CrossRef] [Green Version]
  22. Koukou, M.K.; Vrachopoulos, M.G.; Tachos, N.S.; Dogkas, G.; Lymperis, K.; Stathopoulos, V. Experimental and computational investigation of a latent heat energy storage system with a staggered heat exchanger for various phase change materials. Therm. Sci. Eng. Prog. 2018, 7, 87–98. [Google Scholar] [CrossRef]
  23. Shukla, A.; Sharma, A.; Shukla, M.; Chen, C.R. Development of thermal energy storage materials for biomedical applications. J. Med. Eng. Technol. 2015, 39, 363–368. [Google Scholar] [CrossRef] [PubMed]
  24. Moreno, E.; Cordobilla, R.; Calvet, T.; Cuevas-Diarte, M.A.; Gbabode, G.; Negrier, P.; Mondieig, D.; Oonk, H.A.J. Polymorphism of even saturated carboxylic acids from n-decanoic to n-eicosanoic acid. New J. Chem. 2007, 31, 947. [Google Scholar] [CrossRef] [Green Version]
  25. Lawer-Yolar, G.; Dawson-Andoh, B.; Atta-Obeng, E. Novel phase change materials for thermal energy storage: Evaluation of tropical tree fruit oils. Biotechnol. Rep. 2019, 24, e00359. [Google Scholar] [CrossRef]
  26. Sarı, A.; Kaygusuz, K. Some fatty acids used for latent heat storage: Thermal stability and corrosion of metals with respect to thermal cycling. Renew. Energy 2003, 28, 939–948. [Google Scholar] [CrossRef]
Figure 1. Material preparation and distribution for cycle test process.
Energies 14 04509 g001
Figure 2. The model description of the thermal cycle testing unit.
Energies 14 04509 g002
Figure 3. Cycle testing (a) CLP303535 (b) CLP701515 (c) CLS701515.
Energies 14 04509 g003
Figure 4. Cycle testing (a) CLM602020 (b) CMS602020 (c) CMS701515.
Energies 14 04509 g004
Figure 5. Cycle testing (a) CMS502525 (b) CMP701515 (c) CLP403030.
Energies 14 04509 g005
Figure 6. Cycle testing (a) CMP602020 (b) CLM701515 (c) CMP502525.
Energies 14 04509 g006
Figure 7. Cycle testing (a) CMS801010 (b) CLM801010 (c) CLP801010.
Energies 14 04509 g007
Figure 8. Cycle testing (a) CLS801010 (b) CPS701515 (c) CMP801010.
Energies 14 04509 g008
Figure 9. Cycle testing (a) CPS801010 (b) CLM403030 (c) CPS502525.
Energies 14 04509 g009
Figure 10. Cycle test (a) CPS602020 (b) CLM303535 (c) CLP9055.
Energies 14 04509 g010
Figure 11. Cycle testing (a) CLM9055 (b) CPS9055 (c) CMS9055.
Energies 14 04509 g011
Figure 12. Cycle testing CLS9055.
Energies 14 04509 g012
Figure 13. Percentage mass loss with rising temperature.
Energies 14 04509 g013
Figure 14. FTIR result at 0th and 300th cycle.
Energies 14 04509 g014
Figure 15. Change in melting peak with cycles.
Energies 14 04509 g015
Table 1. Thermophysical properties of crude fatty acids.
Fatty AcidMelting Temperature Range
(°C)
* Onset
(°C)
* Peak
(°C)
* Latent Heat of Fusion (kJ/kg)* Freezing Point (°C)* Latent Heat of Crystallization (kJ/kg)Purity (%)** Cost (USD/kg)
CA29–3130.6133.03154.4227.87157.9798.518.06
LA44–4643.5045.93175.7740.42179.7299.04.12
MA51–5453.7656.83168.2750.29174.9598.05.31
PA60–6361.6264.25206.1158.93208.6799.04.80
SA68–6954.8357.73180.7951.70180.0599.03.35
* Measured through DSC with 2 °C scanning heating/cooling rate. ** One USD = 62.275 INR [http://finance.yahoo.com/currency-converter/#from=USD;to=INR;amt=1]; accessed on 7 February 2014.
Table 2. Thermophysical properties of the obtained composition.
Onset
(°C)
Peak
(°C)
Latent Heat of Fusion (kJ/kg)Cost
(USD/kg)
Laboratory Code/Name *
15.2719.01151.928.54CLP303535
14.1319.51108.1313.98CLP701515
13.8519.5682.9713.76CLS701515
15.8719.59156.3812.72CLM602020
15.9619.63175.1612.57CMS602020
15.2520.30169.7413.94CMS701515
15.5420.34148.9511.19CMS502525
16.5920.83154.2414.16CMP701515
13.9920.89116.659.71CLP403030
17.1521.02138.5412.86CMP602020
14.6121.41103.2214.06CLM701515
17.0021.80170.3711.56CMP502525
16.2321.81178.4515.31CMS801010
16.8122.30172.6515.39CLM801010
15.6022.4399.4315.34CLP801010
15.6222.49162.8915.19CLS801010
19.4823.73146.6513.86CPS701515
23.1624.18131.7215.46CMP801010
19.0924.79162.4015.26CPS801010
24.0326.09154.2510.05CLM403030
21.7826.52183.1111.06CPS502525
19.5123.30164.8012.47CPS602020
25.7528.40136.528.72CLM303535
20.4628.41140.0316.70CLP9055
20.8329.16124.6416.72CLM9055
19.8324.83128.0916.66CPS9055
28.0529.83160.7116.69CMS9055
21.8128.10144.9116.63CLS9055
* C-Capric acid, L-Lauric acid, M-Myristic acid, S-Stearic acid, P-Palmitic acid; The number represents the weight fraction of fatty acid in the mixture e.g., CLP303535 means 30% weight fraction of capric acid, 30% weight fraction of lauric acid, and 30% weight fraction of palmitic acid.
Table 3. Latent heat of fusion and melting temperature of developed materials with test cycles (CLP303535, CLP701515, and CLS701515).
No. of Test CyclesCLP303535CLP701515CLS701515
Onset
(°C)
Peak
(°C)
Latent Heat of Fusion (kJ/kg)Onset
(°C)
Peak
(°C)
Latent Heat of Fusion (kJ/kg)Onset
(°C)
Peak
(°C)
Latent Heat of Fusion (kJ/kg)
015.2719.01151.9214.1319.51108.1313.8519.5682.97
5015.2919.13117.8313.7720.87145.9013.8720.03133.58
10015.2420.80148.4915.3521.86153.1313.9021.32161.24
15014.5519.22154.1013.6719.47165.2613.7818.78139.32
20014.2918.44201.6913.5519.28124.6413.6119.11135.02
25014.5019.28149.8913.7219.77156.3013.6519.11140.87
30014.3518.84184.2917.6120.37104.2513.5719.26162.78
Table 4. Latent heat of fusion and melting temperature of developed materials with test cycles (CLM602020, CMS602020, CMS701515).
No. of Test CyclesCLM602020CMS602020CMS701515
Onset
(°C)
Peak
(°C)
Latent Heat of Fusion (kJ/kg)Onset
(°C)
Peak
(°C)
Latent Heat of Fusion (kJ/kg)Onset
(°C)
Peak
(°C)
Latent Heat of Fusion) (kJ/kg)
015.8719.59156.3815.9619.63175.1615.2520.30169.74
5014.7819.06143.8715.5420.48141.0715.4022.23129.96
10014.9019.93167.2215.6620.89141.6220.1522.53147.37
15014.9318.97157.2315.3719.60137.0715.2720.09139.37
20014.9819.49137.9516.6219.16163.7315.2120.11132.27
25015.1420.52150.6515.2920.97163.9815.0921.03128.18
30015.1819.70152.6115.4620.26168.8913.9019.88147.25
Table 5. Latent heat of fusion and melting temperature of developed materials with test cycles (CMS502525, CMP701515, CLP403030).
No. of Test CyclesCMS502525CMP701515CLP403030
Onset
(°C)
Peak
(°C)
Latent Heat of Fusion (kJ/kg)Onset
(°C)
Peak
(°C)
Latent Heat of Fusion (kJ/kg)Onset
(°C)
Peak
(°C)
Latent Heat of Fusion (kJ/kg)
015.5420.34148.9516.5920.83154.2413.9920.89116.65
5015.7420.15154.8716.5822.45152.1814.1017.81151.31
10016.2920.79155.0516.9920.75190.7513.7019.25171.31
15015.3819.66160.5515.5820.60161.3713.9418.83136.16
20015.2719.21146.4316.6320.87131.4913.9318.30152.94
25015.3820.43179.6616.0922.35138.2514.3017.8098.48
30015.3519.71153.7116.3920.90157.6513.8718.14128.18
Table 6. Latent heat of fusion and melting temperature of developed materials with test cycles (CMP602020, CLM701515, CMP502525).
No. Of Test CyclesCMP602020CLM701515CMP502525
Onset
(°C)
Peak
(°C)
Latent Heat of Fusion (kJ/kg)Onset
(°C)
Peak
(°C)
Latent Heat of Fusion (kJ/kg)Onset
(°C)
Peak
(°C)
Latent Heat of Fusion (kJ/kg)
017.1521.02138.5314.6121.41103.2217.0021.80170.37
5016.6923.41139.7714.4319.36162.9515.9120.51163.12
10016.1020.90162.6415.2520.01151.8116.2522.42195.33
15016.3521.01141.9714.8519.52129.2016.6420.92187.82
20016.1420.54142.2014.8820.28128.8716.0720.52168.11
25016.6421.36140.8419.6920.79158.4016.1321.24135.43
30017.0321.29159.9614.9420.70188.3916.3621.32153.09
Table 7. Latent heat of fusion and melting temperature of developed materials with test cycles (CMS801010, CLM801010, CLP801010).
No. of Test CyclesCMS801010CLM801010CLP801010
Onset
(°C)
Peak
(°C)
Latent Heat of Fusion (kJ/kg)Onset
(°C)
Peak
(°C)
Latent Heat of Fusion (kJ/kg)Onset
(°C)
Peak
(°C)
Latent Heat of Fusion (kJ/kg)
016.2321.81178.4516.8122.30172.6515.6022.4399.43
5016.3020.40153.0115.2222.22127.0915.5523.26115.80
10015.9824.12134.2215.1720.52152.5015.3523.96142.89
15016.1621.53145.0415.6621.28147.5415.7021.62167.38
20016.0820.87146.6015.7120.91140.1315.2921.62151.95
25016.1422.02145.7516.7022.43146.4614.6422.70139.50
30013.3721.35166.7415.1722.76139.8315.6321.32143.45
Table 8. Latent heat of fusion and melting temperature of developed materials with test cycles (CLS801010, CPS701515, CMP801010).
No. of Test CyclesCLS801010CPS701515CMP801010
Onset
(°C)
Peak
(°C)
Latent Heat of Fusion (kJ/kg)Onset
(°C)
Peak
(°C)
Latent Heat of Fusion (kJ/kg)Onset
(°C)
Peak
(°C)
Latent Heat of Fusion (kJ/kg)
015.6222.49162.8919.4823.73146.6523.1624.18131.72
5013.6721.55122.0119.3626.33130.9217.2624.18137.29
10014.3822.99165.5218.7924.56134.4818.8524.04175.86
15018.0219.83148.1018.8122.78146.3618.3322.89136.21
20013.4519.84165.3120.1222.90134.2518.6123.13157.99
25017.3621.36116.5018.7023.61166.7518.4824.03163.11
30013.8122.49122.9319.0422.87118.0617.5322.63169.37
Table 9. Latent heat of fusion and melting temperature of developed materials with test cycles (CPS801010, CLM403030, CPS502525).
No. of Test CyclesCPS801010CLM403030CPS502525
Onset
(°C)
Peak
(°C)
Latent Heat of Fusion (kJ/kg)Onset
(°C)
Peak
(°C)
Latent Heat of Fusion (kJ/kg)Onset
(°C)
Peak
(°C)
Latent Heat of Fusion (kJ/kg)
019.0924.79162.4024.0326.09154.2521.7826.52183.11
5018.9226.43161.7715.5025.8465.0919.1625.21144.49
10018.8624.77157.7714.8624.54148.4018.2222.88179.26
15018.4024.27176.3915.9123.45162.4719.4722.94180.33
20018.4324.44152.3615.5423.86150.7417.0222.67168.15
25018.1027.25141.3414.8124.19121.1718.1523.98181.72
30018.5025.22157.8014.8024.23130.9018.2922.76173.89
Table 10. Latent heat of fusion and melting temperature of developed materials with test cycles (CPS602020, CLM303535, CLP9055).
No. of Test CyclesCPS602020CLM303535CLP9055
Onset
(°C)
Peak
(°C)
Latent Heat of Fusion (kJ/kg)Onset
(°C)
Peak
(°C)
Latent Heat of Fusion (kJ/kg)Onset
(°C)
Peak
(°C)
Latent Heat of Fusion (kJ/kg)
019.5123.30164.8025.7528.40136.5220.4628.41140.03
5019.0923.58149.4119.6425.09131.1320.3527.49124.76
10018.3824.29133.7220.6626.32206.2120.1628.37163.88
15018.5223.21147.1418.7024.74148.3615.7427.73138.33
20018.2822.52151.0915.4124.90136.3821.6128.42146.53
25018.1823.40170.5015.1524.97152.3819.7428.58155.39
30018.2024.09178.8515.2225.72160.1923.8328.07164.27
Table 11. Latent heat of fusion and melting temperature of developed materials with test cycles (CLM9055, CPS9055, CMS9055).
No. of Test CyclesCLM9055CPS9055CMS9055
Onset
(°C)
Peak
(°C)
Latent Heat of Fusion (kJ/kg)Onset
(°C)
Peak
(°C)
Latent Heat of Fusion (kJ/kg)Onset
(°C)
Peak
(°C)
Latent Heat of Fusion (kJ/kg)
020.8329.16124.6419.8324.83128.0928.0529.83160.71
5015.2528.65133.9019.5724.90152.3423.6525.39236.78
10020.1628.64135.3219.8625.26147.4216.2224.33163.31
15021.0328.70143.1720.8828.80148.4915.5824.88158.01
20019.7728.48139.3719.5729.73136.2115.8523.57167.37
25016.5328.92145.5019.3429.63156.0416.1224.03139.40
30015.6628.01147.9619.3624.78125.5416.4421.44168.29
Table 12. Latent heat of fusion and melting temperature of developed materials with test cycles (CLS9055).
No. of Test CyclesCLS9055
Onset
(°C)
Peak
(°C)
Latent Heat of Fusion (kJ/kg)
021.8128.10144.91
5021.0428.18128.35
10021.8429.77144.91
15021.2727.45195.55
20020.9427.67177.99
25020.9829.99142.98
30020.8528.59135.42
Table 13. TGA result of the different developed materials.
Laboratory Code/NameTonset
(°C)
Tmax
(°C)
Toffset
(°C)
Mass Loss
(%)
CLP303535185.19226.50258.0097.93
CLP701515195.22224.58248.4088.14
CLS701515190.45226.40250.5792.83
CLM602020185.30229.70255.1096.87
CMS602020189.73230.30270.88101.75
CMS701515180.80223.27264.3680.26
CMS502525186.02220.91255.1091.95
CMP701515189.01225.40258.8286.25
CLP403030207.05232.30250.5798.13
CMP602020189.67212.61237.4496.89
CLM701515183.25221.25251.5991.92
CMP-502525216.75232.80242.3293.99
CMS801010191.56208.95226.4792.46
CLM801010206.18213.62220.9395.67
CLP801010186.74223.30243.0497.30
CLS801010182.20213.00228.81100.0
CPS701515173.95211.70252.8491.17
CMP801010187.46221.10240.7794.42
CPS801010182.36222.70264.0384.90
CLM403030183.75226.60238.5089.90
CPS502525193.55230.10285.8496.46
CPS602020170.24211.30259.5494.57
CLM303535203.24248.80263.3684.27
CLP9055188.29224.50239.3397.59
CLM9055179.22216.60233.3592.14
CPS9055182.21217.80240.7893.25
CMS9055176.95217.90239.3397.92
CLS9055185.30220.10234.80101.37
Table 14. Overall variation in melting temperature with the average latent heat of fusion.
Laboratory Code/NameVariation in Melting Peak
(%)
Variation in the Latent Heat of the Fusion
(%)
Mean Latent Heat of Fusion
(kJ/kg)
Categorization Based on Thermal Cycle Stability *
CLP303535−3.00–9.42−2.26–32.00165.06+
CLP701515−1.18–12.05−3.59–52.83136.80++
CLS701515−3.99–9.00−61.00–96.16136.54+++
CLM602020−3.16–4.75−11.78–7.12152.27+
CMS602020−2.39–6.83−21.75–0.00155.93+
CMS701515−2.07–10.99−24.48–00.00142.02+
CMS502525−5.56–2.21−1.69–20.62157.03+
CMP701515−1.10–7.78−14.75–23.67155.13+
CLP403030−14.79–0.00−15.58–46.86136.43++
CMP602020−2.28–11.370–17.00146.56+
CLM701515−9.57–0.000.00–82.51146.12+++
CMP502525−5.92–2.84−20.51–14.65167.61+
CMS801010−6.46–10.59−24.79–0.00152.83+
CLM801010−7.98–2.06−26.39–0.00146.60+
CLP801010−4.95–6.820.00–68.34137.20++
CLS801010−11.83–2.22−28.47–1.61143.32+
CPS701515−4.00–10.96−19.50–13.71139.64+
CMP801010−6.41–0.000.00–33.51153.08+
CPS801010−2.10–9.92−12.97–8.61158.55+
CLM403030−34.07–0.00−57.80–5.33133.29++
CPS502525−14.52–0.00−21.09–0.00172.99+
CPS602020−3.35–4.24−18.86–8.53156.50+
CLM303535−12.89–0.00−3.95–31.05153.02+
CLP9055−3.24–0.60−10.90–17.31147.60+
CLM9055−3.94–0.000.00–18.71138.55+
CPS9055−0.20–19.73−1.99–21.82142.02++
CMS9055−28.13–0.00−13.26–47.33170.55++
CLS9055−2.31–6.72−11.42–34.94152.87+
* Categorization of the PCMs based on thermal cycle test: + Promising; ++ least promising; +++ Not promising.
Publisher’s Note: MDPI stays neutral with regard to jurisdictional claims in published maps and institutional affiliations.

