3.3.1. Paper
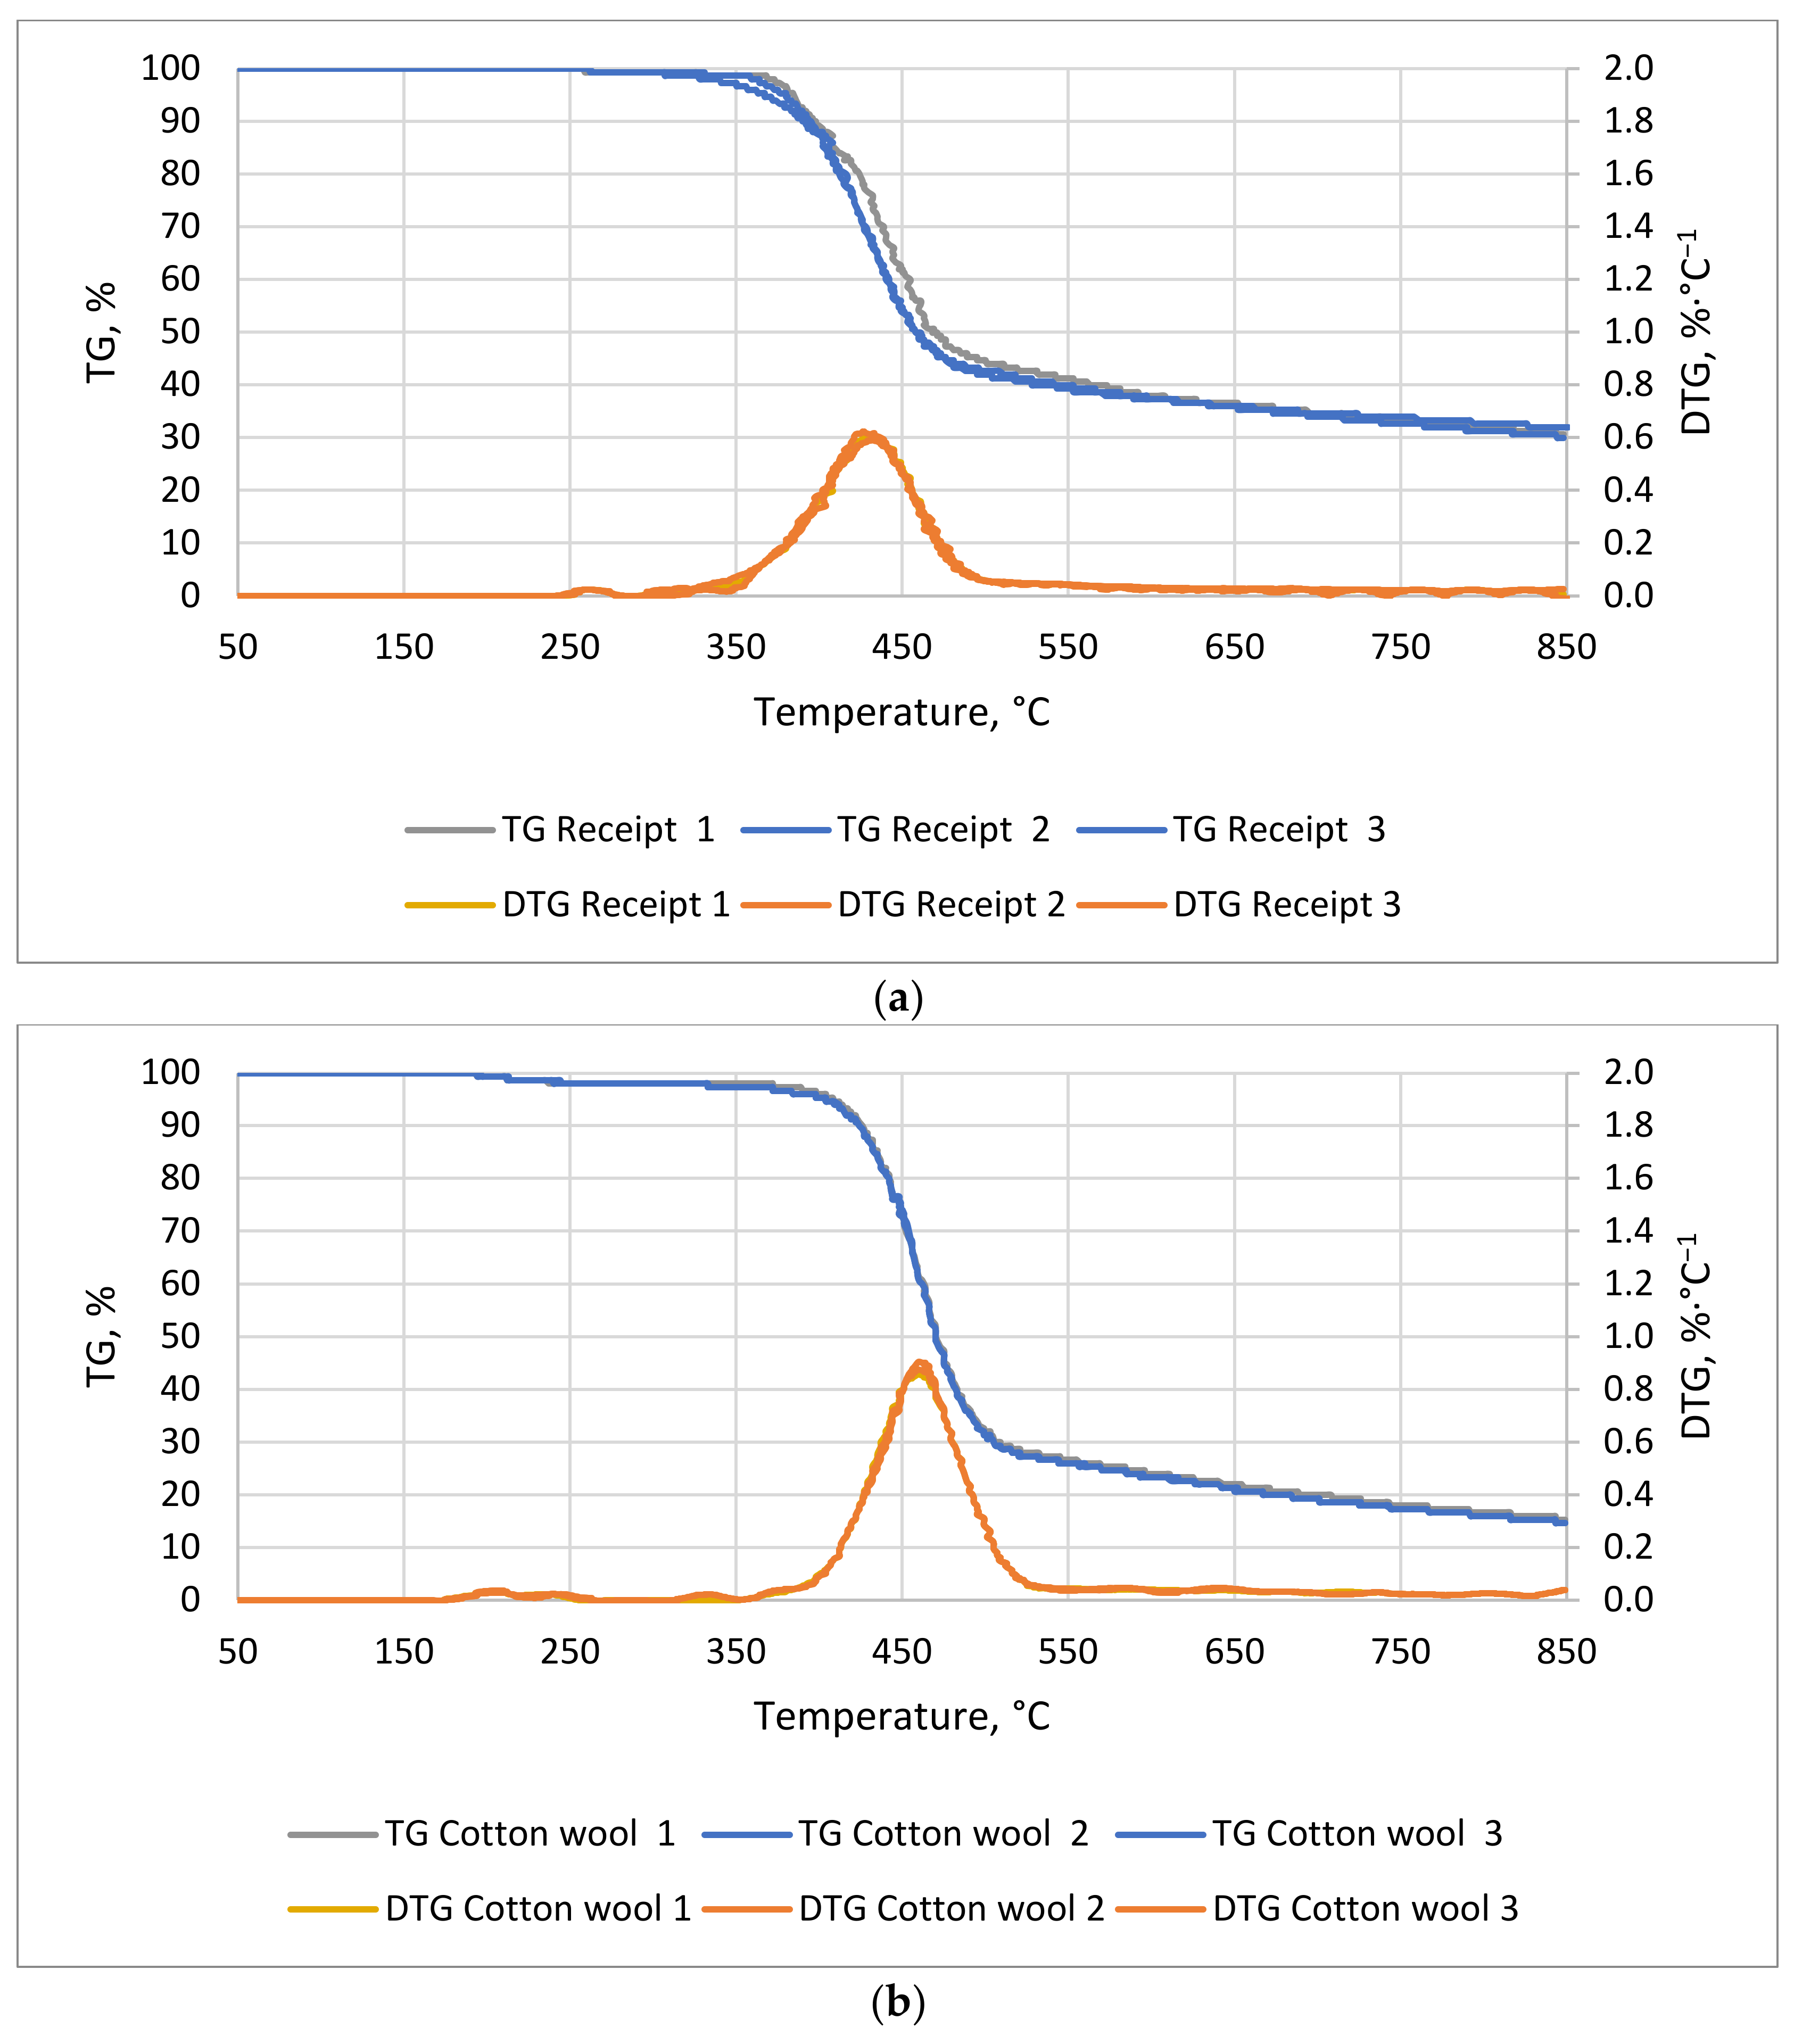
A decrease in mass as a function of temperature for the receipts (
Figure 1a) and the cotton wool was observed (
Figure 1b). The lag phase of the cotton lasted 36 min and that of the receipts lasted 50 min, at temperatures of 194 and 258 °C, respectively. The most dynamic weight decreases for cotton wool occurred between 77 and 101 min, from 396 to 513 °C, respectively, whereas that for receipts occurred between 68 and 95 min, from 350 to 480 °C, respectively. An observed decrease in mass was related to the decomposition of organic compounds, such as hemicellulose, cellulose, and lignin. The thermal degradation of these compounds occurred in the ranges of 220–320 °C, 320−400 °C, and 320−900 °C, respectively [
40,
41].
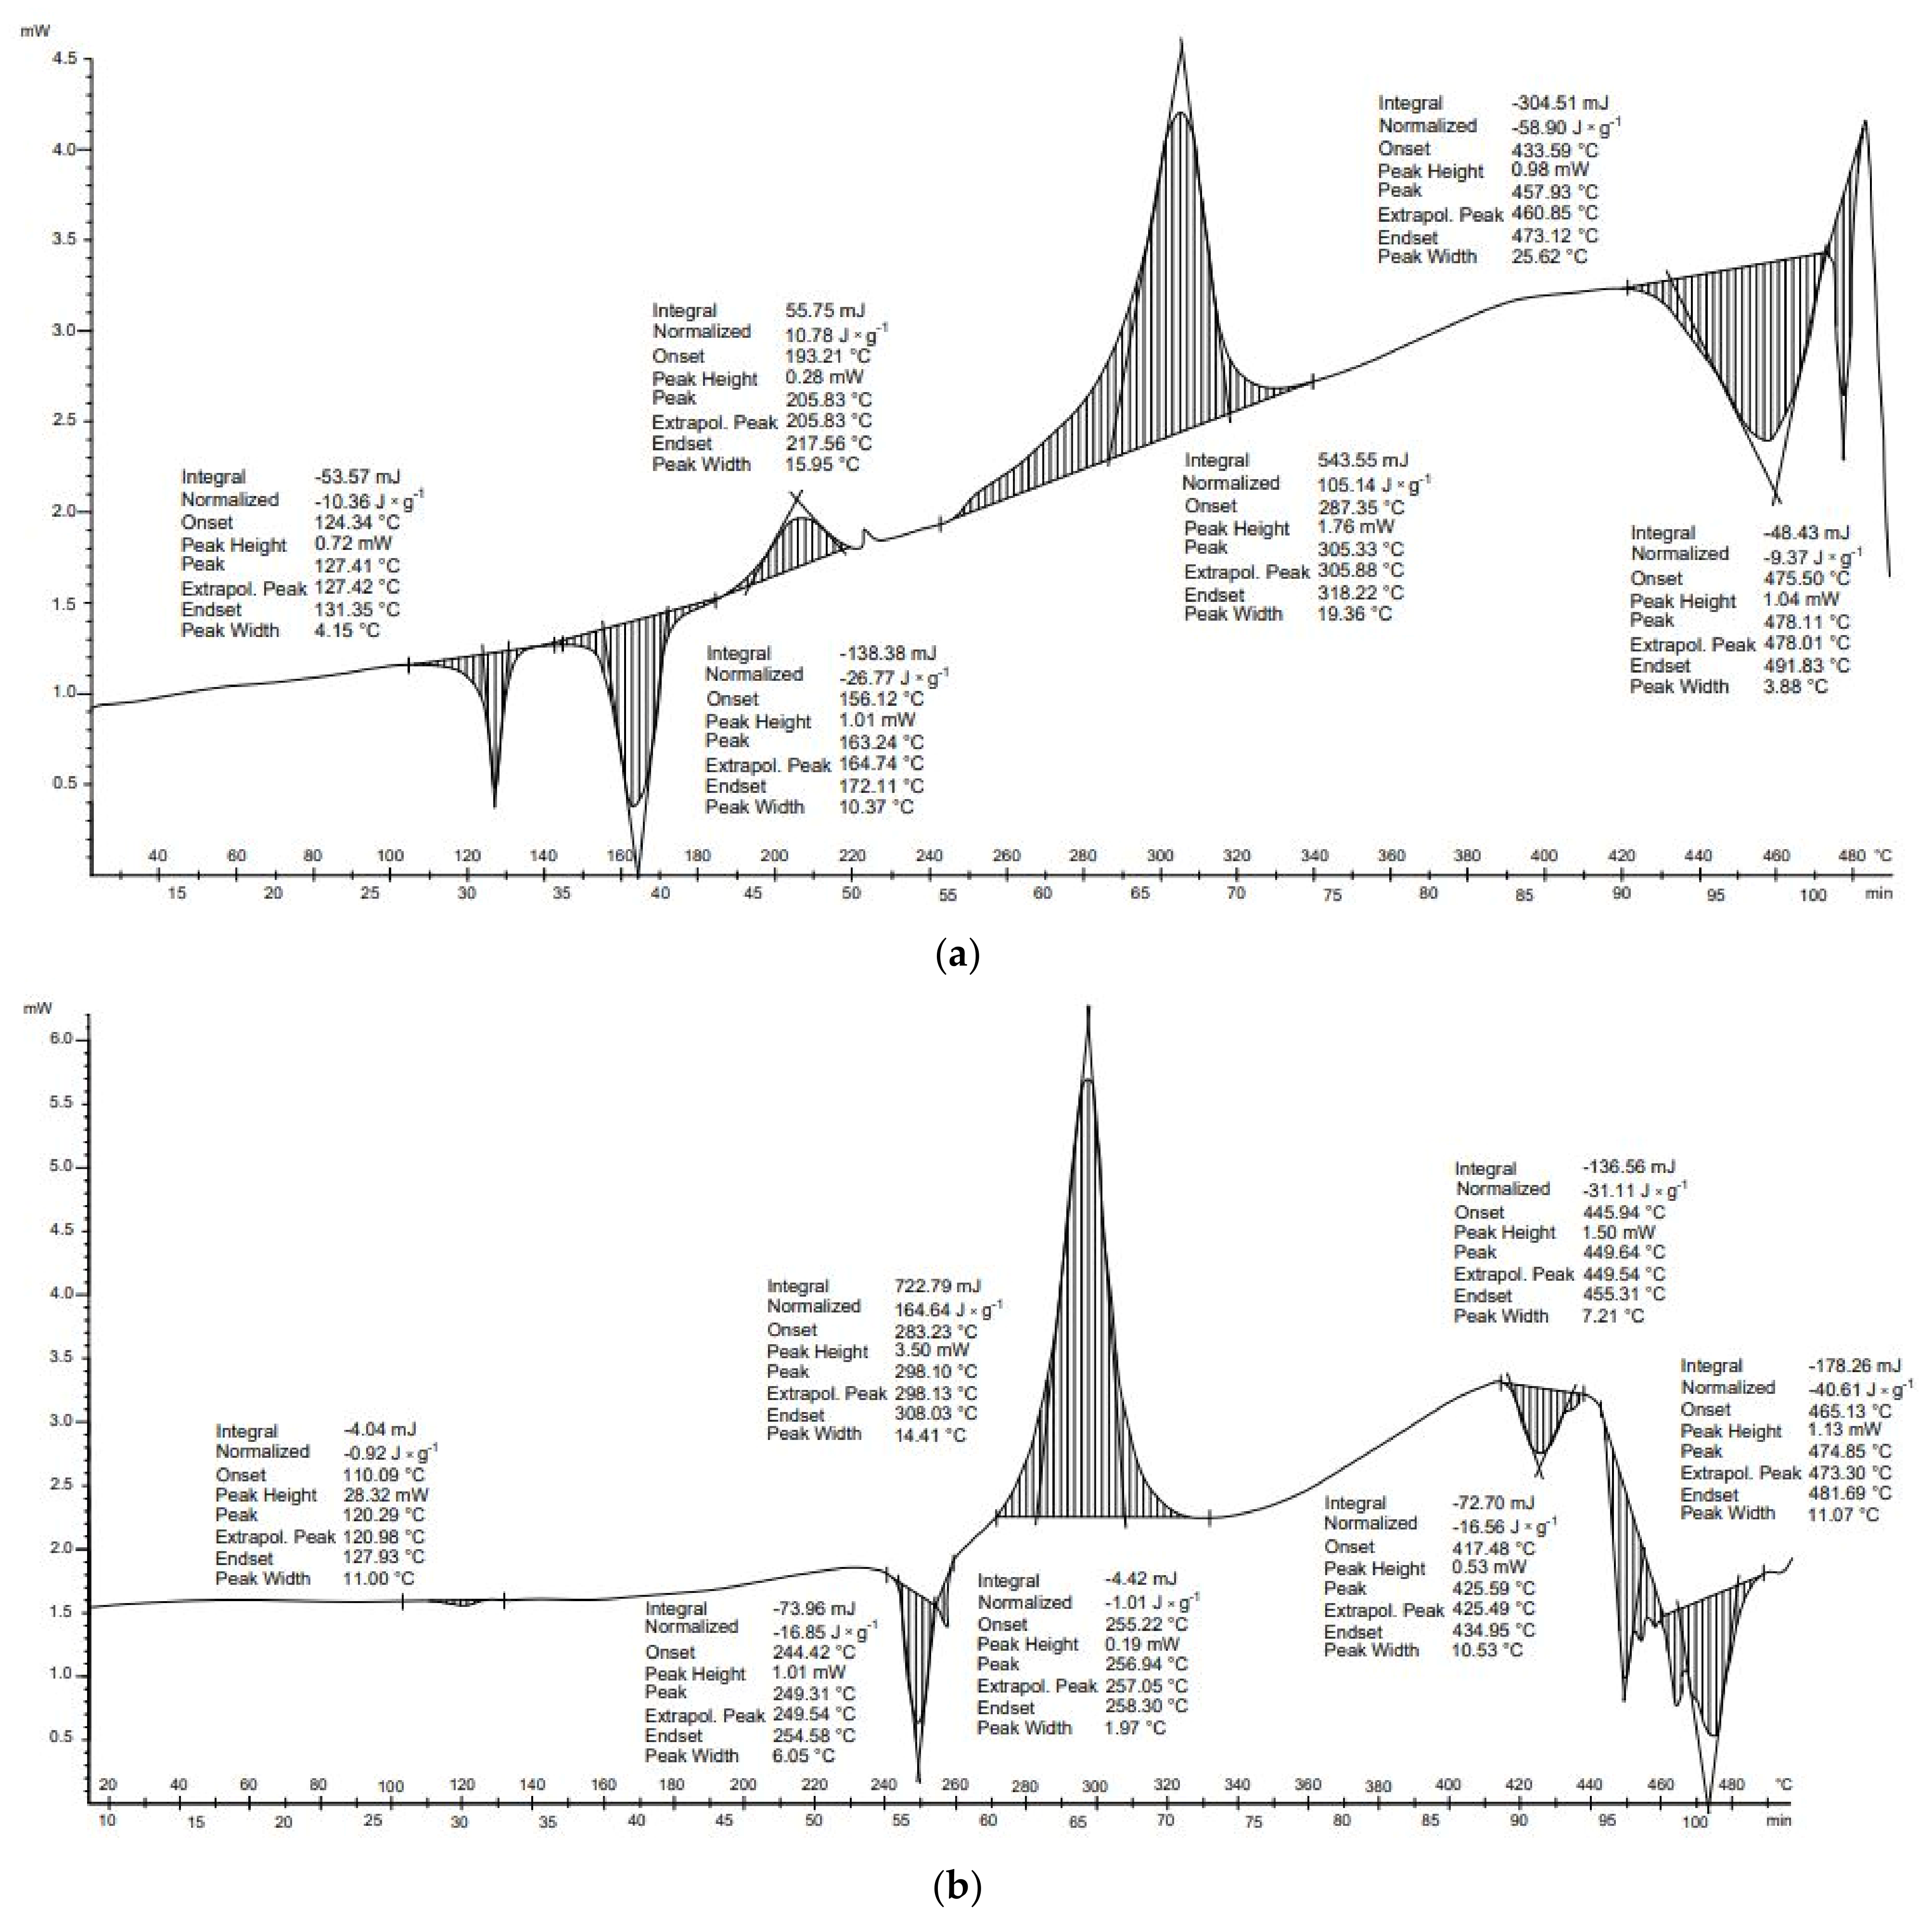
Three transformations for both receipts (
Figure 2a) and cotton wool (
Figure 2b) were identified during DSC tests. The first and the second were exothermic, and the third was endothermic. These transformations were also characterized by similar start and end temperatures. The balance of these transformations was higher for the cotton wool sample. Both samples are composed mainly of cellulose. The receipts additionally include the compounds present in the carcasses. The first of the transformations, in both samples, occurred at about 200 °C. This explains the onset of hemicellulose depolymerization and, in the case of receipts, it may also be related to bisphenol A, which is present in some receipts. The boiling point of this compound is 220 °C [
42]. The temperatures of the other two transformations indicate that they are associated with the decomposition of biopolymers: hemicellulose at 220−320 °C, cellulose at 320−400 °C, and lignin at 320−900 °C [
43].
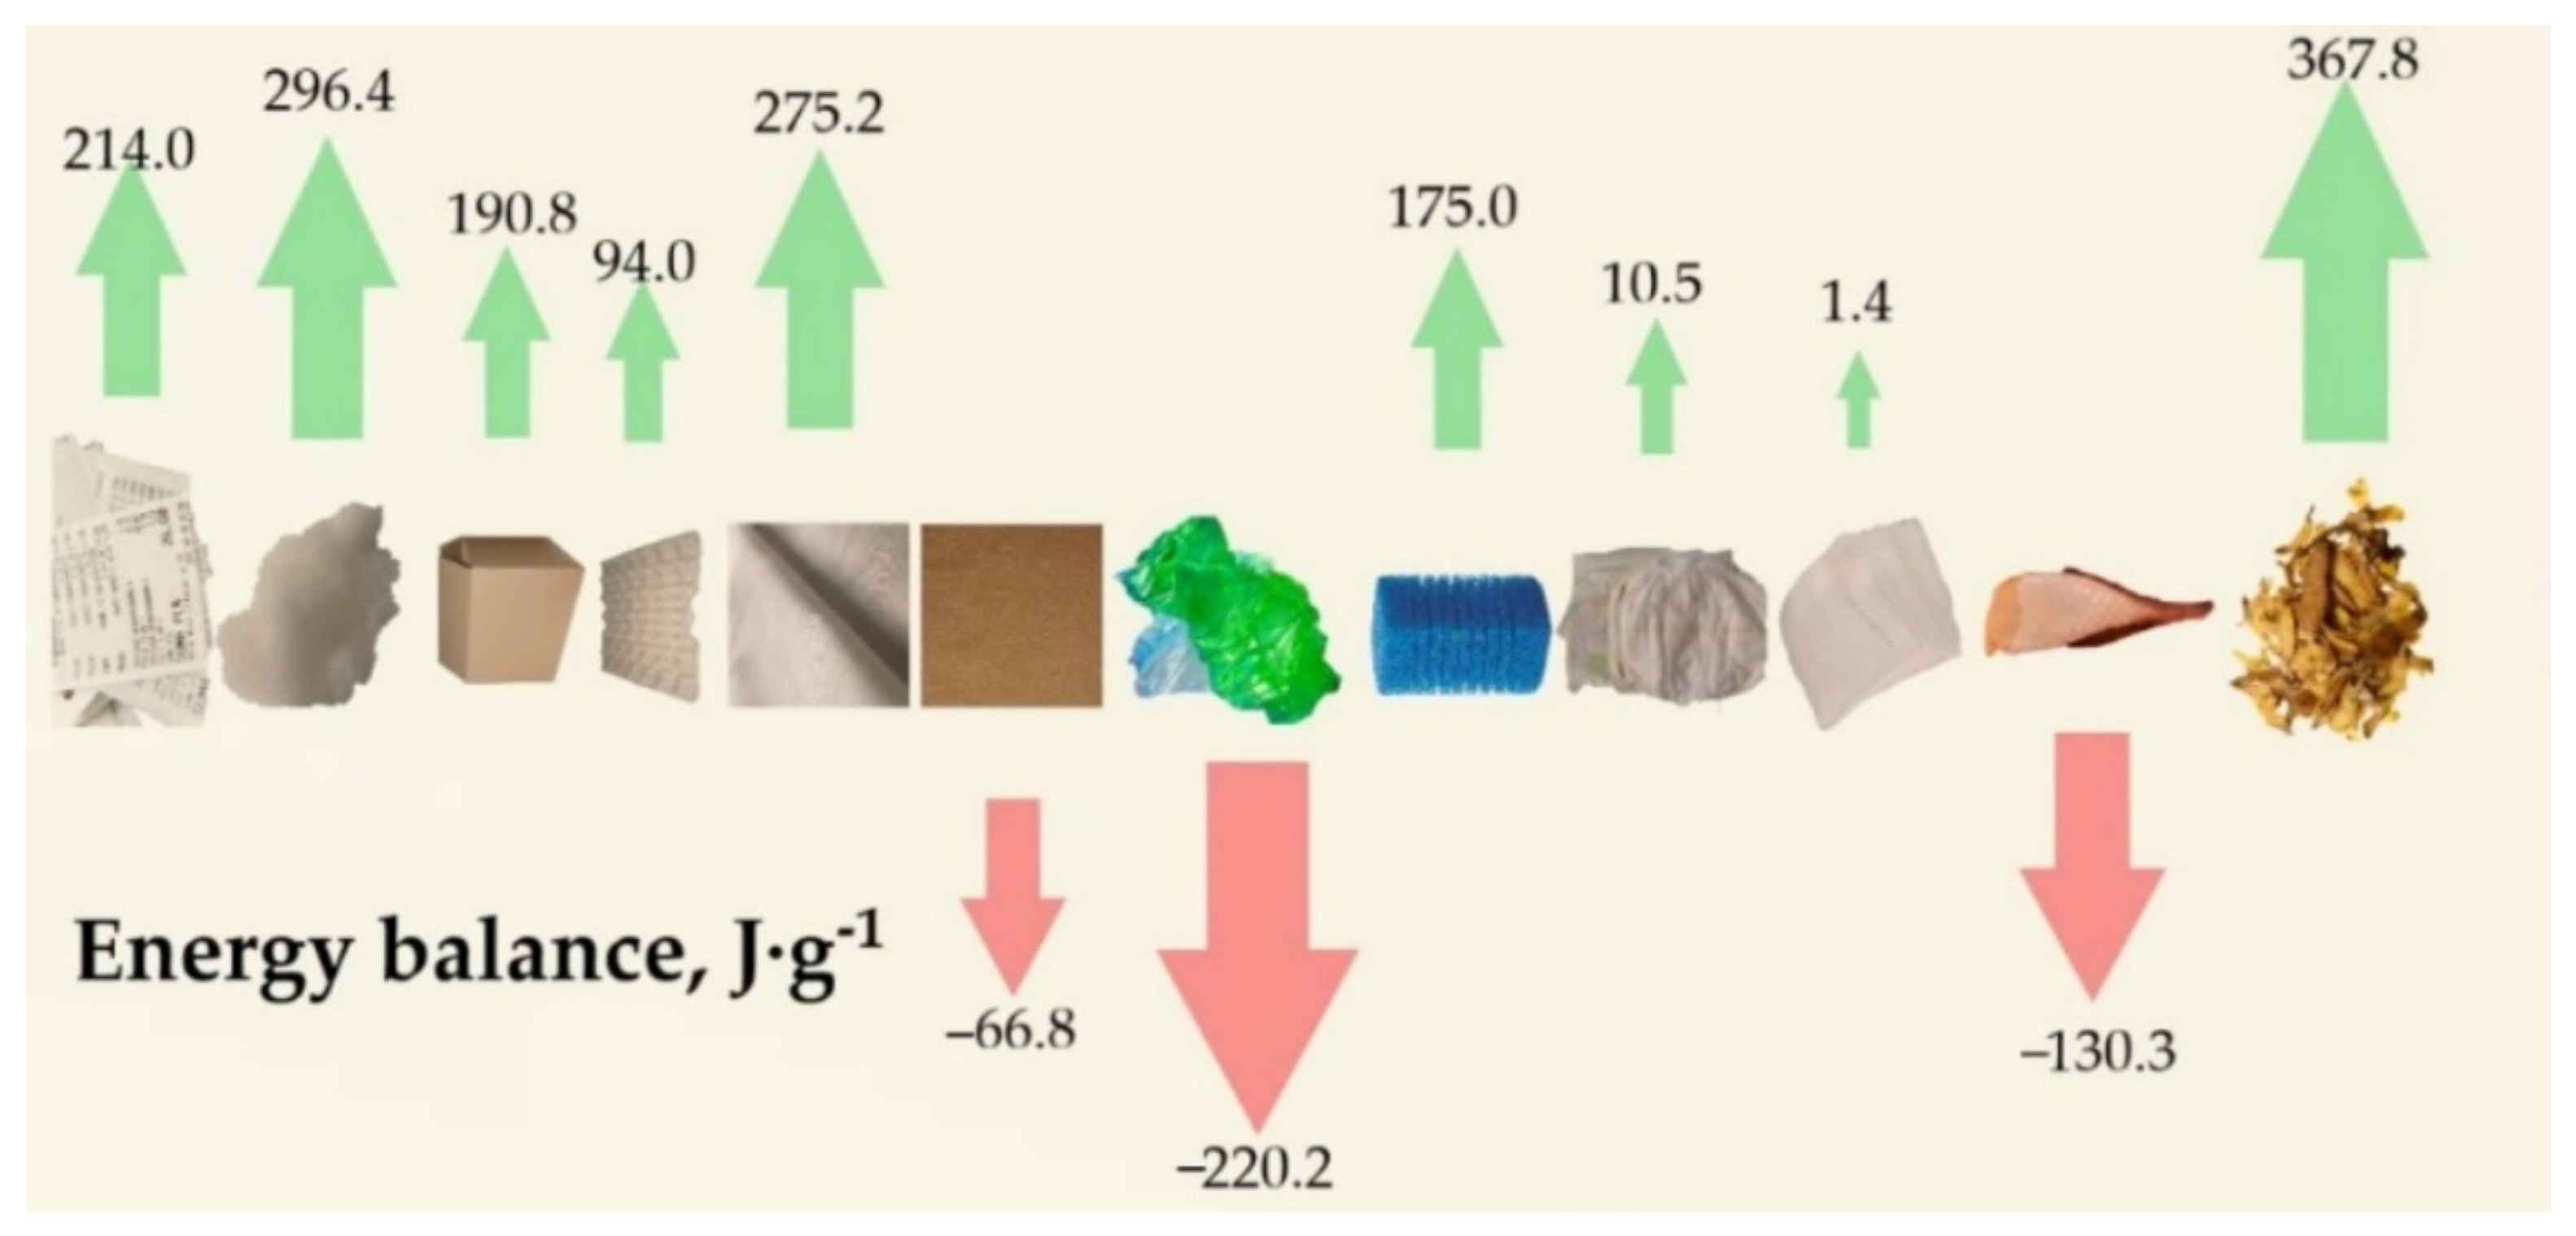
The energy balance determines the energy of transformations occurring during the thermal conversion process of the tested materials (
Table 3). Reactions are divided into exothermic and endothermic.
Three transformations occurred in the thermal analysis of the receipts. The first and second transformations were exothermic and released 5.3 and 344.6 J × g−1 of energy, respectively. The third transformation was endothermic and absorbed 135.9 J × g−1. As a result, the energy balance of thermal transformation for receipts was positive (214.0 J × g−1). This means that more energy was released than absorbed during transformations. In the case of cotton wool, the first transformation was exothermic (21.0 J × g−1), the second transformation exothermic (399.0 J × g−1), and the final transformation endothermic (−123.3 J × g−1). The energy balance of the thermal conversion of this material was positive (296.4 J × g−1).
For both materials, DSC results show that an endothermal reaction occurred above 400 °C (
Figure 2). This suggests that temperatures above 400 °C should be avoided to decrease the energy needs for the pyrolysis process of paper wastes.
Paper wastes are a mixture of materials such as cellulose, hemicellulose, and lignin, and other chemical additives that might affect results obtained from DSC results. In the work of Stępień et al. [
14], various elements of refuse-derived fuel (RDF) were tested by TGA/DSC analyses to determine the energy needed for the torrefaction process. During torrefaction, the material is heated from room temperature to 300 ºC. According to Stępień et al. [
14], paper waste has the highest energy demand of 1061 J × g
−1. These findings confirm that high temperatures should be avoided to ensure a low level of required process energy.
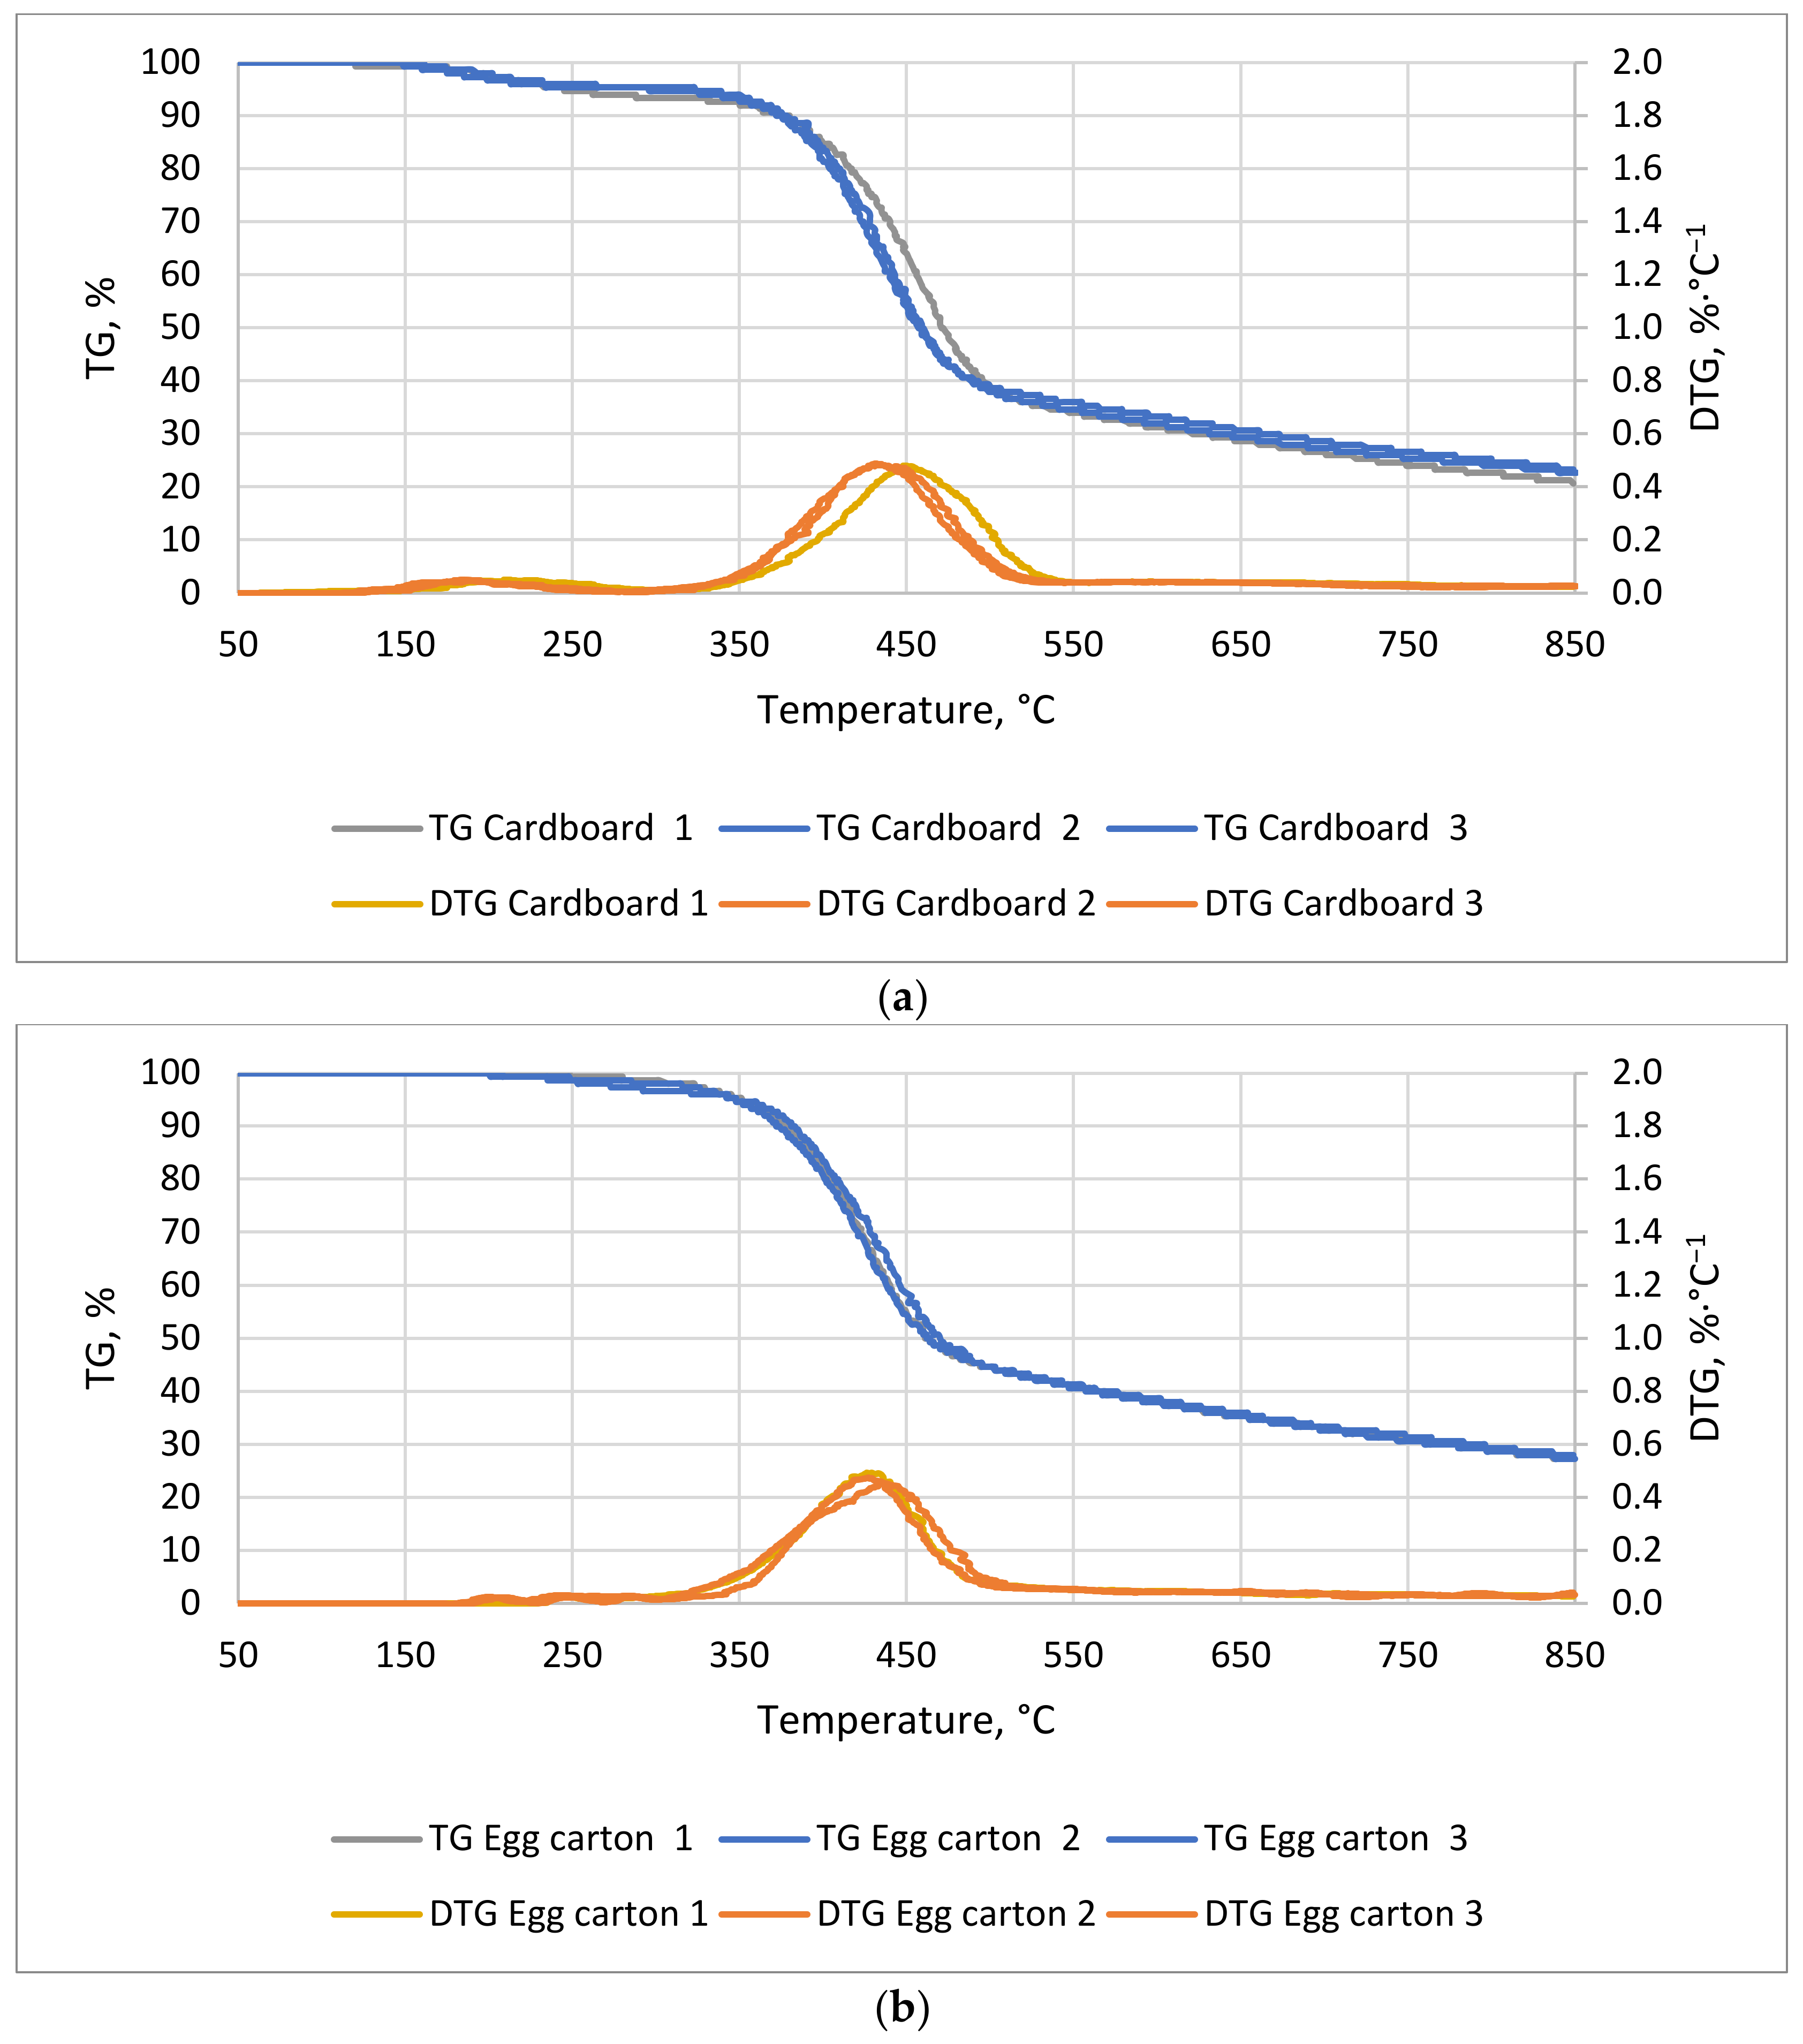
3.3.2. Cardboard
In the case of cardboard (
Figure 3a), the first mass decrease occurred around 28 min at 150 °C and the second occurred at 73 min at 375 °C. The first lasted about 18 min and the second 28 min. The mass decreases ended at 239 and 510 °C, respectively. For the egg cardboard (
Figure 3b), the weight decrease occurred at about 64 min at 330 °C and lasted for 32 min. The decrease in weight for cardboard and egg cartons was mainly related to the decomposition of the pulp, which consists of biopolymers such as cellulose, hemicellulose, and lignin. The decrease in mass began between 200 and 300 °C and was associated with the decomposition of the aforementioned biopolymers [
44].
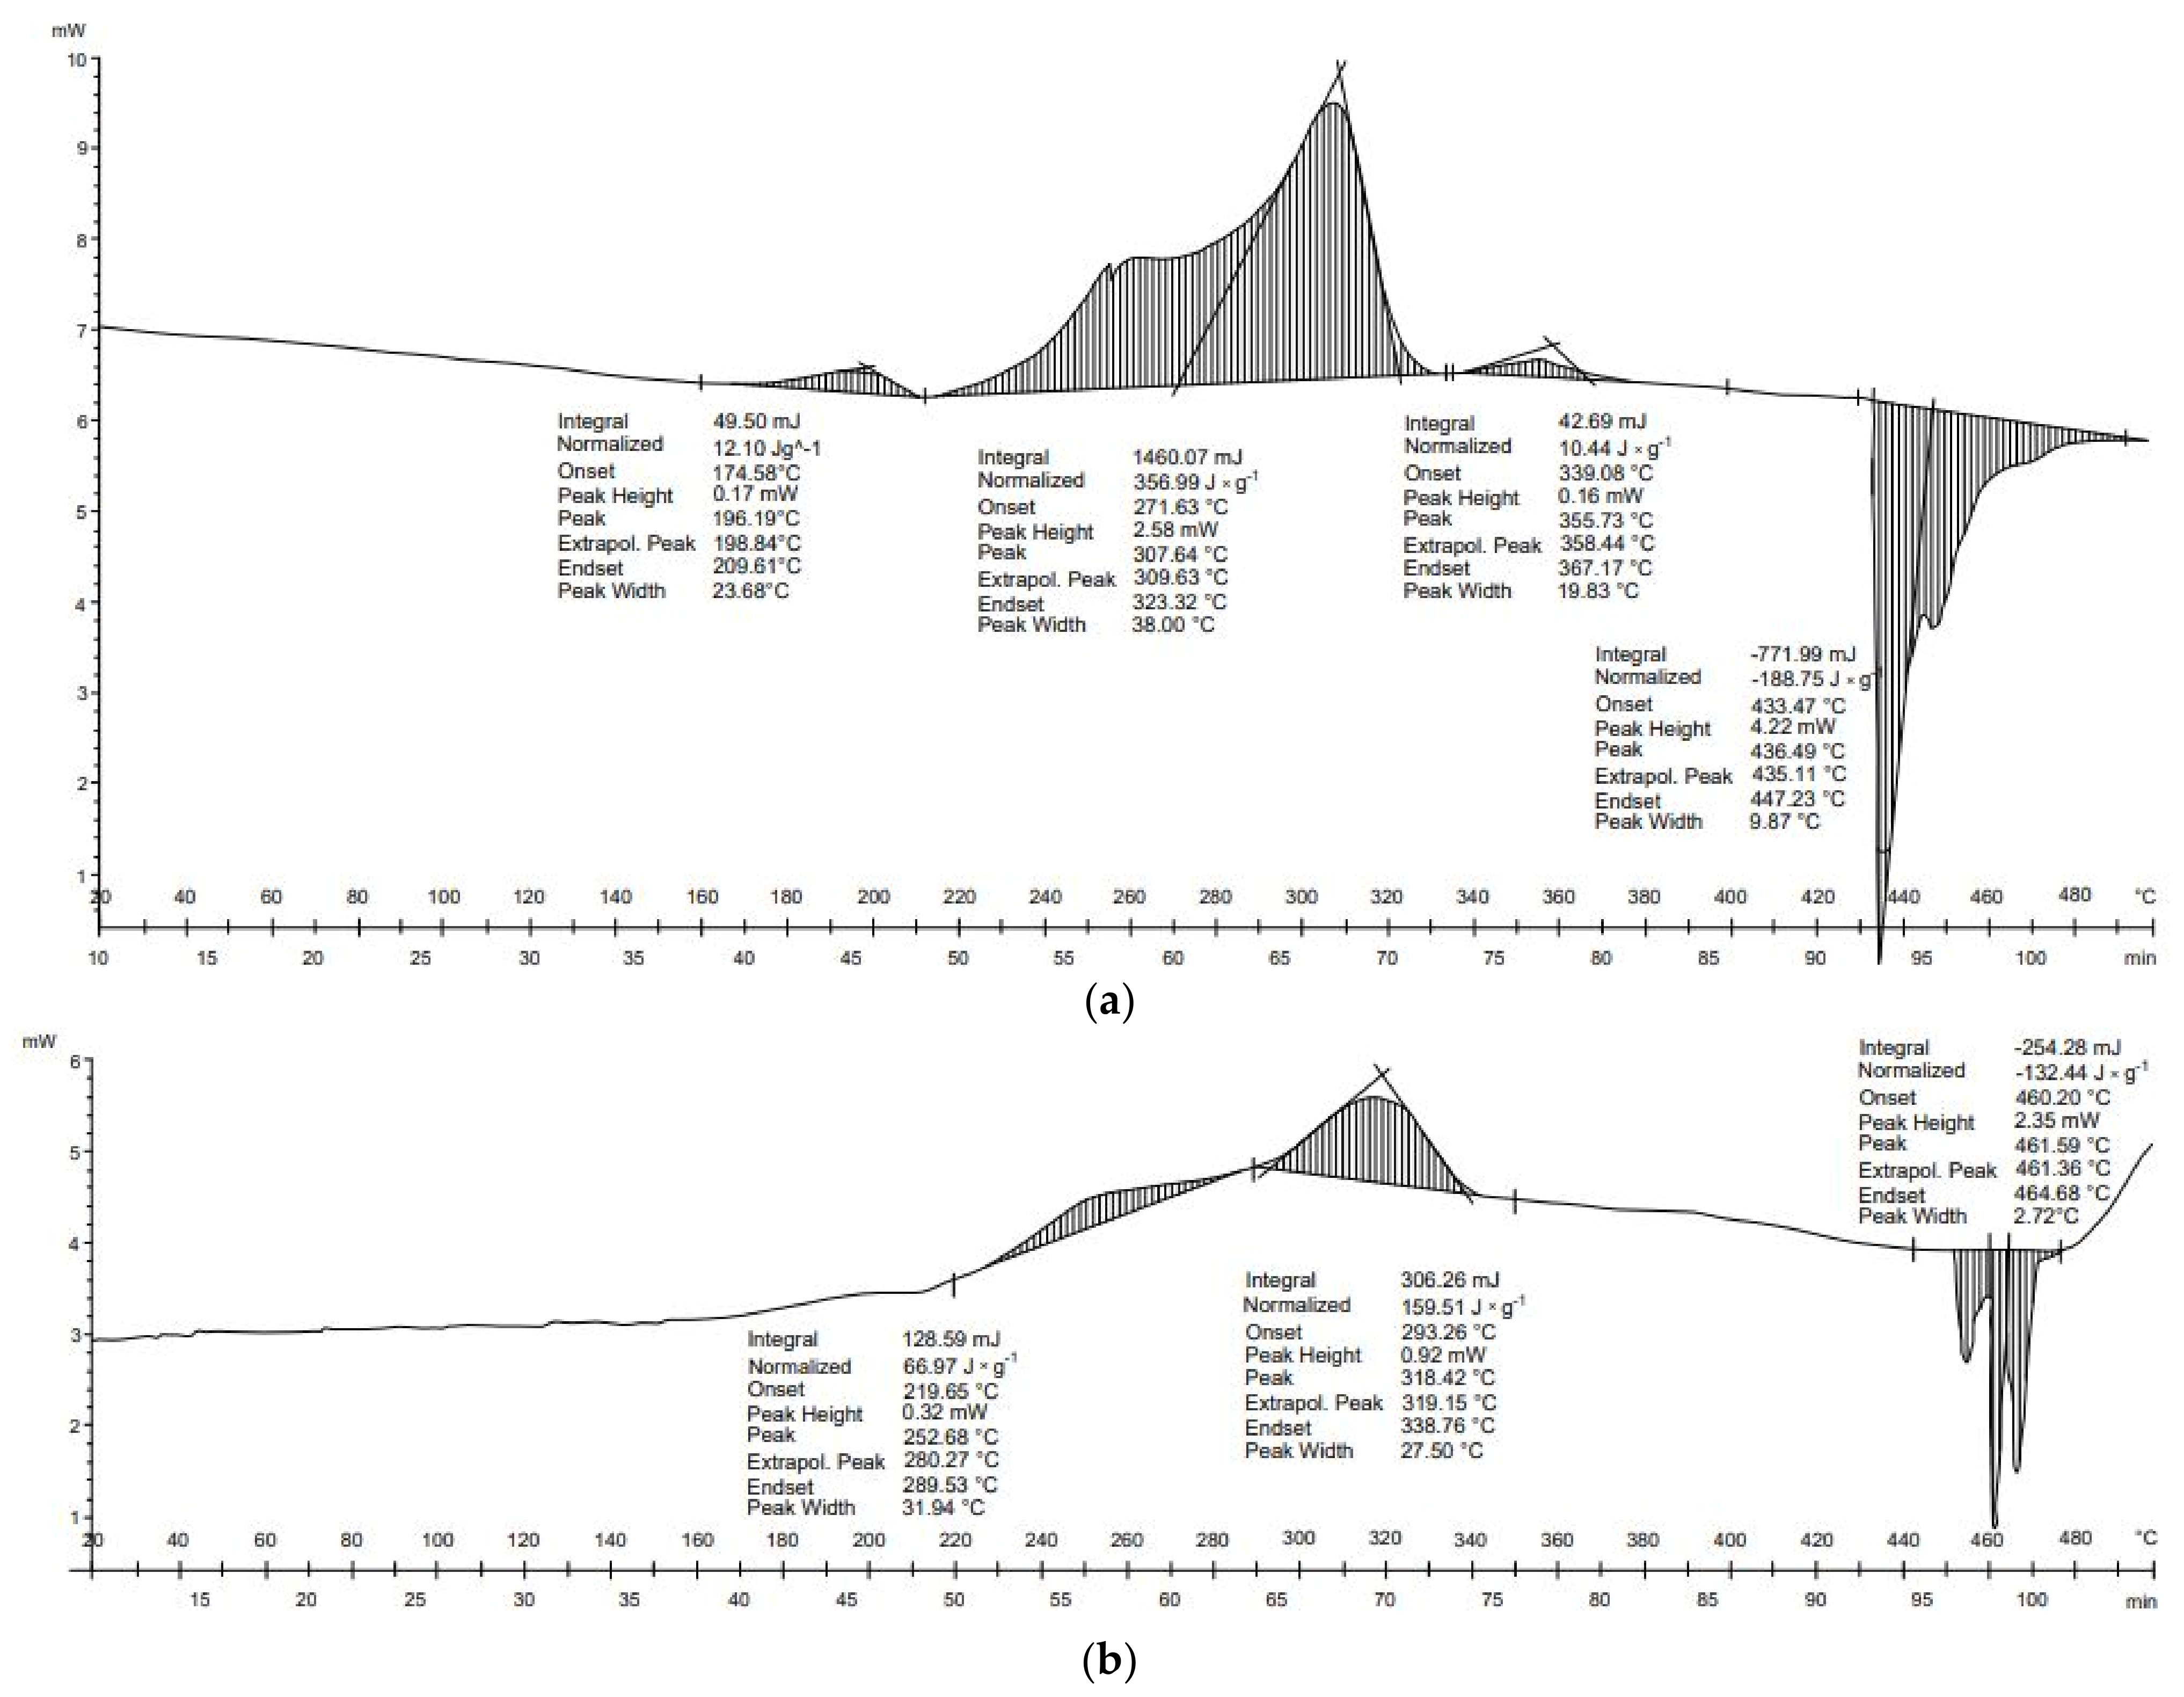
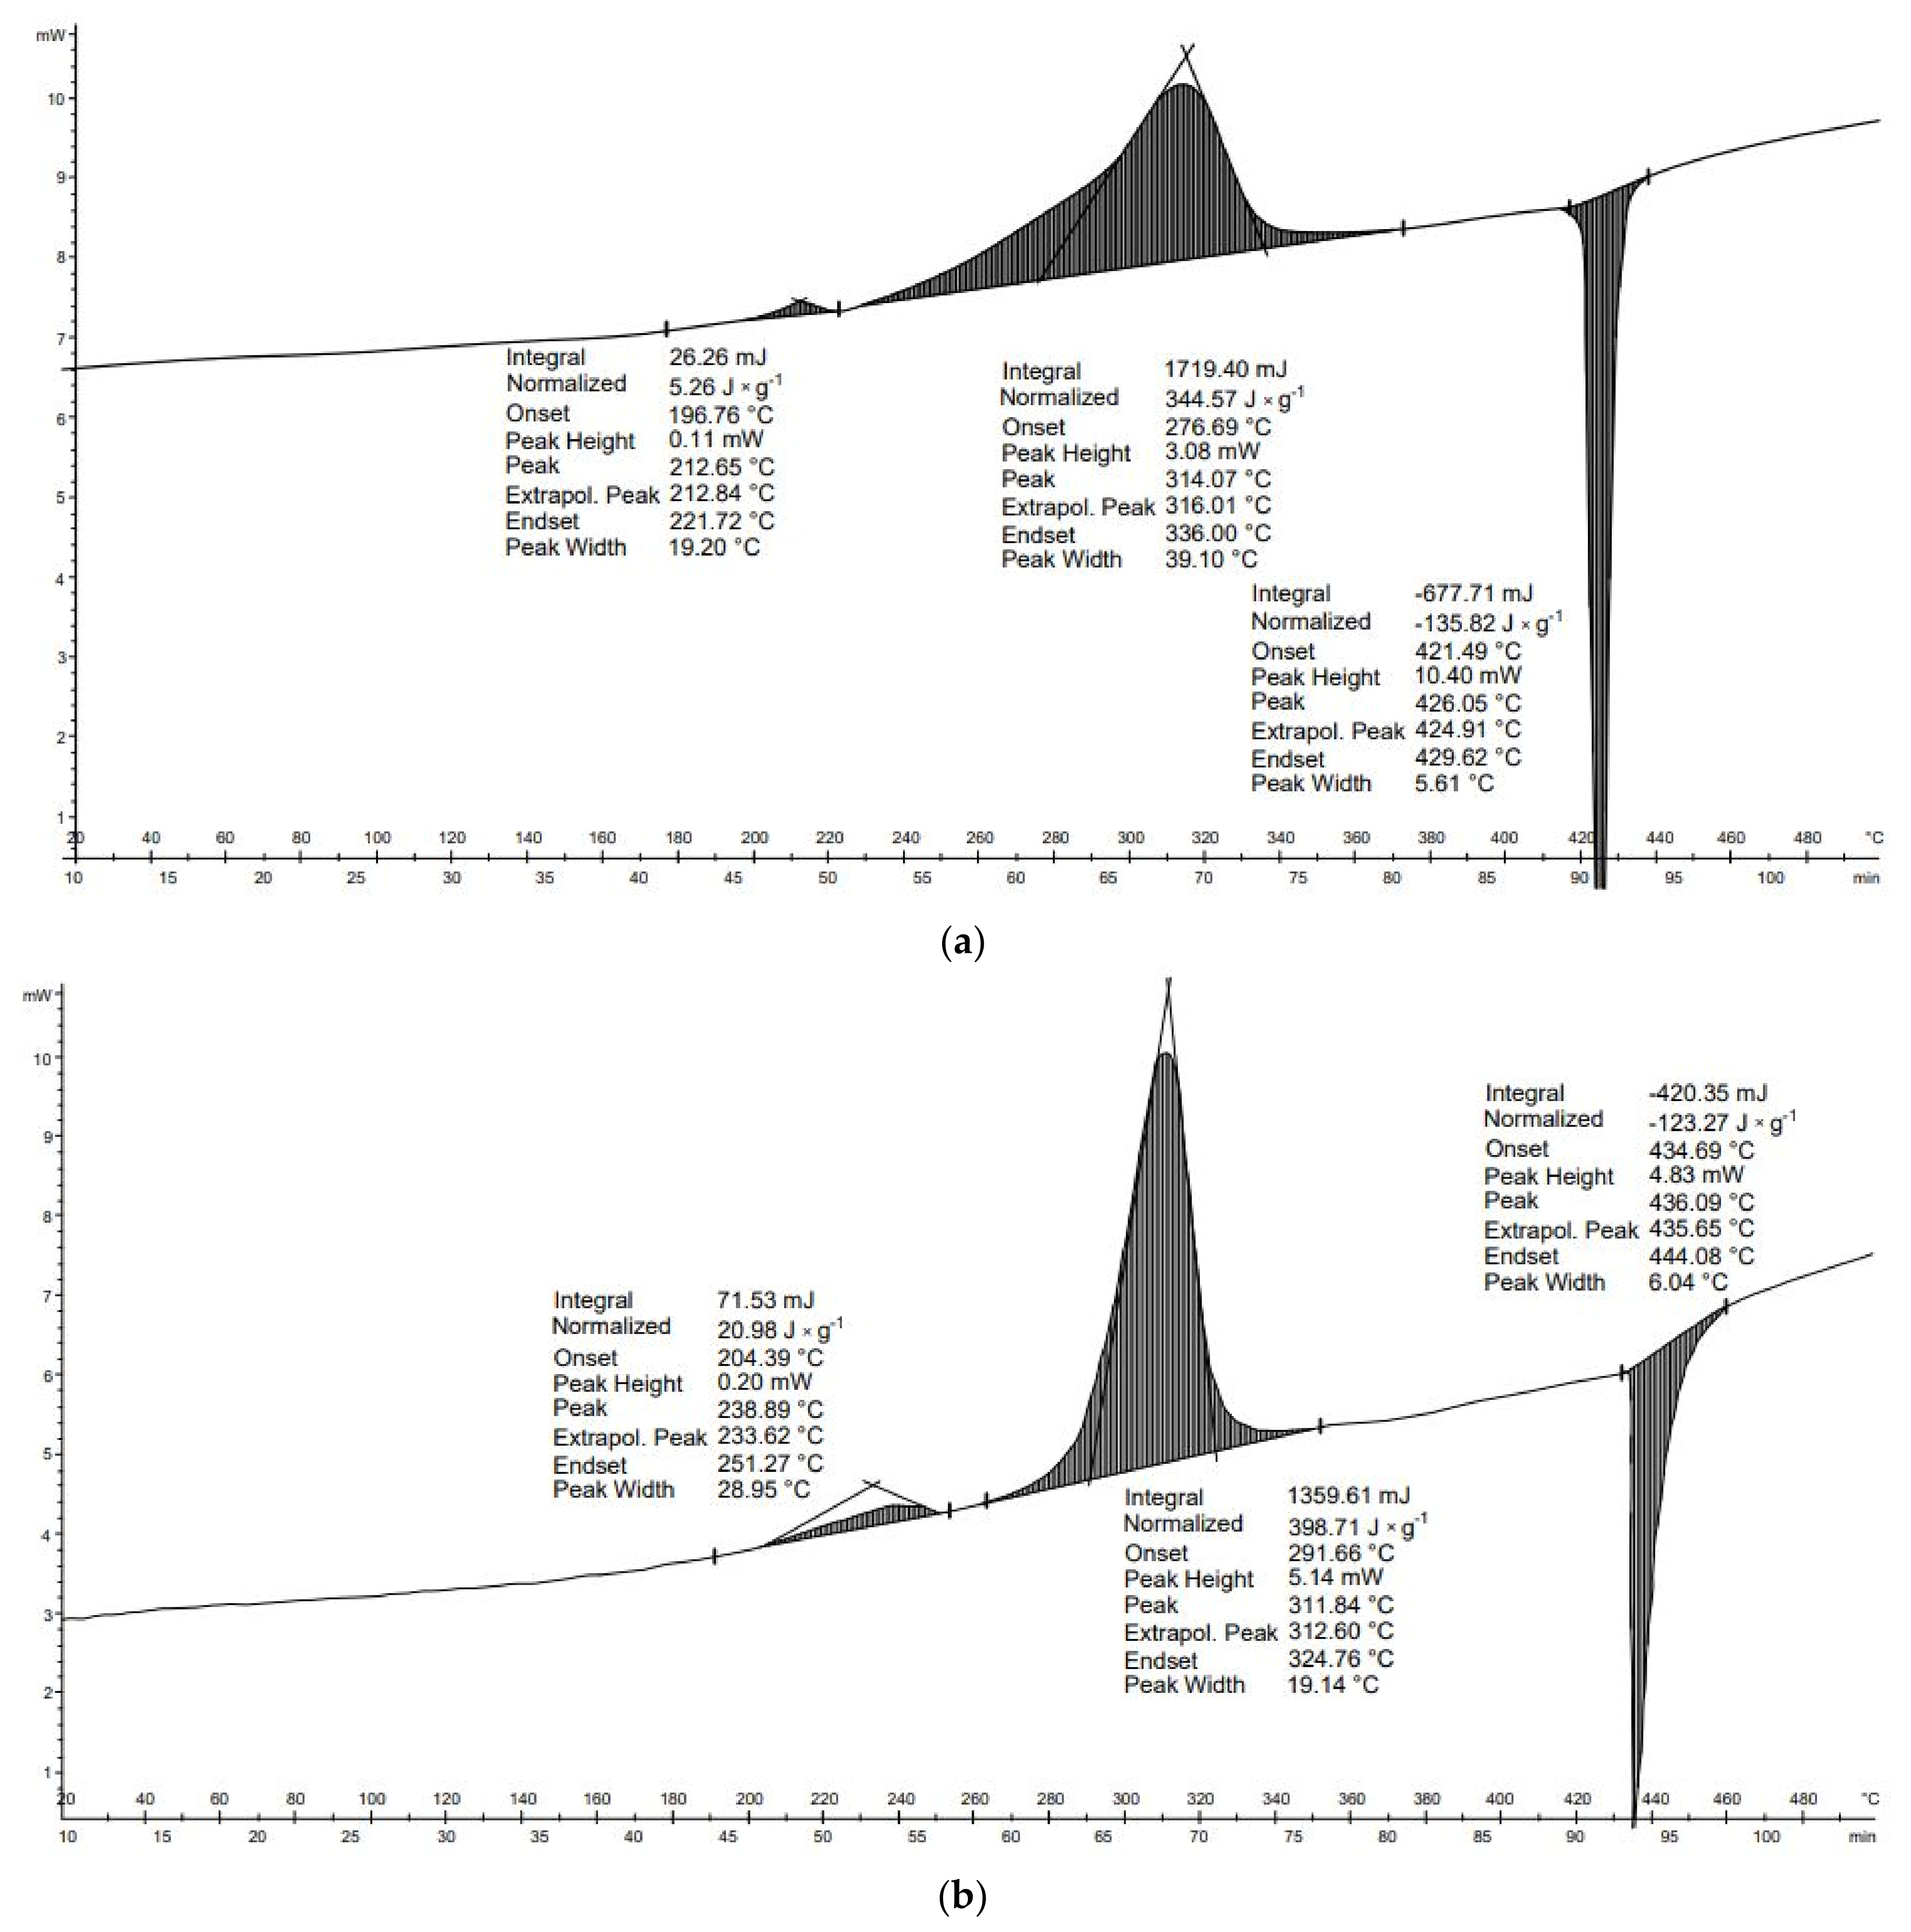
DSC characteristics of cardboard (
Figure 4a) show four transformations—the first, second, and third are exothermic, whereas the fourth is endothermic. Cardboard is a cellulosic material, so both its thermal decomposition and phase transformations should be similar to those of leno, cotton, and paper waste. This is also the case for the egg cardboard sample (
Figure 4b). Unprocessed cardboard wastes contain approximately 32% hemicellulose, 6% lignin, 48% cellulose, and 14% inorganic matter [
40]. The similarity of these materials is that the first transformations are exothermic, whereas the latter are endothermic. There processes are associated with the breakdown of hemicellulose, cellulose, and lignin. They are therefore distributed between 220 and 900 °C.
Four transformations occurred in the thermal analysis of cardboard. The first three transformations were exothermic, and led to the release of heat of 12.1, 357.0, and 10.4 J × g
−1, respectively (
Table 4). The final transformation was endothermic: −188.8 J × g
−1. The energy balance of the transformation of the cardboard was positive (190.8 J × g
−1). In the case of egg cardboard, three transformations occurred. The first and second transformations were exothermic: 67.0 J × g
−1 and 159.5 J × g
−1, respectively. The third, however, was endothermic (−132.4 J × g
−1). As a result, the energy balance of the thermal transformations of egg cardboard was exothermic (94.0 J × g
−1). For both materials, DSC results show that the biggest exothermal reactions took place at 220–340 °C, and endothermal reactions occurred above 420 °C (
Figure 2). This suggests that temperatures above 420 °C should be avoided and process temperatures should be maintained in the range of 220–340 °C to reduce the energy needs for the pyrolysis process of cardboard wastes.
In the work of Stępień et al. [
45], the energy required for cardboard torrefaction was determined. The total energy needs were 1312 J × g
−1. This value was higher than for paper wastes, and these results are consistent with those obtained in the current study. Here, for cardboard waste, transformations showed a lower positive energy balance than for paper wastes. This indicates that more energy is needed for endothermic transformations or exothermic transformations, providing less energy than in the case of paper wastes. The DSC investigations performed in the current study correspond to low-temperature pyrolysis in which the carton was characterized by relatively low energy of transformation for the carton of 190.8 J × g
−1, and for egg cartons of 94.0 J × g
−1; however, these transformations concern only the transformations of the sample, not the whole energy demand of the process [
45].
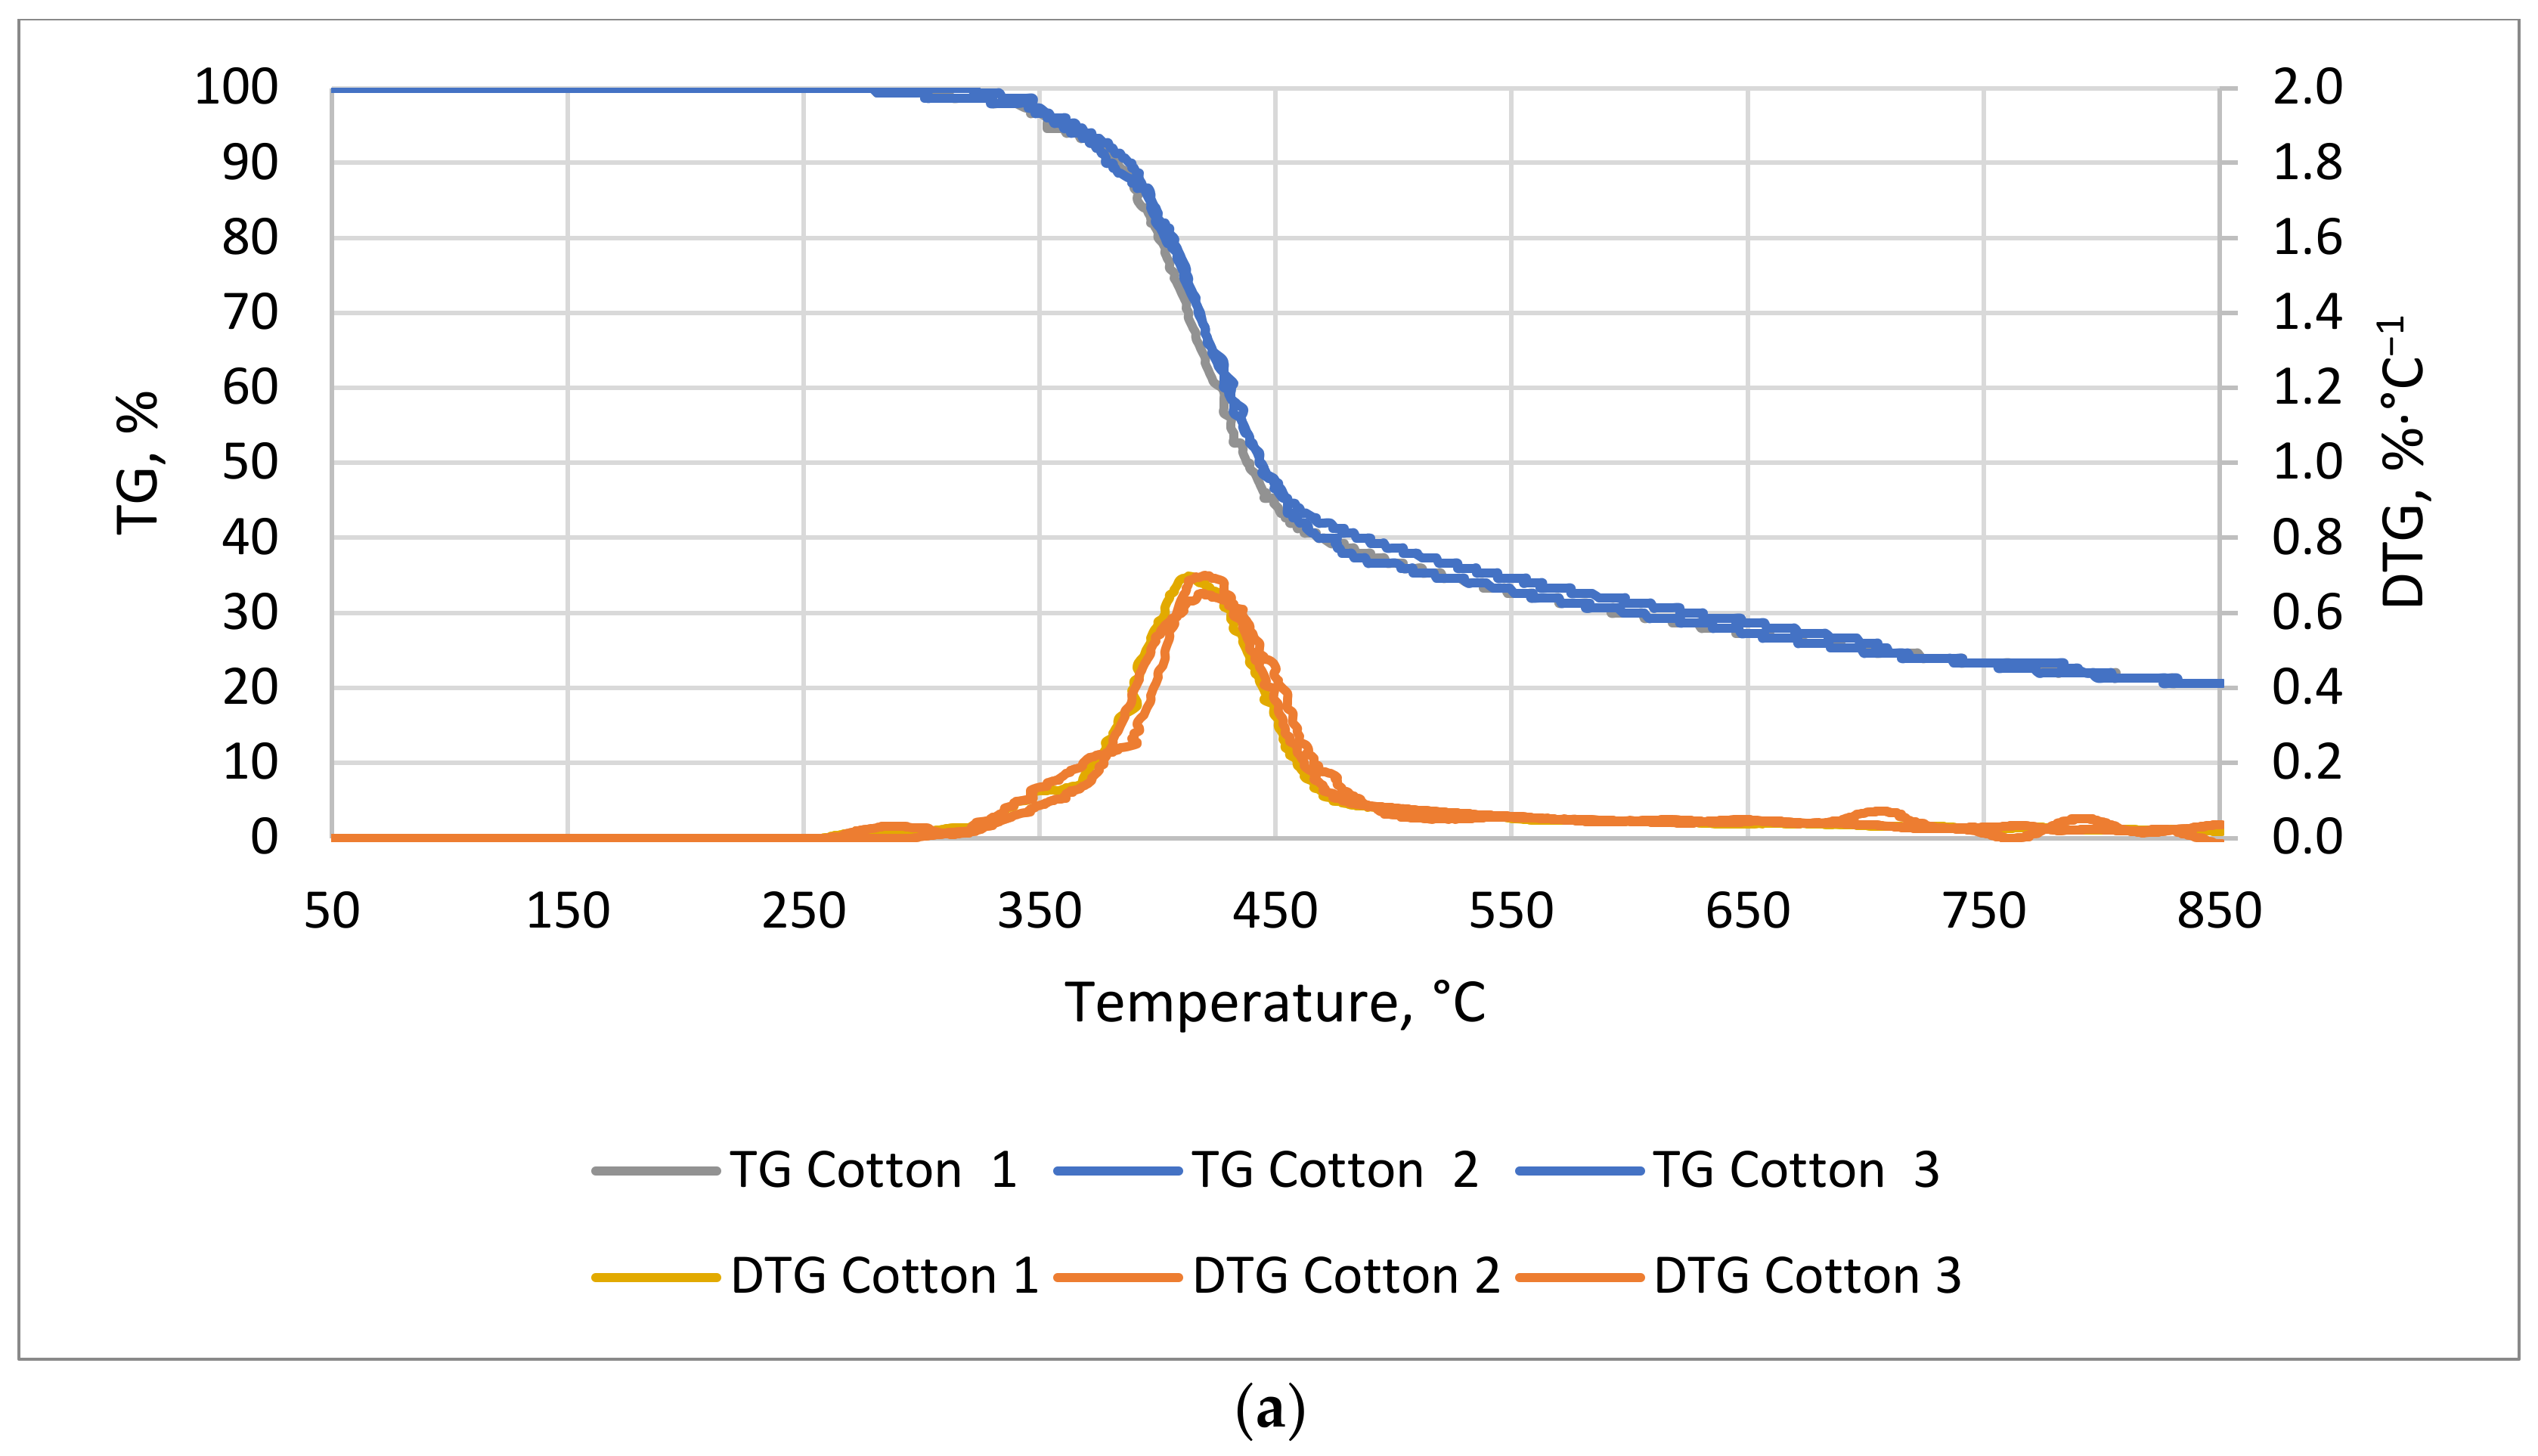
3.3.3. Textiles
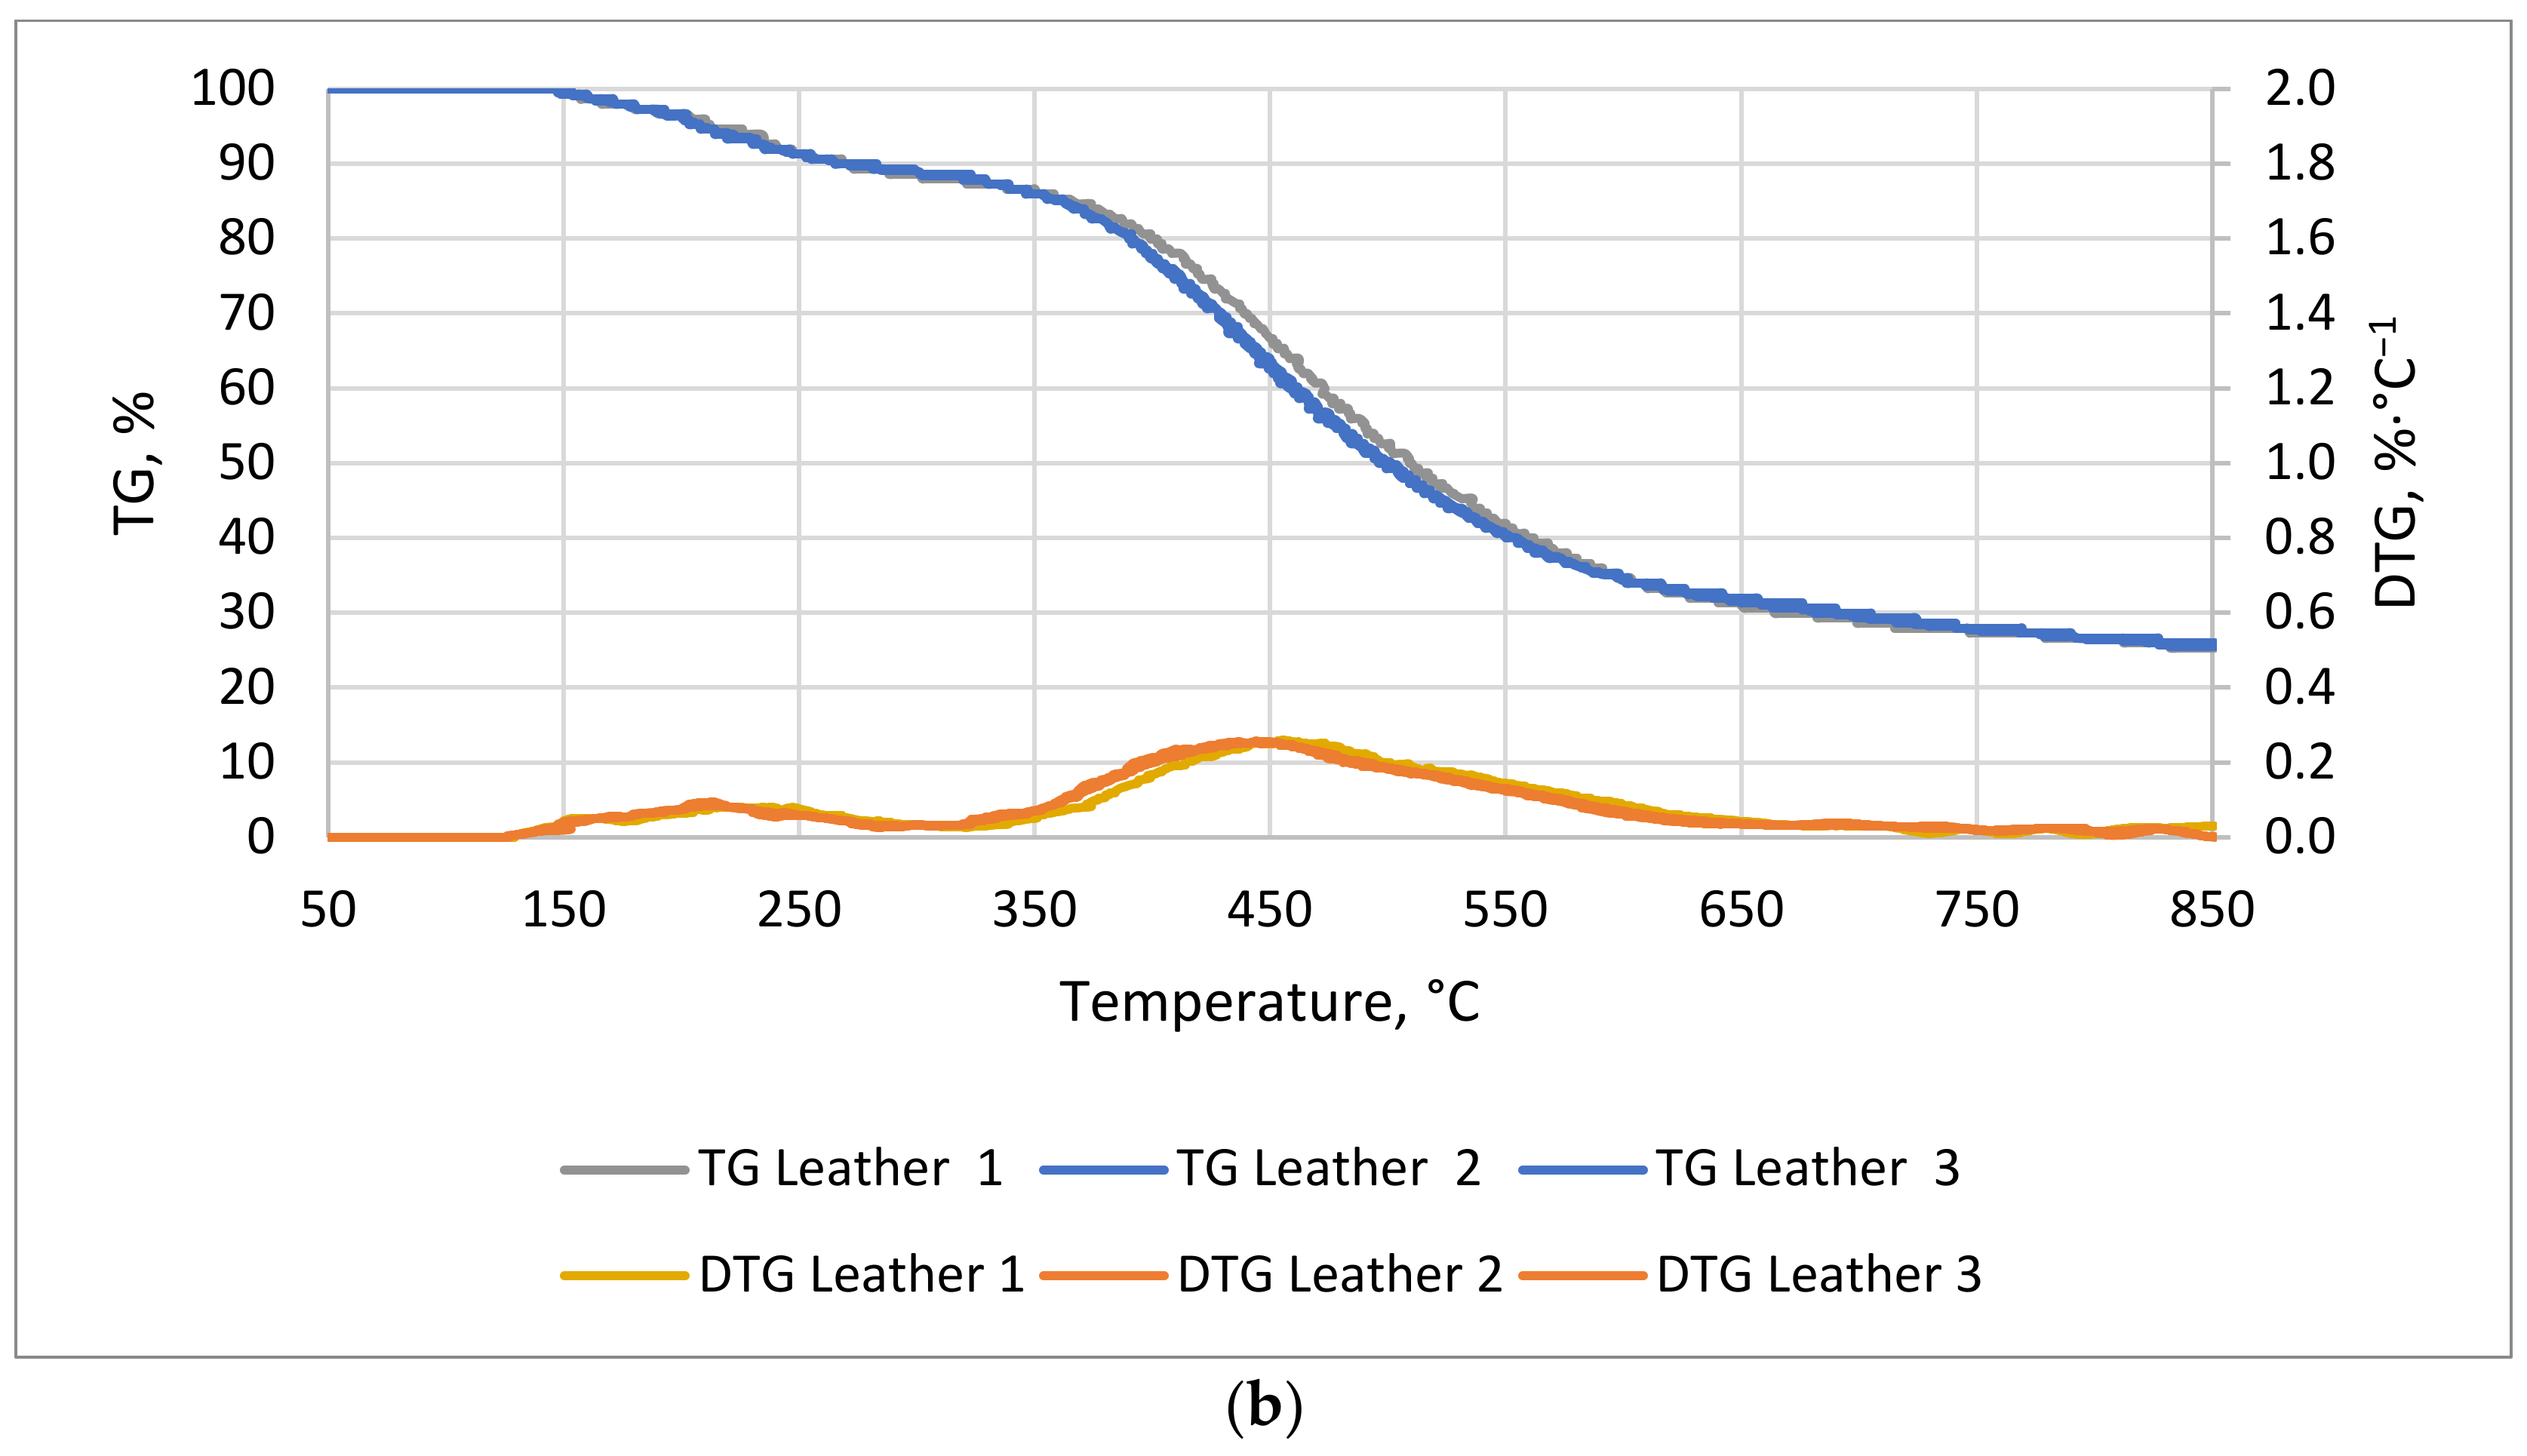
The TG/DTG curves for natural leather and cotton textile are shown in
Figure 5a,b. For cotton textile, the first stage of the process, i.e., the lag phase, took longer than for natural leather, 53 and 23 min, respectively. The weight of the leather sample showed two distinct reductions: the first was between 23 and 53 min at 130–274 °C, and the second was between 70 and 116 min at 360–585 °C. The final weight drop for natural leather occurred at 167 min and for cotton at 170 min of measurement.
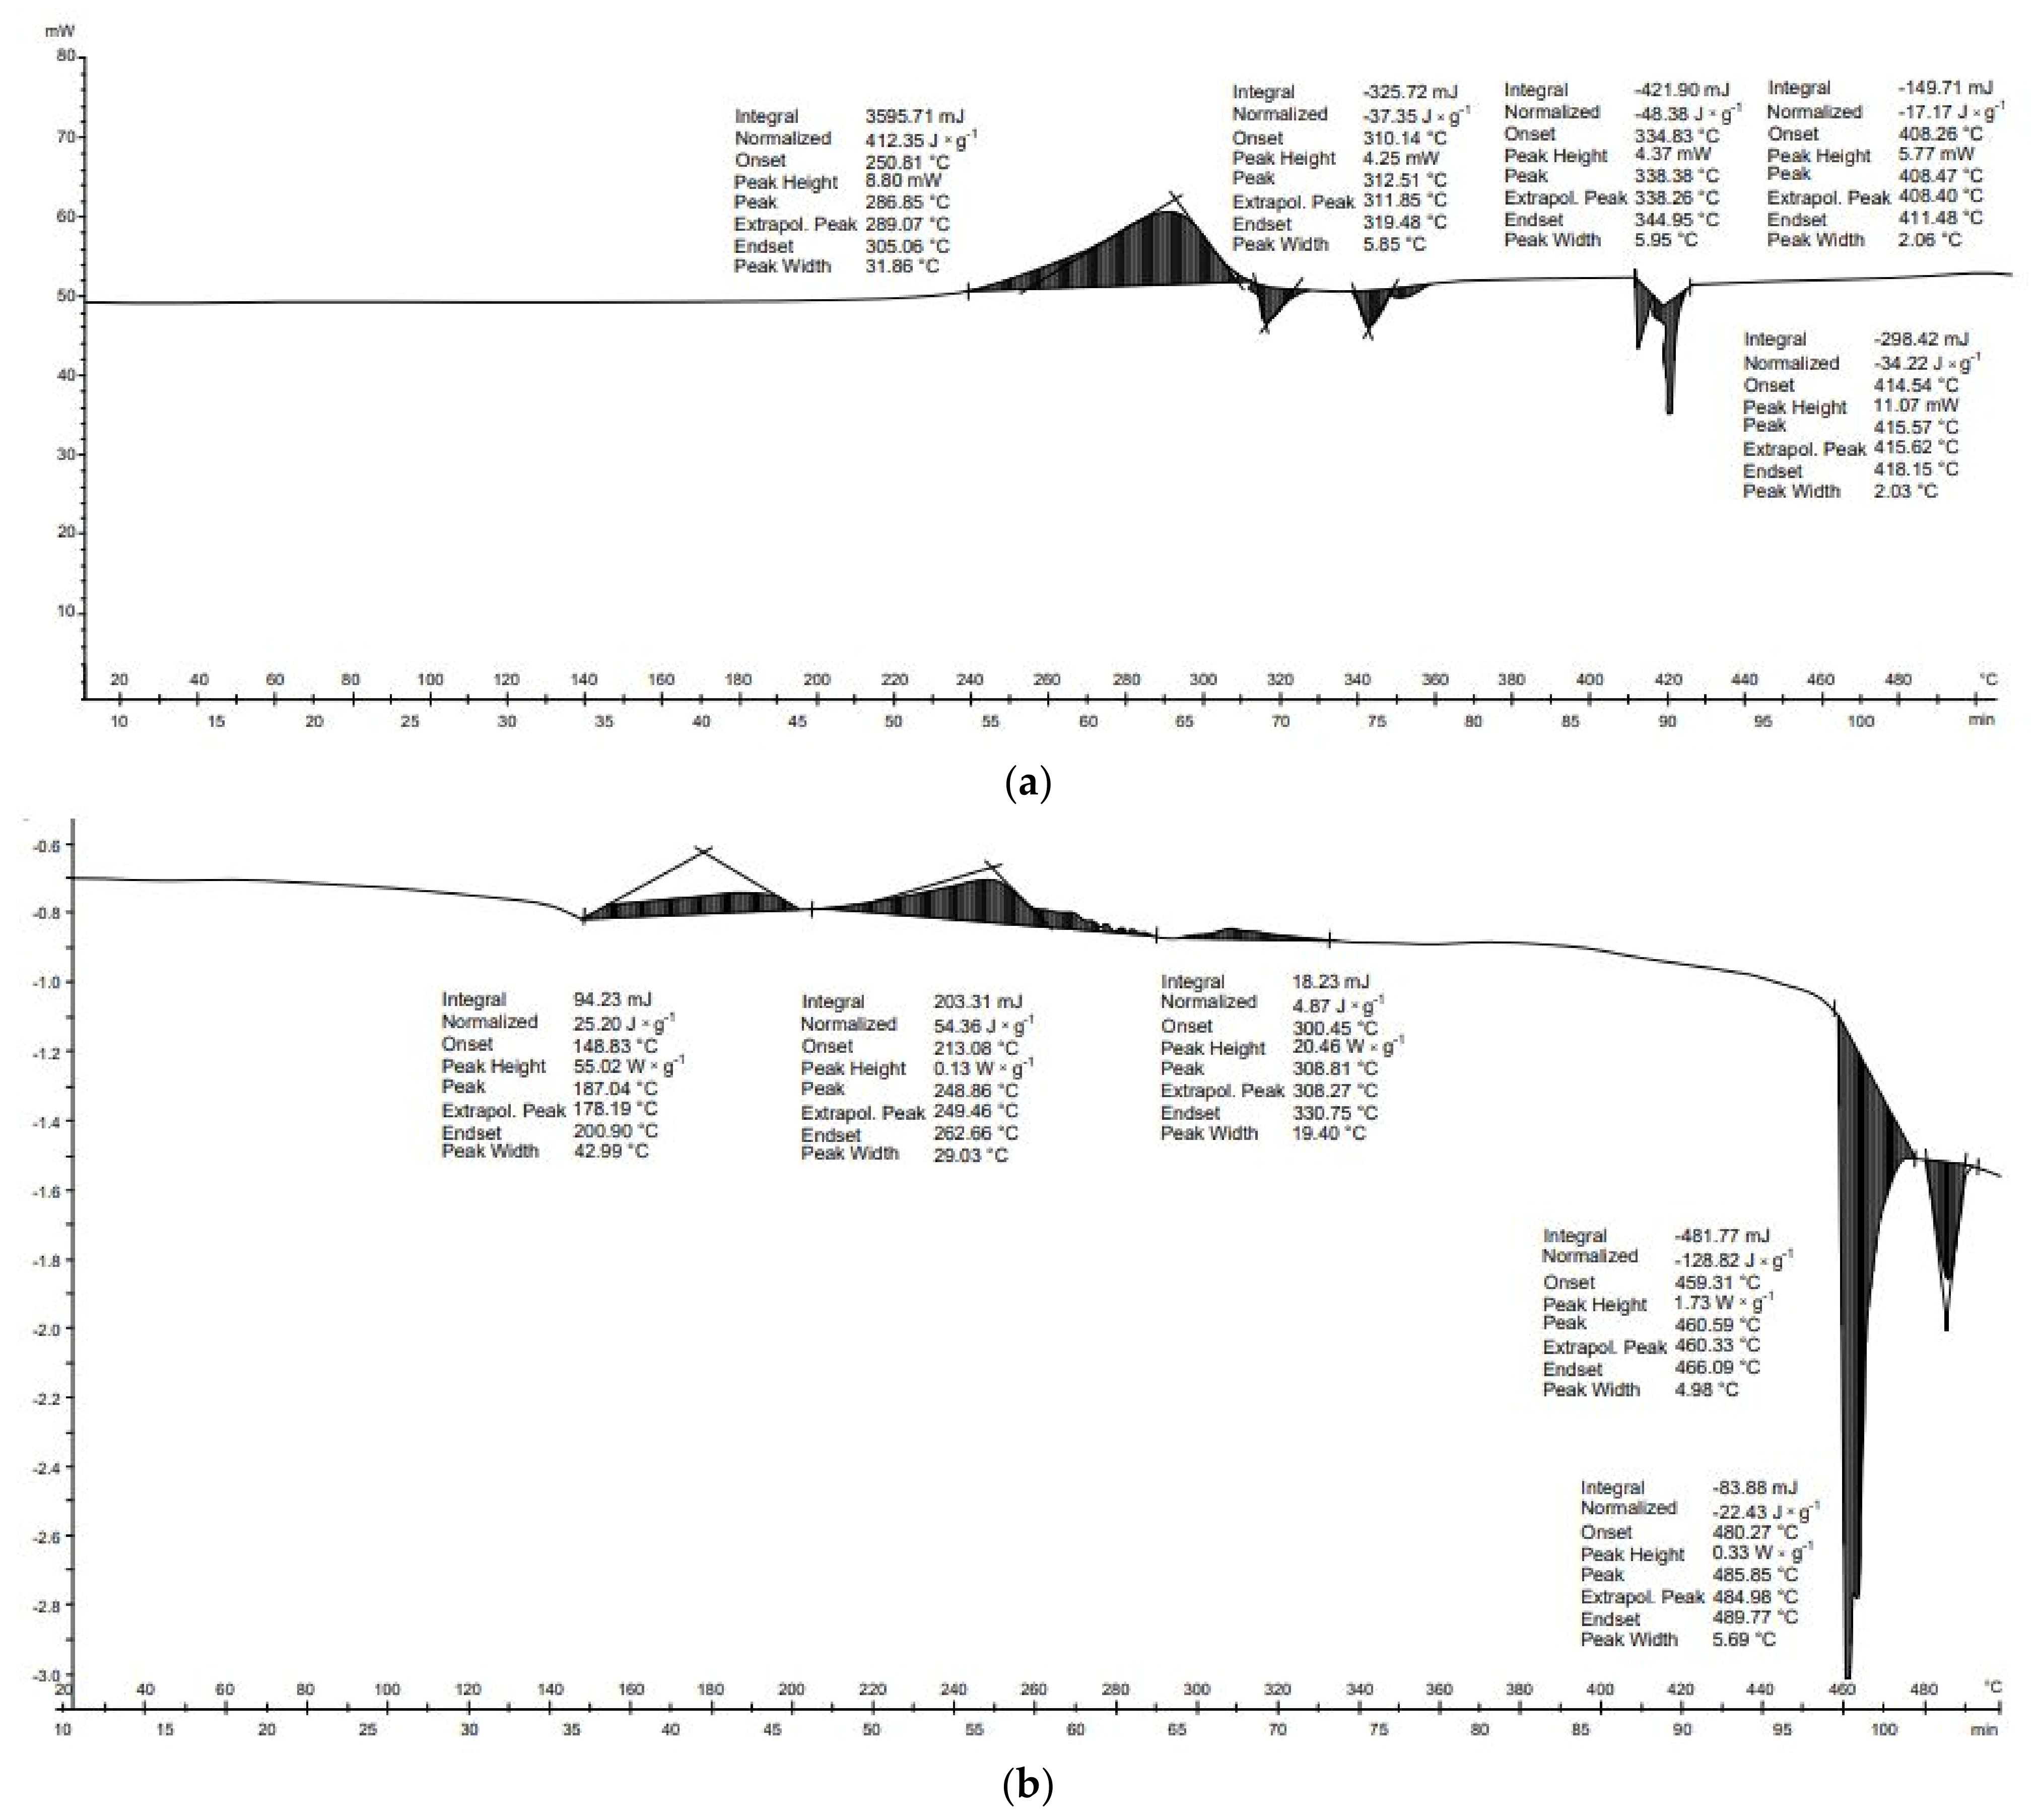
The DSC characteristics of the cotton textile are shown in
Figure 6a. Five transformations are visible, one exothermic and four endothermic. The first transformation started at about 251 °C. At this temperature, hemicellulose and cellulose, which are the main components of cotton, are broken down. In addition, further transformations that originate at about 310 to 415 °C, respectively, are associated with these biopolymers [
46].
Comparing the DTG curves of leno (Figure 9b) and cotton (
Figure 5a), only one exothermic transformation occurred for these materials. The transformations of the leno sample started at lower temperatures and ended at higher temperatures compared to the cotton sample. The two materials tested differ in the number of agents added; in the case of leno, only hydrogen peroxide is added, whereas in the case of cotton several different compounds associated with fabric dyeing may be added. According to the characteristics of textile dyeing technology in the EU, in addition to dyes, these agents can include sodium hydroxide, sodium carbonate, sodium chloride, or sodium sulfate. These melt at 318–323, 854, 801, and 884 °C, respectively [
47]. This shows that sodium hydroxide may have affected the exothermic peak that occurred between 310 and 319 °C. As in the case of the leno between 380 and 600 °C, a main pyrolysis process occurs that produces L-glucose and various combustible leno products. In addition, several dyes of various origins can affect the thermal decomposition process and phase transformations of the cotton sample. These dyes may include canthaxanthin, which has a melting point of 217 °C; vitamin B2, which has a melting point of 290 °C; sodium chlorate, which has a melting point of 247 °C and a boiling point 300°C; and para-aminophenol, which has a melting point of 186 °C and a boiling point of 284 °C.
Figure 6b shows the DSC characteristics for natural leather. The leather is composed of water, proteins, fats, and mineral salts. Because the sample was dry and protein denaturation occurs at temperatures below 100 °C, the peaks in
Figure 6b cannot be assumed to be associated with water removal and protein transformation. It is more likely that they are related to fat breakdown and protein product denaturation. In addition, other additives added during leather production, e.g., dyes, may react during the leather degradation. As a result, unknown reactions could appear. Nevertheless, the first three transformations were exothermic and the next two were endothermic.
Five transformations occurred in the thermal analysis of cotton textile. The first transformation was exothermic (412.4 J × g
−1), and the following transformations were endothermic (−37.4, −48.4, −17.2, and −34.2 J × g
−1, respectively). The overall energy balance of the thermal transformations of the cotton textile was positive (275.2 J × g
−1) (
Table 5). Five thermal transformations occurred during the process of thermal leather analysis. The first three transformations were exothermic (25.2, 54.4, and 4.9 J × g
−1, respectively). The fourth and fifth transformations were endothermic (−128.9 J × g
−1 and −22.4 J × g
−1, respectively). The overall energy balance of the thermal transformations of the leather was negative (−66.8 J × g
−1) (
Table 5). Results showed that temperatures higher than 440 °C should be avoided to reduce the energy needed for leather because, above this temperature, two significant endothermic reactions take place that require a large amount of energy, and this energy cannot be supplied by previous exothermic reactions. This problem does not exist in the case of cotton textile because the total energy balance of the reaction is positive.
Nevertheless, these findings might not be representative of each textile’s wastes. A study by Hassabo et al. [
48] was based on the characterization of cotton by TGA and DSC to assess thermal stability. The cotton waste came from the recycling of textile waste. The study confirmed that, as the cotton particle size decreased, its thermal stability increased. Stępień et al. [
45] conducted TGA and DSC analyses to evaluate the energy intensity of using a torrefaction process to produce carbonized alternative fuel. His results showed that, in the case of textiles, dyes contained in fabrics can alter the course of phase transformations. In both the current study and that of Stępień et al. [
45], there was an exothermic transformation at 300 °C, and the value of transformation in Stępień et al. [
45] (423 J∙g
−1) was similar to the value of 412 J∙g
−1 obtained in this study. In contrast, natural leather processed up to 300 °C by Stępień et al. [
45] was also characterized by three exothermal transformations, for which the overall energy balance was 476 J∙g
−1, whereas in the present study it was only 84. 5 J∙g
−1. These differences may result from the choice of material with different properties, size distribution, and additives [
14,
45].
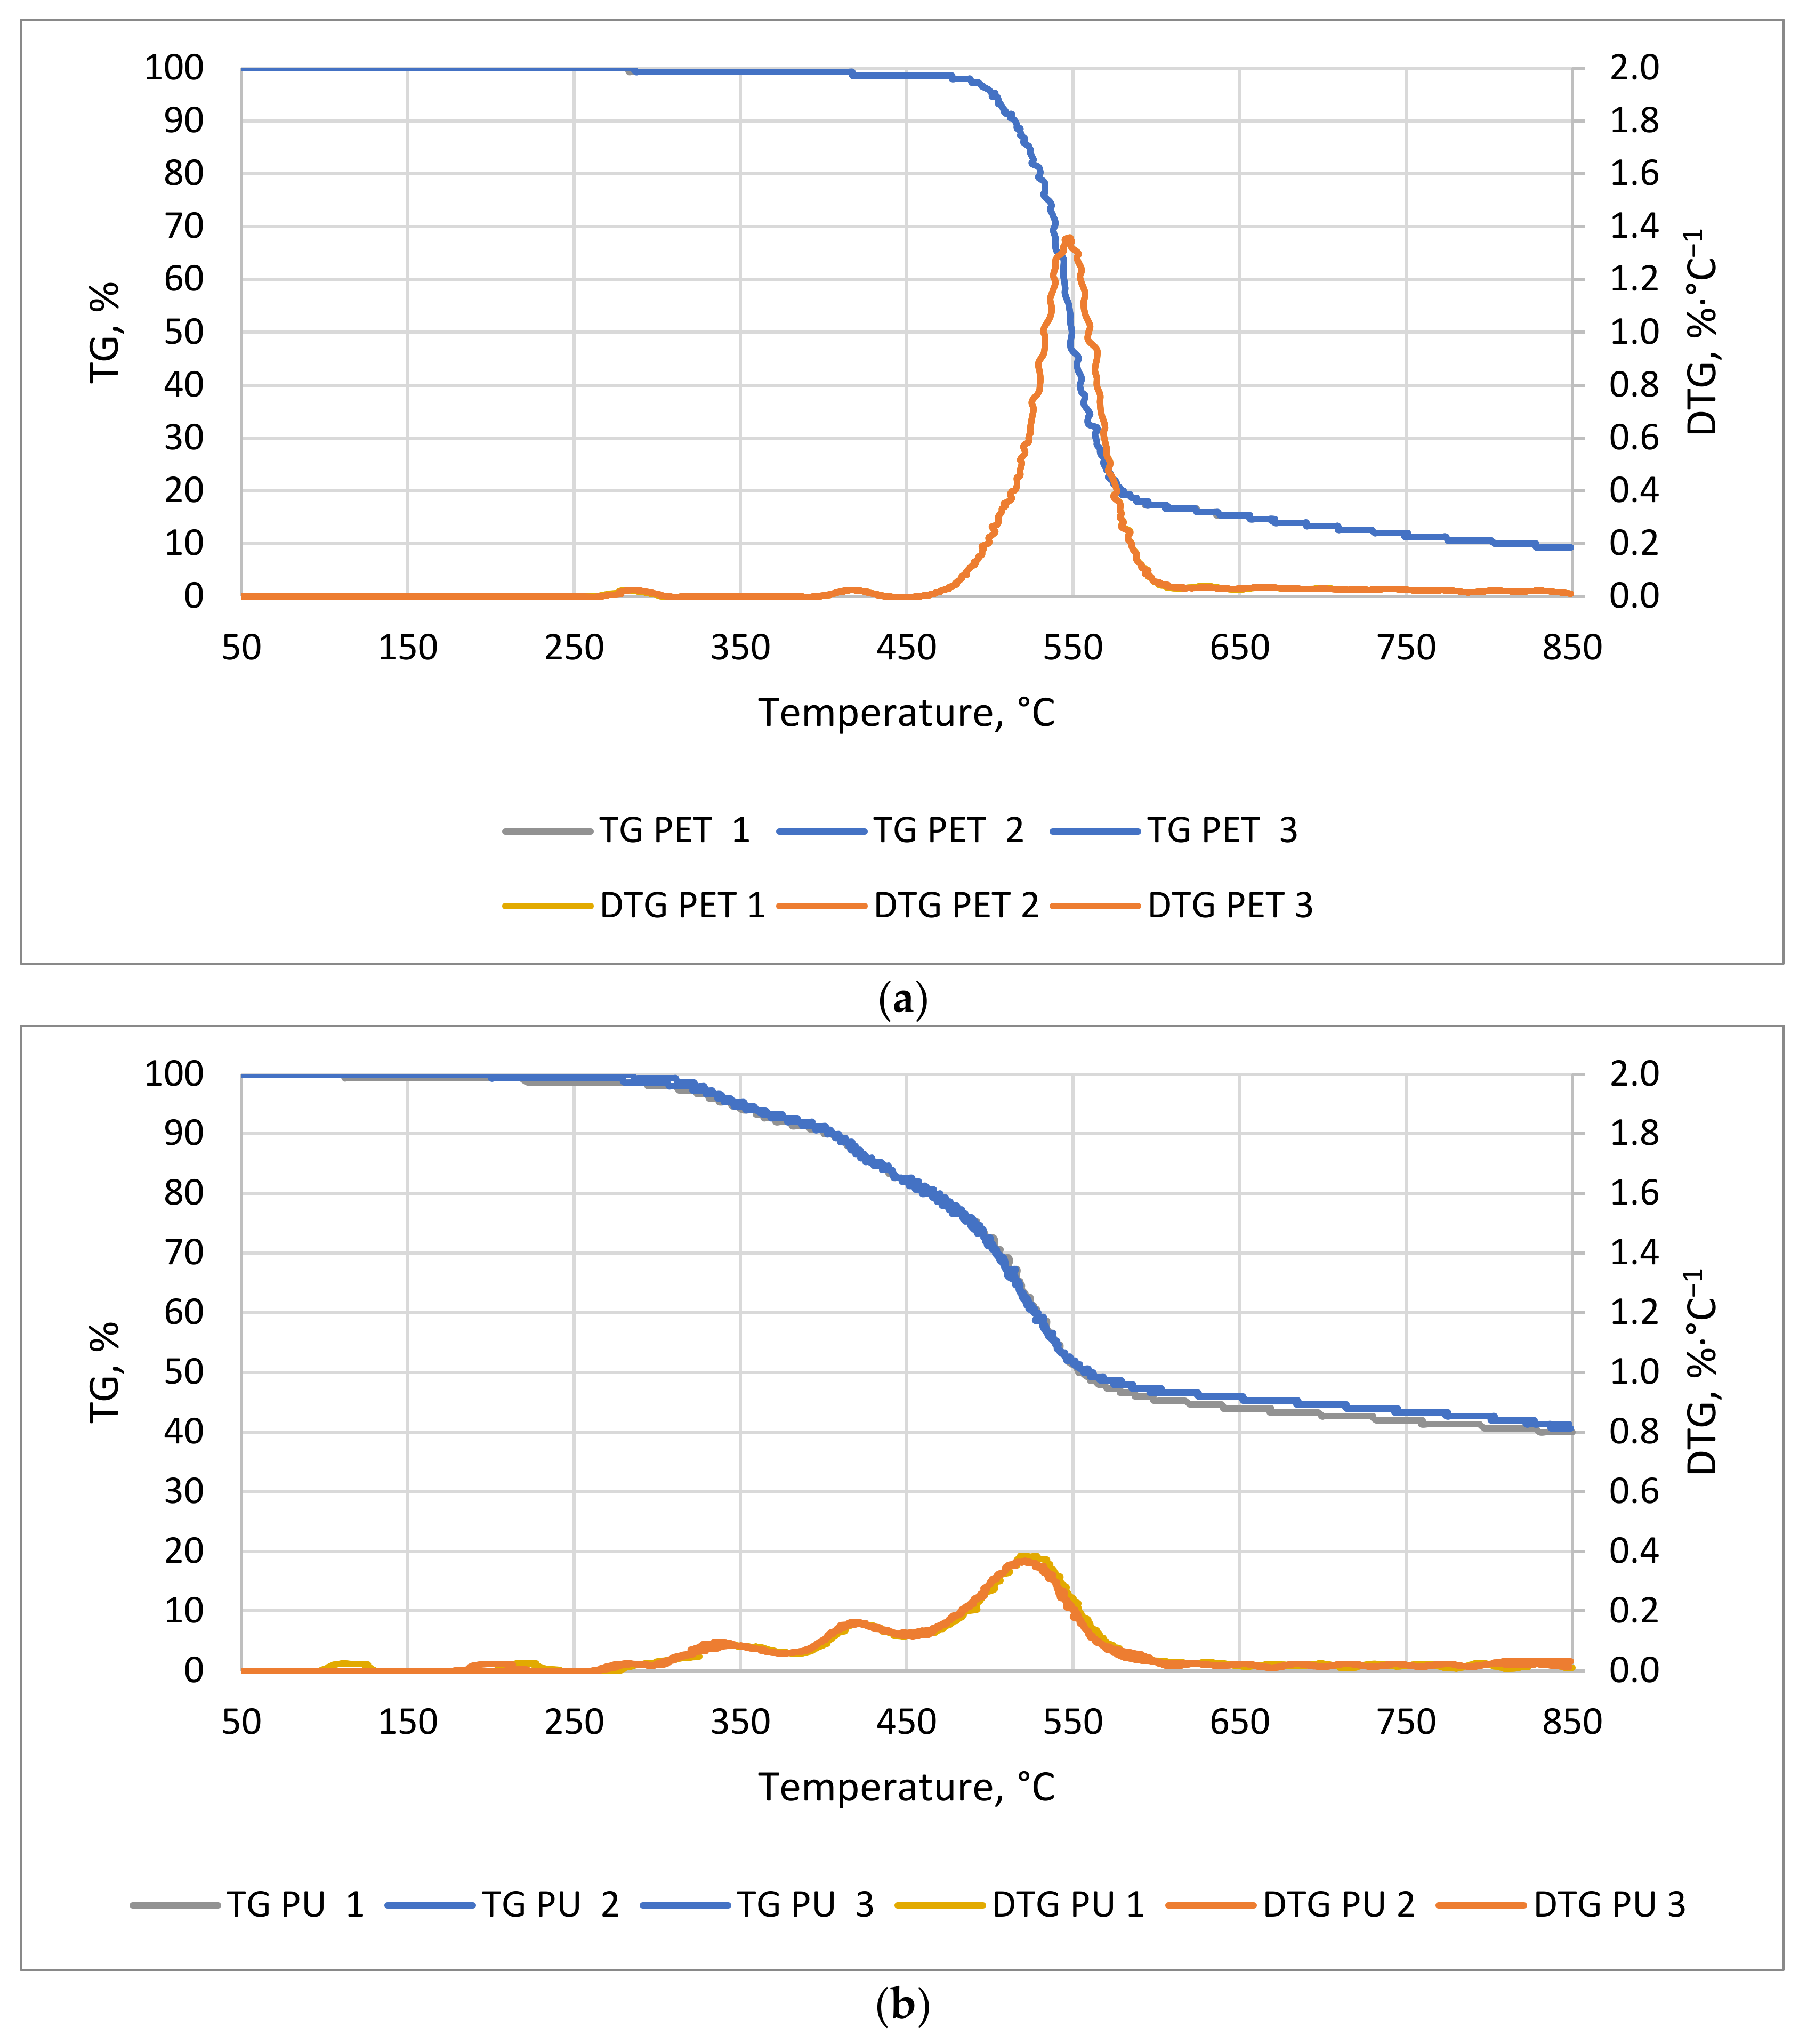
3.3.4. Plastics
Figure 7a,b show the TG/DTG curves of PU and PET. Polyurethane began to decompose much faster than PET (
Figure 7a). The first noticeable mass decrease in PU occurred at about 58 min of the process at a temperature of about 295 °C. For the PET sample, the first noticeable decrease in mass occurred around 95 min at 480 °C. The time at which the greatest decrease in material weight occurred was 24 and 57 min for PET and PU, respectively. The thermal decomposition time of the PET sample started at a significantly higher temperature and was less than half that of the PU sample. The conclusion of weight loss occurred at 119 min for PET and 114 min for PU at 595 and 572 °C, respectively. The first slight weight loss may be due to the phase change of compounds that are added to the plastics during their production, or the phase change associated with the transition from the solid to the plastic phase. A weight change in the PU sample was observed from about 120 °C but, up to 300 °C, the decreases were very small (
Figure 7b). These decreases can be combined with the transformations of isocyanates, which have a boiling point of about 208 °C. The most dynamic mass decrease was observed in the temperature range from 320 to 600 °C. The decrease in weight of this material is mainly related to the decomposition of polyols, which is the second of the two main components of polyurethane [
49].
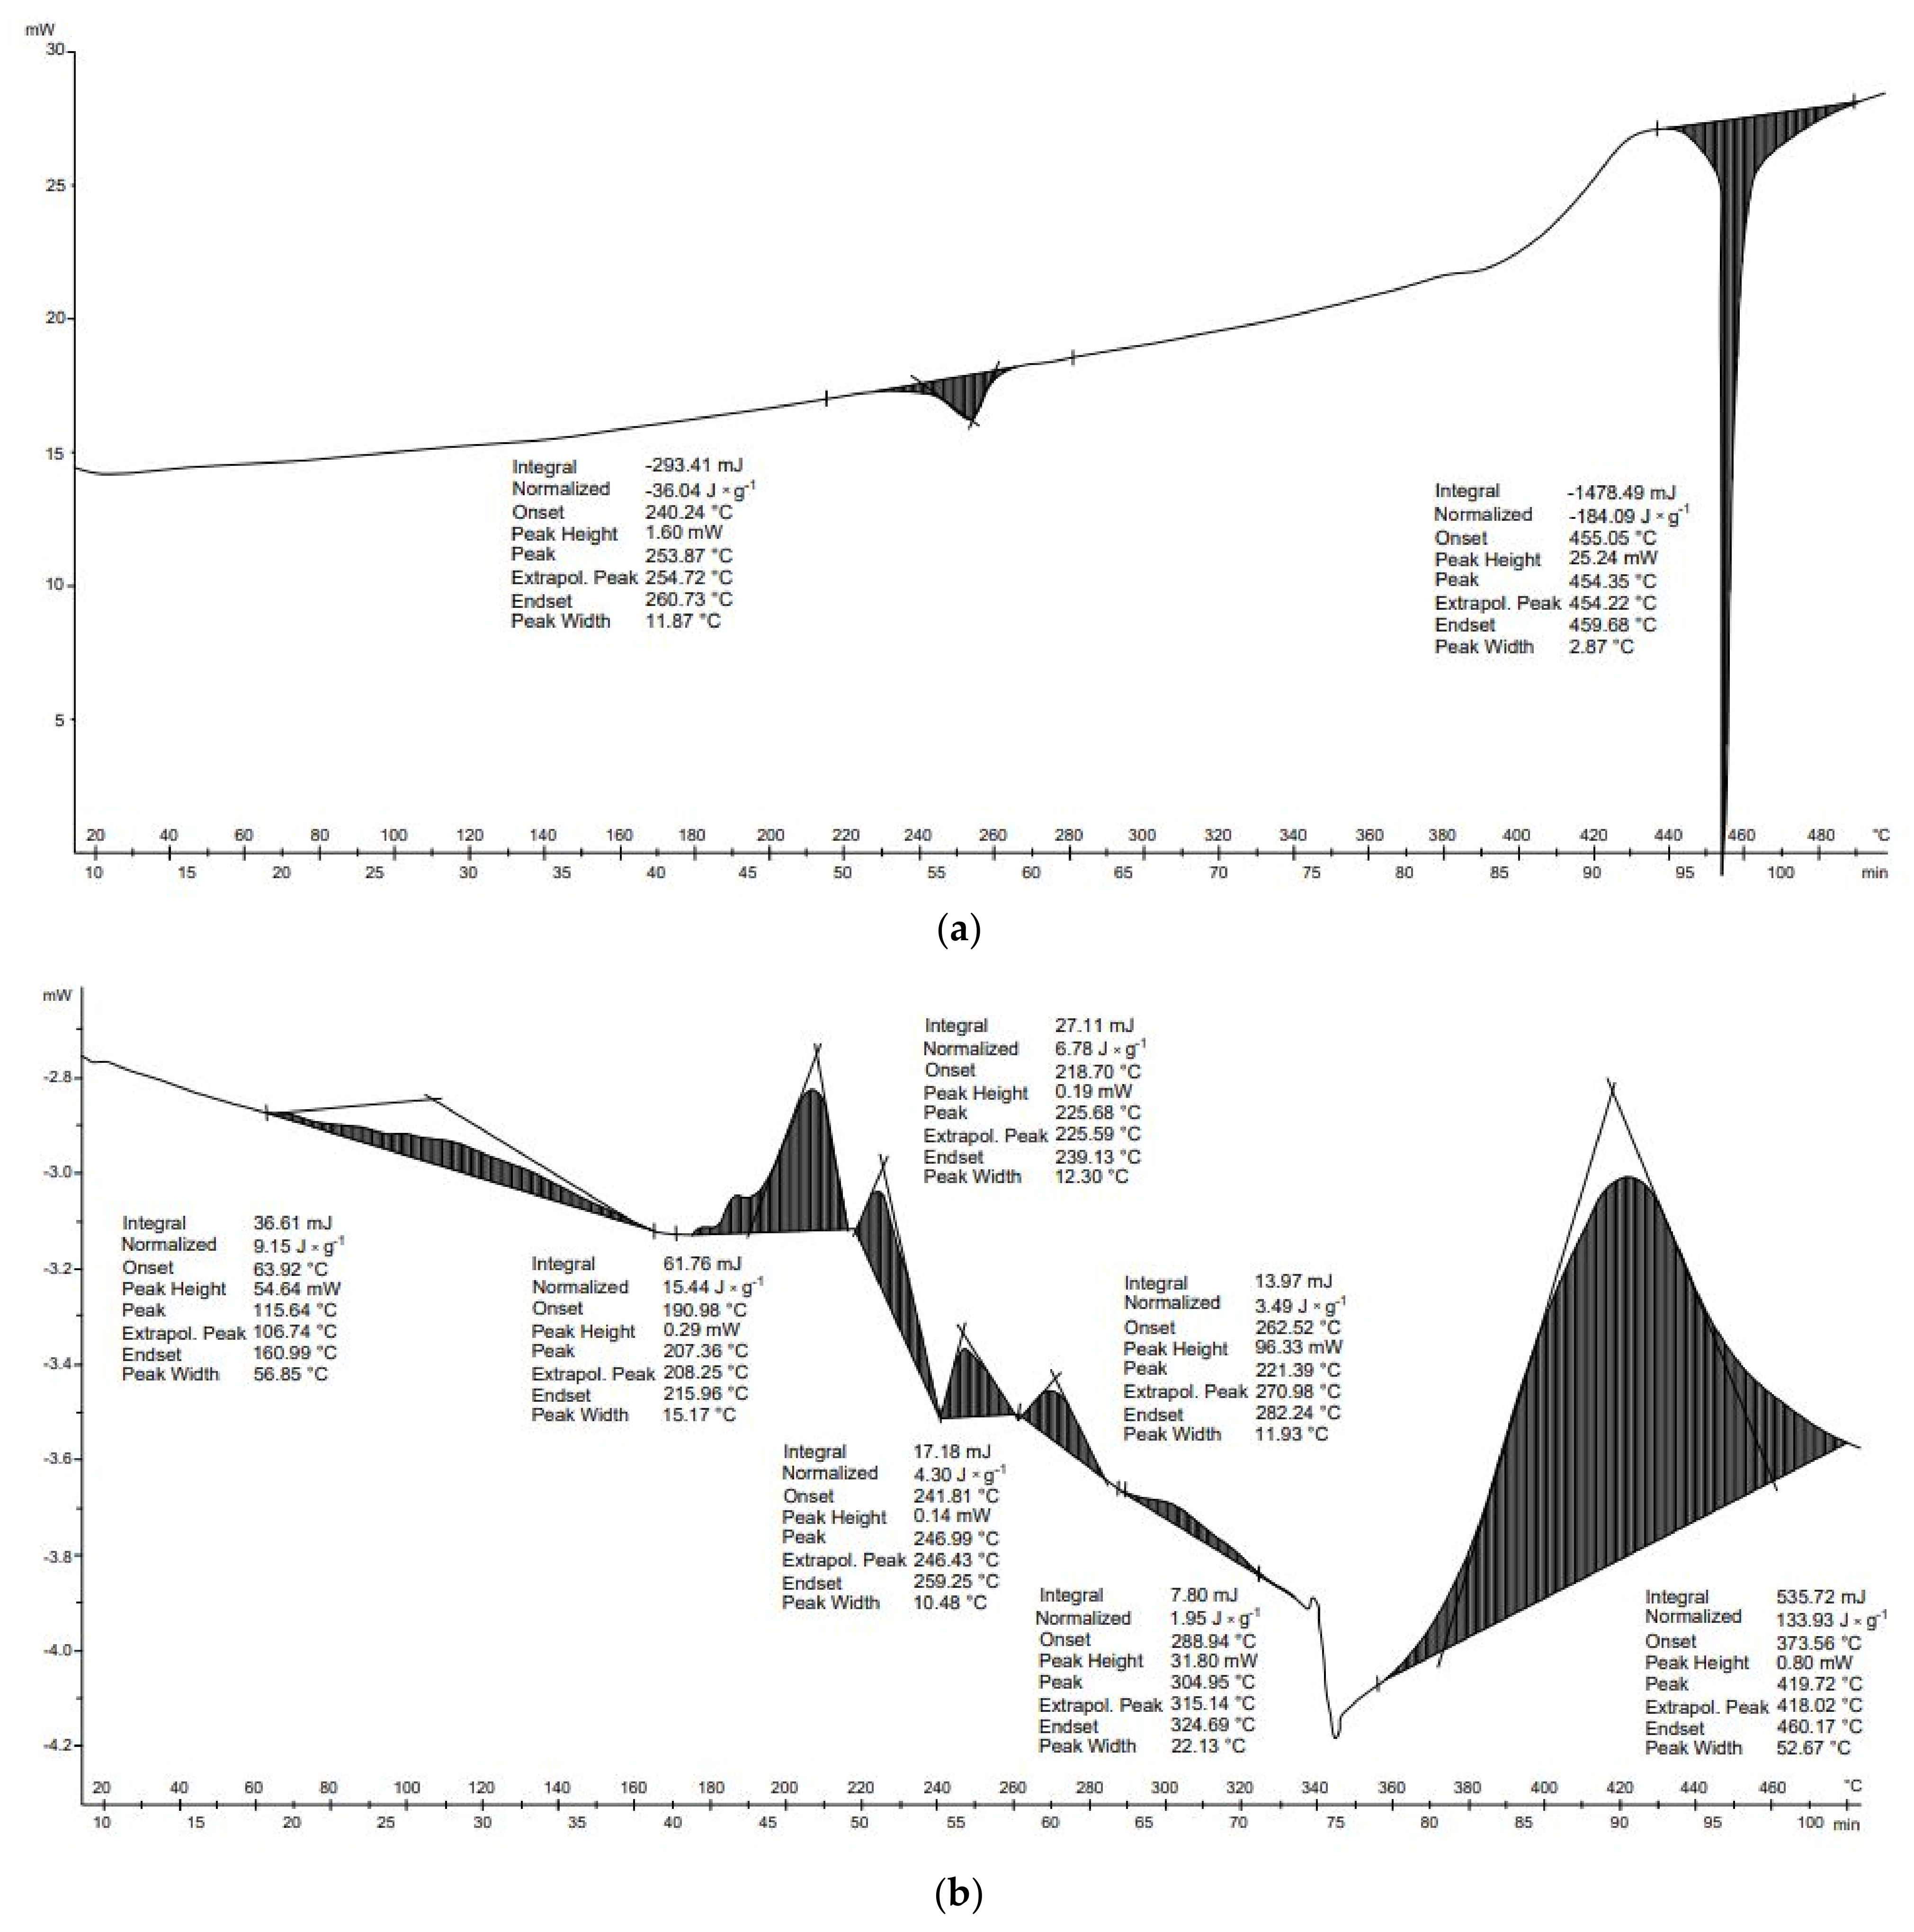
For PU, seven transformations were recorded during DSC analysis (
Figure 8b). Polyurethane materials lose their thermal strength between 150 and 200 °C, decomposing into products of different compositions and toxicity [
50]. The first transformation occurred between 64 and 161 °C. Due to the large range of temperatures, it is not possible to identify which compounds have been transformed; it may be mannitol or erythritol, which have melting points of 168 and 120 °C, respectively. Another transformation from 191 to 216 °C can be associated with the boiling of ethyl glycol—198 °C; melting of perseitol—about 185 °C; boiling of xylitol—216 °C; or boiling of isocyanate—208 °C [
51,
52]. The third transformation started at 219 °C and ended at 239 °C; this is associated with the boiling of polycarbonate, which has a melting point of 230 °C, or the melting of inositol (222–227 °C) [
53]. Another transformation that can be related to the phase transformations of polyols starts at 289 °C and ends at 325 °C. This temperature range includes the boiling points of glycerol—209 °C, inositol—291 °C, perseitol—296 °C, and erythritol—about 330 °C [
54]. The transformations described thus far are not responsible for the significant mass loss that occurred between 300 and 550 °C (
Figure 8). The final transformation (374–460 °C), which is the most exothermal, is related to the critical point of glycol, whose critical point temperature is 446 °C.
The DSC curve of PET material shows that the first transformation occurred between 240 and 261 °C (
Figure 8b). At the same temperature, however, there was no change in mass during DTG/TG analysis. In the case of PET, the first decrease in mass occurred at around 300 °C and the second at around 400 °C, but they were small, at the 0.01 g level. A noticeable decrease in mass did not occur until about 480 °C and continued until about 600 °C. Two transformations occurred in the thermal analysis of PET. The first transformation was endothermic (−36.0 J × g
−1) and the second transformation was endothermic (−184.1 J × g
−1). The energy balance of the thermal transformation of the PET was negative (−220.2 J × g
−1) (
Table 6). In the case of PU, seven thermal transformations occurred during thermal analysis. Each of these was exothermic. These transformations produced 9.2, 15.4, 6.8, 4.3, 3.5, 2.0, and 133.9 J × g
−1, respectively. The transformations energy balance of the PU material was positive (175.0 J × g
−1) (
Table 6).
TGA and DSC analyses of plastics are mainly carried out to verify the presence of impurities in these materials. Nevertheless, studies of Chhabra et al. [
55] also provided information about the energy consumption for pyrolysis of different plastic materials. Results showed that the required energy depends on the plastic type and differs for each transformation effect. These conclusions are consistent with those obtained in this study. Nevertheless, in the study of Chhabra et al. [
55], PET transformations had enthalpy of about 768 J∙g
−1, whereas in this study this energy was −220.2 J × g
−1, which may result from different measurement methods (different heating rate, sample mass, final temperature) and impurities in samples [
55].
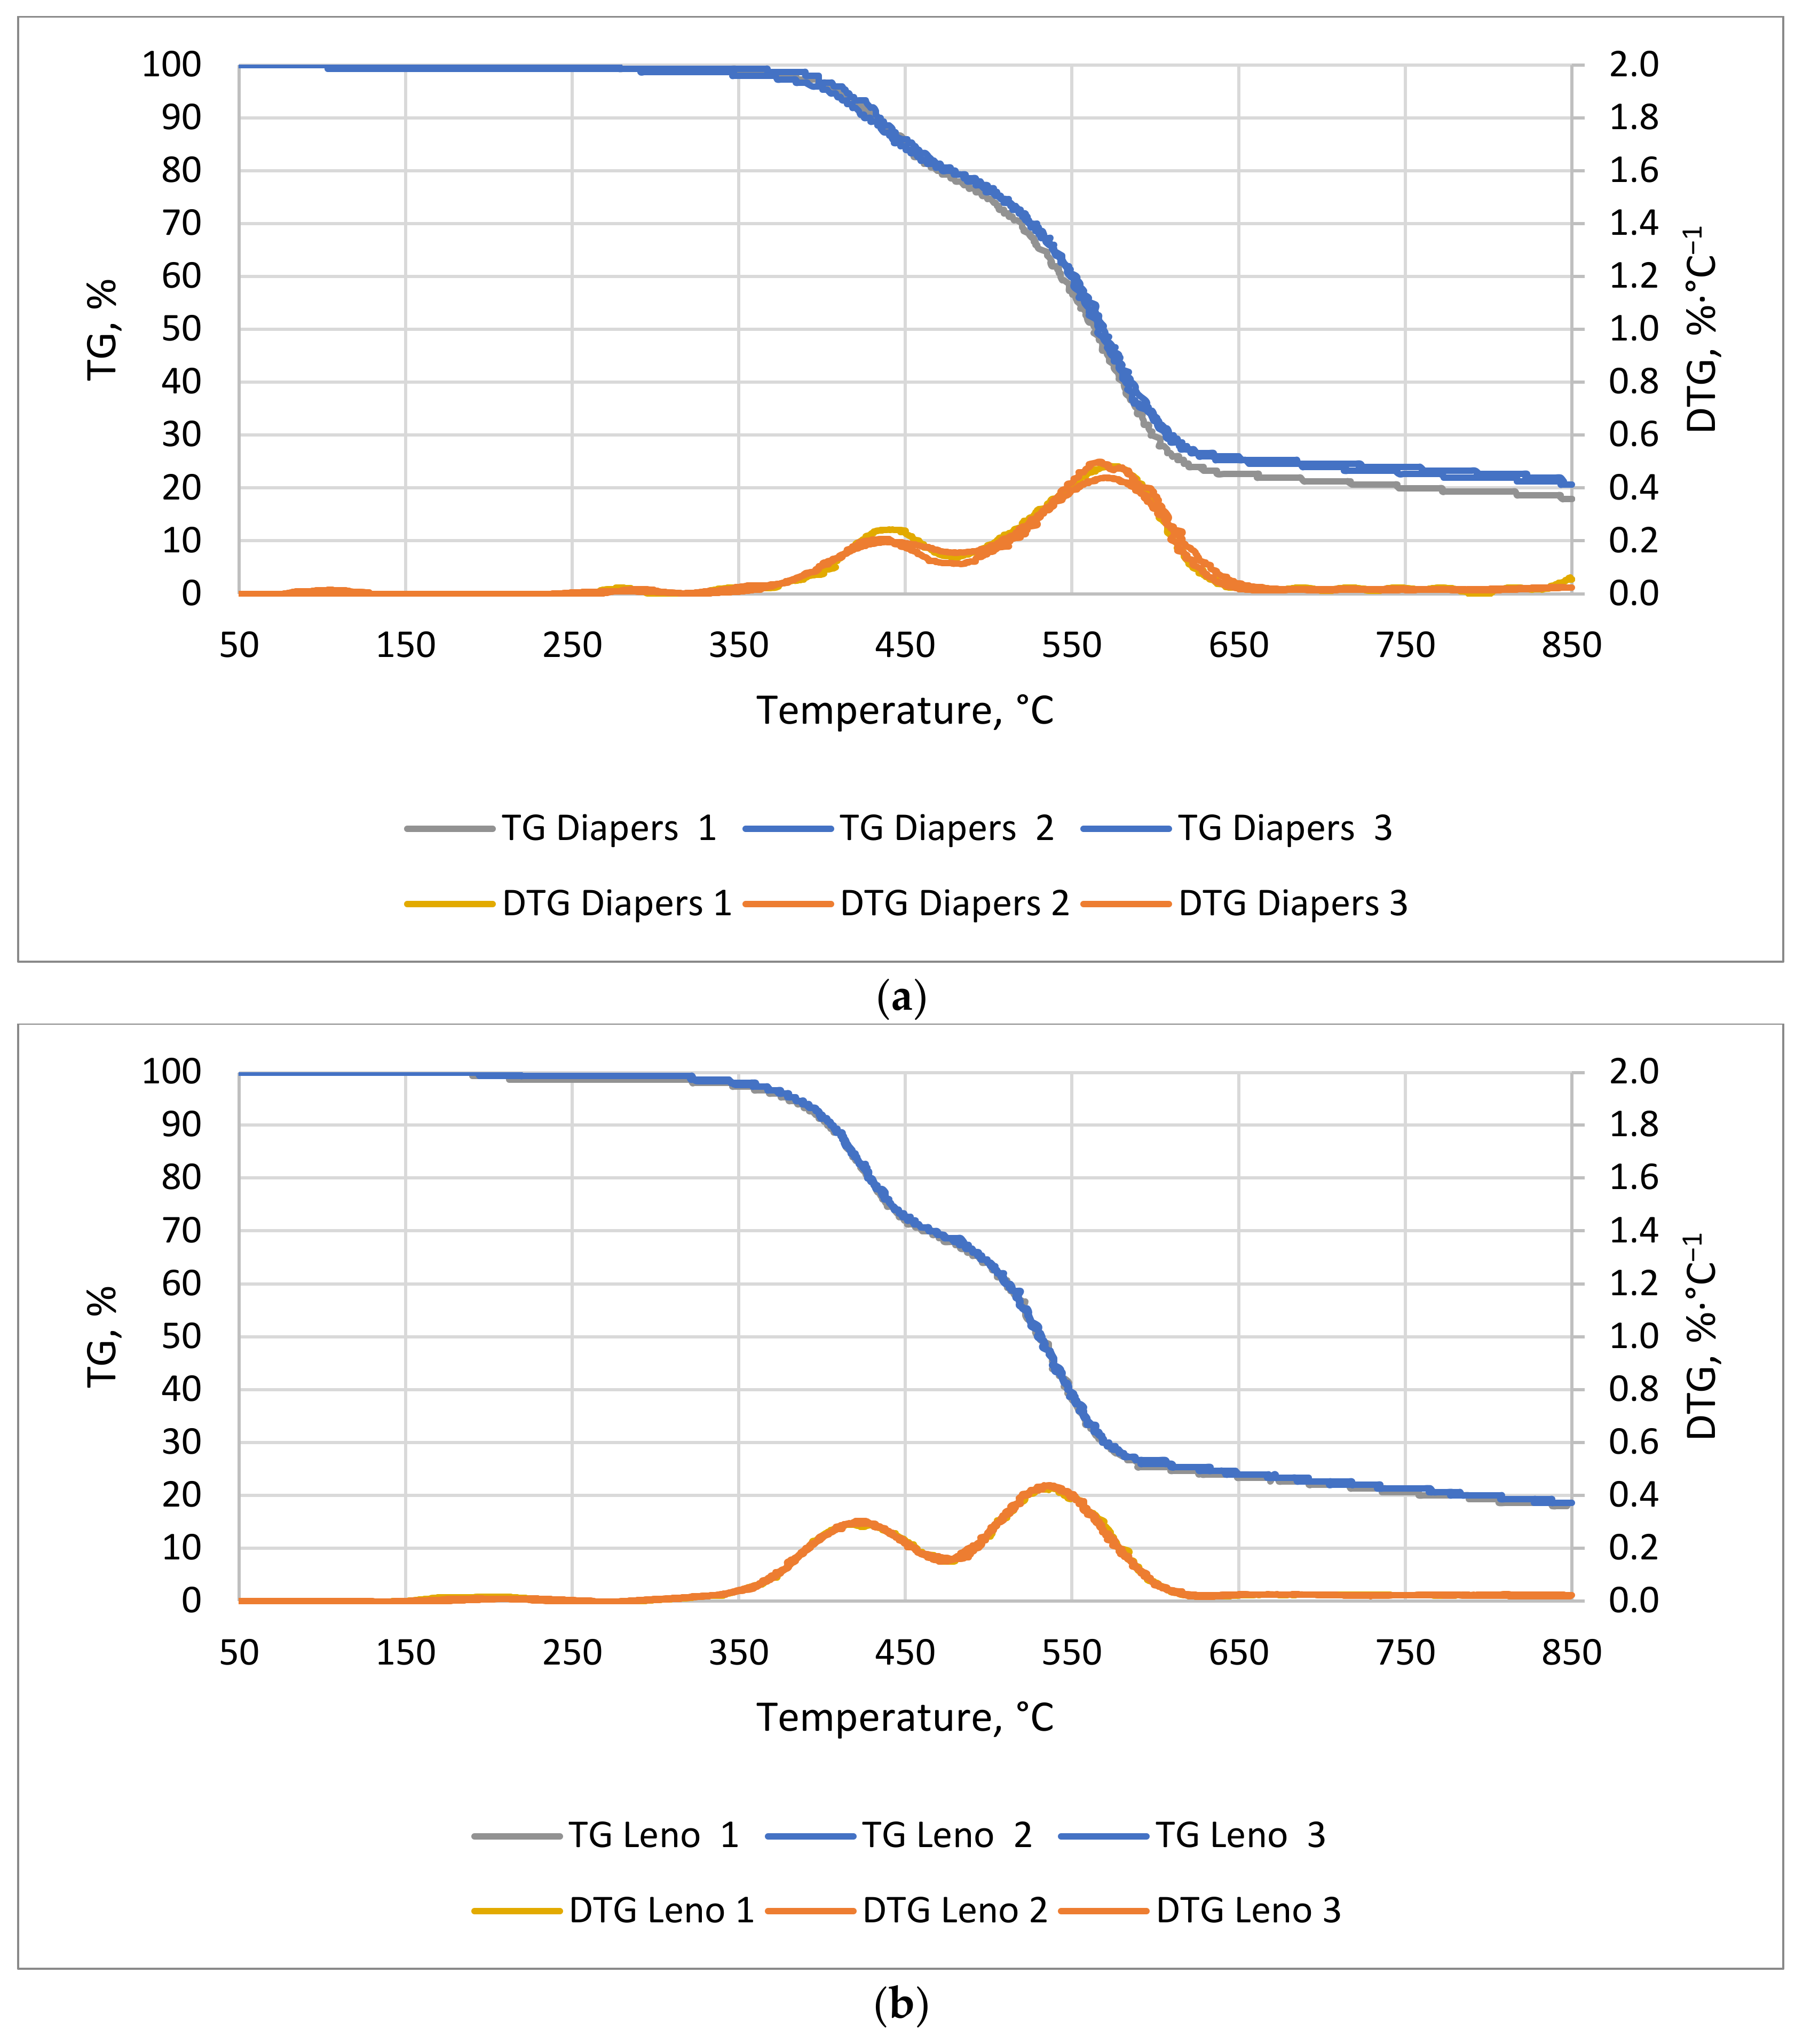
3.3.5. Hygiene Waste
The TG/DTG curves of hygiene waste are shown in
Figure 9a for diapers and
Figure 9b for leno. The first noticeable mass decrease for both materials was observed around 70 min at 355 °C for pampers and 345 °C for leno. The most dynamic mass decrease lasted 51 and 48 min, and ended at 620 and 571 °C, respectively. The weight loss of diapers (
Figure 9a) is related to the distribution of superabsorbent (superabsorbent polymers) and cellulose. These account for 33% and 24% of the weight of disposable diapers, respectively [
56]. In the case of leno (
Figure 9b), the decrease in mass is mainly due to the decomposition of cotton, i.e., cellulose, from which the dressing leno is made. For both materials, the most dynamic weight loss began at 350 °C and lasted until 600 °C.
The DSC curve for the diapers is shown in
Figure 10a. Six transformations—four endothermal and two exothermal—were observed. The first two transformations occurred in the temperature ranges of 124–131 °C and 156–172 °C. These transformations can be related to the melting point of PEHD plastic (125 °C), which represents about 2.2% of the diaper weight, and the melting of polypropylene (PP). PP constitutes 5.8% of the disposable diaper, and its melting occurs between 160 and 170 °C [
57]. The next two exothermal transformations are related to the decomposition of cellulose pulp, which constitutes about 24%, and the decomposition of superabsorbents, which constitute about 33% of the pampers weight. Cellulose pulp, like biopolymers, decomposes between 220 and 400 °C (hemicellulose and cellulose). This form of cellulose, due to prior processing, can begin to decompose at lower temperatures than the cellulose contained in cardboard or plants. The third transformation results from the decomposition of hemicellulose, whereas the fourth results from the decomposition of cellulose. The latter transformations are endothermic. They occur at higher temperatures than the others; between the end of the fourth transformation and the beginning of the fifth, there is a difference of about 115 °C. These transformations may result from the decomposition of lignin, but may also be associated with the decomposition of substances formed during earlier transformations [
40].
Figure 10b shows the DSC analysis of the dressing leno. According to the manufacturer’s description, it is made of 100% cotton and is bleached with hydrogen peroxide. The thermal decomposition of this material is related mainly to the decomposition of the cellulose fibers and to the reactions undergone by hydrogen peroxide. The first endothermic transformation originates at 110 °C and is related to the breakdown of cotton fibers, which occurs between 110 and 150 °C. This transformation can also be associated with the boiling of hydrogen peroxide, whose boiling point is 150 °C. During these transformations, primarily physical changes occur in the cotton fibers. The subsequent transformations can be related to the decomposition of the main component of the leno, namely cellulose and hemicellulose, whose decomposition occurs from 220 to 400°C. The largest and most dynamic mass loss occurred between 380 and 600 °C. The main pyrolysis process also occurs at these temperatures. In this temperature range, L-glucose and various combustible gases are formed. The sixth and seventh transformations, which are dehydration and carbonization processes, occur above 430 °C, and compete with the production of L-glucose. A decarboxylation process also takes place, resulting in the release of carbon dioxide. With increasing temperature, the carbon content increases. The pyrolysis of cotton products produces compounds such as water, carbon monoxide, carbon dioxide, alcohols, aldehydes, ketones, esters, ethers, and benzene. However, these compounds are only formed by the pyrolysis of non-combustible cotton.
Six transformations occurred in the process of thermal analysis of the diapers. The first transformation was endothermic (−10.4 J × g
−1), the second transformation was endothermic (−26.8 J × g
−1), the third transformation was exothermic (10.8 J × g
−1), the fourth transformation was exothermic (105.1 J × g
−1), the fifth transformation was endothermic (−58.9 J × g
−1), and the final transformation was endothermic (−9.3 J × g
−1). The energy balance of the thermal transformation of the diapers was positive (10.5 J × g
−1) (
Table 7). In the case of leno, seven thermal transformations occurred. The first transformation was endothermic (−0.92 J × g
−1), the second transformation was endothermic (−16.9 J × g
−1), the third transformation was endothermic (−1.0 J × g
−1), the fourth transformation was exothermic (164.6 J × g
−1), the fifth transformation was exothermic (−72.7 J × g
−1), the sixth transformation was endothermic (−31.1 J × g
−1), and the final transformation was endothermic (−40.3 J × g
−1). The energy balance of the thermal transformations of the material was positive (1.4 J × g
−1) (
Table 7). These results suggest that, to reduce energy needs for pyrolysis of hygiene waste, the process temperature should be no higher than 400–420 °C. This is because endothermic reactions occur above these temperatures.
DTG and DSC thermal analyses of diapers was carried out by Stępień et al. [
45]. Three endothermic transformations up to 300 ºC were observed. For comparison, in this study six transformations up to 500 °C were observed, of which the first two were endoenergetic and the third was exoenergetic up to 230 °C. It was shown in the study of Stępień et al. that diapers required about 1276 J∙g
−1 of energy in the process up to 300 °C. As previously mentioned, the energy determined by Stępień et al. [
45] refers to the whole process. Nevertheless, it is worth noting that the energy requirement for diapers is close to those of paper and cardboard.
3.3.6. Biodegradable Waste
The TG/DTG curves for poultry meat in
Figure 11a and for potato peelings in
Figure 11b are presented. The most dynamic weight loss for poultry meat was observed between 72 and 107 min at temperatures of 370–540 °C. For potato peelings, the most dynamic decrease occurred between 65 and 85 min, between 333–430 °C. The weight loss in the case of potato peels (
Figure 11a) was related to the thermal decomposition of starch, whereas in the case of chicken it was related to the decomposition of proteins (
Figure 11a).
The first decrease in the weight of the potato peel sample was recorded at about 220 °C. Between 220 and 350 °C, the mass loss was small, i.e., about 6%. In contrast, in the temperature range of 350–450 °C, there was a faster mass decrease (about 45% relative to the mass at 350 °C) [
58]. The most dynamic weight loss for potato peelings occurred in a shorter time than for cellulosic materials. This result is related to the degree of polymerization of starch, which is usually lower than the polymerization of cellulose. Further weight loss was about 20% of the initial weight [
59].
The main component of chicken meat, other than water, is protein, which constitutes 24%, and fat, which constitutes about 2%. The decrease in weight was mainly related to the decomposition of fats because the proteins in meat decomposed at 59 and 82 °C (myosin, collagen, and sarcoplasmic proteins, actin) [
60].
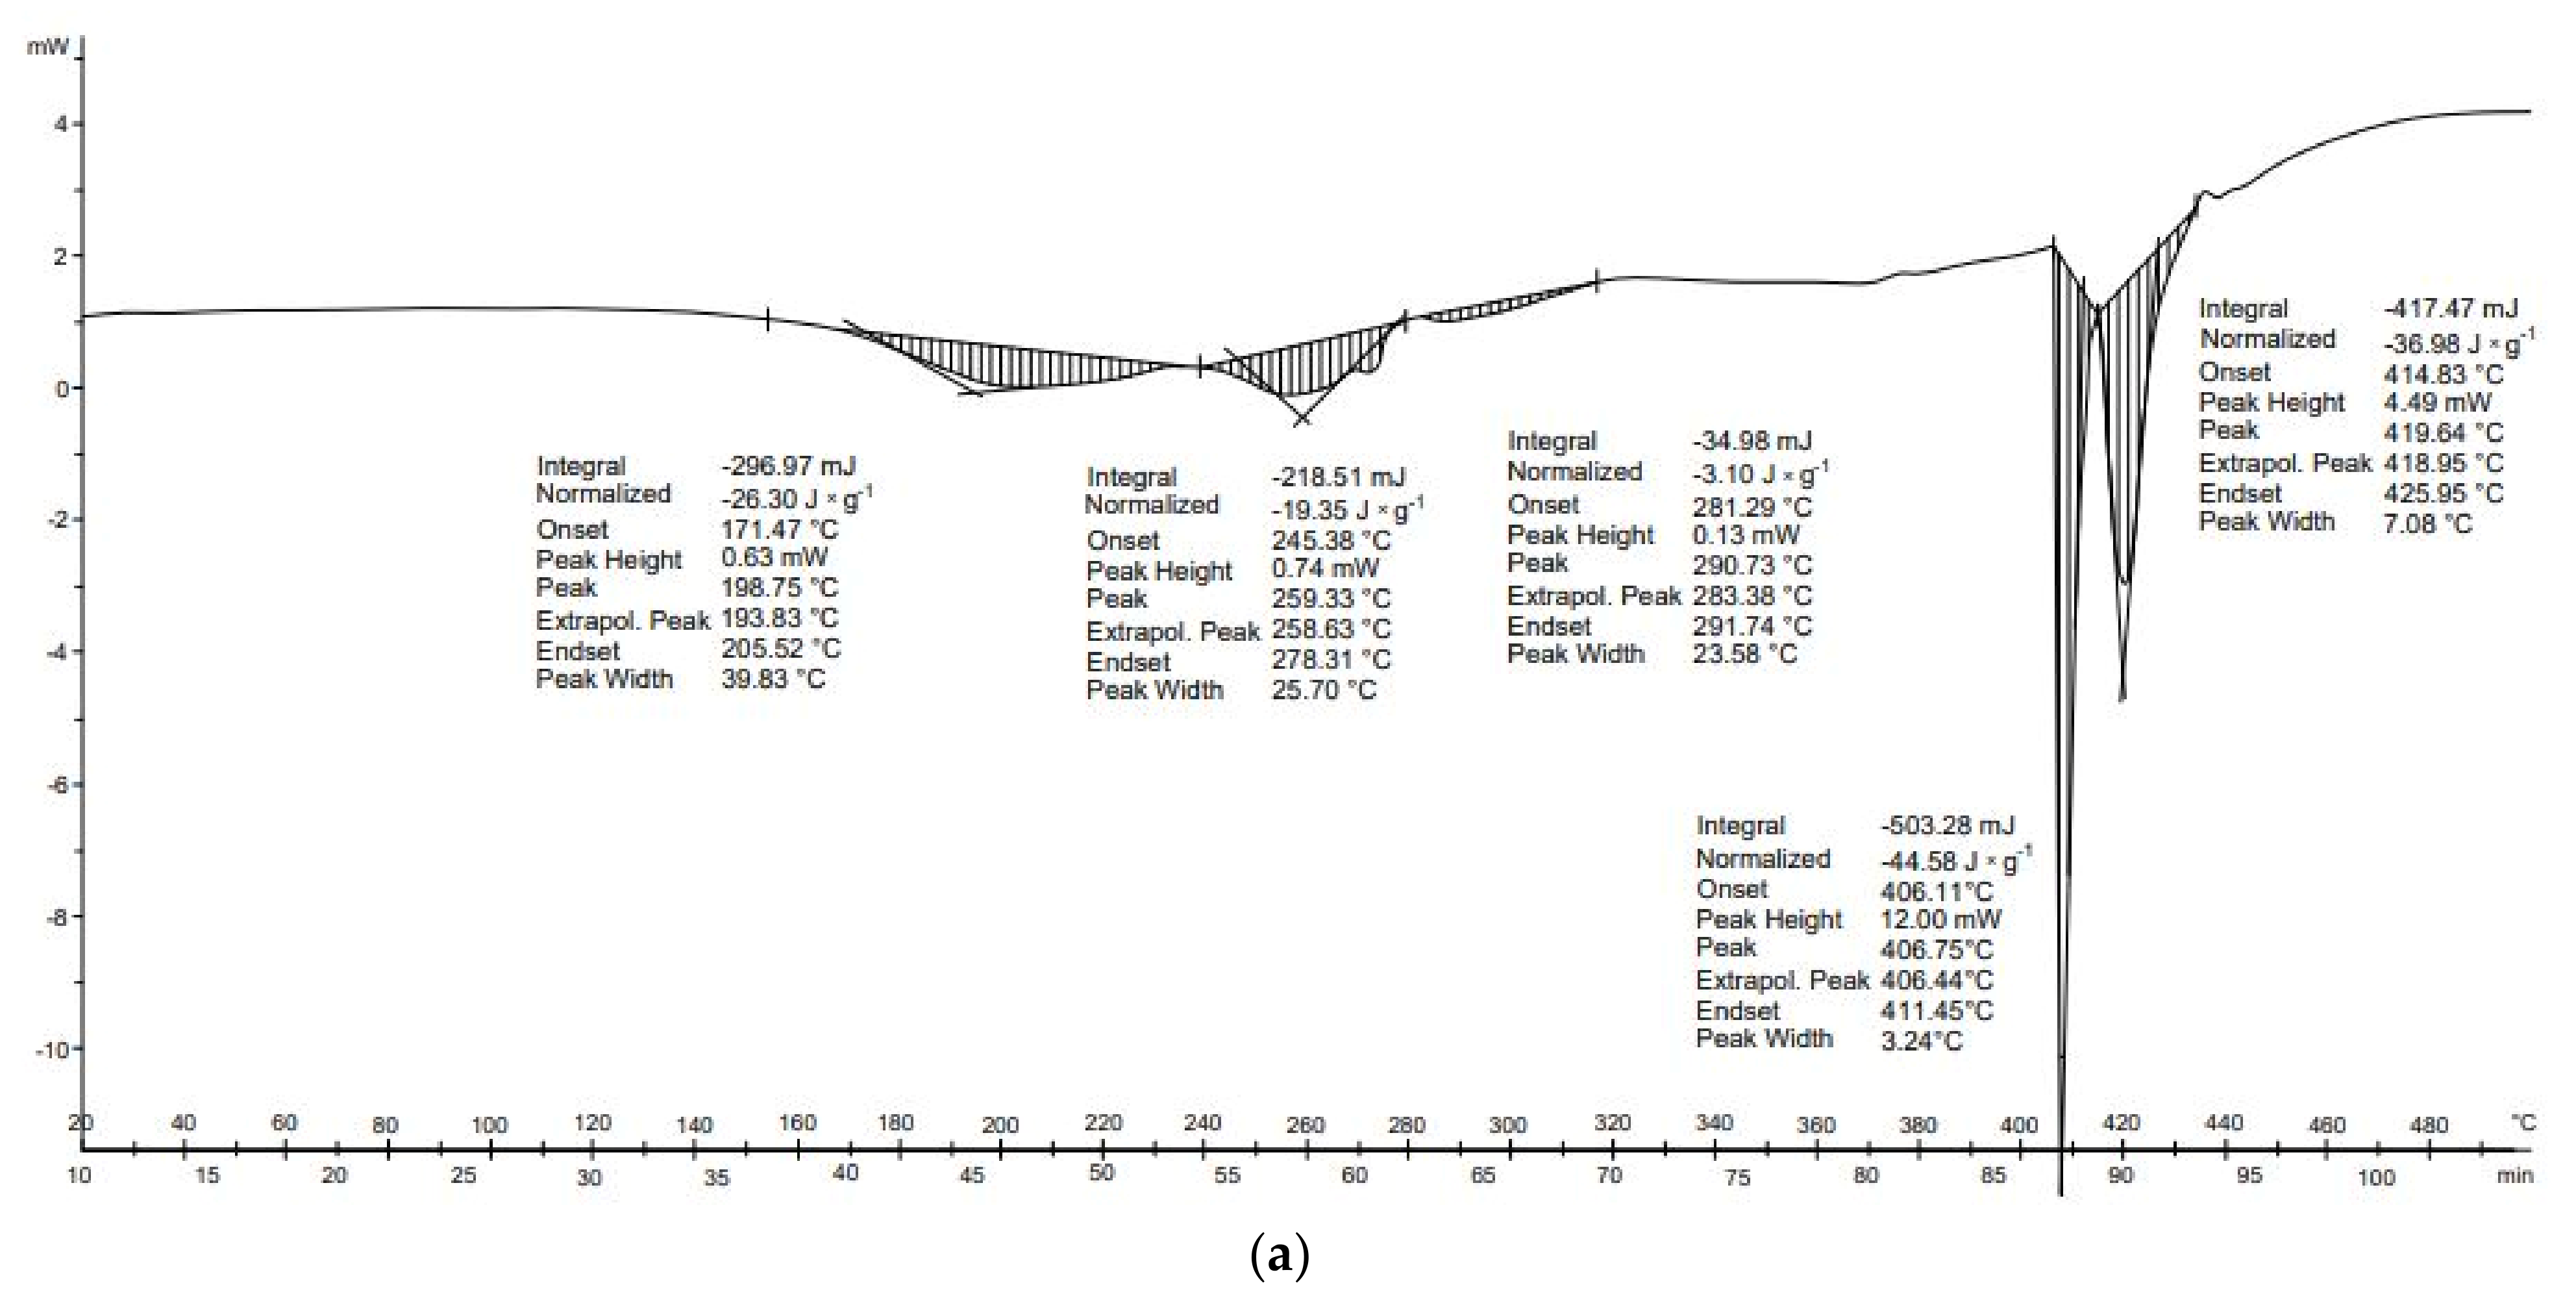
Five endothermic transformations were observed during the DSC analysis of poultry meat (
Figure 12a). They occurred in the following temperature ranges: 171–205 °C; 245–278 °C; 281–292 °C; 406–411 °C; and 415–426 °C. Comparing these data with the results of the DTG/TG analysis, there was no mass decrease during the first transformation. This is probably due to the difference between the actual temperature of the reactor and the temperature of the sample, or because there is a chemical reaction taking place which results in a new product. The first transformation can be related to the transformation of arachidonic acid, whose boiling point is 170 °C. The second transformation may be related to the chemical reaction of erucic acid (boiling point of 265 °C) [
58]. As with arachidonic acid, no decrease in weight was observed during DTG/TG analysis. For the subsequent transformations, no links were found with which to associate them. Poultry meat also contains other acids with higher boiling points, i.e., palmitic acid (351 °C), oleic acid (360 °C), and nervonic acid (479 °C), and cholesterol, whose boiling occurs at 360 °C. The transformations occurring at this time are likely related to the decomposition of the charred sample [
58].
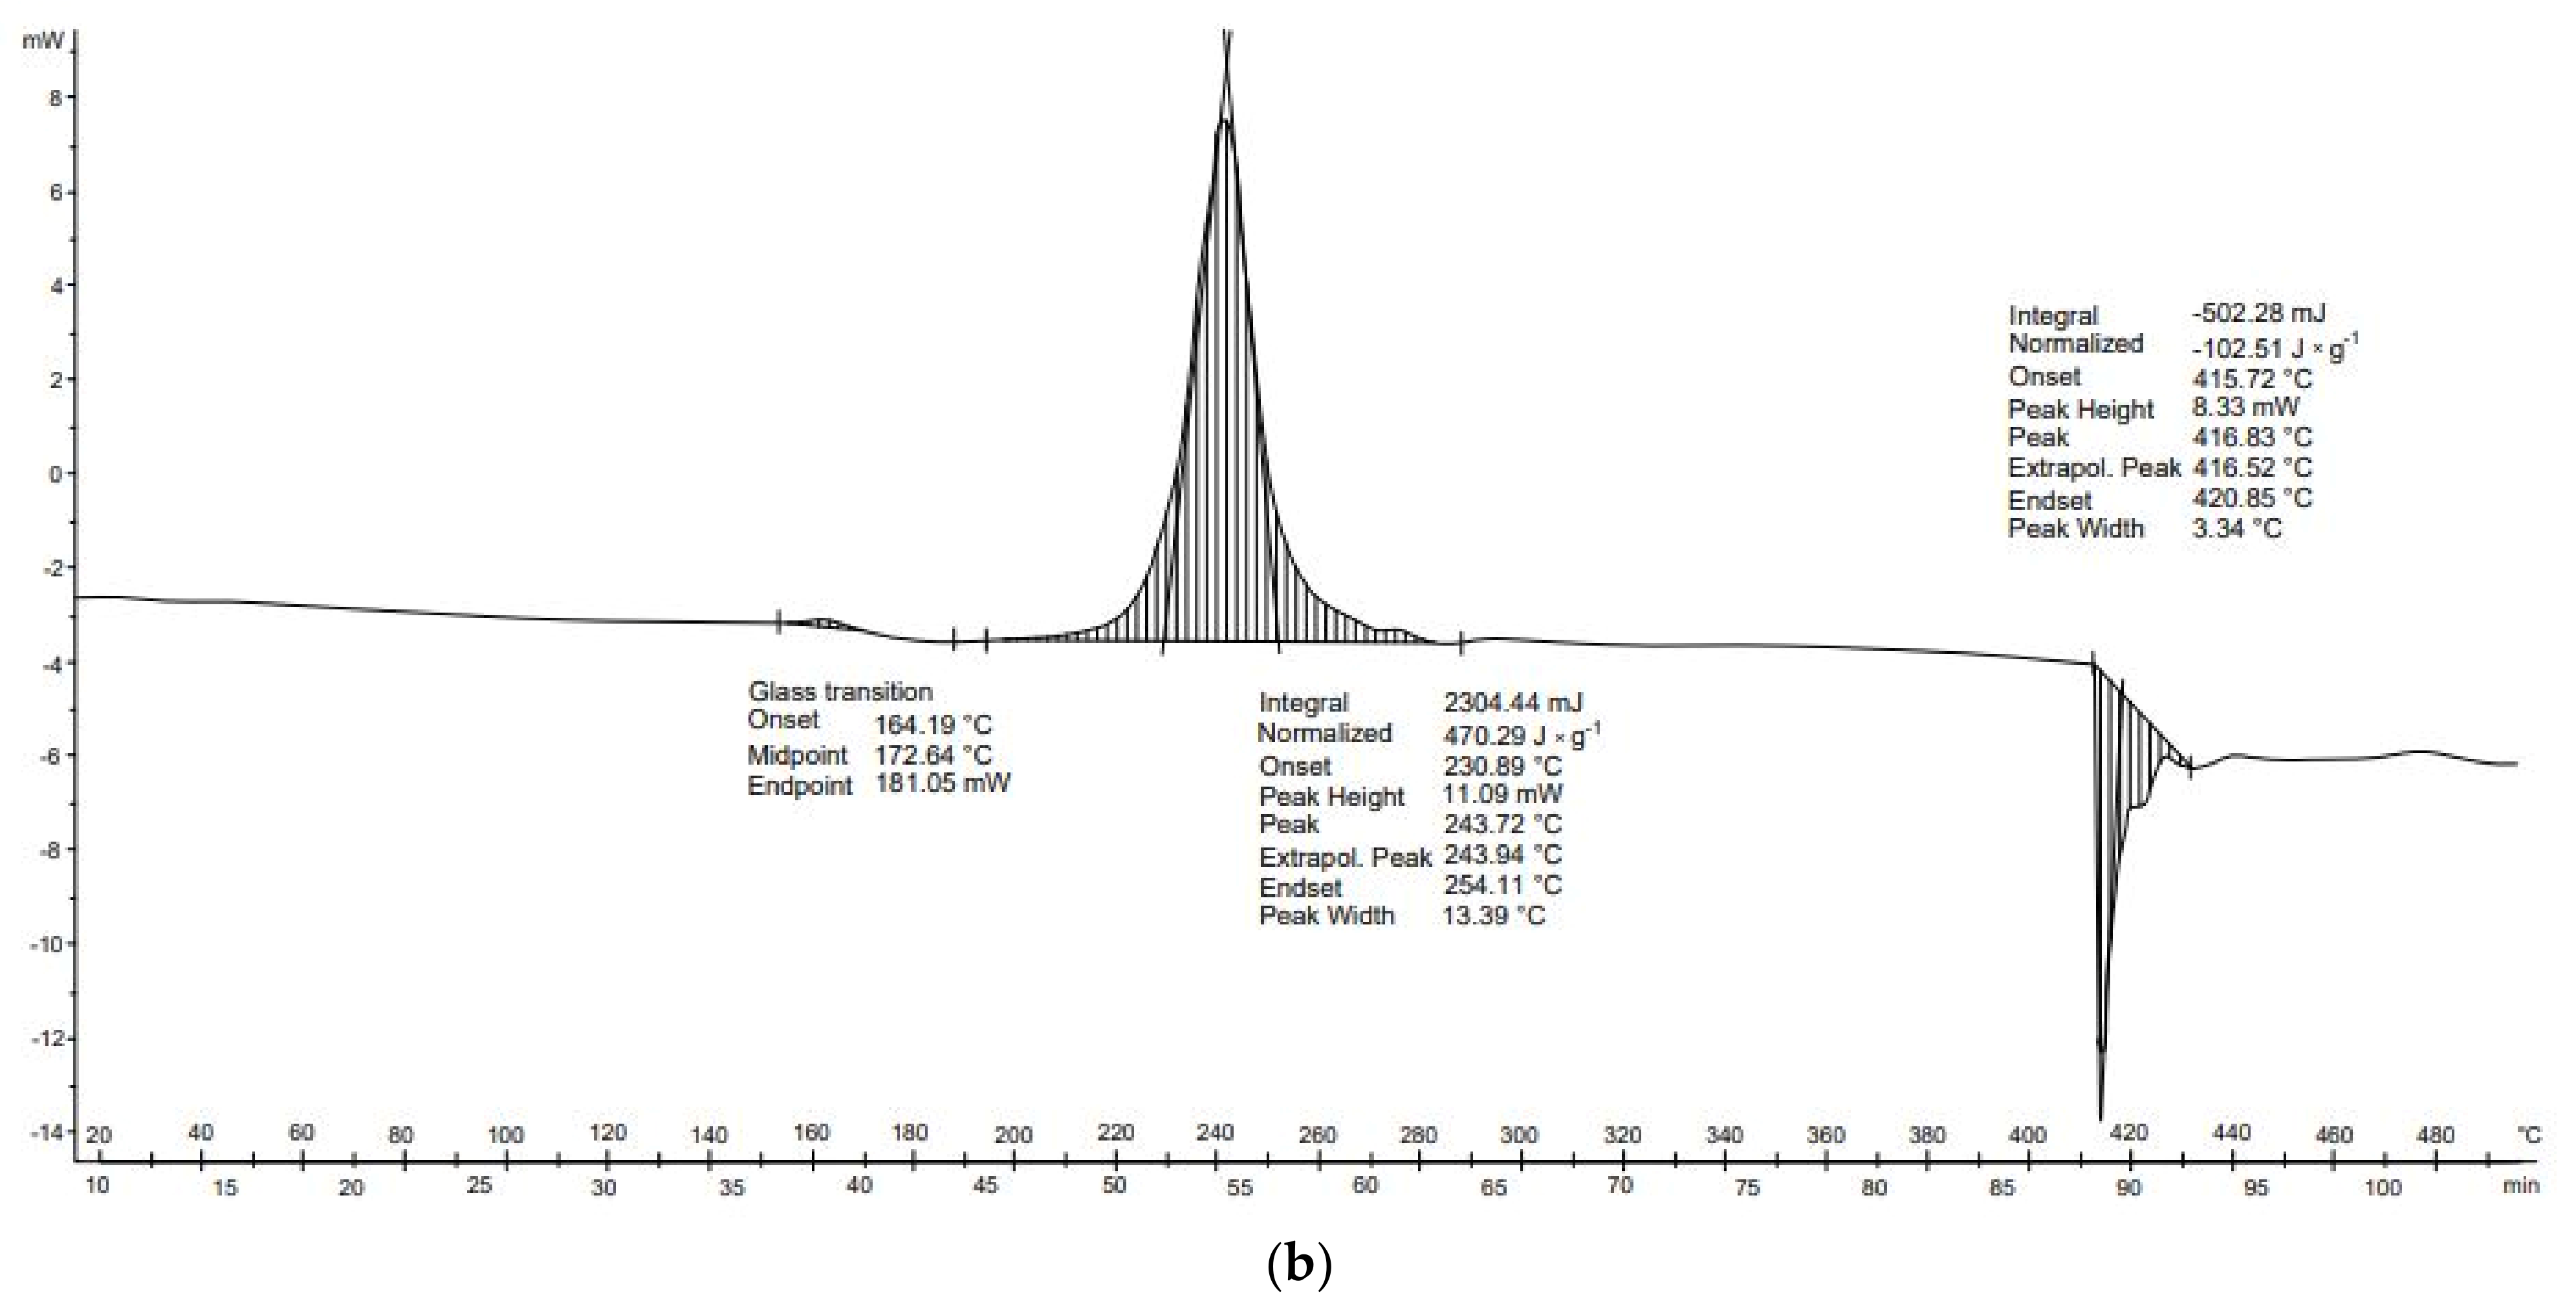
Potato peelings (
Figure 12b) are characterized by three transformations: vitrification (164–181 °C), exothermal transformation (234–254 °C), and endothermal transformation (416–421 °C). The second, exothermal, transformation occurred at temperatures of 231–254 °C. The final transformation, of an endothermal nature, was observed between 416 and 421 °C. Furthermore, no exothermal transformations occurred in any DSC analysis of potato starch. These transformations may be related to the previous drying of the potato sample and thus to the thermal decomposition of the unfolded proteins.
Five transformations occurred in the thermal analysis of chicken meat. The first transformation was endothermic (−26.3 J × g
−1), the second transformation was endothermic (−19.4 J × g
−1), the third transformation was endothermic (−3.1 J × g
−1), the fourth transformation was endothermic (−44.6 J × g
−1), and the final transformation was endothermic (−37.0 J × g
−1). The energy balance of the thermal transformations of the chicken meat was negative (−130.3 J × g
−1) (
Table 8). In the case of potato peelings, three thermal transformations occurred. The first transformation occurred but its value equilibrated, the second transformation was exothermic (470.3 J × g
−1), and the third transformation was endothermic (−102.5 J × g
−1). The overall energy balance of the thermal transformations of the potato peel was positive (367.8 J × g
−1).
The energy balance for transformations of biodegradable wastes showed inconclusive results. During the pyrolysis of chicken meat, it was not possible to balance the energy of transformations because all of them were endothermal. In contrast, to reduce the energy required for pyrolysis of potato peels, temperatures of 220–240 °C should be maintained. According to the studies of Stepień et al. [
45], chicken meat pyrolyzed up to 300 °C was characterized by low energy needs of 215 J∙g
−1. In this study, the energy balance of transformations for processes up to 500 °C was −130.3 J × g
−1. These results show a different trend than that observed by Stępień et al. [
45] because, as there is no exothermal transformation, the energy for the process should be significantly higher. This phenomenon may occur because chicken meat has a significantly lower specific heat than those of the previously mentioned wastes. As a result, the total energy required to heat chicken meat is significantly lower than that required for cardboard and paper wastes, despite the lack of exothermal reactions in chicken meat. Nevertheless, this phenomenon needs to be confirmed by additional experiments.


