Article

Research on Blade Design of Lift–Drag-Composite Tidal-Energy Turbine at Low Flow Velocity

1
Faculty of Mechanical Engineering & Mechanics, Ningbo University, Ningbo 315211, China
2
School of Mechanical Engineering and Automation, College of Science & Technology, Ningbo University, Cixi 315300, China
3
Polytechnic Institute, Zhejiang University, Hangzhou 310015, China
*
Author to whom correspondence should be addressed.
Energies 2021, 14(14), 4258; https://doi.org/10.3390/en14144258
Submission received: 7 May 2021 / Revised: 8 July 2021 / Accepted: 12 July 2021 / Published: 14 July 2021
(This article belongs to the Special Issue Tidal Turbines)

Abstract

:
The research on tidal-current energy-capture technology mainly focuses on the conditions of high flow velocity, focusing on the use of differential pressure lift, while the average flow velocity in most sea areas of China is less than 1.5 m/s, especially in the marine aquaculture area, where tidal-current energy is needed to provide green energy locally. Due to the low flow velocity of this type of sea area, it seriously affects the effect of differential pressure lift, which is conducive to exerting the effect of impact resistance. In this regard, the coupling effect of the differential pressure lift and the impact resistance on the blade torque is comprehensively considered, this research puts forward the design method of the lift-–drag-composite thin-plate arc turbine blade. Based on the blade element momentum (BEM) theory and Bernoulli’s principle, the turbine dynamic model was established, and the nonlinear optimization method was used to solve the shape parameters of the turbine blades, and the thin-plate arc and NACA airfoil blade turbines were trial-produced under the same conditions. A model experiment was carried out in the experimental pool, and the Xiangshan sea area in Ningbo, East China Sea was taken as the experimental sea area. The results of the two experiments showed the same trend, indicating that the energy-harvesting performance of the lift–drag-composite blade was significantly better than that of the lift blade under the conditions of low flow velocity and small radius, which verified the correctness of the blade design method, and can promote the research and development of tidal energy under the conditions of low flow velocity and small radius.

1. Introduction

The global economy is developing rapidly, and the demand for energy is increasing. The environmental pollution and resource shortages caused by traditional fossil fuels are becoming increasingly serious [1]. There is an urgent need to accelerate the development and utilization of renewable energy. China has abundant tidal energy resources, and tidal energy has the advantages of predictability and lower environmental impact, which is a necessary supplement to meet the energy needs of sea areas and islands where traditional energy forms are not applicable [2,3]. Especially in recent years, the country has vigorously developed the marine economy and promoted intelligent green marine aquaculture, but the intelligent aquaculture far away from the coast urgently needs to solve the problem of green energy supply [4,5,6], and tidal current energy can obtain energy locally, which makes it the best choice for energy supply in the intelligent process of marine aquaculture.
Although scholars at home and abroad have carried out a lot of research on the utilization of tidal energy, they have mainly focused on tidal energy-capture technology at higher flow velocities [7]. For example, the SeaGen tidal current generator developed by the United Kingdom has a turbine diameter up to 20 m and a rated flow velocity of 2.4 m/s [8]; the 60 kW and 120 kW tidal current generator sets designed by Zhejiang University in China have a rated flow velocity of 2.1 m/s [9]; China National Ocean Technology Center’s 150 kW horizontal axis tidal current power generation device with a maximum flow velocity of 2.7 m/s [10]; and the European Marine Energy Center(EMEC) conducts tidal energy research at a flow velocity of 2~3 m/s [11]. These studies mainly consider the effect of differential pressure lift on the turbine. However, the average flow velocity in most sea areas of China is less than 1.5 m/s, and marine aquaculture is limited by the anti-current ability of fish schools and aquaculture facilities. Generally, the aquaculture area is located in the sea area with a lower flow velocity, and the effect of the differential pressure lift at lower flow velocities is not good, so the development of low-velocity tidal energy-capture technology will greatly promote the efficient utilization of ocean energy and the intelligent development of marine aquaculture.
In recent years, some scholars have carried out tidal energy-capture technology at lower flow velocities. For example, Brian G. Sellar et al. [12] considered the average flow velocity and turbulence intensity at multiple locations near a tidal turbine to study energy-harvesting performance; Zhilong Liu et al. [13] studied the problem of tidal weakening in breeding farms; Jianjun Yao et al. [14] studied the influence of a savonius turbine on the reduction of flow velocity; and Junhua Chen et al. [15] proposed a calculation method for the design of flow velocity of turbines. These studies have achieved certain results in low-velocity energy capture, but the comprehensive utilization of differential pressure lift and impact resistance needs to be further improved. Based on a hydrodynamic analysis, this paper proposes a lift–drag-composite thin-plate arc blade, establishes a mechanical model of the coupling effect of differential pressure lift and impact resistance, establishes the blade-shape-parameter balance equation, and optimizes the design model to improve the comprehensive energy-capture performance of the turbine.

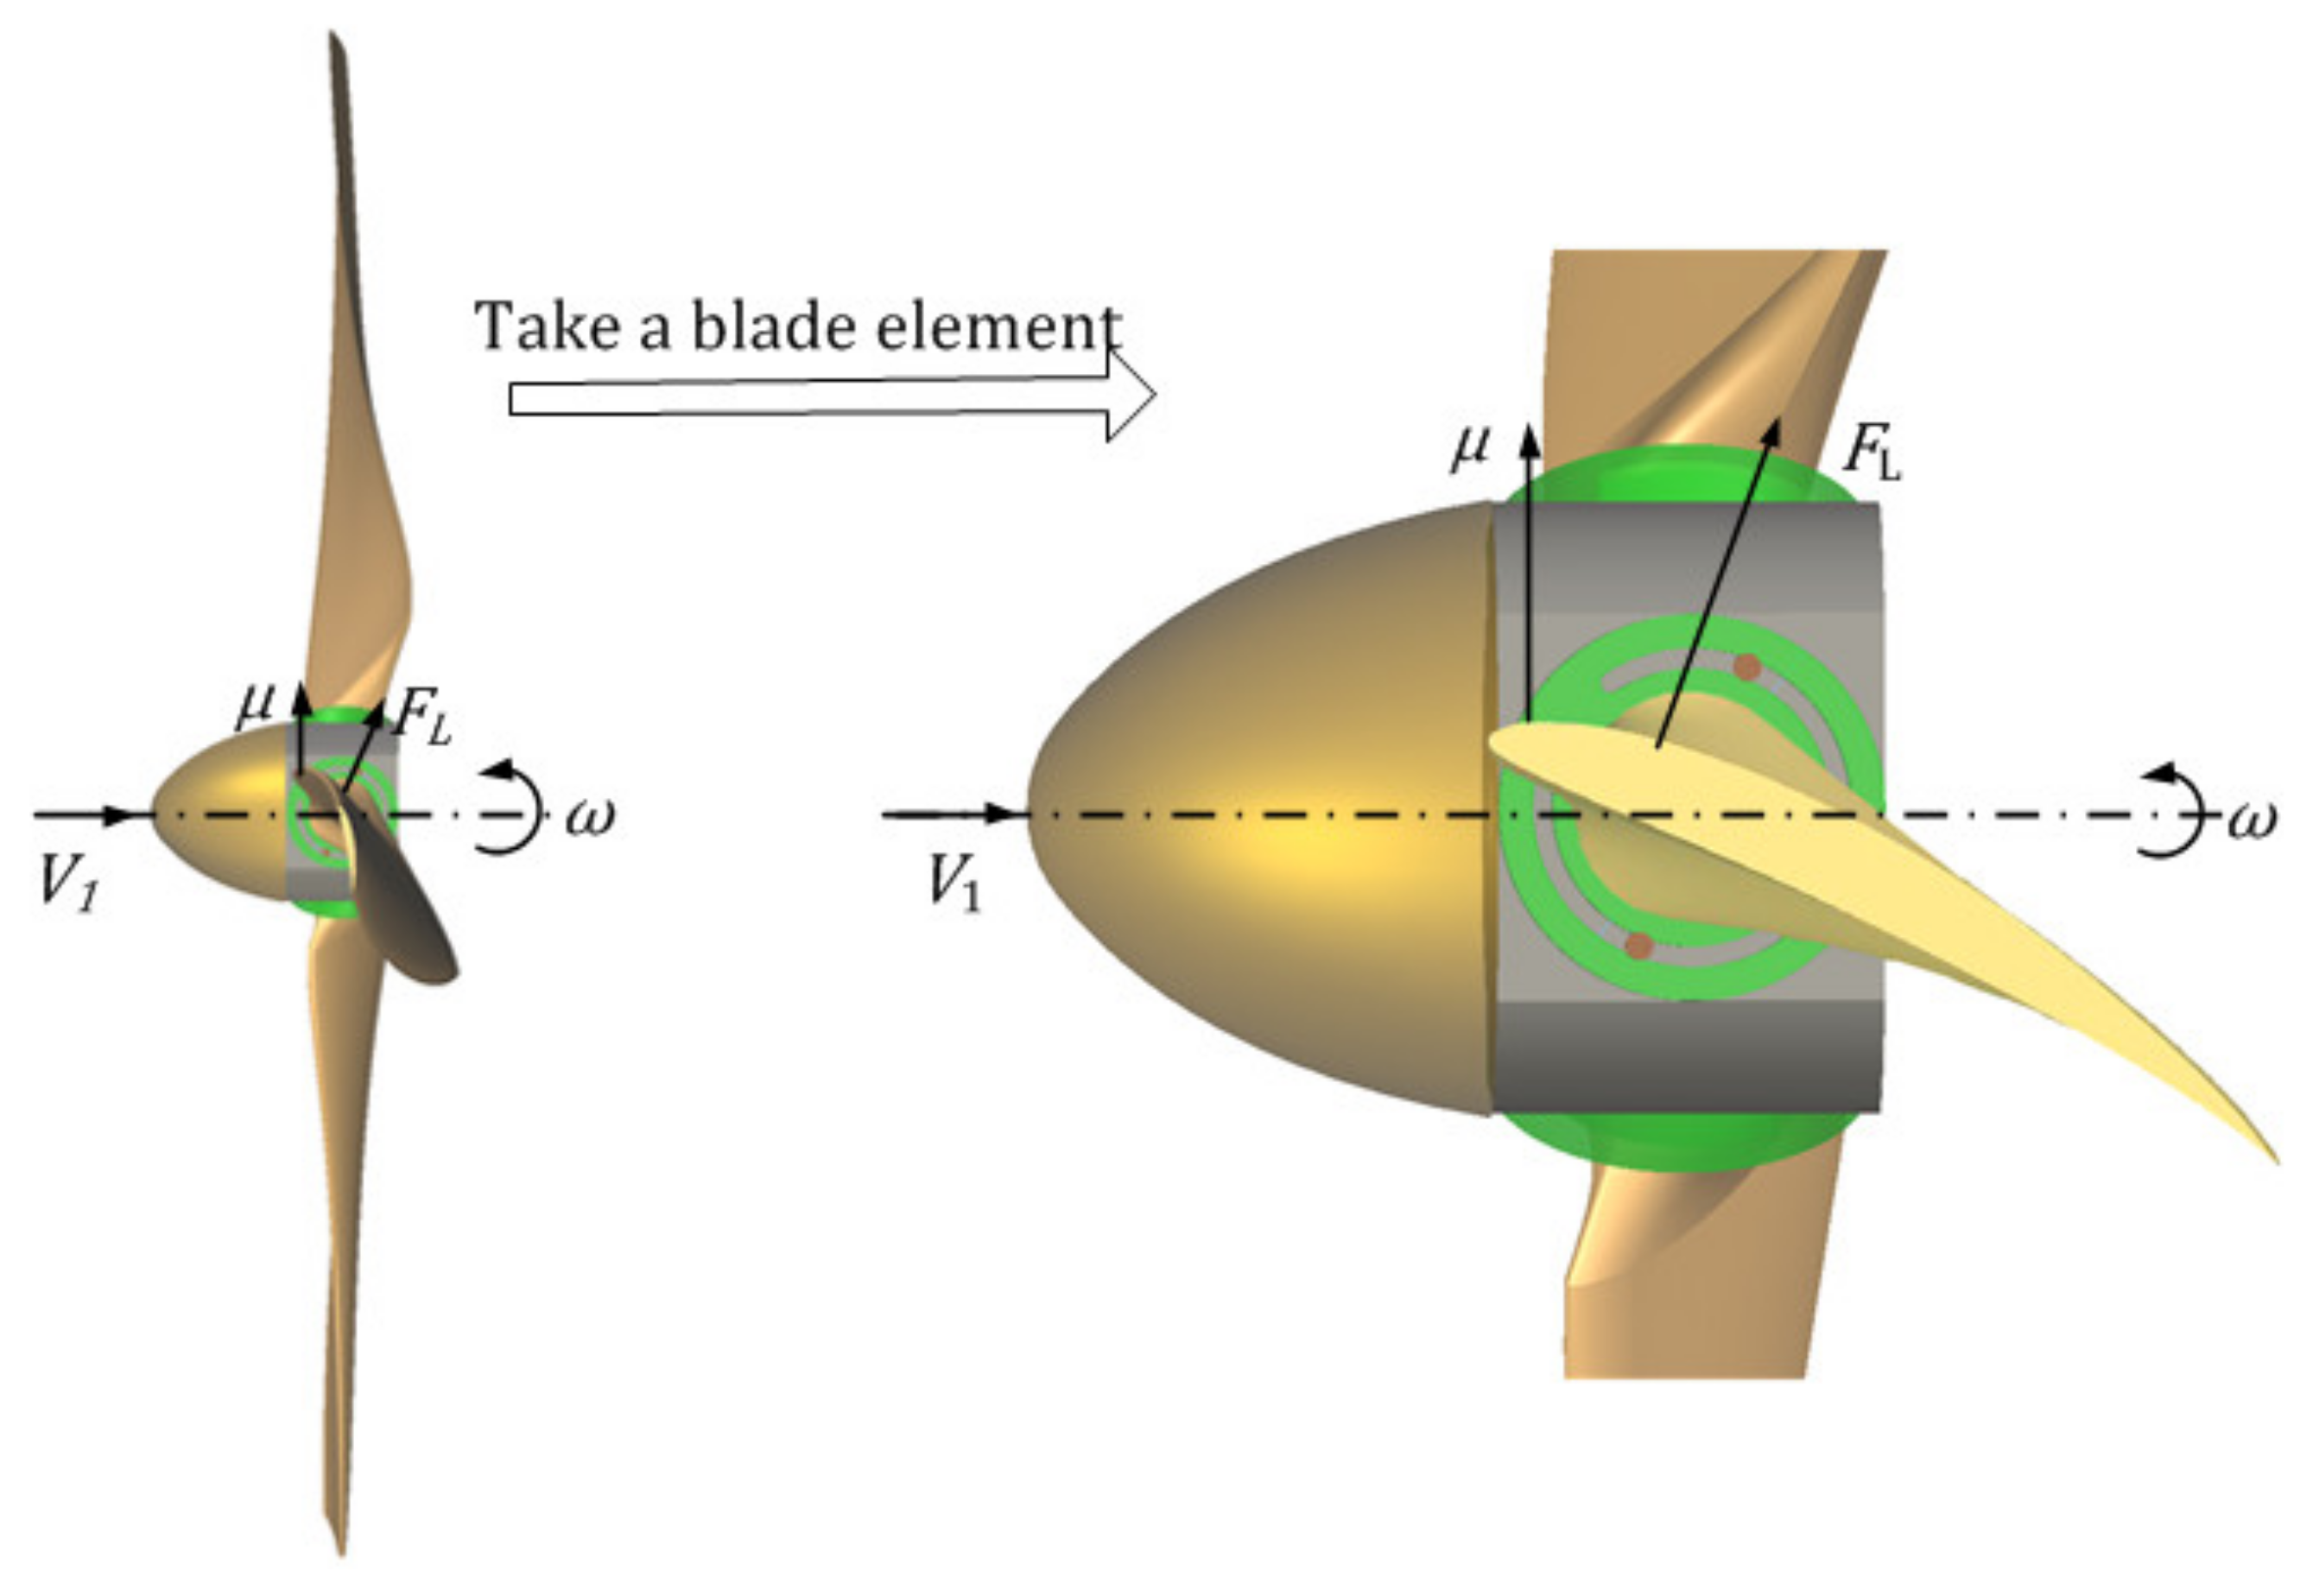
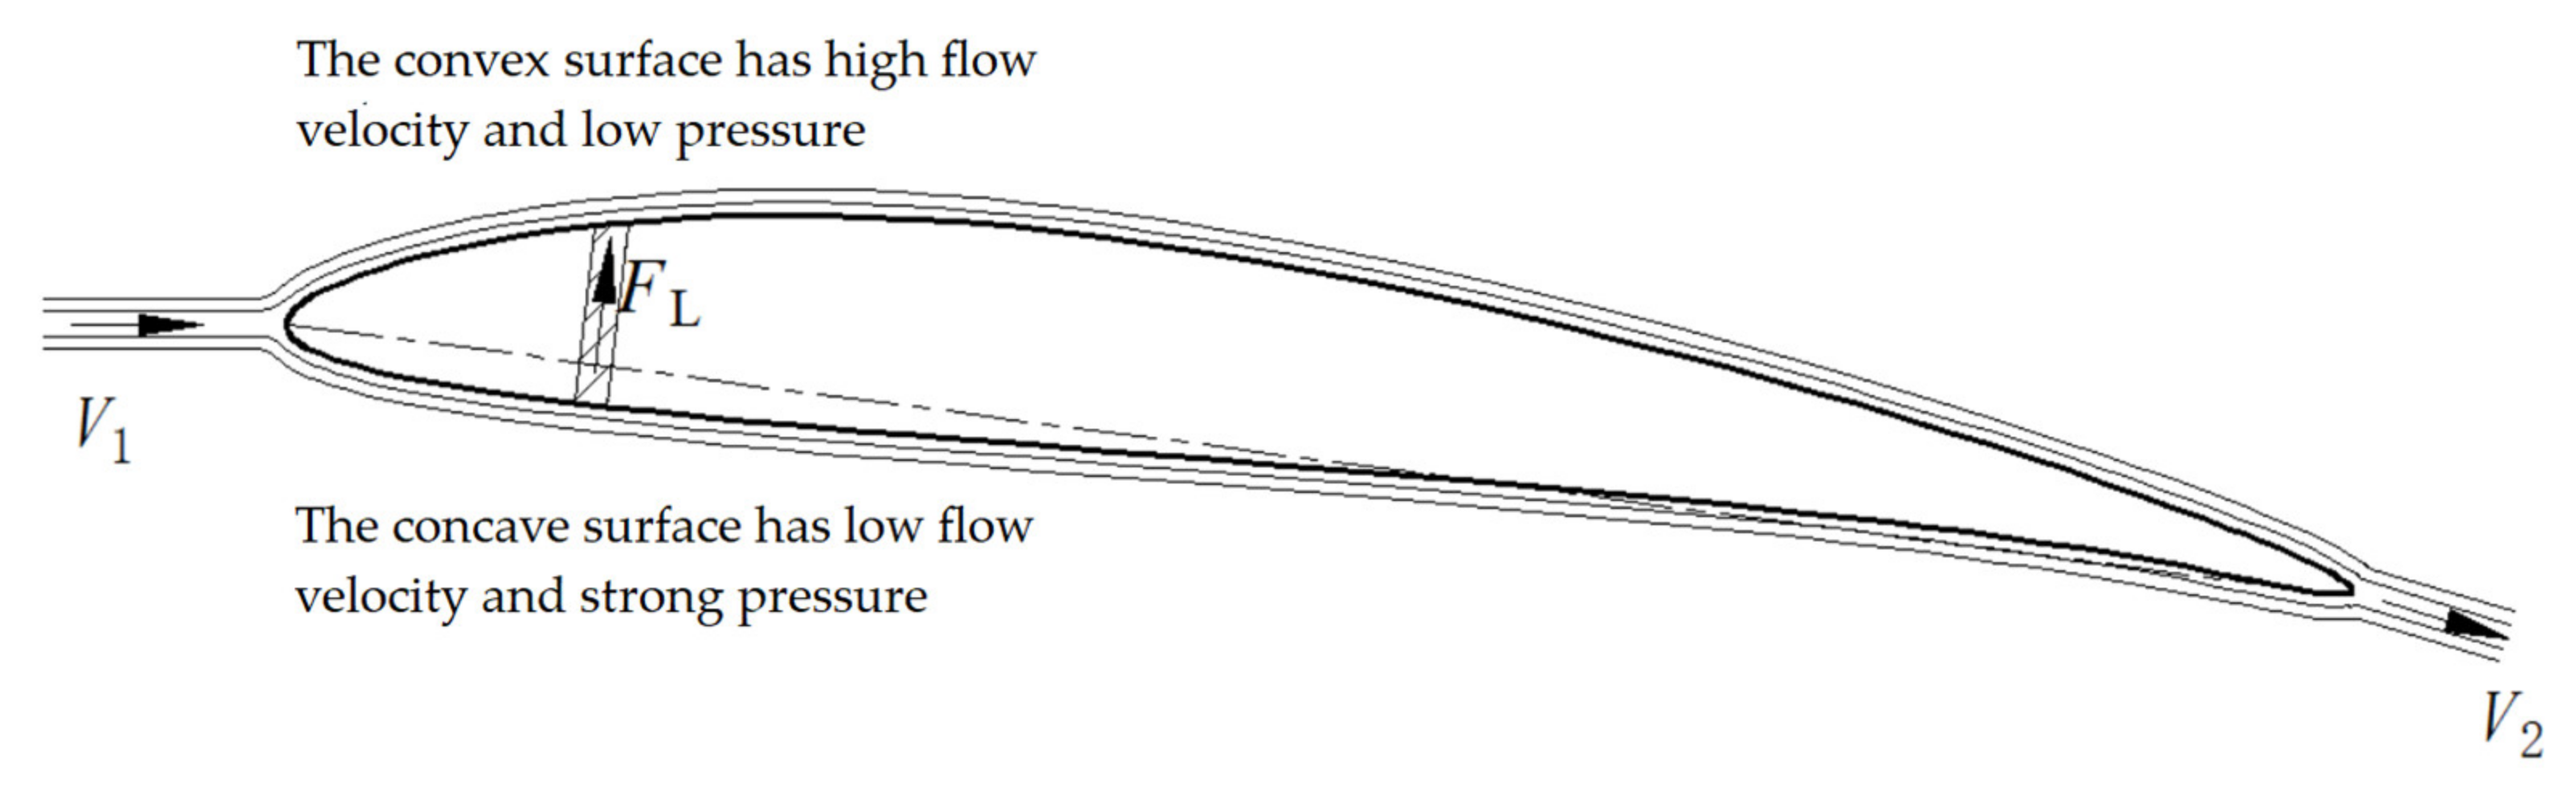
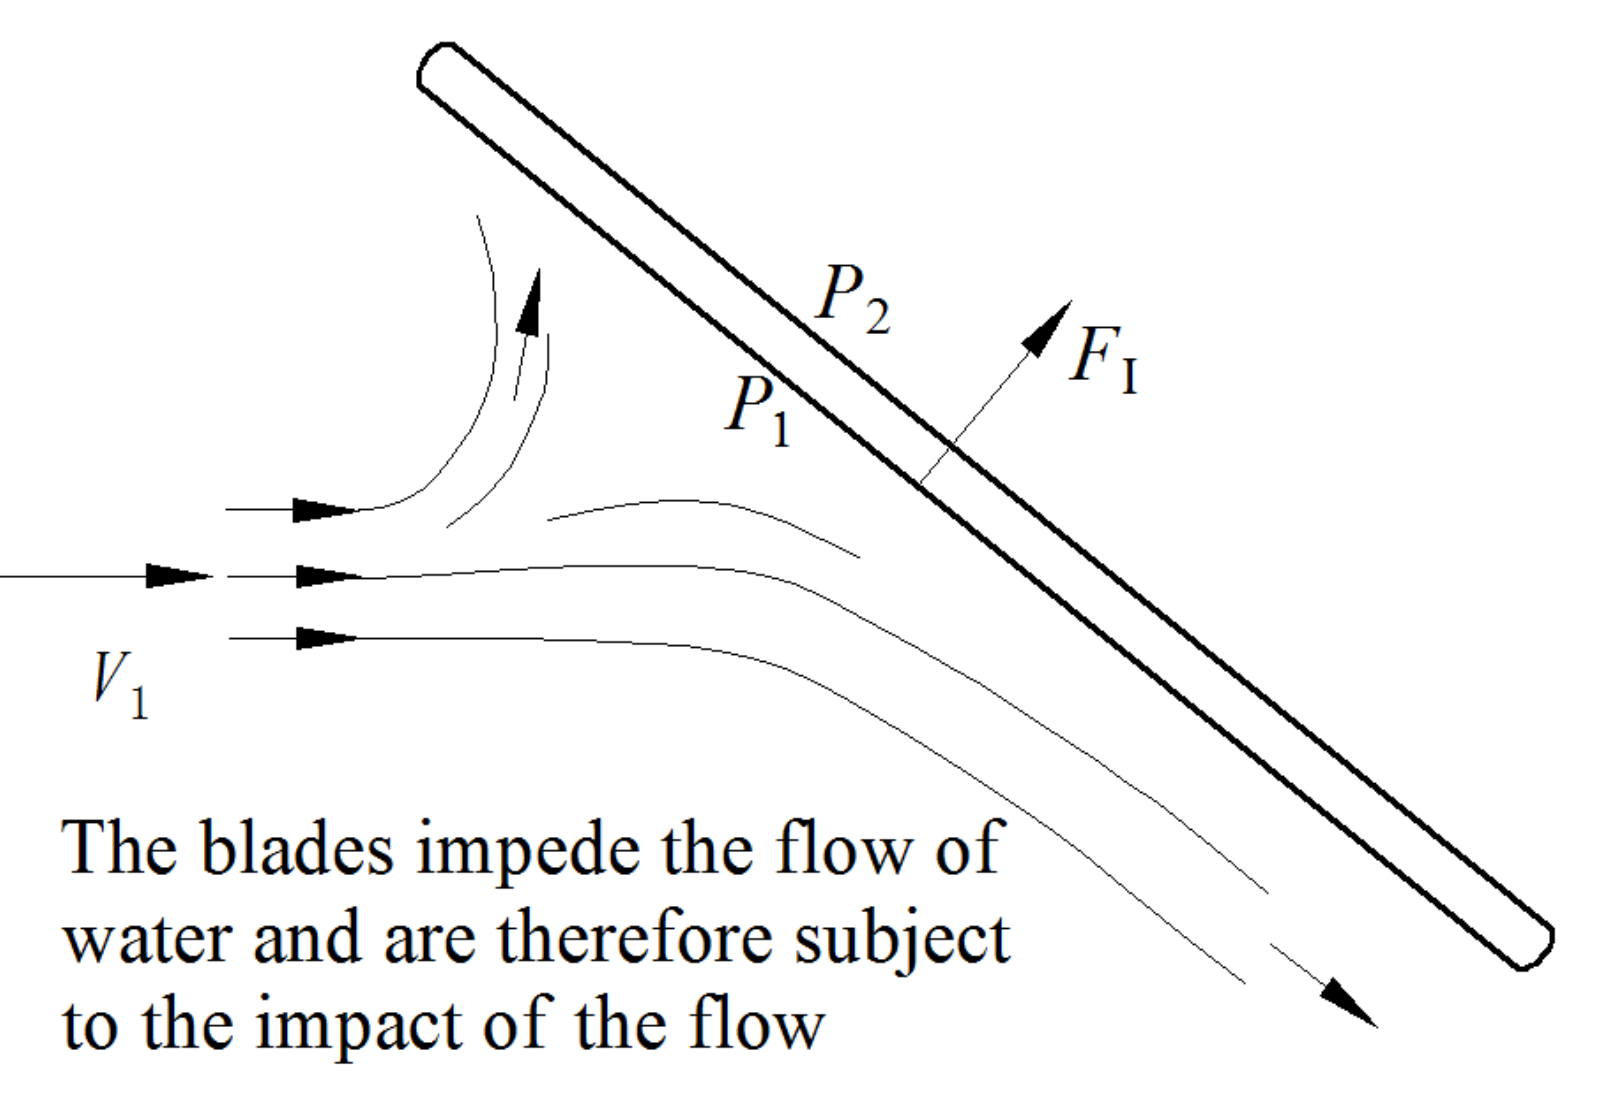
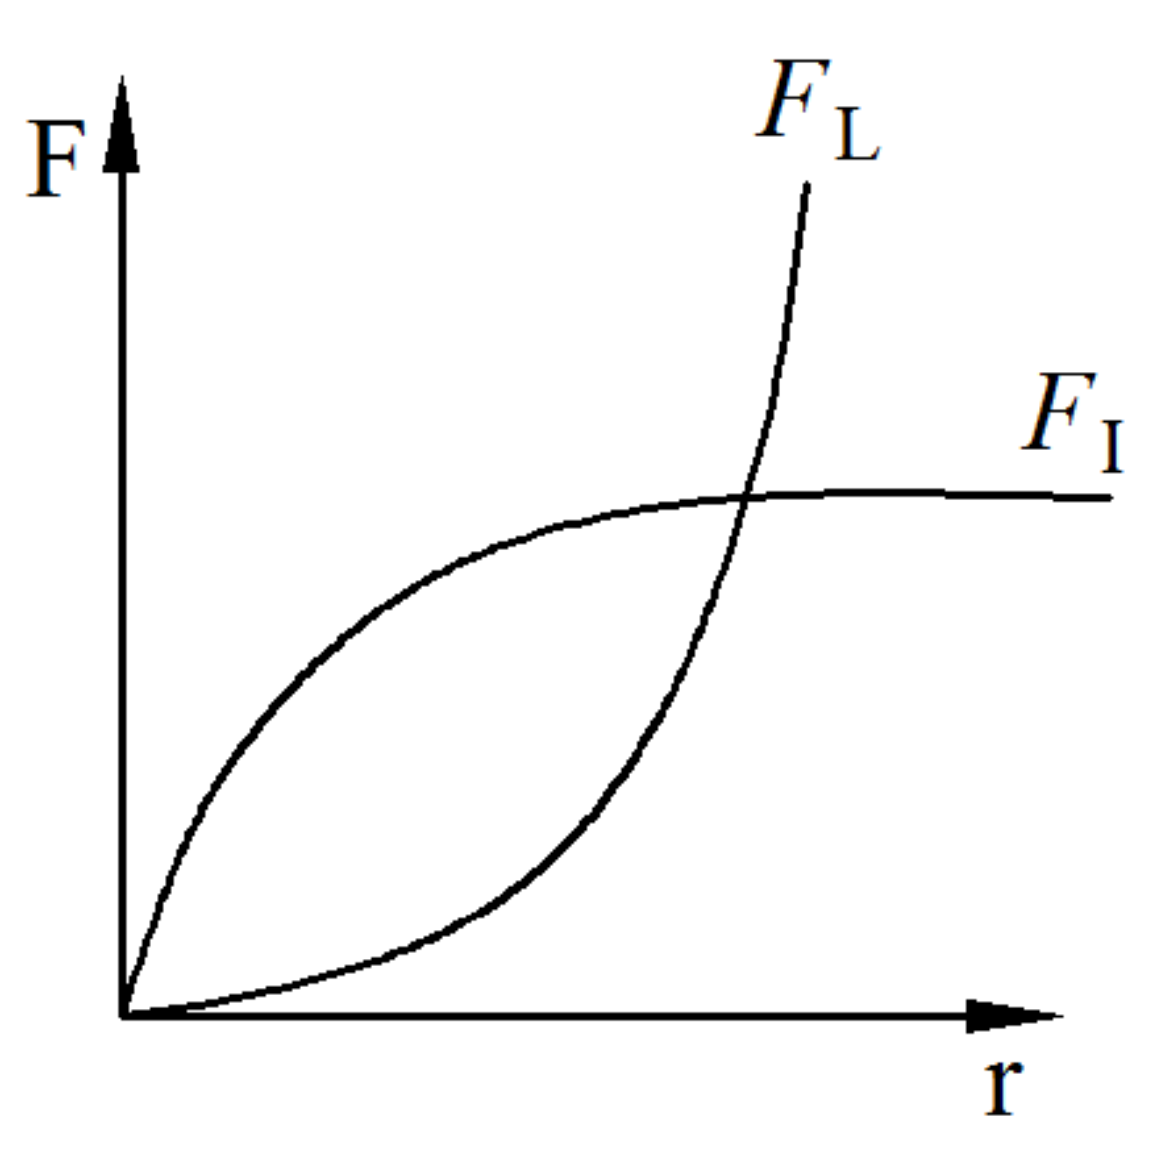
2. Analysis of Differential Pressure Lift and Impact Resistance of Water Turbine Blades

Horizontal axis tidal turbines can be divided into lift-type and drag-type according to different driving forces. The lift-type turbine is shown in Figure 1: the incoming flow velocity is V 1 , the rotational angular velocity of the turbine is ω, and the rotational linear velocity is μ. As shown in Figure 2, according to Bernoulli’s principle, when the water flows through the surface of the turbine blade, the flow velocity on the convex side increases, the pressure decreases, the flow velocity on the concave side decreases, and then the pressure increases. There will be a pressure difference between the two sides of the blade. With reference to the force of the airplane wing, this force is called the differential pressure lift F L , and the direction is the same as the radial direction of the arc of the turbine blade. The differential pressure lift F L is decomposed into rotational driving force and axial thrust, and the rotational driving force drives the rotation of the water turbine.
The drag-type turbine is shown in Figure 3. The water flows to the turbine, and the blades hinder the water flow. The water flow gathers on the front side of the blade, causing the change of flow velocity and direction. The fluid pressure P1 on the front side of the blade increases, and the fluid pressure P2 on the back side of the blade decreases. There is a pressure difference between the front and rear sides, P1 > P2. As shown in Figure 4, according to the momentum theory, the water flow is hindered by the blades, and the blades are subjected to the impact force of the water flow, which is called impact resistance F I in this article, and the direction is the same as the normal direction of the turbine blades. The impact resistance F I is decomposed into rotational driving force and axial thrust, and the rotational driving force drives the rotation of the water turbine.
The differential pressure lift is defined as F L = 1 2 C l ρ V 2 A , where C l is the lift coefficient; ρ is the water flow density; and V is the incoming flow velocity and the vector sum of the water flow velocity and the tangential velocity of the turbine rotation, V = 2 π n r , where n is the turbine speed and r is the radius of the hydraulic turbine. It can be seen that the differential pressure lift is related to the incoming flow velocity, and is quadratically proportional to the radius of the turbine blade, so the larger the radius, the greater the differential pressure lift. According to the momentum theory, in the water-flow impact resistance F I = m Δ V , the impact resistance is proportional to the mass of water flow m and the flow velocity change Δ V after the water flow impacts the turbine. The flow mass is related to the compactness of the turbine blades and the swept area of rotation, and the compactness decreases with the increase of the radius. The trend of differential pressure lift and impact resistance as the radius changes is shown in Figure 5.
The hydraulic turbine blades are affected by the differential pressure lift and impact resistance, and the force received by the blades is decomposed into rotational driving force and axial force. Among them, the rotational driving force realizes the rotation of the turbine and converts the tidal energy into useful mechanical energy, while the axial force increases the bending change of the blade and the supporting force of the root of the blade. Excessive axial force can easily lead to blade bending deformation and root fracture, so in the design of turbine blades, it is necessary to maximize the rotational driving force while reducing the axial force. According to the direction of the differential pressure lift and impact resistance, the angle between differential pressure lift and axial force is larger, and the proportion of axial force decomposed is smaller. Therefore, scholars have mostly studied the differential pressure lift under the condition of high speed and large radius. For example, in wind power generation, the radius of the blade can reach 70 m. In this case, if the blade shape is changed to increase the impact resistance, the risk of blade breakage is likely to develop. Therefore, under the condition of high flow velocity and large radius, the pressure difference lift is mainly considered, and the impact resistance is ignored.
The turbine-blade radius of tidal-current energy-capture devices developed in China is not too large. For example, in the dozens of KW-level tidal energy-generating devices developed by Zhejiang University [16] and Harbin Engineering University [17] in China, the radius of the turbines are all within 2.5 m; moreover, the impeller diameter of the tidal-energy turbine used in intelligent breeding equipment is smaller, such as the self-powered aquaculture-platform turbine developed by Zhejiang University Ningbo Institute of Technology, which has a blade radius of 1 m. Under the condition of low flow velocity and small radius, the impact resistance cannot be ignored, so it is necessary to comprehensively consider the coupling effect of differential pressure lift and impact resistance on the turbines to improve the tidal-energy-capture performance of small turbines in low-velocity sea areas.

3. Design of the Arc-Shaped Blades with Lift–Drag-Composite Thin-Plate

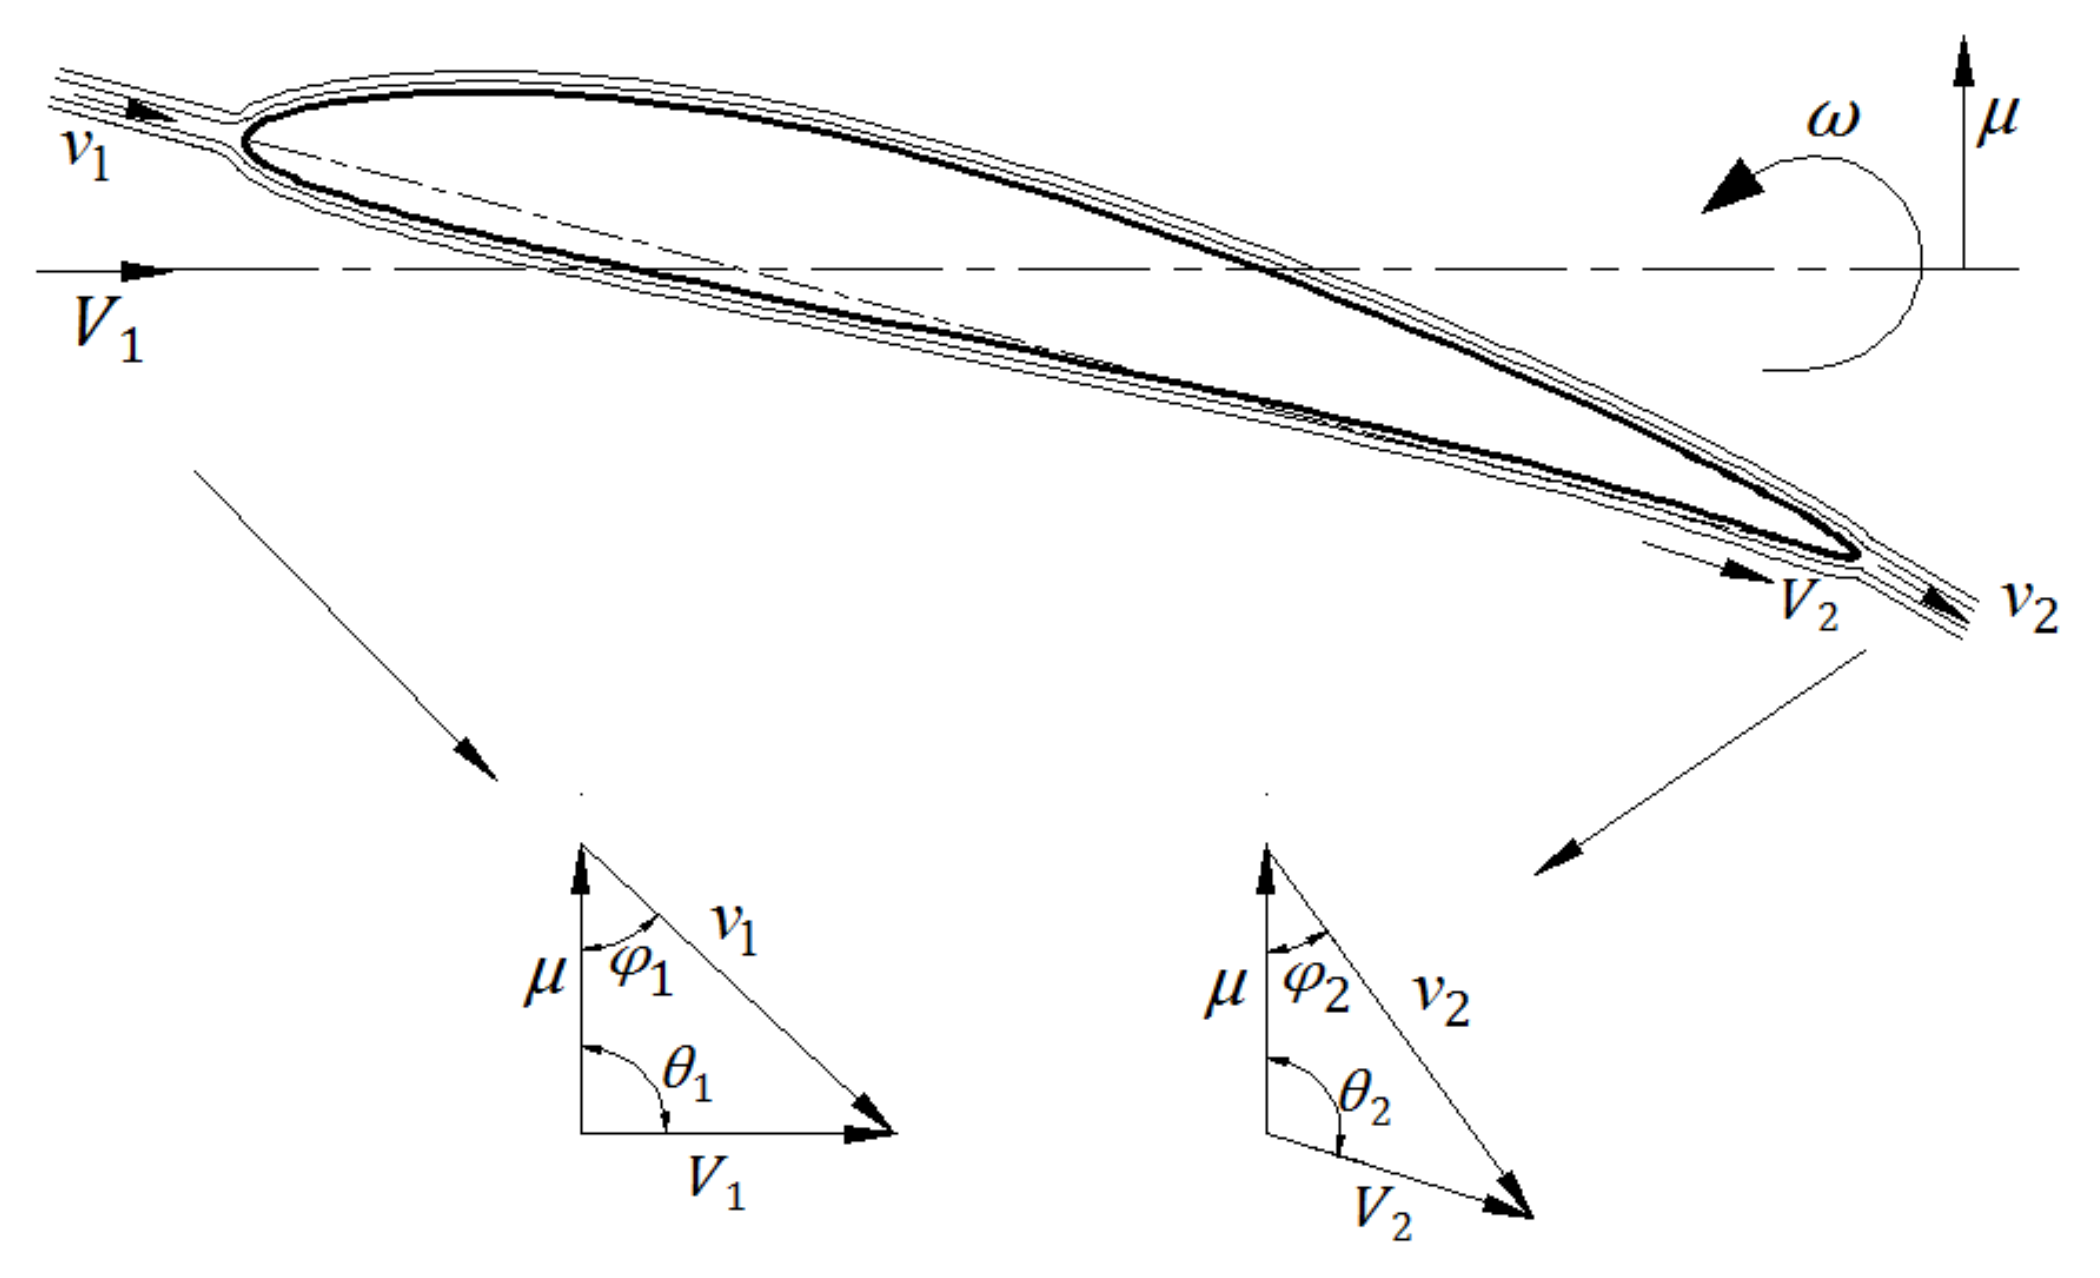
3.1. Velocity Analysis at the Inlet and Outlet of the Turbine Blade

The blade is subdivided into a number of microelements in the radial direction, and each microelement is called a blade element. For an ideal fluid, the water-flow velocity and the rotation velocity of the turbine are comprehensively considered, so we drew a velocity diagram at the inlet and outlet, as shown in Figure 6. Suppose the water flow velocity at the inlet is V 1 , the blade element rotation linear velocity is μ = ω r , ω is the rotational angular velocity, r is the equivalent radius corresponding to the blade element, the relative blade velocity of the water flow is ν 1 , the angle between the flow velocity and the tangential velocity is θ 1 , the jet angle is φ 1 , the water-flow velocity at the outlet is V2, the relative blade velocity of the water flow is ν 2 , the angle between the water flow velocity and the tangential velocity is θ 2 , and the jet angle is φ 2 . The direction of the water-flow velocity V 1 at the inlet is consistent with the axial direction, so θ 1 = 90 ° , regardless of the friction between the water flow and the turbine, and the axial induction coefficient f and the radial induction coefficient e are introduced:
μ = V 1 1 f tan φ
ν 2 = ν 1 = V 1 1 f sin φ

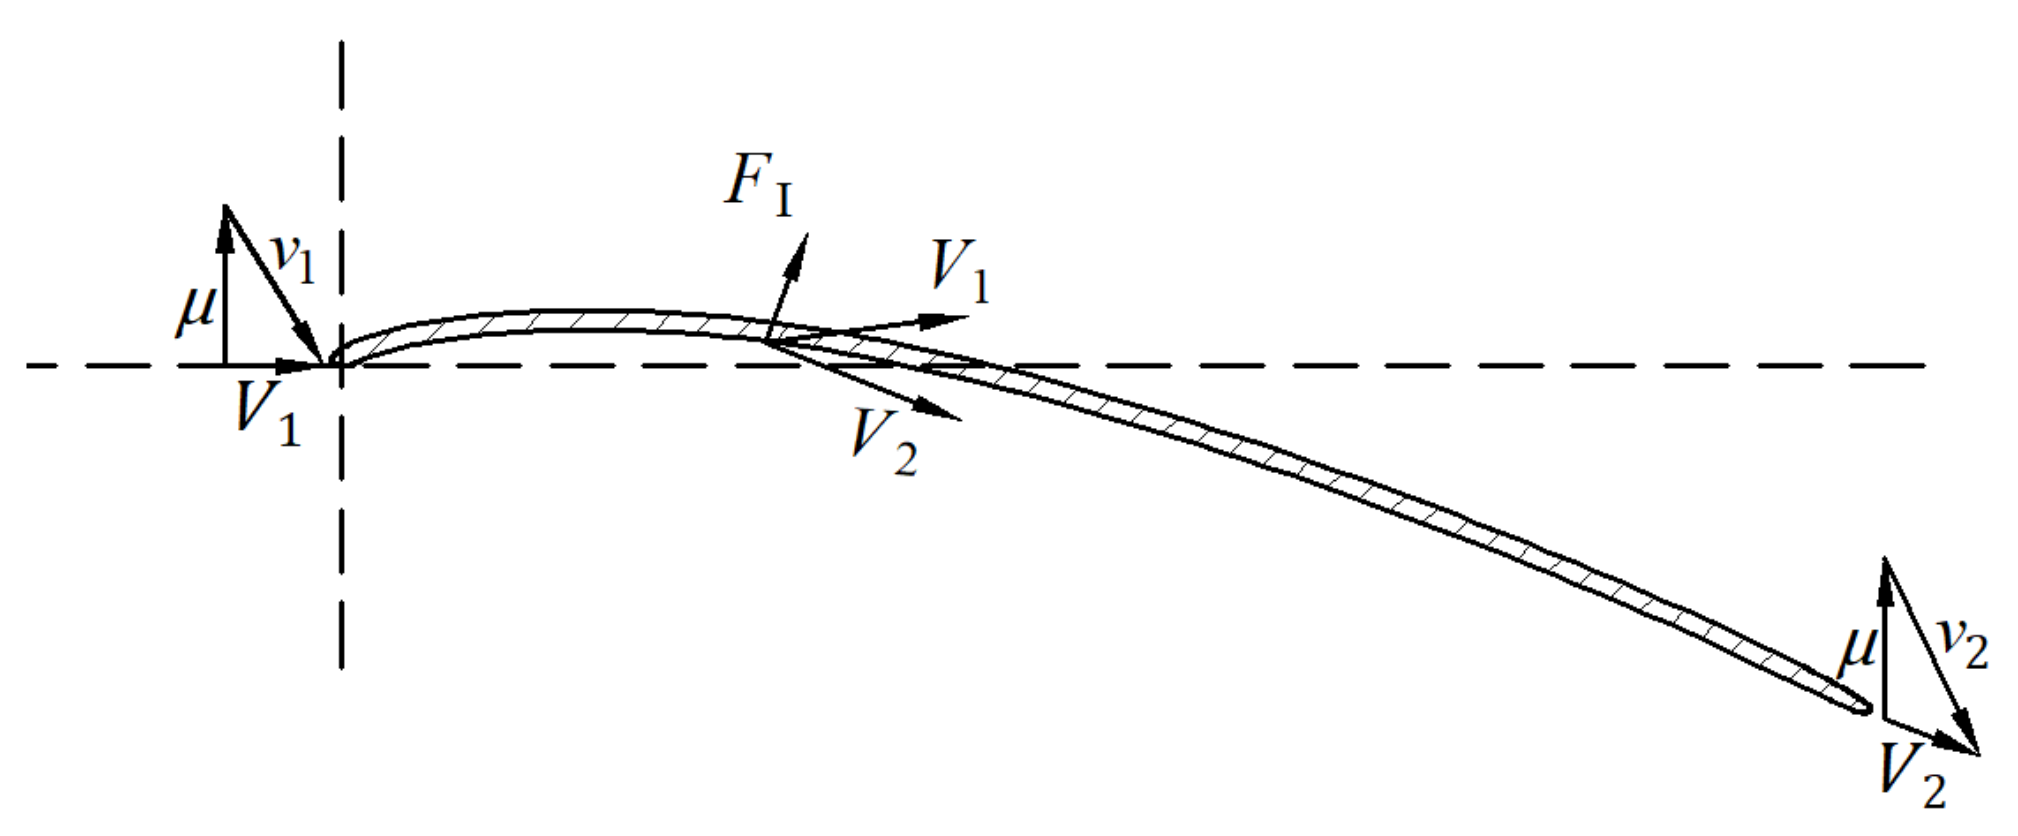
3.2. Blade-Shape Parameters of Lift–Drag-Composite Thin-Plate Arc Blade

This study optimized the lift-type turbine blades to increase the effect of impact resistance. Impact resistance is occurs when the blade hinders the movement of the water flow and is subjected to the impact force of the water flow. The torque acting on the blade can be simplified as the resultant moment of the water flow at the inlet and outlet. For an ideal fluid, the torque of a single blade element subjected to the impact resistance of the water flow can be calculated according to the momentum theory, which can be expressed as:
d T I = ρ Q V 1 V 2 d r
where d T I is the torque generated by the impact resistance, V 1 is the incoming flow-velocity vector, V 2 is the outlet-velocity vector, ρ is the water density, Q is the rotating surface flow of the turbine, and d r is the radial microelement corresponding to the blade element. It can be seen from Equation (3) that by increasing the curvature of the blade, the change of the water flow speed is increased, thereby improving the effect of the impact resistance on the torque. On the basis of the traditional lift-type NACA airfoil, the thickness of the underside of the blade is reduced, and the curvature of the underside of the blade is increased. The optimized blade is similar to the thin-plate arc shown in Figure 7. The upper surface captures the differential pressure lift, and the lower surface captures the water impact resistance more effectively. It is called a lift–drag-composite thin-plate arc blade. For the key parameters, a is the chord length, b is the arc height, and X a is the position of the chord direction.

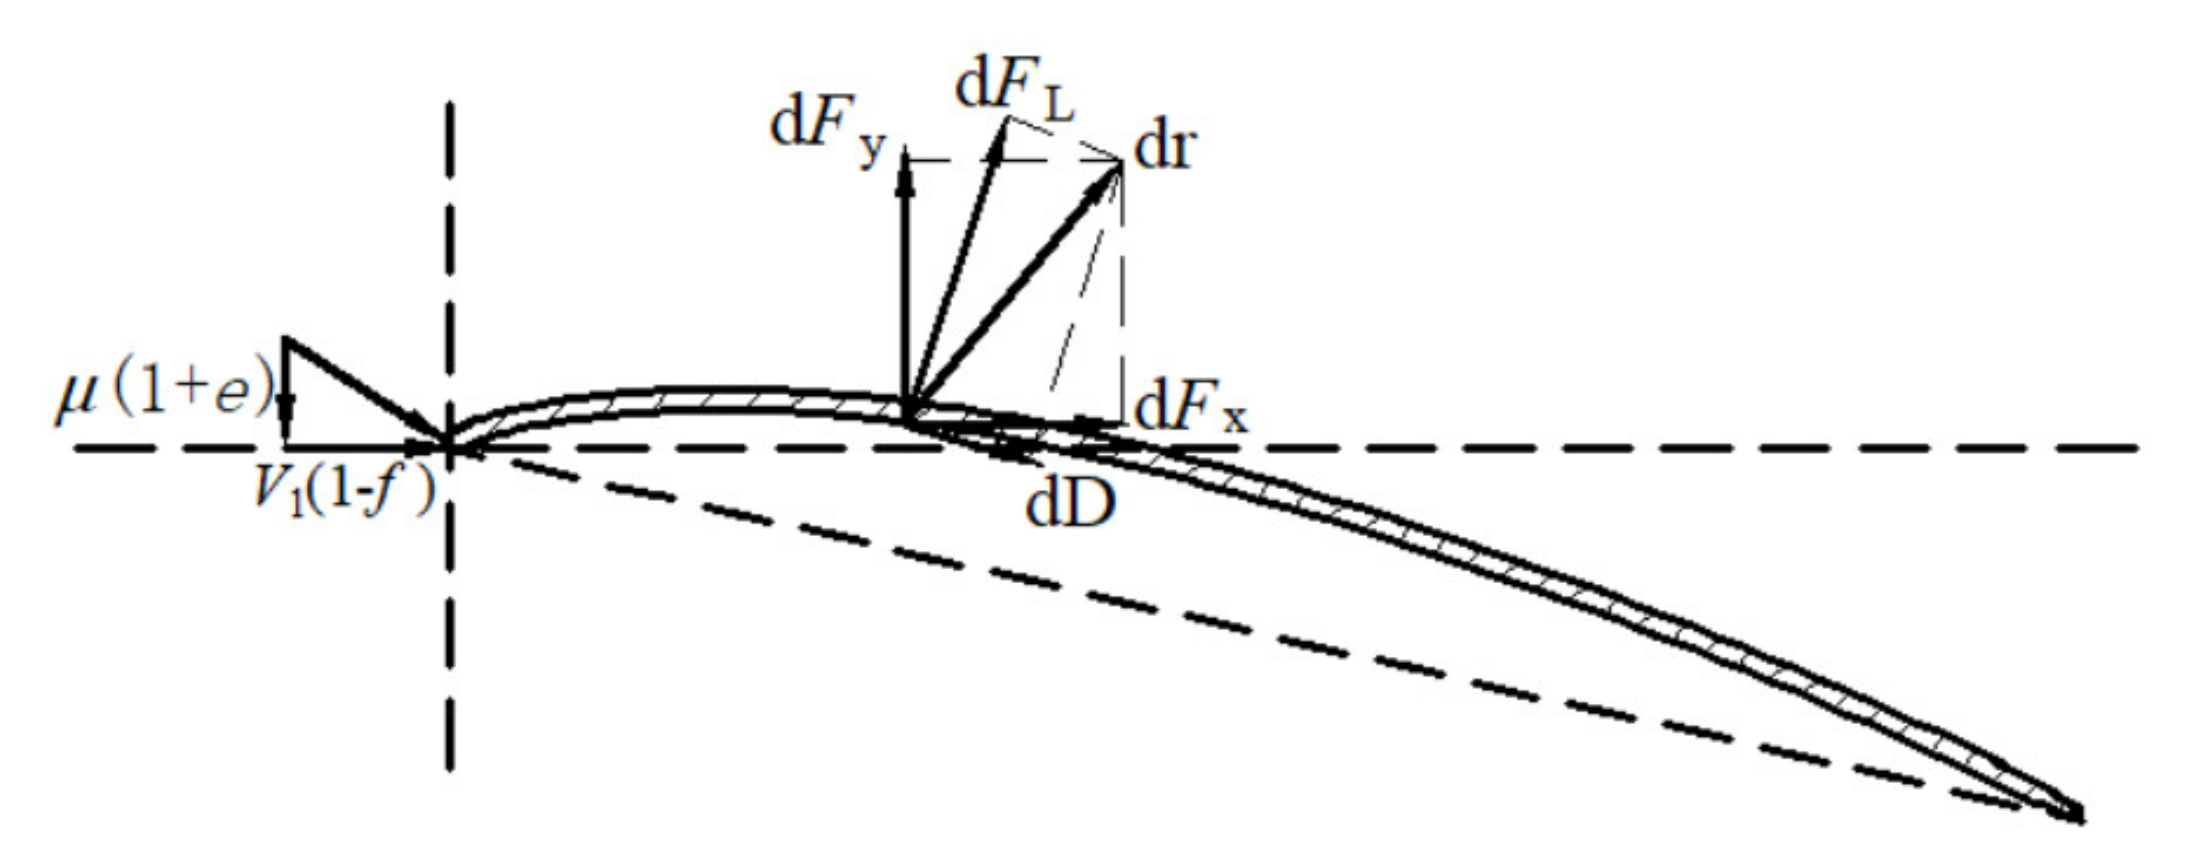
3.3. Hydrodynamic Modeling of Lift–Drag-Composite Thin-Plate Arc Blade

(1)
Impact resistance
The velocity analysis at the inlet and outlet of the thin-plate arc blade is similar to that of a lift-type turbine, as shown in Figure 8.
The torque is the same as Equation (3), and the axial force is:
d F I = ρ B a u 2 1 f 2 1 e cos φ d r
where B is the number of blades and φ is the jet angle;
tan φ = V 1 1 f ω r 1 + e = 1 f λ 1 + e
where λ is the tip speed ratio at any radius, λ = ω r V 1 , and the simplified torque is:
d T I = ρ B a r u 2 1 f 2 e sin φ d r
(2)
Differential pressure lift
Assuming that the blade elements do not interfere with each other, the analysis of the differential pressure lift of a single blade element is shown in Figure 9, calculated according to Bernoulli’s principle.
The tangential lift d F x can be expressed as:
d F x = 1 2 ρ B a u 2 C x d r
The axial lift d F y can be expressed as:
d F y = 1 2 ρ B a u 2 C y d r
The torque d T l of the differential pressure lift can be calculated as:
d T l = 1 2 ρ B a u 2 C x r d r
The coefficient of lift and drag in the x and y directions is:
C x = C l s i n φ C d c o s φ C y = C l c o s φ + C d s i n φ
where B is the number of blades; a is the chord length; u is the combined speed; C x and C y are the lift and drag coefficients in the x and y directions, respectively; and C l and C d are the lift and drag coefficients, respectively.
(3)
Balance equation
The balance equation considers that the differential pressure lift and the impact resistance are coupled to the blades of the hydraulic turbine. There is energy loss in the impact resistance of the water flow. The impact-energy-capture coefficient k is introduced, and the balance equation of the total torque d T is:
d T = k · d T i + 1 k d T l
According to the blade element momentum (BEM) theory, the total torque expression is:
d T = m r 2 ω = 4 π ρ r 3 V 1 ω 1 f e d r
Combining (11) and (12), we can get:
e 1 + e = k ρ B a r sin φ 1 + 1 k B a C x sin φ 2 4 π r
The axial force balance equation is:
d F = k · d F i + 1 k d F l
According to BEM theory, we can get:
d F = m V 1 V 2 = 4 π ρ r V 1 3 1 f f d r
Combining (14) and (15), we can get:
f 1 f = k ρ B a 1 cos φ + 1 k B a C y cos 2 φ 2 4 π r
Combining (13) and (16), the general balance equation can be obtained:
1 k F 1 f sin φ 1 f + 1 4 k F 2 tan φ = 1 k cos φ e 1 + e 1 3 k 1 cos φ
This introduces the impact-energy-capturing coefficient to reflect the proportion of the impact force under the combined force and creates conditions for the establishment of the overall balance equation. The equilibrium equation is taken as the constraint condition, the induction coefficients f and e are taken as the target parameters, and an iterative calculation is used to obtain the target parameter value when the energy harvesting power is maximum, which provides the basis for the design of the shape parameters of the water turbine.

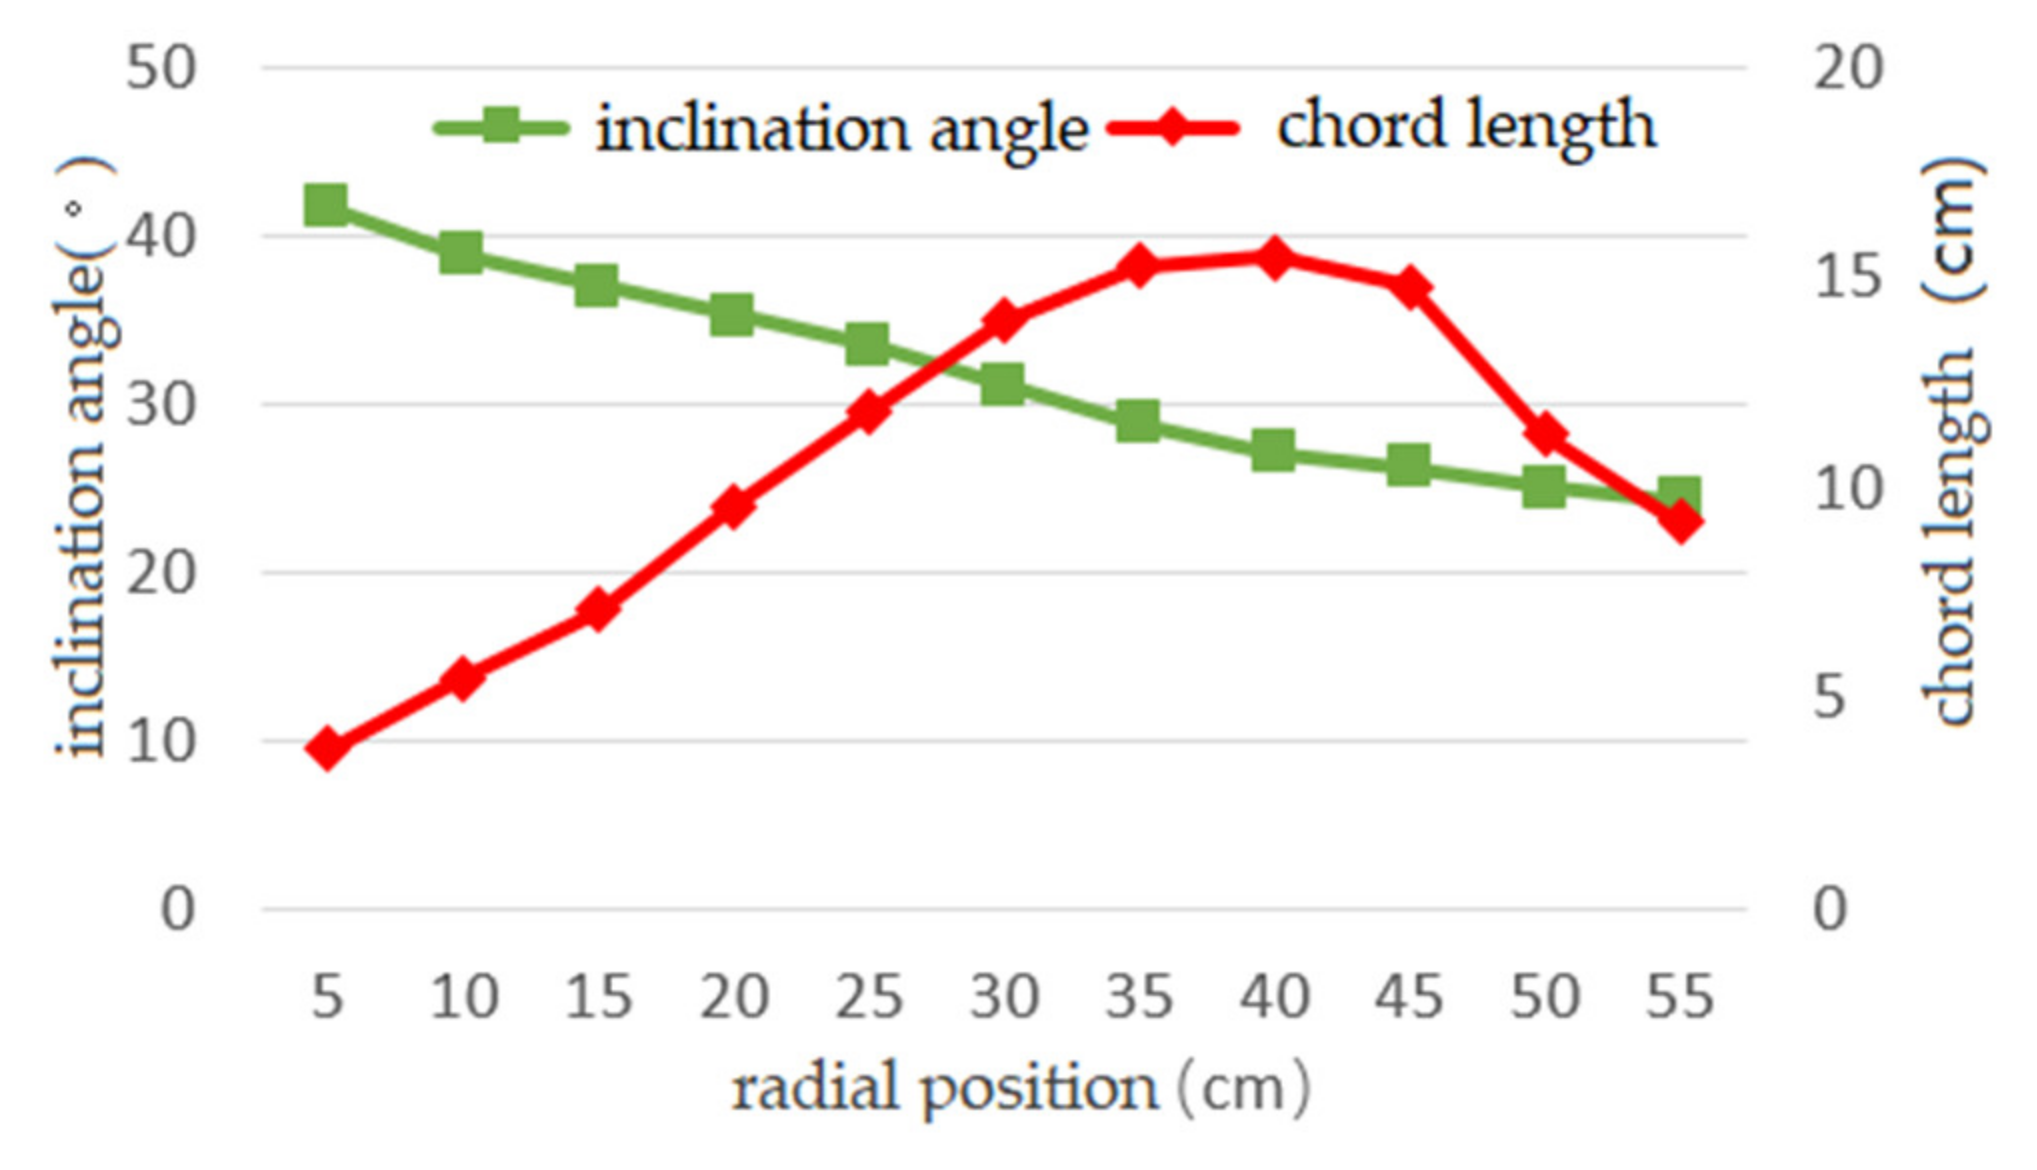
3.4. Calculation of Blade-Shape Parameters of Hydraulic Turbine Blades

The turbine-blade parameters were calculated based on actual sea conditions. The Xiangshan sea area in Ningbo, East China Sea was taken as the experimental sea area. The flow-velocity data of the studied sea area was collected for a long time through the flow meter, which measured the data every 10 min; that is, the flow-velocity data was equivalent to the flow velocity for 10 min, and the tidal current flow velocity data represented the characteristics of the sea area’s flow velocity, as shown in Figure 10.
The curve equation of the flow velocity was fitted:
V t = V m 1 + K s i n 2 π T 0 t 0 s i n 2 π T t
In the formula, V m is the maximum flow velocity, which is 1.5 m/s; T is the tidal current period, and according to the measured data, the tidal cycle was 11.67 h; K is the approximation coefficient, which was 0.21; the average flow velocity was between 0.8~1 m/s; and the design flow velocity was 0.9 m/s. According to the national standard GB/T13981-1992, the number of blades was selected as 6, and the basic design parameters of the hydraulic turbine are shown in Table 1.
We substituted (17) to simplify the balance equation as:
1 f 1.11 f 0.11 = λ 2 1 + e 0.96 f 0.04
The energy-capture coefficient C p of a water turbine is the most important performance index:
C p = 8 λ 0 2 0 λ 0 e 1 f λ 3 d λ
In the formula, λ 0 is the tip speed ratio, and λ is the tip speed ratio at the corresponding radius of the blade element. In order to get the maximum C p , each blade element d C p = d λ is required to have the largest value. Using Matlab mathematical tools and (19) to substitute the tip-speed ratios at different radii, we obtained the induction coefficient f, e of 11 blade elements, as shown in Table 2.
We substituted the table data into Equations (4) and (16) to obtain the inclination angle and chord length, and drew the curve, as shown in Figure 11.
In order to verify the energy-capture performance of the lift–drag-composite thin-plate arc turbine blade under low flow velocity and small radius, experimental comparative studies of different airfoil blades were carried out. Under the same conditions, this paper took NACA6412 lift-type blades as the design object and adopted the Glauert design method [18]. An iterative calculation based on the BEM balance equation e 1 + f λ 2 = f 1 f was used to calculate the inclination angle and chord length of each element of the NACA airfoil blade and draw the curve, as shown in Figure 12.
According to the parameters of inclination angle and chord length of each section, the physical models of the thin-plate arc turbine and NACA airfoil turbine were trial-produced, as shown in Figure 13.

4. Experimental Verification

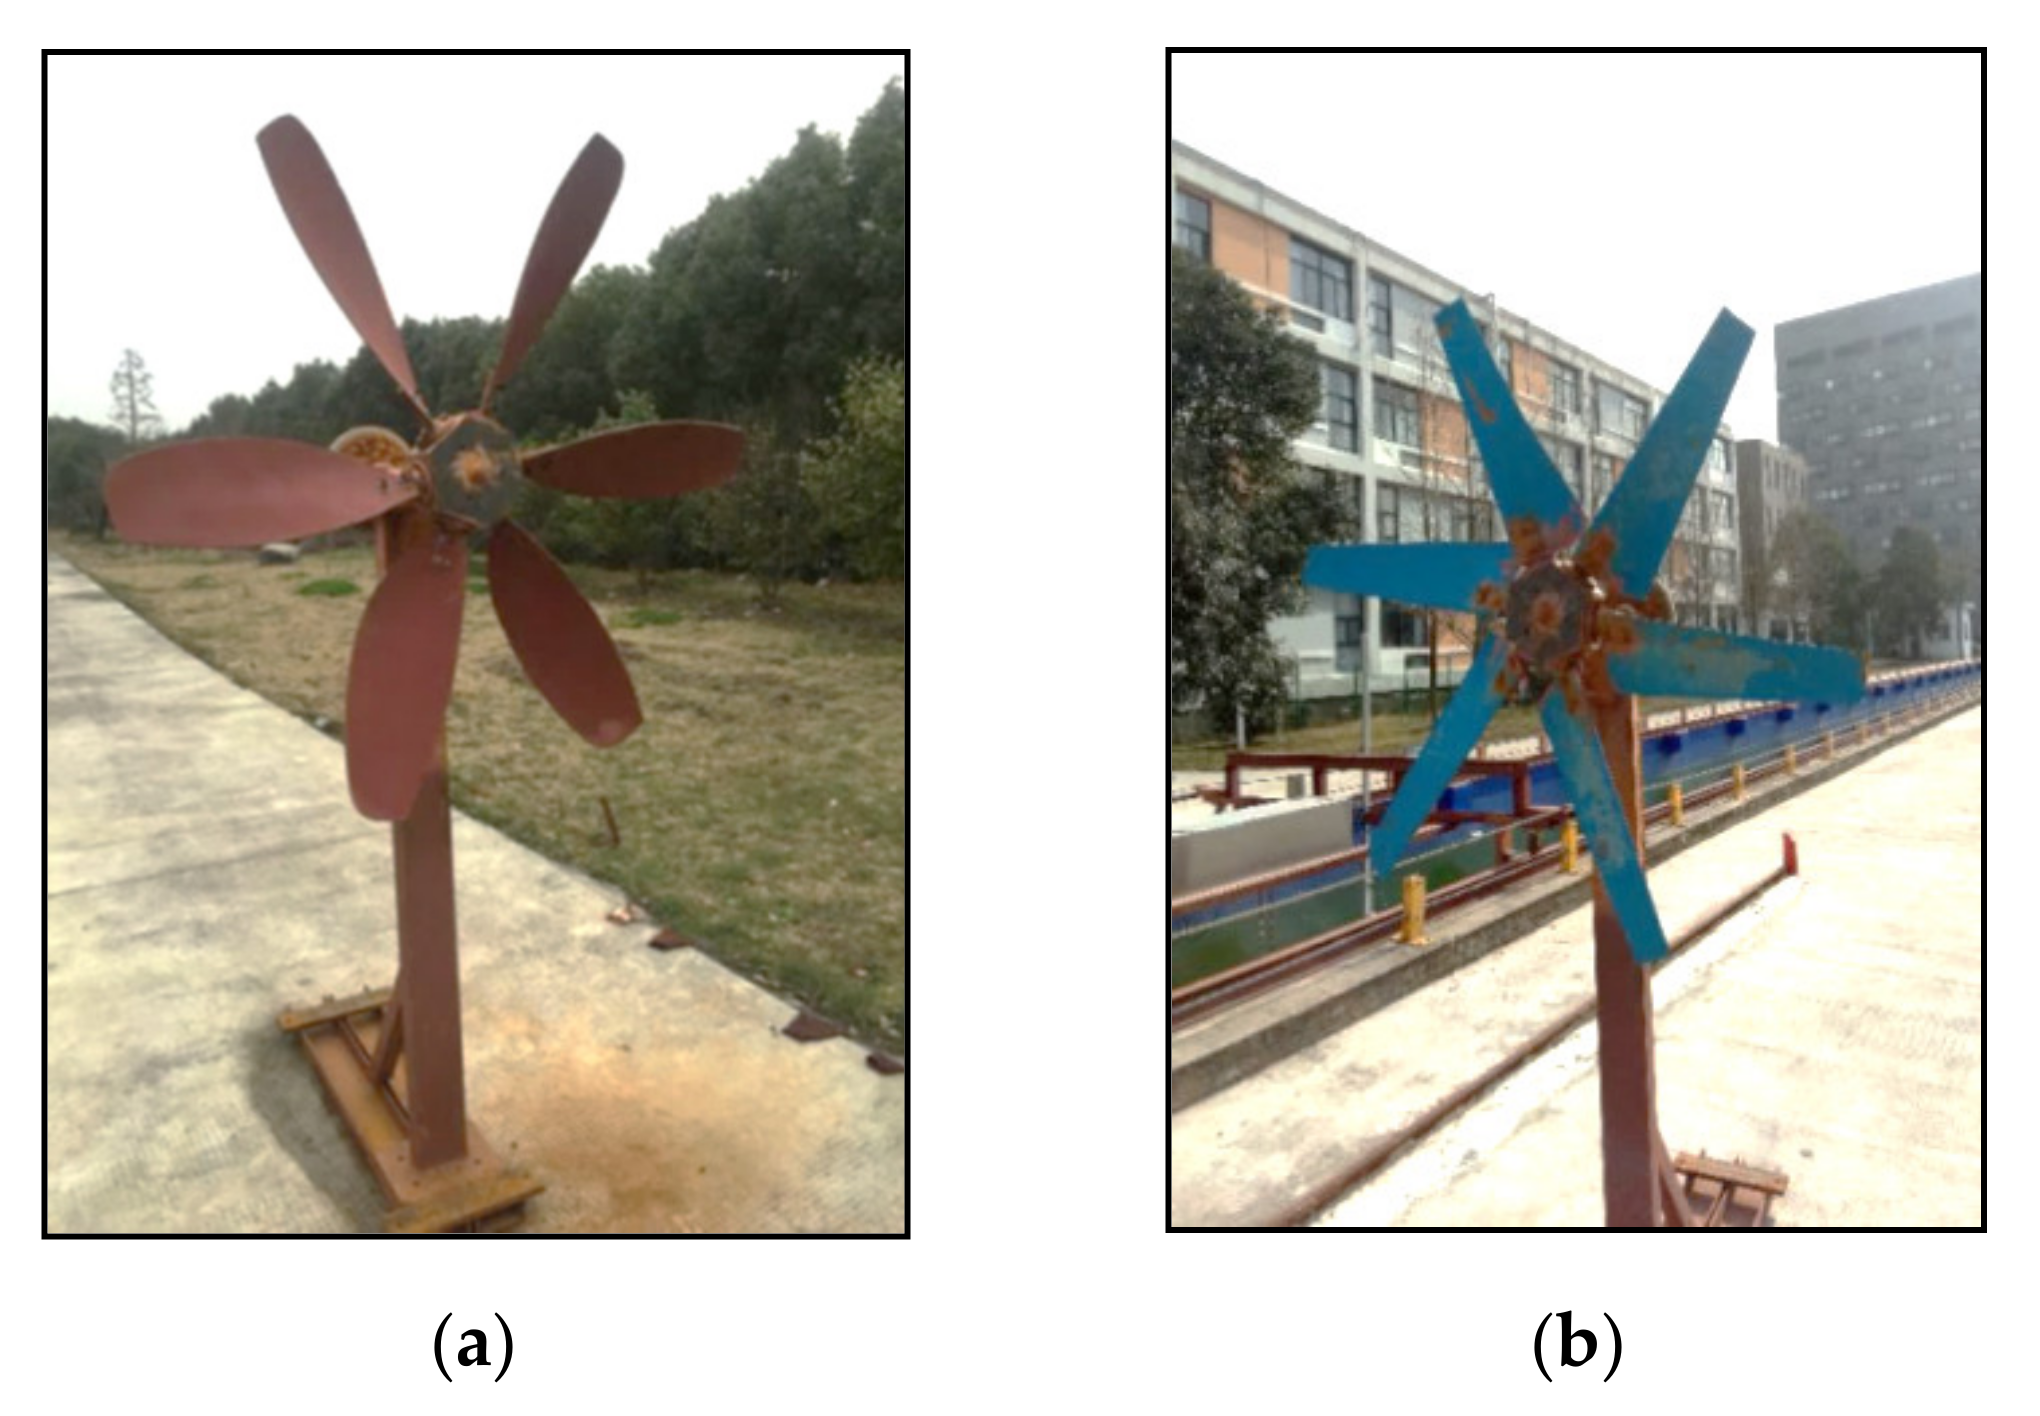
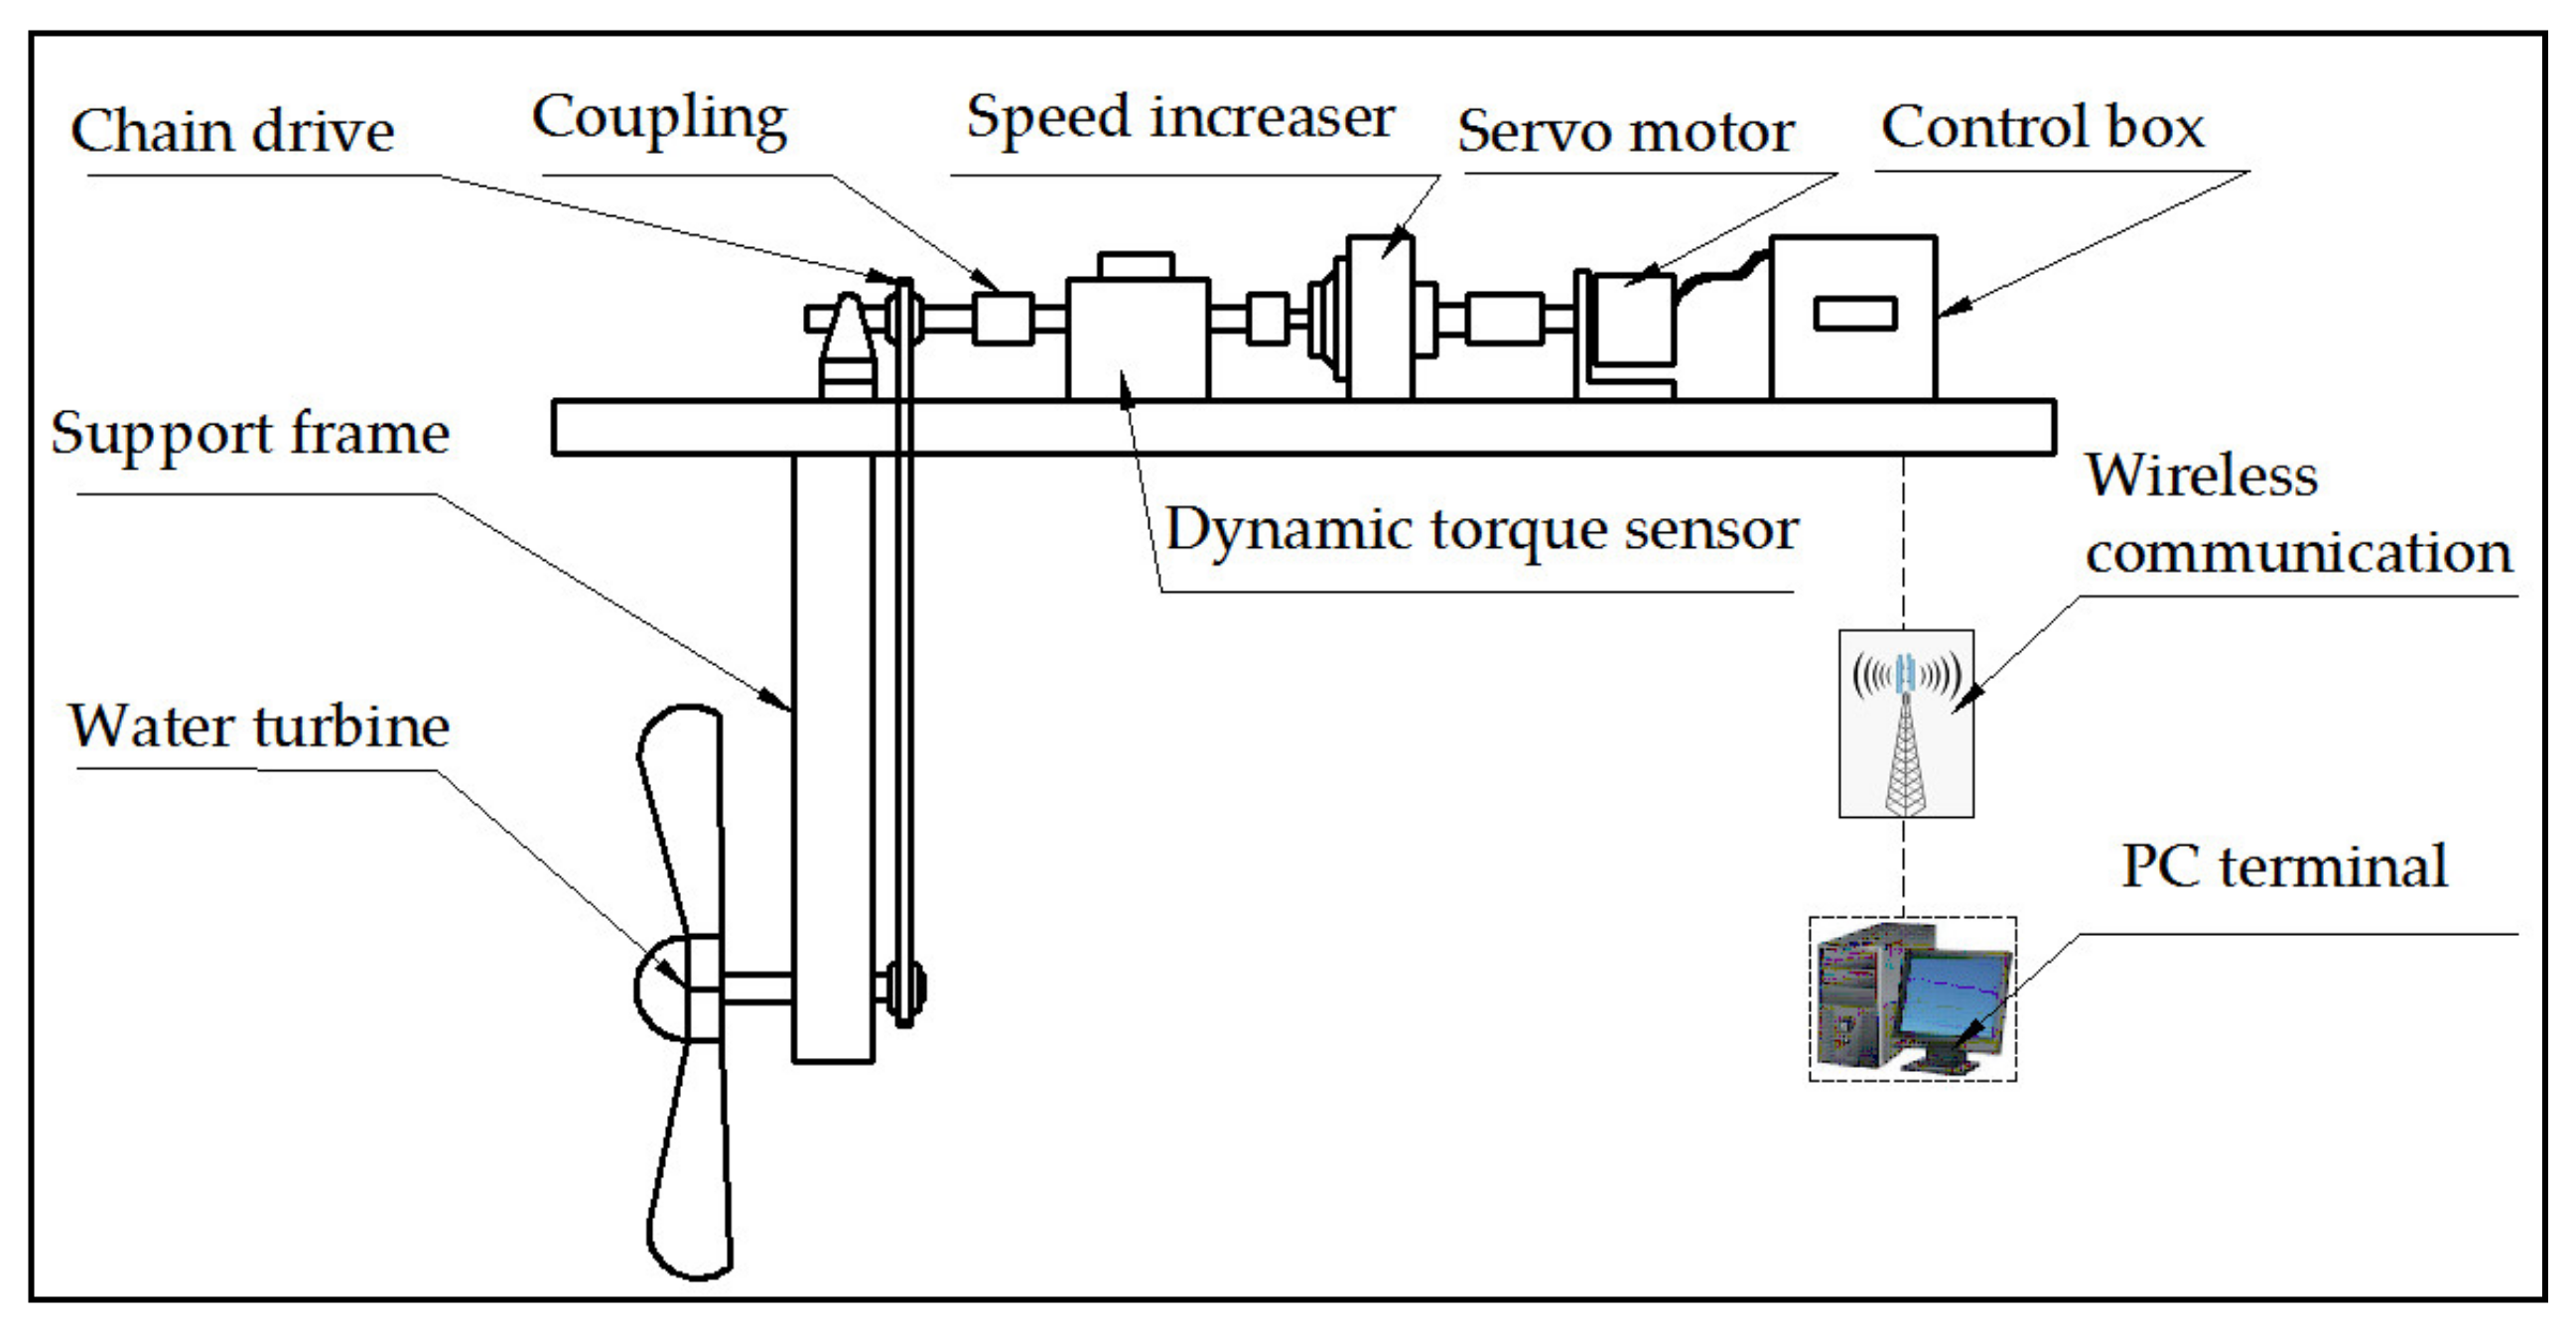
4.1. Construction of Experimental Device

The schematic diagram of the hydraulic turbine experimental device is shown in Figure 14. The underwater turbine was fixed by the bracket, and the energy captured by the turbine was transferred to the water surface through the chain. The chain transmission ratio was 1:1; the torque and speed were monitored by the dynamic torque sensor. The power captured by the turbine was calculated from the measured torque and speed; this device used a servo motor instead of a generator, so that the load box could be discarded, and the constant torque damping control could be directly realized by the servo motor. To ensure that the rated torque of the servo motor was greater than the maximum output torque of the hydraulic turbine, a speed increaser was installed in the front section of the servo motor, and the transmission ratio was 1:40; finally, the control box collected data and controlled the servo motor, and established the communication between the PC and the experimental device wirelessly, which was convenient for the observation and control by the experimental personnel. The physical image of the experimental device is shown in Figure 15.

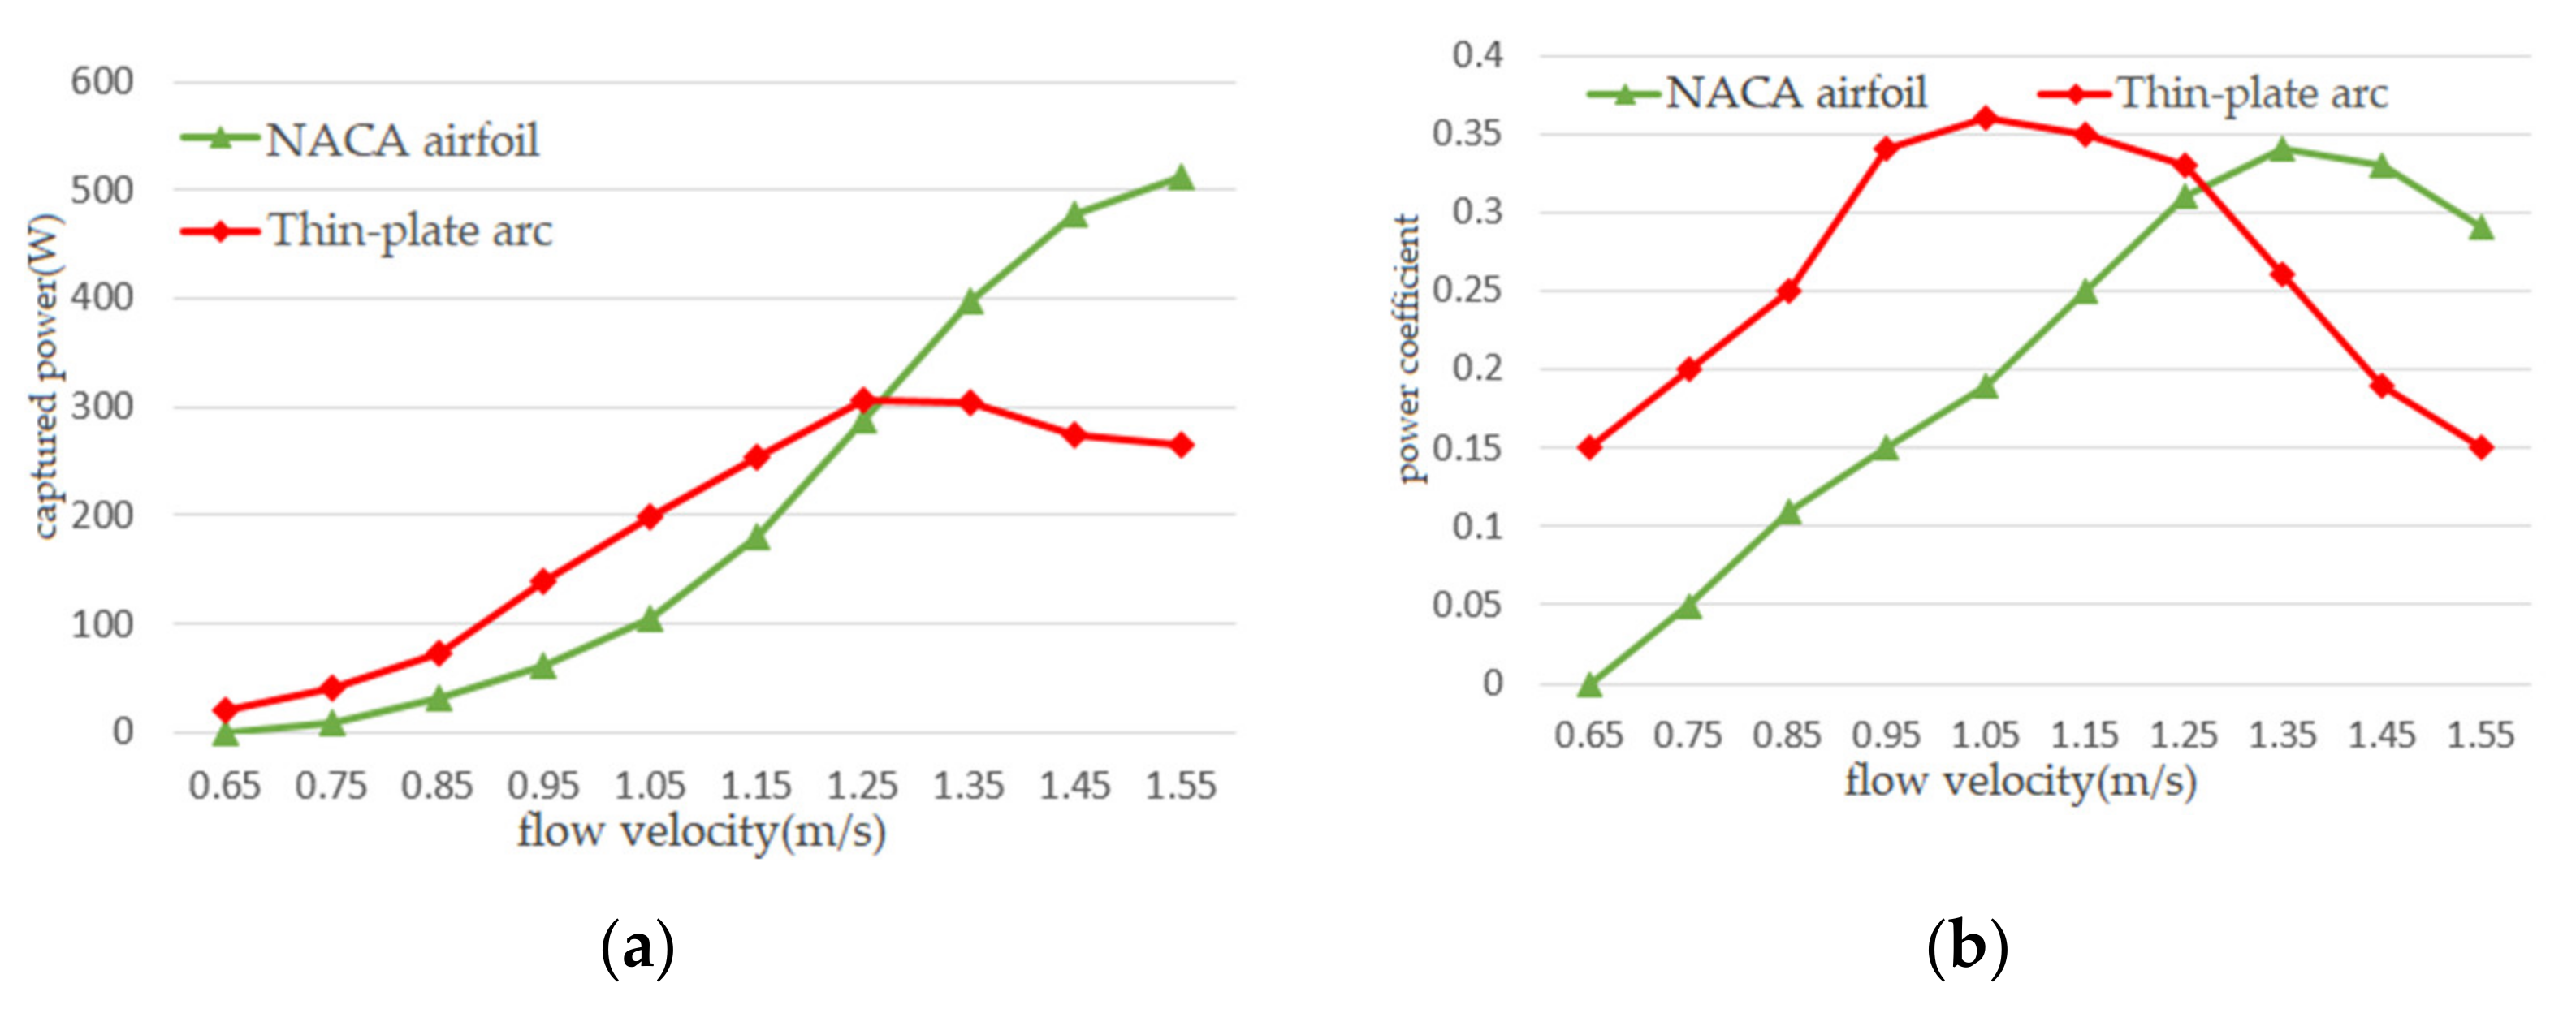
4.2. Analysis of Experimental Data

The experimental pool was 70 m in length, 40 m in width, and 2 m in depth. The hydraulic turbine experimental device was installed on a drag trolley above the experimental pool. By dragging the trolley to drive the water turbine to move, this created a relative flow velocity to simulate water flow. In every experiment, the drag trolley had a process of acceleration, speed maintenance, and deceleration. For the accuracy of the experimental data, each experiment took the data of the drag trolley in the speed-maintaining stage; that is, the data in the 10th to 40th second of its operation. Ten data points could be collected per second, and 300 groups of torque and speed data could be collected each time to calculate the average of the data and the average power and power coefficient. The servo motor was adjusted to change the torque, and different torque experiments were carried out at the same flow rate to obtain the maximum captured power and power coefficient; the same comparative experiment was carried out at different flow rates to obtain the maximum capture power and power coefficient at each flow rate, as shown in Figure 15.
From Figure 16a, it can be seen that the capture power of the two types of hydraulic turbines generally showed an increasing trend with the increase of the flow velocity. The thin-plate arc had the most obvious trend of capturing power increase at around 1.05 m/s, while the NACA airfoil had the most obvious trend of capturing power increase at around 1.25 m/s. Combined with Figure 16b, the reason for the above phenomenon was that the two blades obtained the optimum power coefficient near 1.05 m/s and 1.25 m/s. From Figure 15, when the flow velocity was less than 1.25 m/s, the capture power and power coefficient of the thin-plate arc was significantly better than the NACA airfoil, and it can be seen that the lift–drag-composite turbine was more suitable for the lower flow velocity of the sea, and the lift-type turbine was more suitable for the higher flow velocity of the sea.

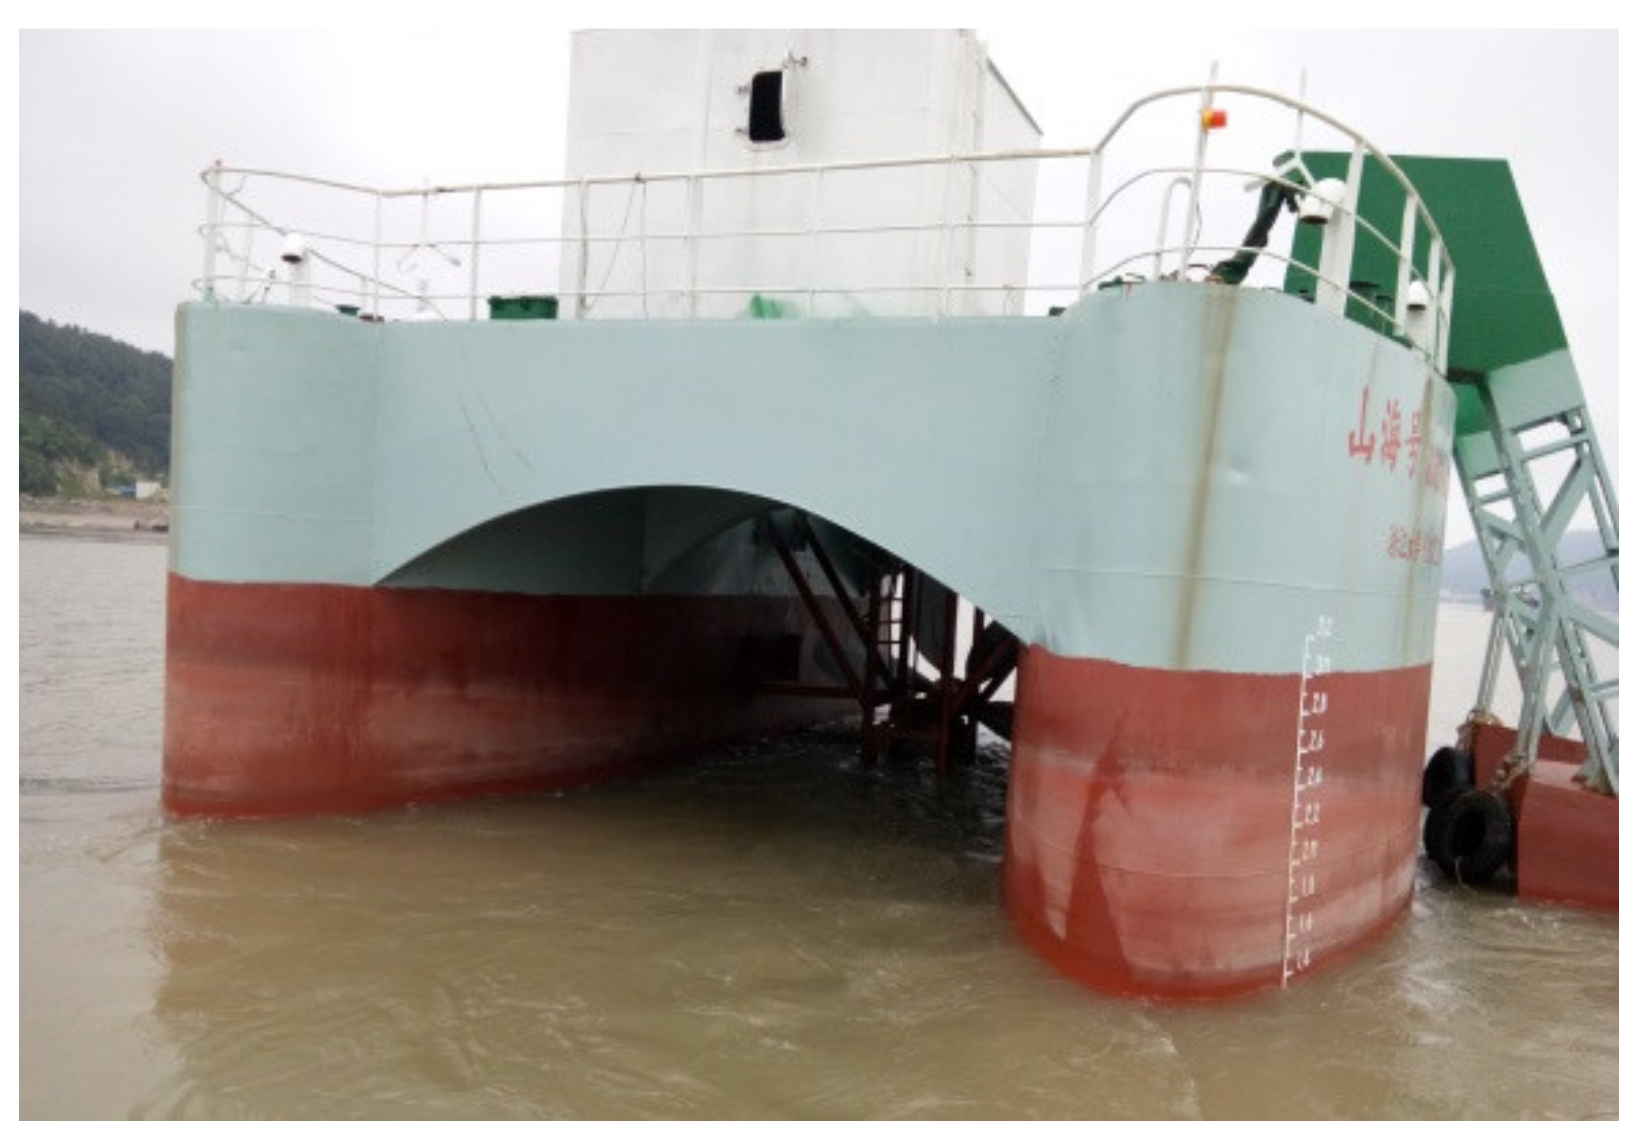
5. Marine Experimental Research

Figure 17 shows the designed and manufactured catamaran offshore experimental platform. The experimental platform had a total length of 14 m, a width of 11 m, and a height of 6 m. The two sides of the hull provided the buoyancy force of the platform. The hydraulic turbine was installed between the two sides of the hull. During the experiment, in order to facilitate the replacement of blades and the adjustment of the blades’ installation angle, the height of the hull on both sides was increased, and a ballast tank also was arranged, and the draught of the platform was adjusted by changing the water-carrying capacity of the ballast tank.
The radius of the hydraulic turbine designed for the sea trial was 1.8 m, as shown in Figure 18, and the parameters are shown in Table 3. The principle of the sea-trial test device was similar to that of the pool experimental test device. The captured energy was transferred upward to the test shaft through the chain drive, the torque and rotational speed were monitored through the dynamic torque sensor, the output speed was increased through the speed increaser, and finally the permanent magnet generator was driven to work. The generator converted mechanical energy into electrical energy to drive the load to work. During the experiment, the torque and rotational speed were indirectly adjusted by dynamically adjusting the connected load to obtain the best captured power. In order to avoid the influence of the conversion efficiency of the generator, the captured power in the sea trial was not equal to the generator power, but was determined by the torque and rotational speed measured by the sensor.
In the process of the sea trial, with the increase of tidal flow velocity, the turbine began to rotate after breaking through the starting torque. After the turbine rotated, the measurement and control system intervened and adjusted the load according to the gradient to obtain the maximum captured power at the current flow rate. The measurement and control system recorded the flow velocity and the corresponding maximum captured power every 10 min. The complete tidal cycle experimental data are shown in Figure 19. It can be seen that during high tide, the flow velocity was basically less than 1.25 m/s, and the capture power of the thin-plate arc turbine was greater than that of the NACA airfoil turbine; during low tide, there was a short period of time when the flow velocity was greater than 1.25 m/s. During this period, the capture power of NACA airfoil turbines was greater than that of thin-plate arc turbines, but this period of time was extremely short. Through statistical calculations, in a tidal cycle, the average power of the thin-plate arc turbine was 1200.96 W, and the average power of the NACA airfoil turbine was 1121.44 W. It can be seen that the comprehensive energy capture efficiency of the thin-plate arc turbine was better in this sea area, which also verified the results of the tank experiment.

6. Conclusions

Aiming at the technical problem of tidal energy capture under the condition of low flow velocity and small radius, the hydrodynamic analysis of differential pressure lift and impact resistance of hydraulic turbine blades was carried out, and the design method of a lift–drag-composite thin-plate arc blade was proposed, which comprehensively considered the coupling effect of differential pressure lift and impact resistance. Based on the BEM theory and Bernoulli’s principle, the blade dynamics model was established, the shape parameters of the blade were solved, and the thin-plate arc and NACA airfoil turbine blades were constructed under the same conditions. We carried out water-tank and offshore experiments, and reached the following conclusions:
1.
Through the hydrodynamic analysis of the turbine blade, the water flow around the airfoil formed a pressure difference and impact, which acted on the blade together; that is, the torque and axial force acted on the blade. Under the condition of low flow velocity and small radius, the impact resistance of the blade cannot be ignored.
2.
Through the water-tank experiment and the offshore experiment, the thin-plate arc turbine blades that comprehensively used differential pressure lift and impact resistance had better performance under conditions of low flow velocity and small radius, which verified the correctness of the design method of lift–drag-composite blades.
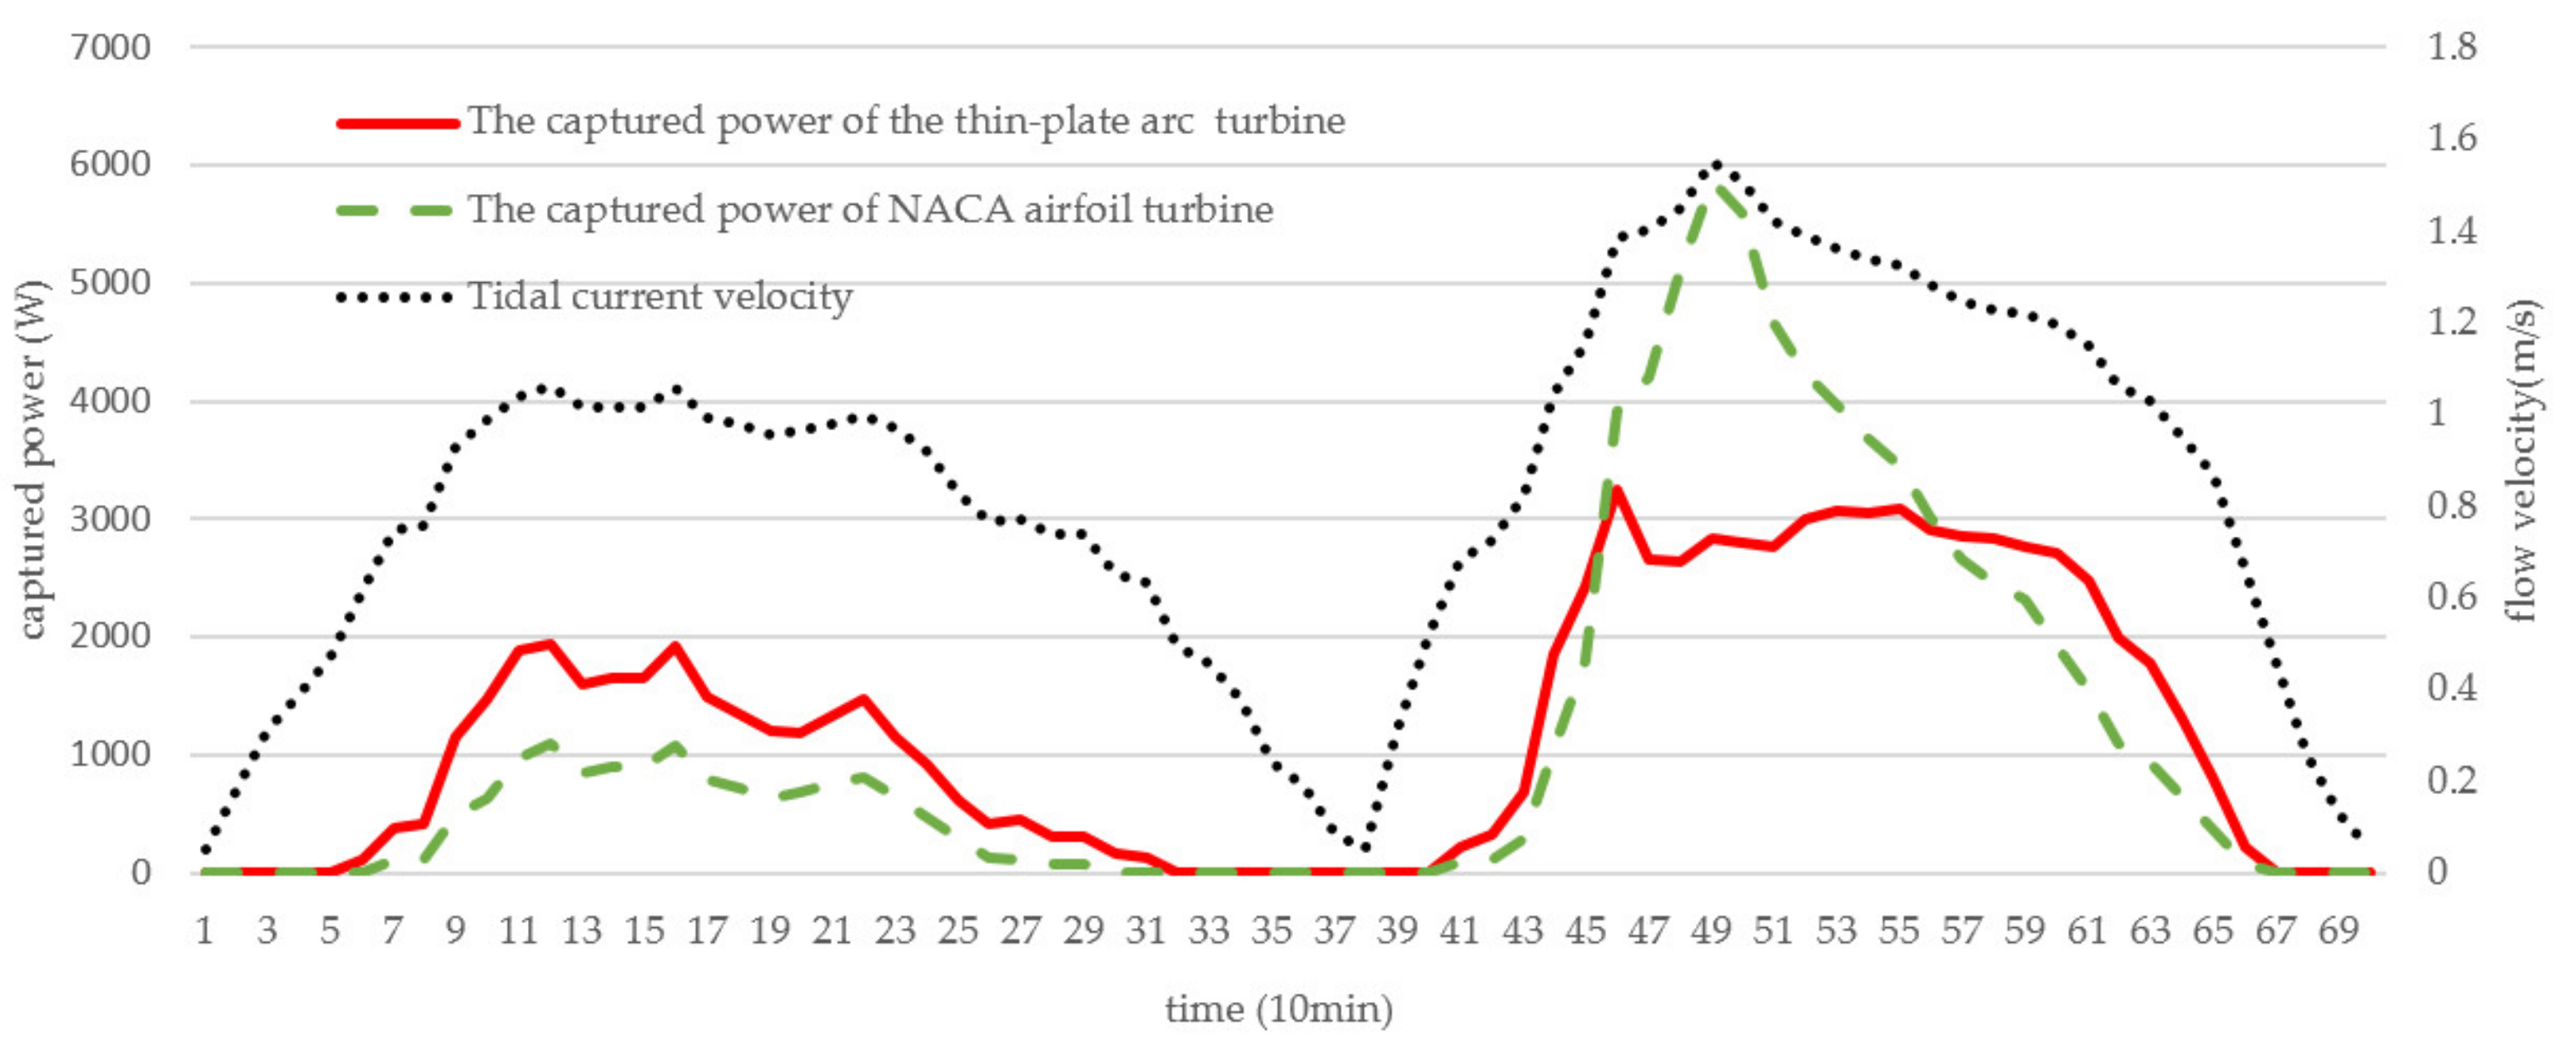
3.
In sea areas where the flow velocity was generally low, the flow velocity could be higher at certain moments, and the capture power of the lift-type blade was greater than that of the lift–drag-composite blade. However, when considering the variation period of tidal current velocity comprehensively and calculating the average power of cycle, the average capture power of the lift–drag-composite blade was larger, which was more suitable for the low-velocity sea area.
4.
The lift–drag hydraulic turbine was characterized by low speed and heavy load, while the lift-type turbine was characterized by high speed and light load.

Author Contributions

Conceptualization, X.S. and C.J.; methodology, C.J.; validation, C.J. and L.B.; formal analysis, C.J.; data curation, L.B. and Y.X.; writing—original draft preparation, C.J.; writing—review and editing, X.S.; visualization, C.J. and Y.X.; supervision, X.S.; project administration, J.C. and X.S.; funding acquisition, J.C. All authors have read and agreed to the published version of the manuscript.

Funding

This research was co-funded by two projects: the National Key R&D Project of the Ministry of Science and Technology of the People’s Republic of China, grant number 2020YFE0200100; and the Science and Technology Innovation 2025 Major Project of Ningbo, China, grant number 2020Z076.

Institutional Review Board Statement

Not applicable.

Informed Consent Statement

Not applicable.

Data Availability Statement

Not applicable.

Conflicts of Interest

The authors declare no conflict of interest.

References

  1. Liu, H.; Ma, S.; Li, W.; Hai, G. A review on the development of tidal current energy in China. Renew. Sustain. Energy Rev. 2011, 15, 1141–1146. [Google Scholar] [CrossRef]
  2. Wang, S.; Peng, Y.; Dong, L.; Jiao, Y. An overview of ocean renewable energy in China. Renew. Sustain. Energy Rev. 2011, 15, 91–111. [Google Scholar] [CrossRef]
  3. Deng, G.; Zhang, Z.; Li, Y.; Liu, H.; Pan, Y. Prospective of development of large-scale tidal current turbine array: An example numerical investigation of Zhejiang, China. Appl. Energy 2020, 264, 114621. [Google Scholar] [CrossRef]
  4. Fan, W.; Xiao, C.; Li, P.; Zhang, Z.; Lin, T.; Pan, Y.; Di, Y.; Chen, Y. Intelligent Control System of an Ecological Engineering Project for Carbon Sequestration in Coastal Mariculture Environments in China. Sustainability 2020, 12, 5227. [Google Scholar] [CrossRef]
  5. Li, D.; Li, C. Intelligent aquaculture. J. World Aquac. Soc. 2020, 51, 808–814. [Google Scholar] [CrossRef]
  6. Wei, Y.; Wei, Q.; An, D. Intelligent monitoring and control technologies of open sea cage culture: A review. Comput. Electron. Agric. 2020, 169, 105119. [Google Scholar] [CrossRef]
  7. Zhou, H.; Lin, Y.; Li, W.; Liu, H. Design and sea test of a marine current energy prototype pecialized for low current speed condtion. Acta Energ. Sol. Sin. 2019, 40, 2509–2514. [Google Scholar]
  8. Westwood, A. SeaGen installation moves forward. Renew. Energy Focus 2009, 9, 26–27. [Google Scholar] [CrossRef]
  9. Liu, H.; He, J.; Li, W.; Lin, Y.; Gu, Y.; Wang, C. Asymmetric Load Control Method for Individual Pitch of Horizontal Axis Marine Current Turbine. J. Mech. Eng. 2018, 54, 89–95. [Google Scholar] [CrossRef]
  10. Wang, B.; Zhang, Y.; Guo, Y.; Cai, Y. Analysis of influence of pitch mechanism performance on power limit for tidal energy device. Acta Energ. Sol. Sin. 2020, 41, 27–34. [Google Scholar]
  11. Greenwood, C.; Vogler, A.; Venugopal, V. On the Variation of Turbulence in a High-Velocity Tidal Channel. Energies 2019, 12, 672. [Google Scholar] [CrossRef] [Green Version]
  12. Sellar, B.; Wakelam, G.; Sutherland, D.; Ingram, D.; Venugopal, V. Characterisation of Tidal Flows at the European Marine Energy Centre in the Absence of Ocean Waves. Energies 2018, 11, 176. [Google Scholar] [CrossRef] [Green Version]
  13. Liu, Z.; Huguenard, K. Hydrodynamic Response of a Floating Aquaculture Farm in a Low Inflow Estuary. J. Geophys. Res. Ocean. 2020, 125. [Google Scholar] [CrossRef]
  14. Yao, J.; Li, F.; Chen, J.; Yuan, Z.; Mai, W. Parameter Analysis of Savonius Hydraulic Turbine Considering the Effect of Reducing Flow Velocity. Energies 2019, 13, 24. [Google Scholar] [CrossRef] [Green Version]
  15. Chen, J.; Wang, X.; Li, H.; Jiang, C.; Bao, L. Design of the Blade under Low Flow Velocity for Horizontal Axis Tidal Current Turbine. J. Mar. Sci. Eng. 2020, 8, 989. [Google Scholar] [CrossRef]
  16. Liu, H.; Gu, Y.; Lin, Y.; Li, Y.; Li, W.; Zhou, H. Improved Blade Design for Tidal Current Turbines. Energies 2020, 13, 2642. [Google Scholar] [CrossRef]
  17. Ma, Y.; Hu, C.; Zhou, B.; Li, L.; Ka, Y. Hydrodynamic Analysis of a Semi-submersible Wind-Tidal Combined Power Generation Device. J. Mar. Sci. Appl. 2019, 18, 72–81. [Google Scholar] [CrossRef] [Green Version]
  18. Vaz, J.; Pinho, J.; Mesquita, A. An extension of BEM method applied to horizontal-axis wind turbine design. Renew. Energy 2011, 36, 1734–1740. [Google Scholar] [CrossRef] [Green Version]
Figure 1. Schematic diagram of the driving force of the lift-type turbine.
Energies 14 04258 g001
Figure 2. Static analysis of the differential pressure lift.
Energies 14 04258 g002
Figure 3. Schematic diagram of driving force of the drag-type turbine.
Energies 14 04258 g003
Figure 4. Static analysis of the impact resistance.
Energies 14 04258 g004
Figure 5. Trend chart of the differential pressure lift and impact resistance with radius.
Energies 14 04258 g005
Figure 6. Velocity diagram at the inlet and outlet.
Energies 14 04258 g006aEnergies 14 04258 g006b
Figure 7. Thin-plate arc blade.
Energies 14 04258 g007
Figure 8. Impact-resistance model.
Energies 14 04258 g008
Figure 9. Differential pressure lift model.
Energies 14 04258 g009
Figure 10. A tidal current periodic velocity in the applied sea area.
Energies 14 04258 g010
Figure 11. Curves of inclination angle and chord length of lift–drag arc blades.
Energies 14 04258 g011
Figure 12. Curves of inclination angle and chord length of NACA airfoil blades.
Energies 14 04258 g012
Figure 13. Physical image of the hydraulic turbine models: (a) thin-plate arc; (b) NACA airfoil.
Energies 14 04258 g013
Figure 14. Schematic diagram of the hydraulic turbine experimental device.
Energies 14 04258 g014
Figure 15. Physical image of the hydraulic turbine experimental device.
Energies 14 04258 g015
Figure 16. Performance of turbine at different velocities: (a) captured power; (b) power coefficient.
Energies 14 04258 g016
Figure 17. Ocean-energy power-generation platform.
Energies 14 04258 g017
Figure 18. Thin-plate arc turbine blade.
Energies 14 04258 g018
Figure 19. Capture-power and flow-rate graphs of the tidal cycle.
Energies 14 04258 g019
Table 1. Basic design parameters of the hydraulic turbine.
ParameterNumericalParameterNumerical
Design flow velocity (m/s)0.9Hub diameter (m)0.1
Rated power (W)200Impact-capture coefficient0.5
Blade radius (m)0.55Number of blades6
Table 2. Calculation results for the induction coefficient of each section.
Section1234567891011
f0.2320.2510.2810.3050.3220.3450.3700.3820.3510.3640.323
e0.0710.0800.1030.1220.1310.1450.1250.1170.1340.1250.132
Table 3. Turbine parameters for sea trials.
ParameterNumericalParameterNumerical
Blade radius (m)1.8Hub diameter (m)0.37
Number of blades6Pitch angle (°)12°
Publisher’s Note: MDPI stays neutral with regard to jurisdictional claims in published maps and institutional affiliations.

