
Hydrodynamic Efficiency Analysis of a Flexible Hydrofoil Oscillating in a Moderate Reynolds Number Fluid Flow


Abstract
:1. Introduction
2. Problem Formulation
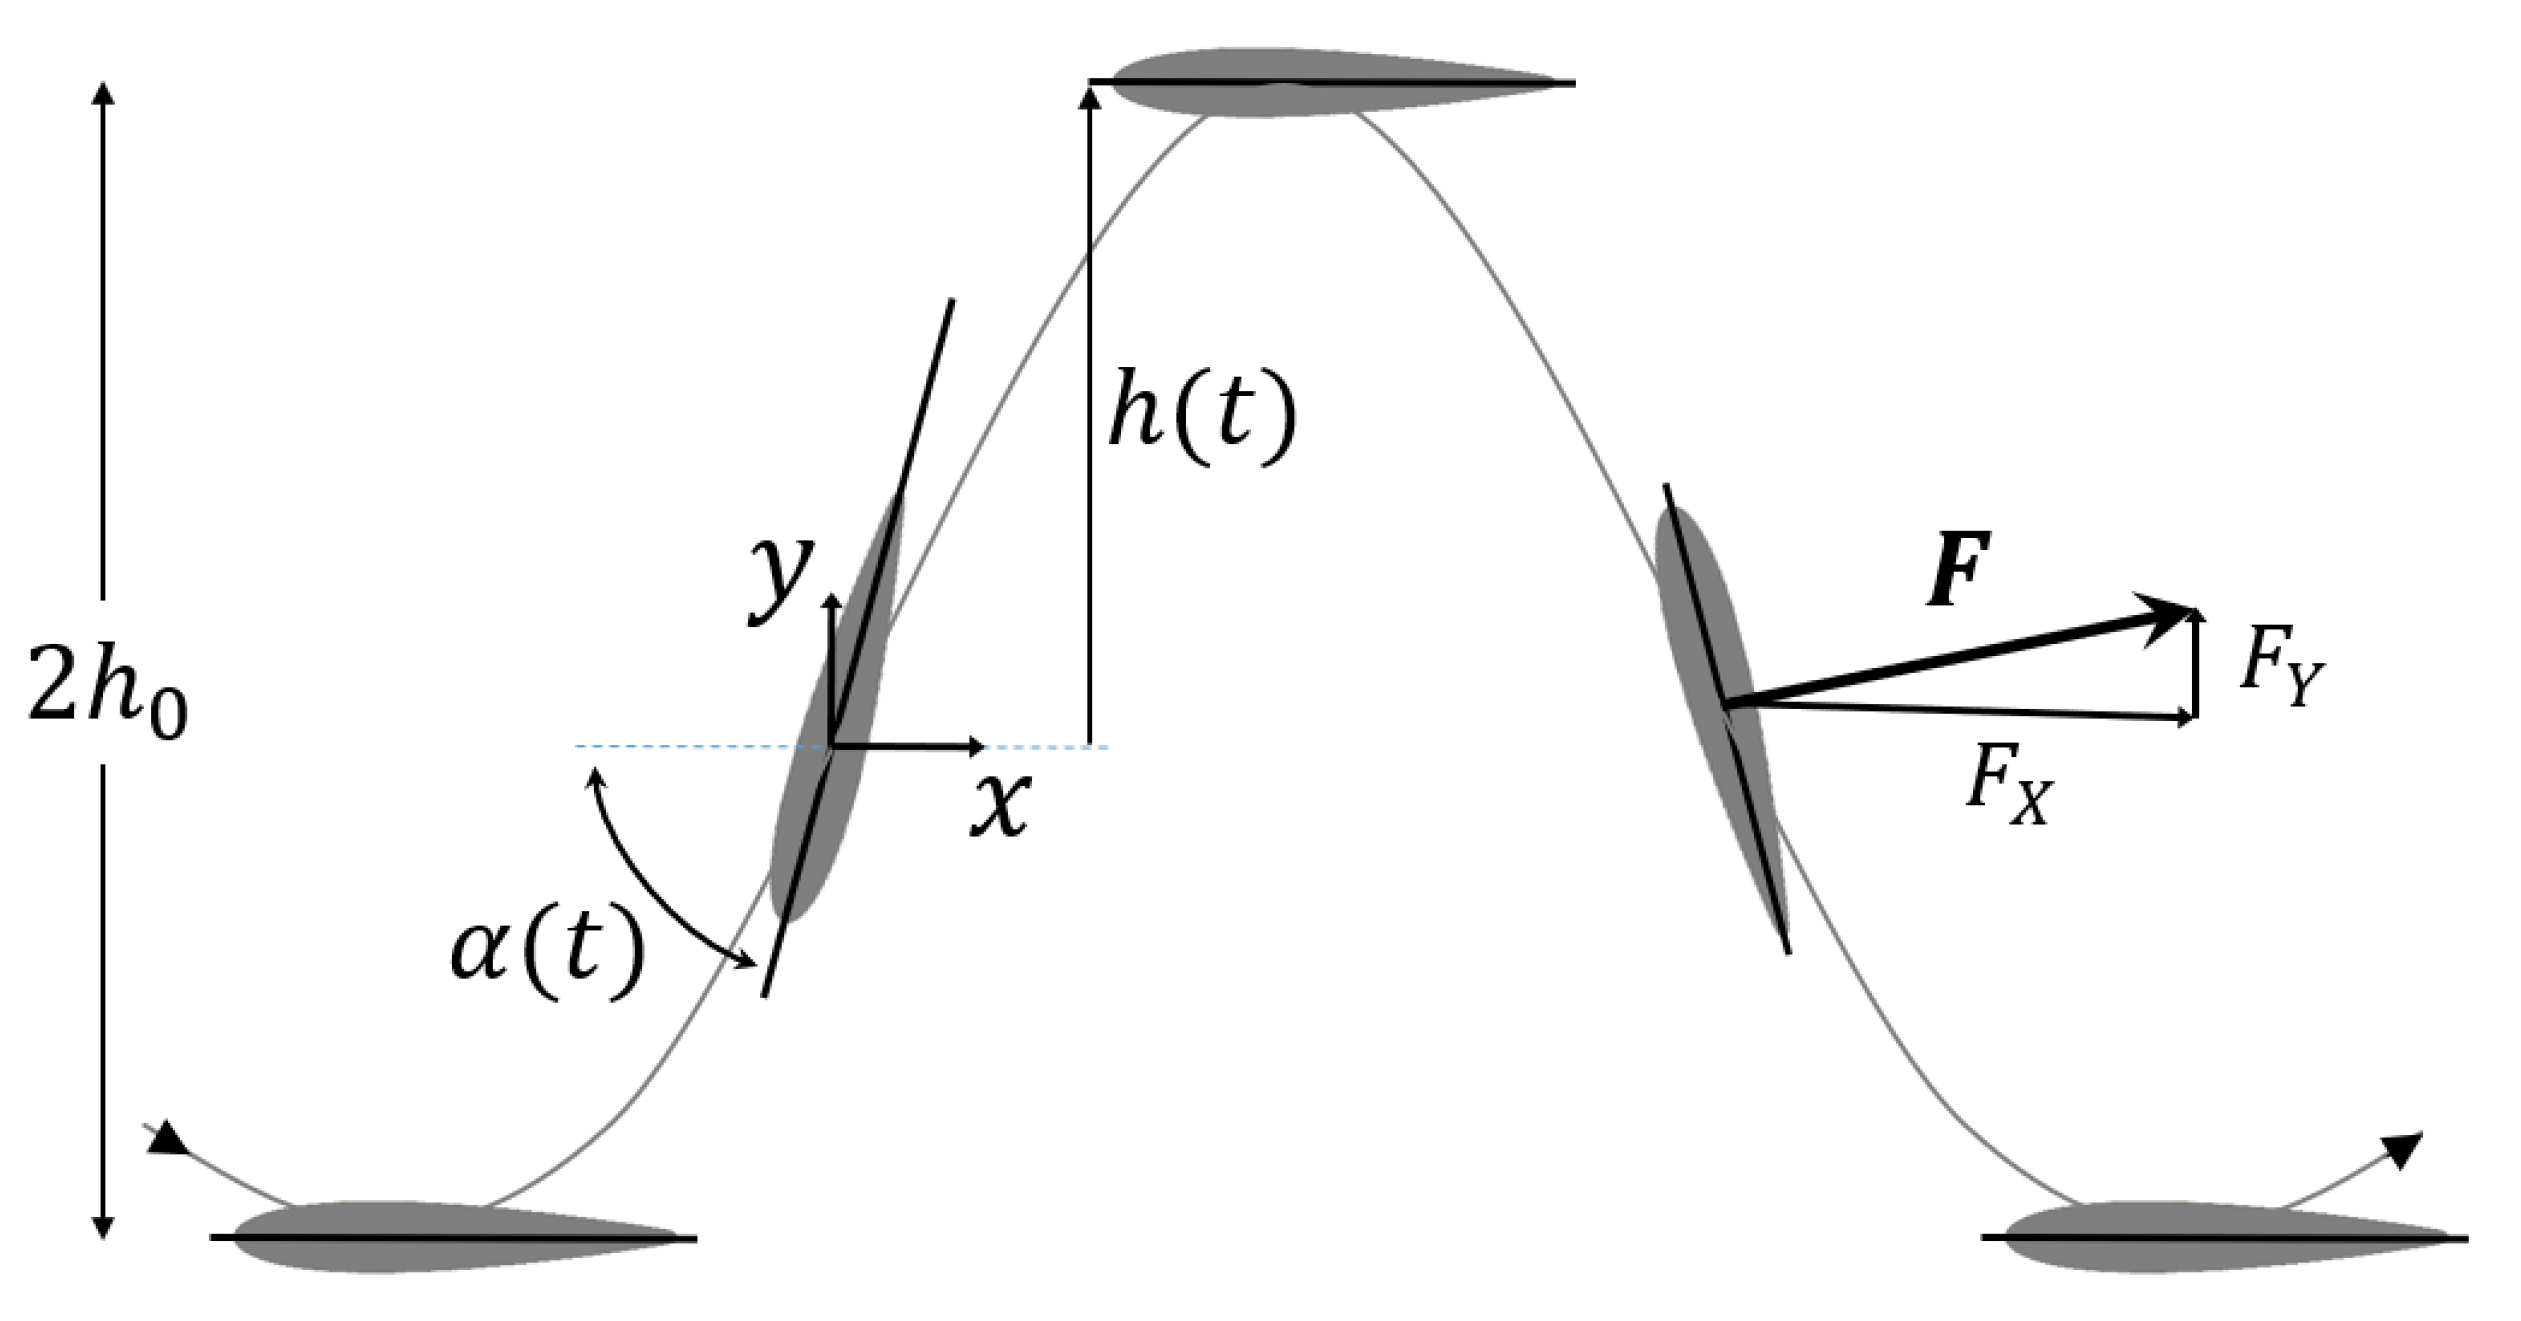
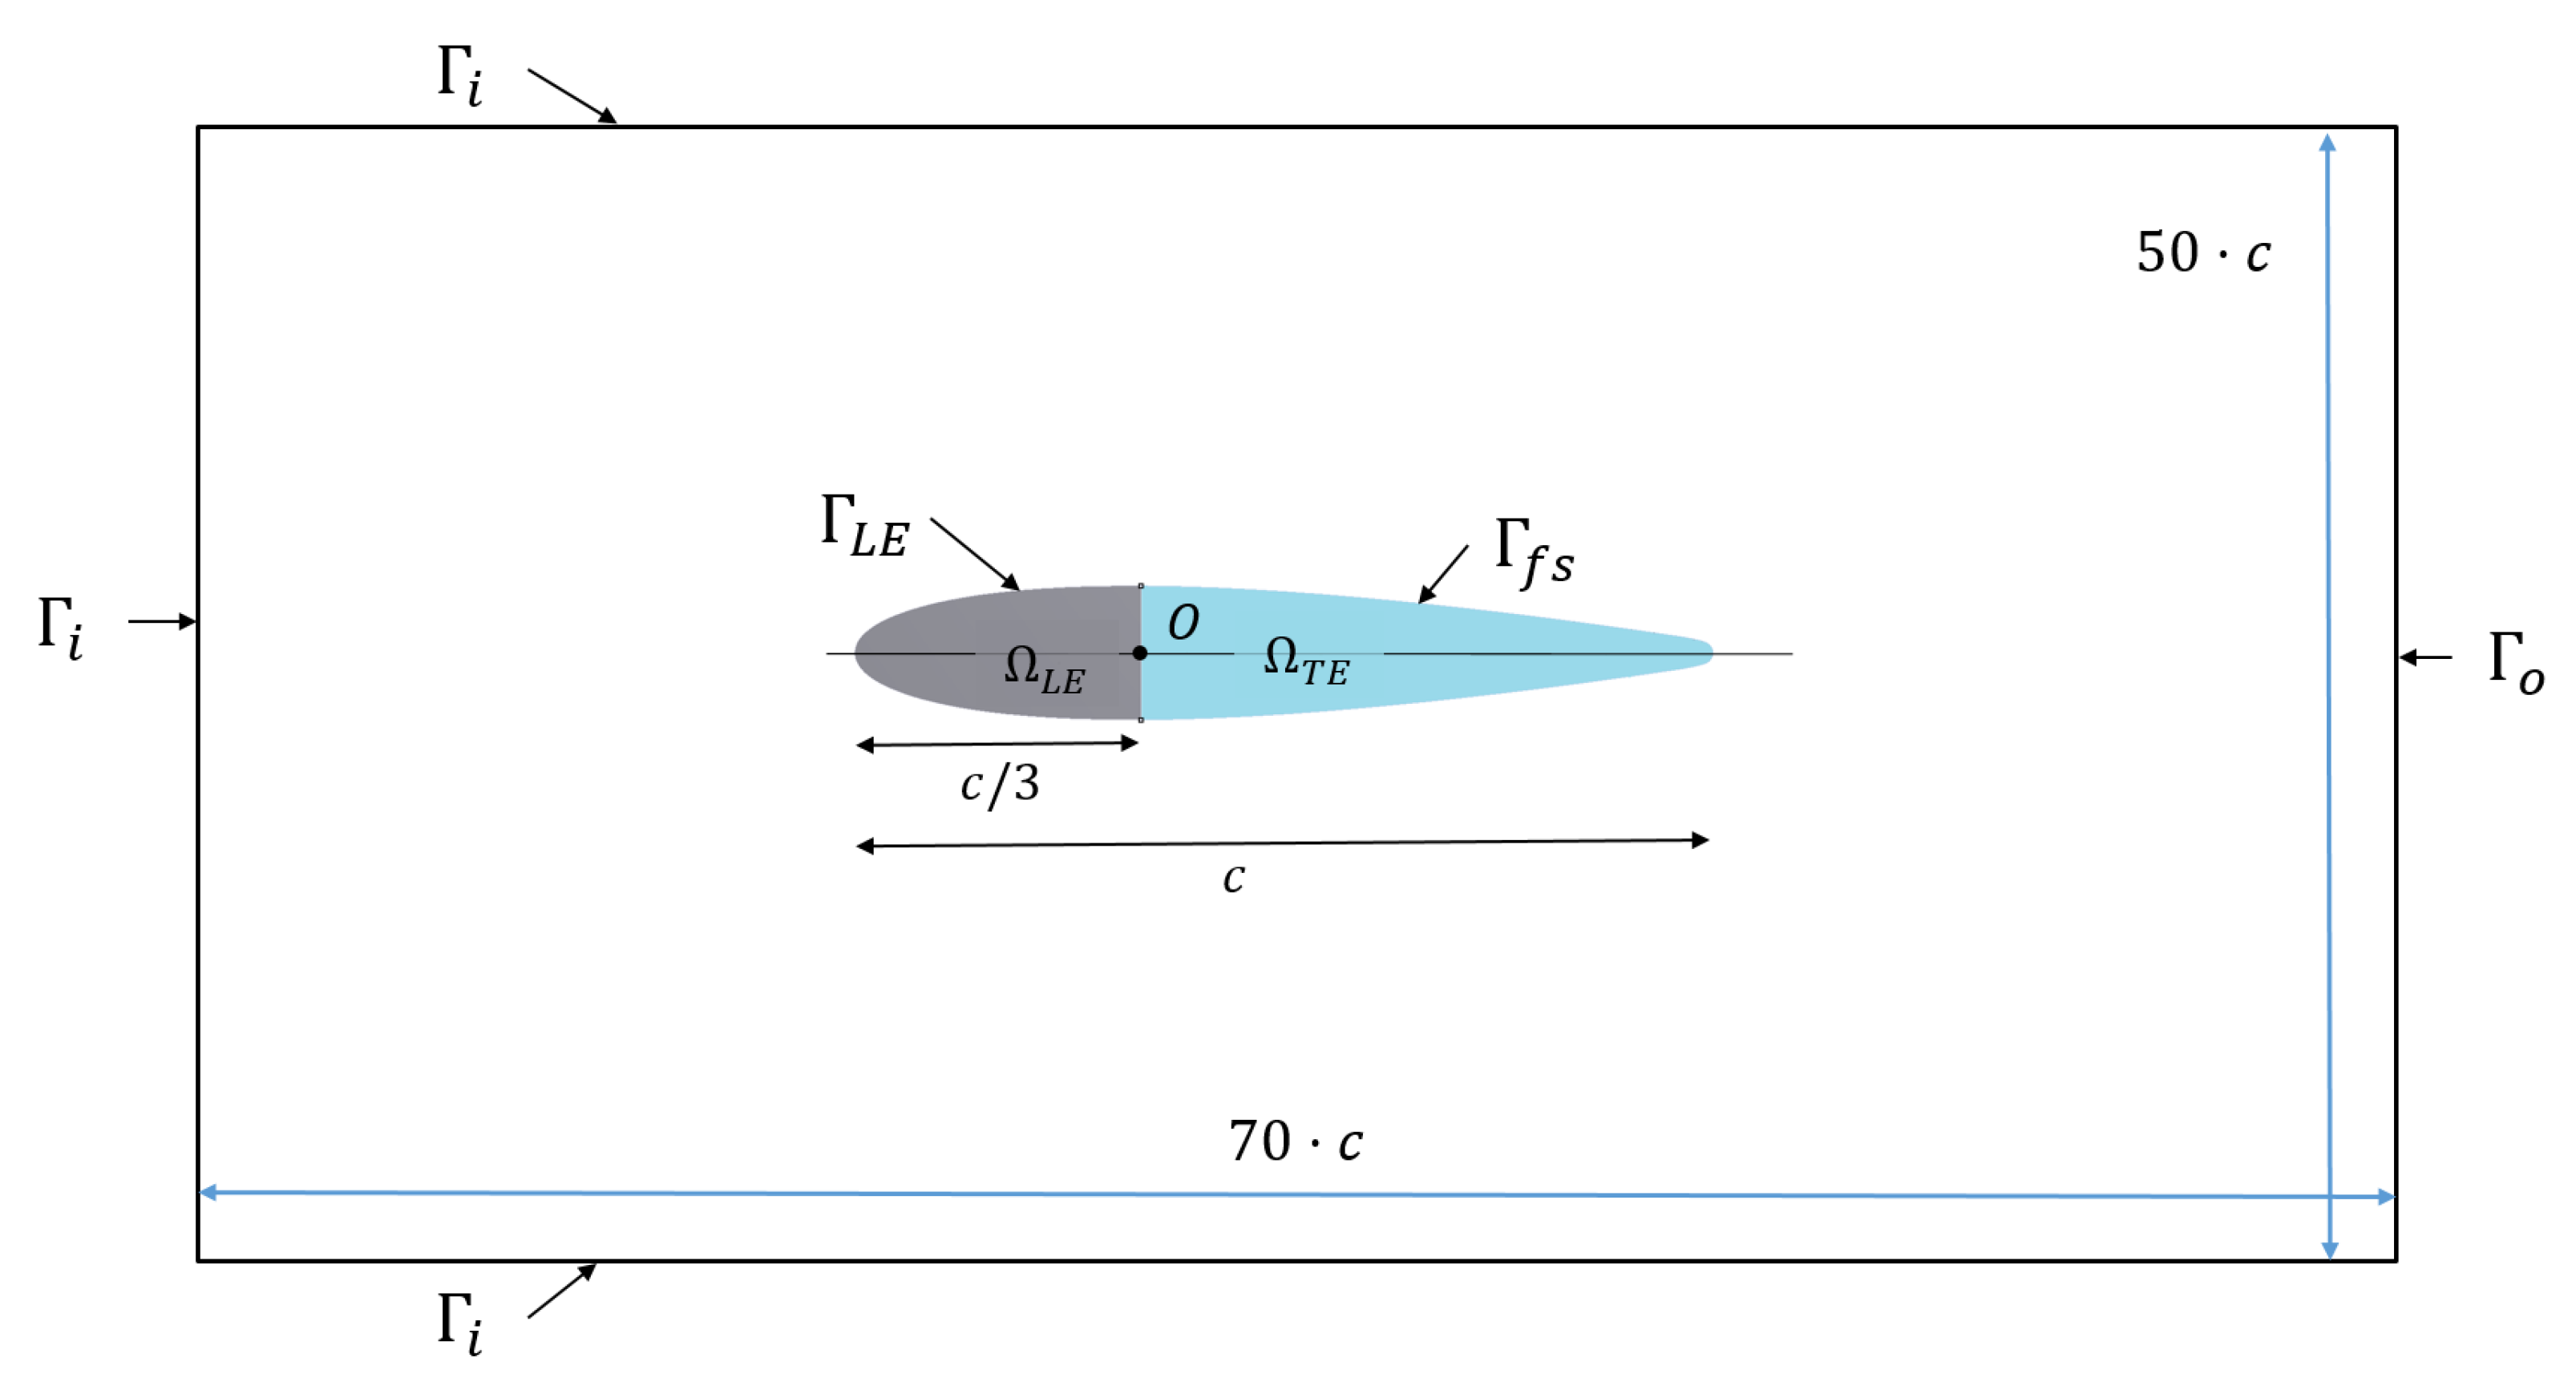
2.1. Oscillating and Deformable Hydrofoil
2.2. Fluids Dynamics Equations
2.3. Structure Dynamics Equations
2.4. Fluid-Structure Interaction Coupled Problem
3. Numerical Resolution
3.1. Heaving Reference Frame Validation
3.2. FSI Implicit Coupling Scheme Validation
3.3. Mesh and Time Step Convergence Analysis
4. Results and Discussion
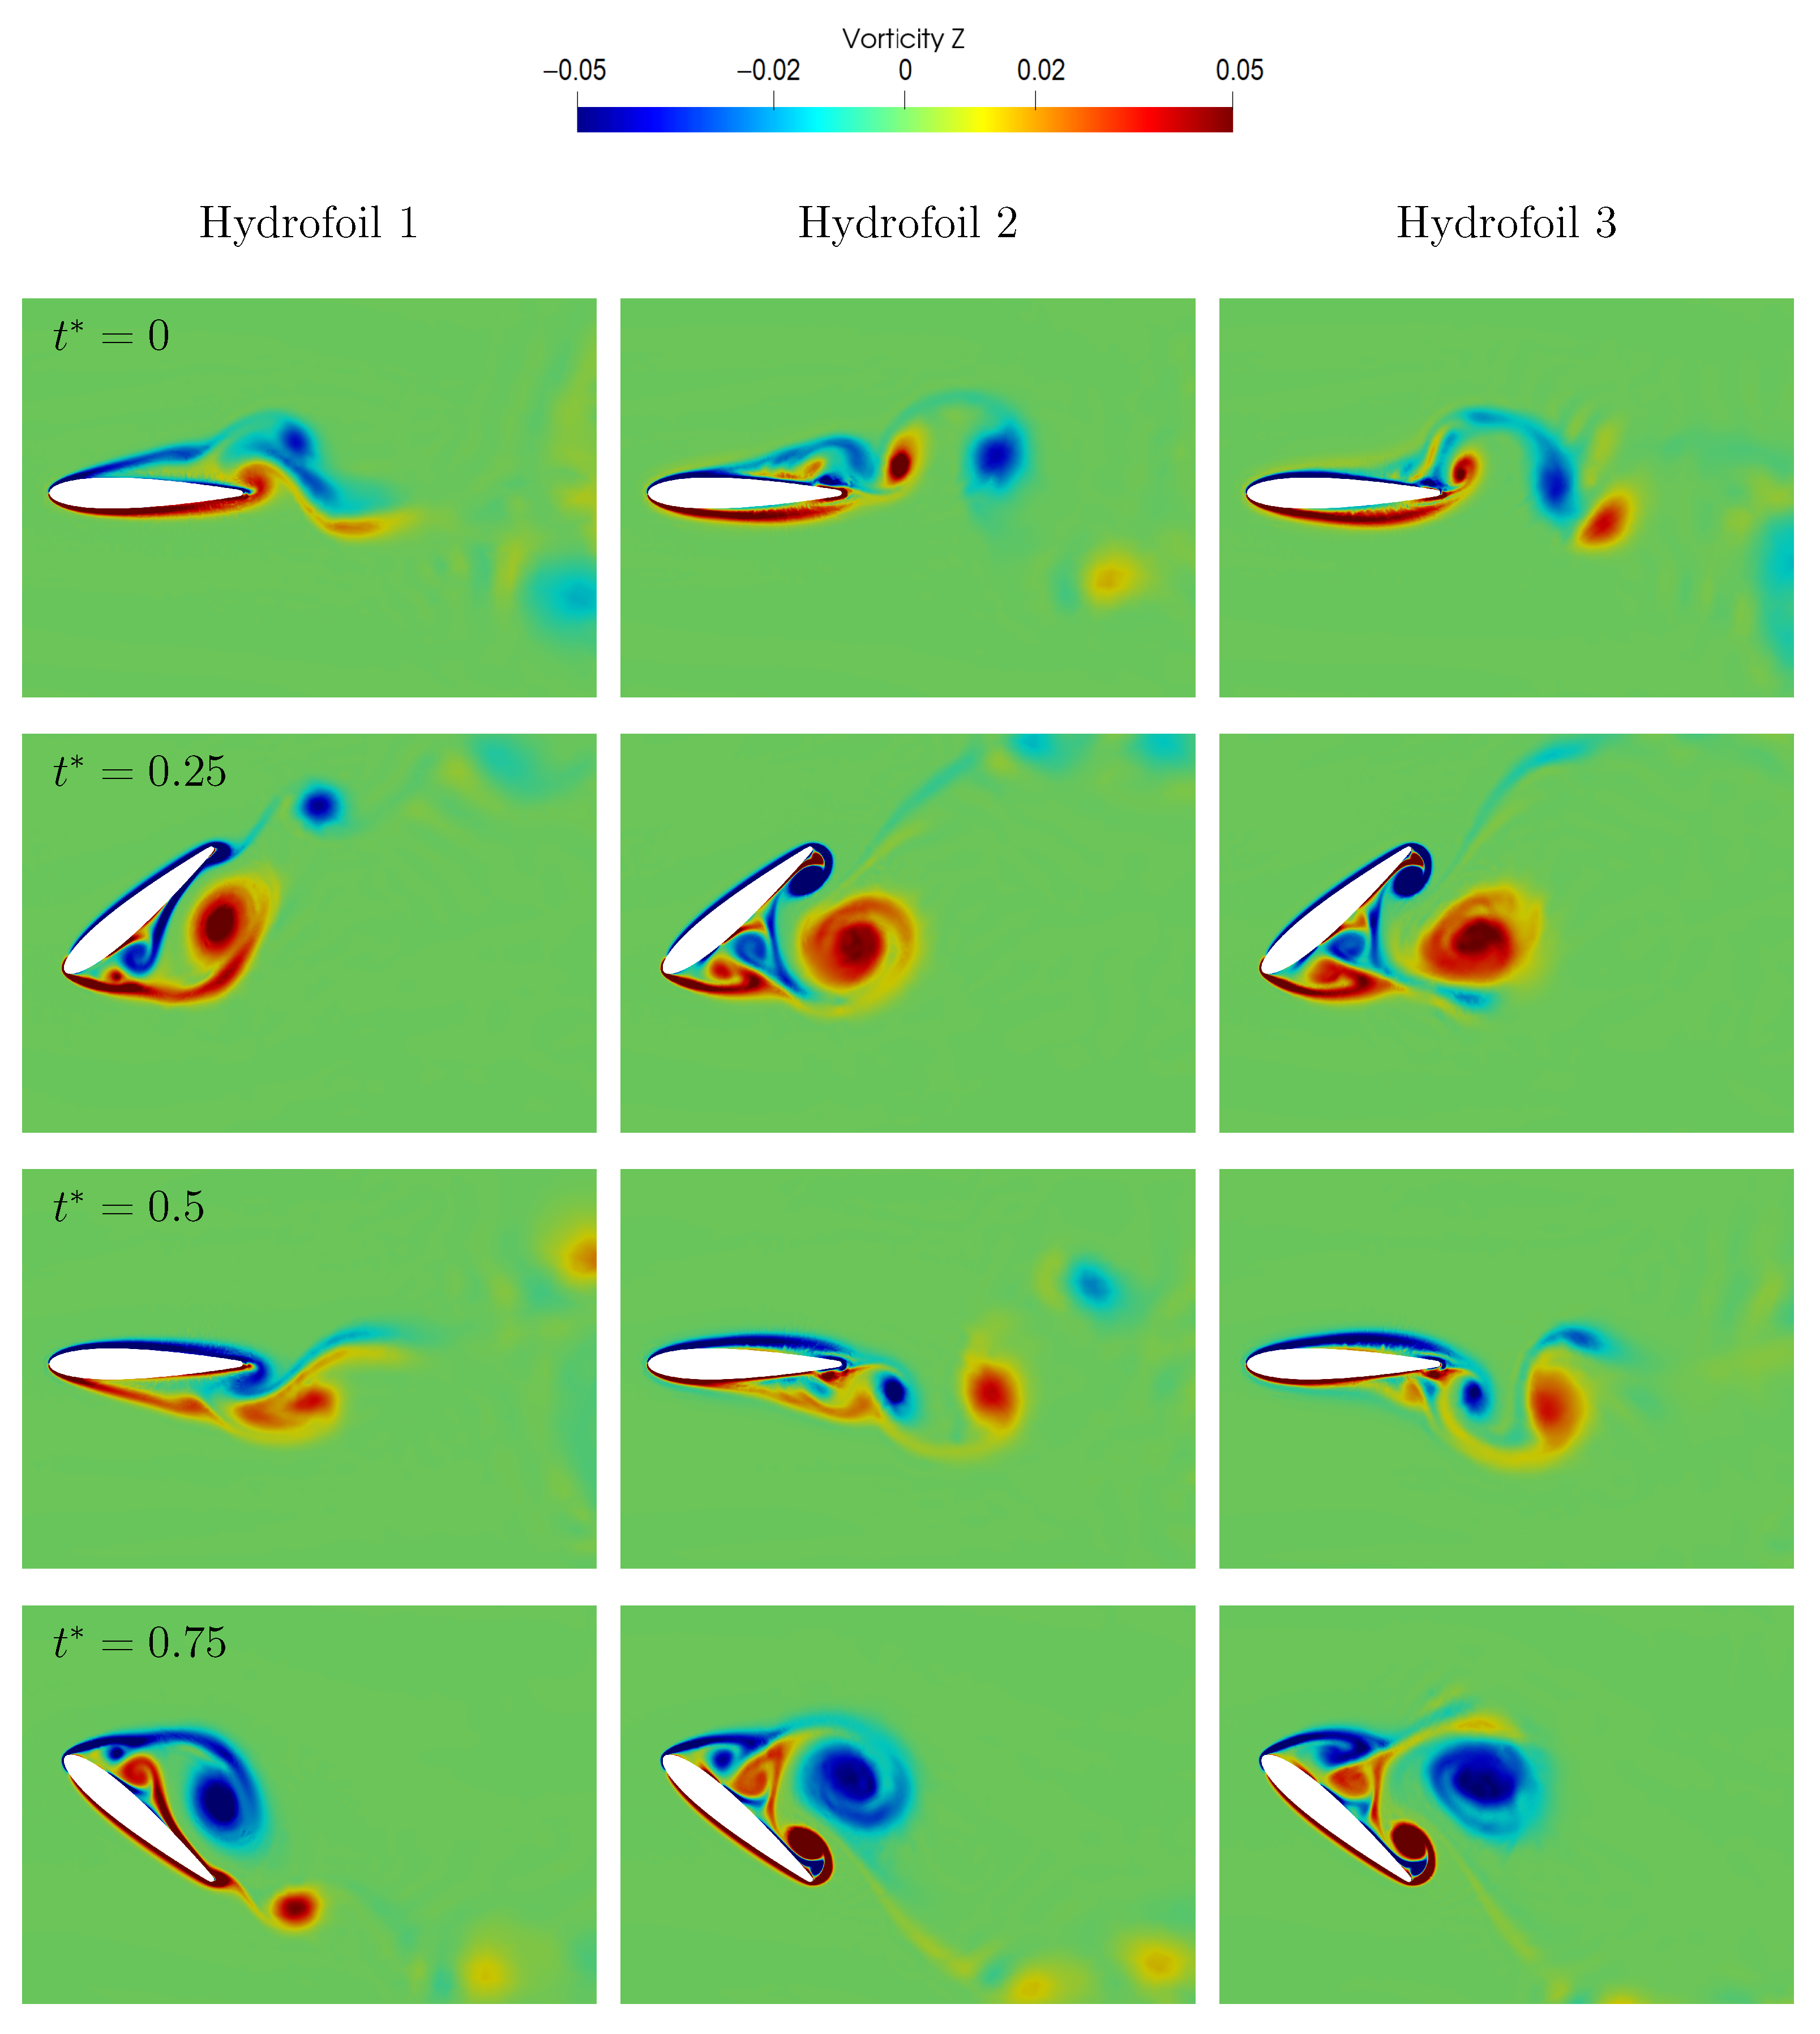
4.1. Analysis of the Flow in the Wake of the Hydrofoil
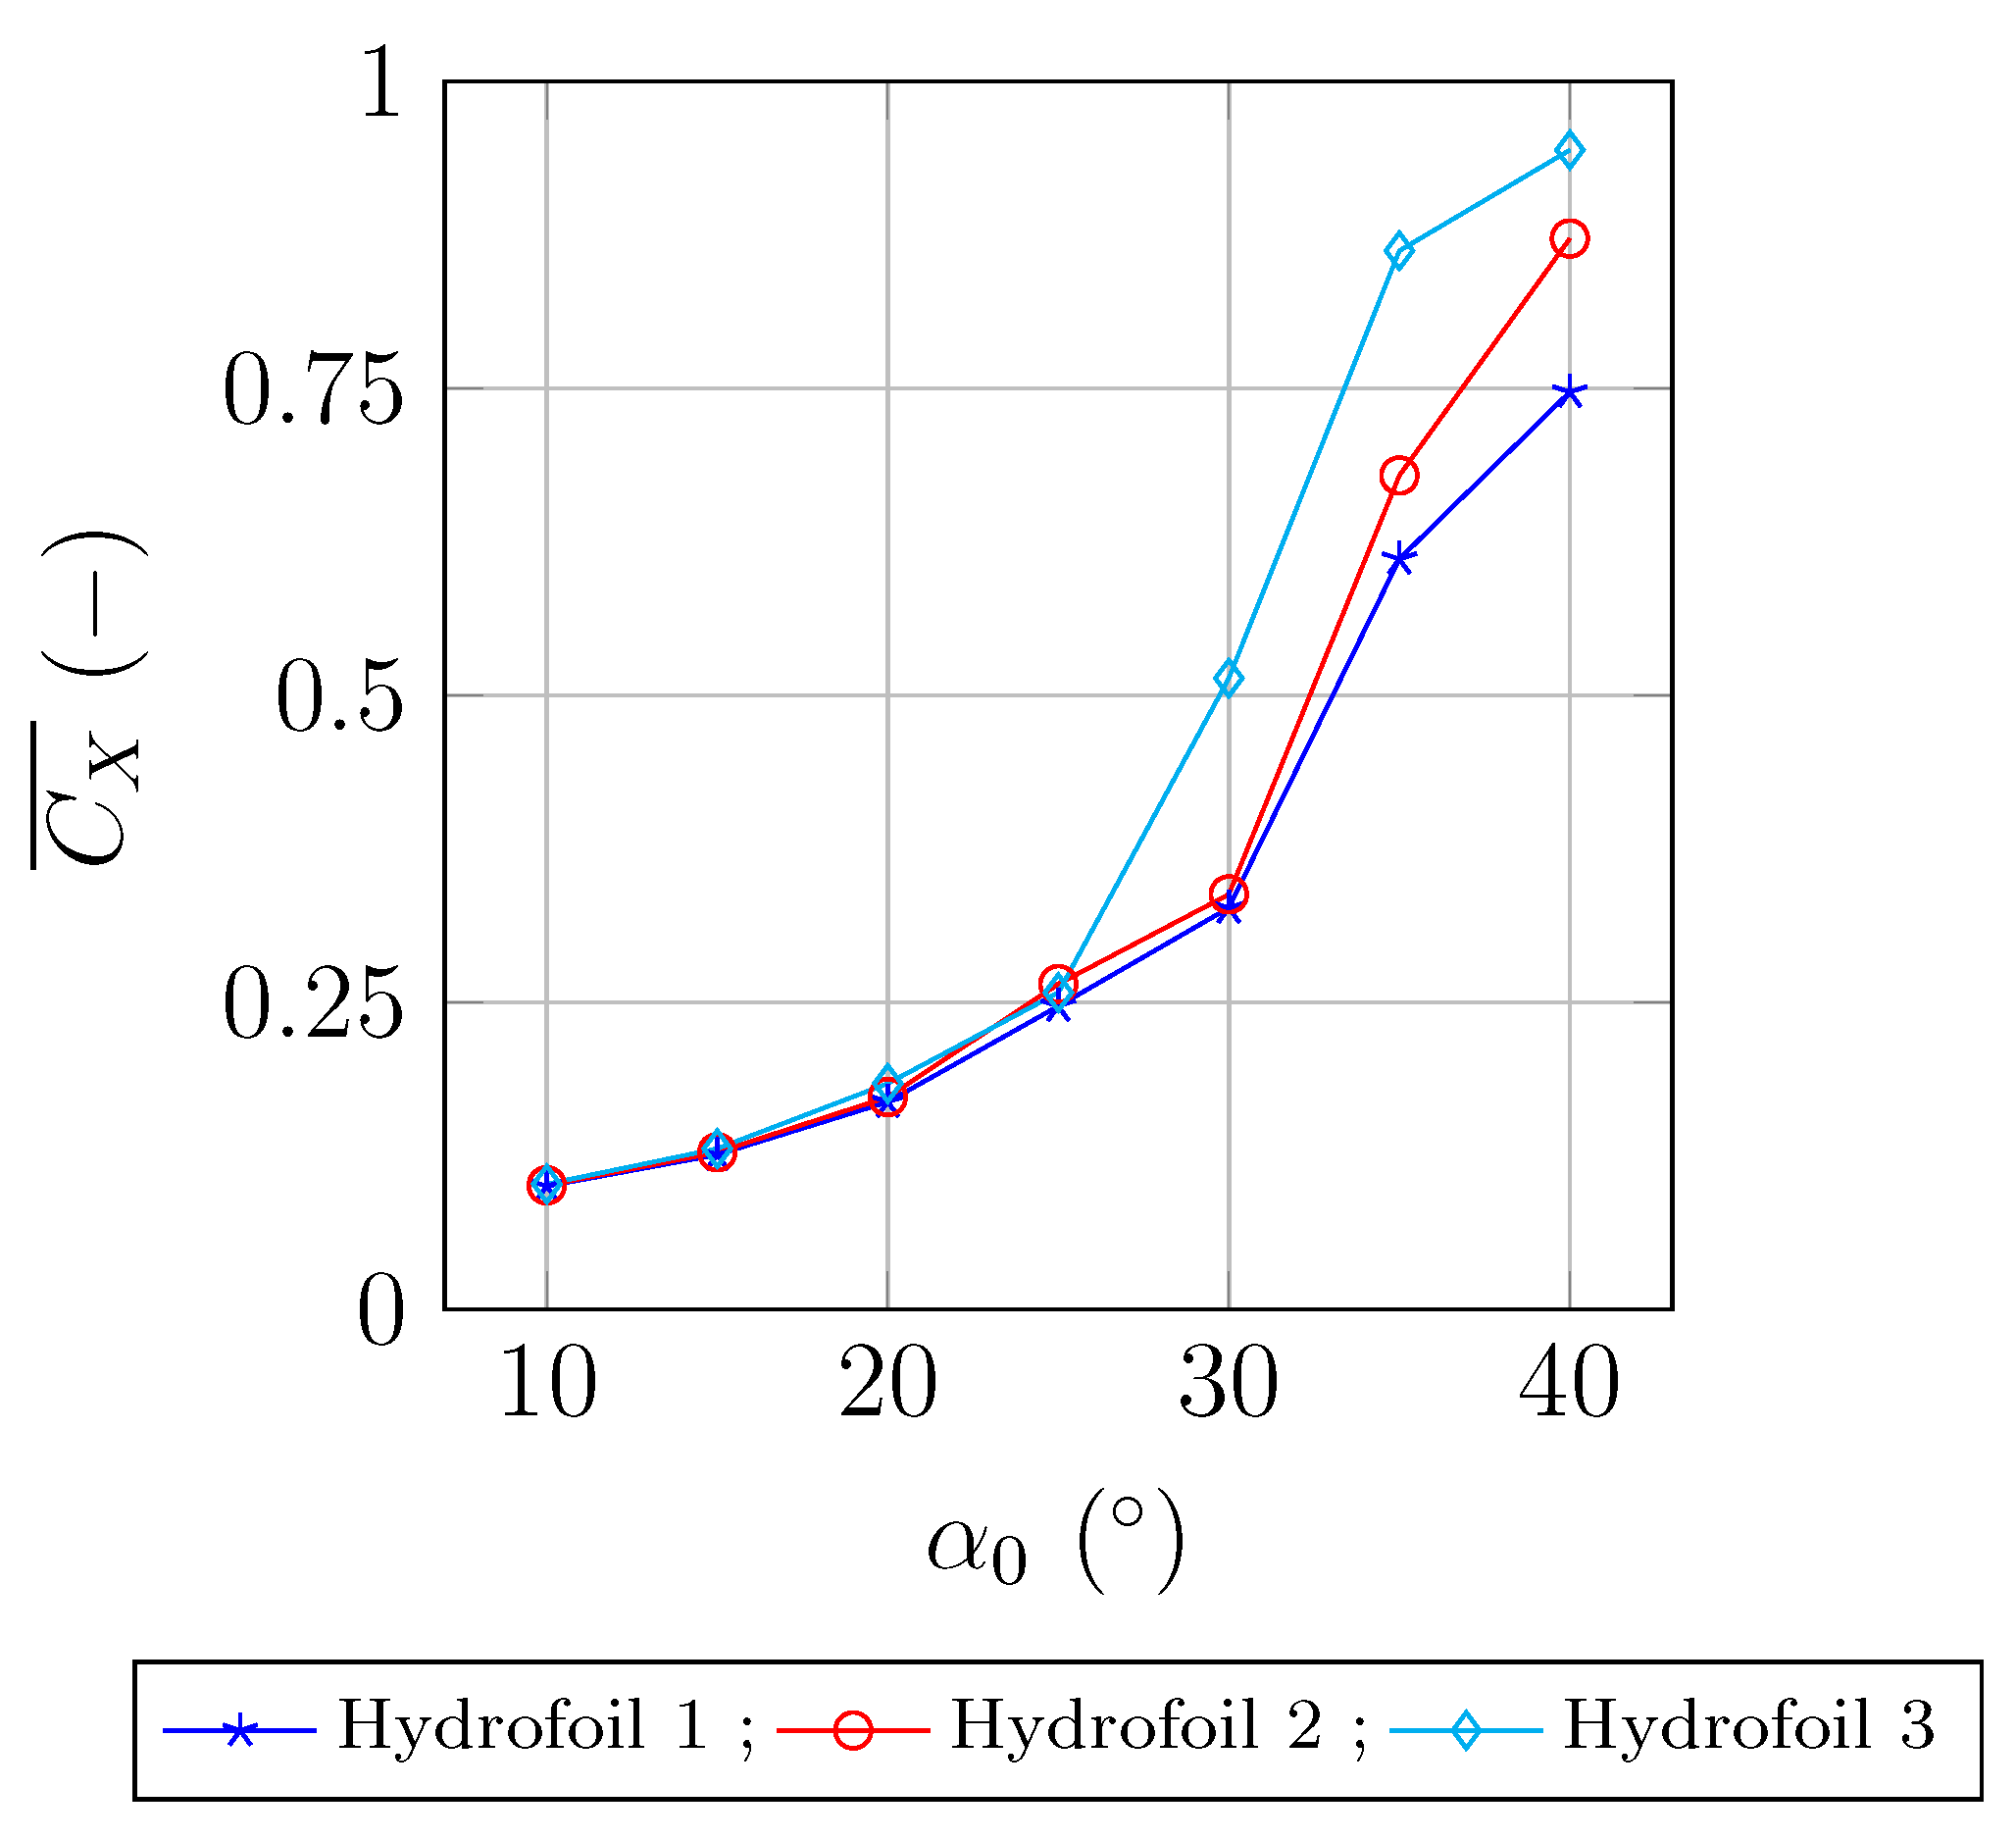
4.2. Flexibility Influence on the Hydrodynamic Forces
4.3. Flexibility Influence on the Power Extraction Efficiency of the Hydrofoil
4.4. Fluid Pressure and Vorticity Fields Analysis
5. Conclusions
Author Contributions
Funding
Institutional Review Board Statement
Informed Consent Statement
Acknowledgments
Conflicts of Interest
Abbreviations
| NACA | National Advisory Committee for Aeronautics |
| LEV | Leading-edge vortex |
| Mean value of a over one motion period | |
| Flow velocity [m/s] | |
| Free-stream velocity [m/s] | |
| Vorticity in z-direction [1/s] | |
| p | Flow pressure [Pa] |
| Density [kg/m] | |
| Re | Nombre de Reynolds [-] |
| Angle of attack [°] | |
| h | Vertical position [m] |
| T | Motion period [s] |
| c | Hydrofoil chord length [-] |
| Dimensionless x-projection of the hydrodynamic forces [-] | |
| Dimensionless y-projection of the hydrodynamic forces [-] | |
| Dimensionless torque of the hydrodynamic forces [-] | |
| Dimensionless extracted power [-] | |
| Efficiency [-] | |
| Dimensionless oscillating frequency [-] | |
| Dimensionless time [-] | |
| Mass density | |
| Structure local displacements | |
| Young’s modulus |
References
- Xiao, Q.; Zhu, Q. A review on flow energy harvesters based on flapping foils. J. Fluids Struct. 2014, 46, 174–191. [Google Scholar] [CrossRef]
- Kinsey, T.; Dumas, G. Parametric Study of an Oscillating Airfoil in a Power—Extraction Regime. AIAA J. 2008, 46, 1318–1330. [Google Scholar] [CrossRef]
- Moubogha Moubogha, J.; Ehrenstein, U.; Astolfi, J.A. Forces on a pitching plate: An experimental and numerical study. Appl. Ocean. Res. 2017, 69, 27–37. [Google Scholar] [CrossRef]
- Brousseau, P.; Benaouicha, M.; Guillou, S. Dynamics of a Free Heaving and Prescribed Pitching Hydrofoil in a Turbulent Flow, with a Fluid-Structure Interaction Approach. In Proceedings of the ASME 2018 Pressure Vessels and Piping Conference, Prague, Czech Republic, 15–19 July 2018; p. 9. [Google Scholar] [CrossRef]
- Ducoin, A.; Astolfi, J.A.; Deniset, F.; Sigrist, J.F. An experimental and numerical study of the hydroelastic behavior of an hydrofoil in transient pitching motion. In Proceedings of the First International Symposium on Marine Propulsors, Trondheim, Norway, 22–24 June 2009. [Google Scholar]
- Hoerner, S.; Abbaszadeh, S.; Maître, T.; Cleynen, O.; Thévenin, D. Characteristics of the fluid–structure interaction within Darrieus water turbines with highly flexible blades. J. Fluids Struct. 2019, 88, 13–30. [Google Scholar] [CrossRef] [Green Version]
- Korobenko, A.; Yan, J.; Gohari, S.M.I.; Sarkar, S.; Bazilevs, Y. FSI Simulation of two back-to-back wind turbines in atmospheric boundary layer flow. Comput. Fluids 2017, 158, 167–175. [Google Scholar] [CrossRef]
- Karbasian, H.R.; Esfahani, J.A. Enhancement of propulsive performance of flapping foil by fish-like motion pattern. Comput. Fluids 2017, 156, 305–316. [Google Scholar] [CrossRef]
- Delafin, P.L.; Deniset, F.; Astolfi, J.; Hauville, F. Performance Improvement of a Darrieus Tidal Turbine with Active Variable Pitch. Energies 2021, 14, 667. [Google Scholar] [CrossRef]
- Kinsey, T.; Dumas, G. Testing and Analysis of an Oscillating Hydrofoils Turbine Concept. In Proceedings of the ASME 2010 3rd Joint US-European Fluids Engineering Summer Meeting: Volume 1, Symposia—Parts A, B, and C, Montreal, QC, Canada, 1–5 August 2010; pp. 9–22. [Google Scholar] [CrossRef]
- Duarte, L.; Dellinger, N.; Dellinger, G.; Ghenaim, A.; Terfous, A. Experimental investigation of the dynamic behaviour of a fully passive flapping foil hydrokinetic turbine. J. Fluids Struct. 2019, 88, 1–12. [Google Scholar] [CrossRef]
- Marchand, J.B.; Astolfi, J.A.; Bot, P. Discontinuity of lift on a hydrofoil in reversed flow for tidal turbine Application. Eur. J. Mech. B 2017, 63, 90–99. [Google Scholar] [CrossRef] [Green Version]
- Brousseau, P. Modélisation Numérique D’une Structure Oscillante en Tangage et Pilonnement, Avec Prise en Compte de L’interaction Fluide-Structure. Ph.D. Thesis, Université de Caen Normandie, Caen, France, 2020. [Google Scholar]
- Fish, F.E. Power Output and Propulsive Efficiency of Swimming Bottlenose Dolphins (tursiops Truncatus). J. Exp. Biol. 1993, 185, 179–193. [Google Scholar] [CrossRef]
- MacPhee, D.W.; Beyene, A. Fluid-structure interaction analysis of a morphing vertical axis wind turbine. J. Fluids Struct. 2016, 60, 143–159. [Google Scholar] [CrossRef]
- Zeiner-Gundersen, D.H. A novel flexible foil vertical axis turbine for river, ocean, and tidal applications. Appl. Energy 2015, 151, 60–66. [Google Scholar] [CrossRef]
- Benaouicha, M. Contribution au Développement D’algorithmes de Couplage en Interaction Fluide-Structure. Ph.D. Thesis, Université de La Rochelle, La Rochelle, France, 2007. [Google Scholar]
- Van Loon, R.; Anderson, P.D.; van de Vosse, F.N.; Sherwin, S.J. Comparison of various fluid–structure interaction methods for deformable bodies. Comput. Struct. 2007, 85, 833–843. [Google Scholar] [CrossRef] [Green Version]
- Yan, J.; Augier, B.; Korobenko, A.; Czarnowski, J.; Ketterman, G.; Bazilevs, Y. FSI modeling of a propulsion system based on compliant hydrofoils in a tandem configuration. Comput. Fluids 2016, 141, 201–211. [Google Scholar] [CrossRef] [Green Version]
- Michler, C.; Hulshoff, S.J.; van Brummelen, E.H.; de Borst, R. A monolithic approach to fluid-structure interaction. Comput. Fluids 2004, 33, 839–848. [Google Scholar] [CrossRef]
- Arora, N.; Kang, C.K.; Shyy, W.; Gupta, A. Analysis of passive flexion in propelling a plunging plate using a torsion spring model. J. Fluid Mech. 2018, 857, 562–604. [Google Scholar] [CrossRef]
- Olivier, M.; Dumas, G. Effects of mass and chordwise flexibility on 2D self-propelled flapping wings. J. Fluids Struct. 2016, 64, 46–66. [Google Scholar] [CrossRef] [Green Version]
- Benaouicha, M.; Guillou, S.; Santa Cruz, A.; Trigui, H. Fluid-Structure Interaction Approach for Numerical Investigation of a Flexible Hydrofoil Deformations in Turbulent Fluid Flow. In Proceedings of the ASME 2018 Pressure Vessels and Piping Conference, Prague, Czech Republic, 15–19 July 2018; Volume 4, p. 9. [Google Scholar] [CrossRef]
- Brousseau, P.; Benaouicha, M.; Guillou, S. Etude Numérique d’un Hydrofoil Déformable dans un Écoulement Turbulent avec Foam-extend et Prise en Compte de L’intéraction Fluide-Structure. Actes Des J. L’Hydrodynamique 2018. 2018. Available online: http://website.ec-nantes.fr/actesjh/images/16JH/Articles/JH2018_papier_11_Brousseau_et_al.pdf (accessed on 8 July 2021).
- Huang, Z.; Xiong, Y.; Xu, Y. The simulation of deformation and vibration characteristics of a flexible hydrofoil based on static and transient FSI. Ocean. Eng. 2019, 182, 61–74. [Google Scholar] [CrossRef]
- Hoerner, S.; Kösters, I.; Vignal, L.; Cleynen, O.; Abbaszadeh, S.; Maître, T.; Thévenin, D. Cross-Flow Tidal Turbines with Highly Flexible Blades—Experimental Flow Field Investigations at Strong Fluid-Structure Interactions. Energies 2021, 14, 797. [Google Scholar] [CrossRef]
- Manjunathan, S.A.; Bhardwaj, R. Thrust generation by pitching and heaving of an elastic plate at low Reynolds number. Phys. Fluids 2020, 32, 073601. [Google Scholar] [CrossRef]
- Alben, S. Optimal flexibility of a flapping appendage in an inviscid fluid. J. Fluid Mech. 2008, 614, 355–380. [Google Scholar] [CrossRef] [Green Version]
- David, M.J.; Govardhan, R.N.; Arakeri, J.H. Thrust generation from pitching foils with flexible trailing edge flaps. J. Fluid Mech. 2017, 828, 70–103. [Google Scholar] [CrossRef]
- Yin, B.; Luo, H. Effect of wing inertia on hovering performance of flexible flapping wings. Phys. Fluids 2010, 22, 111902. [Google Scholar] [CrossRef] [Green Version]
- Tian, F.B.; Young, J.; Lai, J.C.S. Improving power-extraction efficiency of a flapping plate: From passive deformation to active control. J. Fluids Struct. 2014, 51, 384–392. [Google Scholar] [CrossRef]
- Kinsey, T.; Dumas, G. Optimal Operating Parameters for an Oscillating Foil Turbine at Reynolds Number 500,000. AIAA J. 2014, 52, 1885–1895. [Google Scholar] [CrossRef]
- Usoh, C.; Young, J.; Lai, J.; Ashraf, M. Numerical Analysis of a Non-Profiled Plate for Flapping Wing Turbines. In Proceedings of the 18th Australasian Fluid Mechanics Conference, Launceston, Australia, 3–7 December 2012. [Google Scholar]
- Blackburn, H.M.; Henderson, R.D. A study of two-dimensional flow past an oscillating cylinder. J. Fluid Mech. 1999, 385, 255–286. [Google Scholar] [CrossRef] [Green Version]
- Souli, M.; Zolesio, J.P. Arbitrary Lagrangian—Eulerian and free surface methods in fluid mechanics. Comput. Methods Appl. Mech. Eng. 2001, 191, 451–466. [Google Scholar] [CrossRef]
- Cardiff, P.; Karač, A.; De Jaeger, P.; Jasak, H.; Nagy, J.; Ivanković, A.; Tuković, Ž. An open-source finite volume toolbox for solid mechanics and fluid-solid interaction simulations. arXiv 2018, arXiv:1808.10736. [Google Scholar]
- Jasak, H.; Weller, H.G. Application of the finite volume method and unstructured meshes to linear elasticity. Int. J. Numer. Methods Eng. 2000, 48, 267–287. [Google Scholar] [CrossRef]
- Tukovic, Z.; Karač, A.; Cardiff, P.; Jasak, H.; Ivanković, A. OpenFOAM finite volume solver for fluid-solid interaction. Trans. Famena 2018, 42, 1–31. [Google Scholar] [CrossRef]
- Rege, K.; Hjertager, B.H. Application of foam-extend on turbulent fluid-structure interaction. IOP Conf. Ser. Mater. Sci. Eng. 2017, 276, 012031. [Google Scholar] [CrossRef]
- Brousseau, P.; Benaouicha, M.; Guillou, S. Fluid-structure interaction effects on the deformable and pitching plate dynamics in a fluid flow. Appl. Ocean. Res. 2021, 113, 102720. [Google Scholar] [CrossRef]
- Lelong, A.; Astolfi, J.A.; Guiffaud, P. An Experimental Analysis of Hydroelastic Response of Flexible Ligthweigth Hydrofoils in Non Cavitating and Cavitating Flow. J. Fluids Eng. 2016, 140, 021116. [Google Scholar] [CrossRef]


| Designation (−) | hydrofoil 1 | hydrofoil 2 | hydrofoil 3 |
| Density (kg/m) | 1420 | 1420 | 1420 |
| Young’s Modulus (GPa) | 1.0 | 0.1 | 0.01 |
| Poisson’s Coefficient (−) | 0.35 | 0.35 | 0.35 |
| Solvers | Cells | Time Steps/Cycle | ||
|---|---|---|---|---|
| Blackburn & Henderson [34] | 422 | 2000 | 1.414 | 1.776 |
| Kinsey & Dumas [2] | 65,600 | 2000 | 1.412 | 1.755 |
| Present | 75,000 | 2000 | 1.467 | 1.761 |
| Relative deviations with [34] | - | - | 3.75% | 0.84% |
| (-) | (-) | (°) | [mm] | |
|---|---|---|---|---|
| Experiment [41] | 0.80 | 0.045 | 0.2 | 1.48 |
| Numerical—Ansys [23] | 0.85 | 0.058 | 0.17 | 1.5 |
| Numerical—OpenFoam | 0.74 | 0.058 | 0.22 | 1.35 |
| Relative deviations with [41] | 7.5% | 22% | 10% | 8.5% |
| Mesh 1 | Mesh 2 | Mesh 3 | Mesh 4 | |
|---|---|---|---|---|
| ° | 0.189 | 0.220 | 0.219 | 0.219 |
| ° | 2.26 | 2.26 | 2.27 | 2.27 |
| ° | 3.91 | 3.72 | 3.75 | 3.75 |
| Hydrofoil 1 | Hydrofoil 2 | Hydrofoil 3 | |
|---|---|---|---|
| ° | 0.2197 | 0.2567 | 0.3166 |
| ° | 2.279 | 2.442 | 2.878 |
| ° | 3.746 | 4.026 | 4.374 |
| ° | 5.088 | 6.119 | 6.070 |
| ° | 8.258 | 8.655 | 13.72 |
| ° | 12.87 | 15.75 | 21.66 |
| ° | 13.99 | 17.84 | 20.45 |
Publisher’s Note: MDPI stays neutral with regard to jurisdictional claims in published maps and institutional affiliations. |
© 2021 by the authors. Licensee MDPI, Basel, Switzerland. This article is an open access article distributed under the terms and conditions of the Creative Commons Attribution (CC BY) license (https://creativecommons.org/licenses/by/4.0/).
Share and Cite
Brousseau, P.; Benaouicha, M.; Guillou, S. Hydrodynamic Efficiency Analysis of a Flexible Hydrofoil Oscillating in a Moderate Reynolds Number Fluid Flow. Energies 2021, 14, 4370. https://doi.org/10.3390/en14144370
Brousseau P, Benaouicha M, Guillou S. Hydrodynamic Efficiency Analysis of a Flexible Hydrofoil Oscillating in a Moderate Reynolds Number Fluid Flow. Energies. 2021; 14(14):4370. https://doi.org/10.3390/en14144370
Chicago/Turabian StyleBrousseau, Paul, Mustapha Benaouicha, and Sylvain Guillou. 2021. "Hydrodynamic Efficiency Analysis of a Flexible Hydrofoil Oscillating in a Moderate Reynolds Number Fluid Flow" Energies 14, no. 14: 4370. https://doi.org/10.3390/en14144370
APA StyleBrousseau, P., Benaouicha, M., & Guillou, S. (2021). Hydrodynamic Efficiency Analysis of a Flexible Hydrofoil Oscillating in a Moderate Reynolds Number Fluid Flow. Energies, 14(14), 4370. https://doi.org/10.3390/en14144370