
Sources of Greenhouse Gas Emissions in Agriculture, with Particular Emphasis on Emissions from Energy Used

 , ,
, ,
Abstract
:1. Introduction
- changing weather patterns, reducing rainfall in many regions of the world. Where rainfall is constant, its nature changes from long-term rainfall to long periods of drought, interrupted by storm rain,
- much more frequent occurrence of extreme phenomena, unfavourable for agriculture: storms, hail, frosts,
- the emergence of new species of pests, diseases that have not been encountered so far, do not have natural enemies [25],
- periods of extremely high temperatures, dangerous for crops and livestock. They also reduce the productivity of human labour, making it impossible at certain times.
2. Background
Energy Consumption in Agriculture
3. Materials and Methods
3.1. Overview
3.2. Types of Farms
3.3. Methodology of Estimating Emissions in Farms
4. Results and Discussion
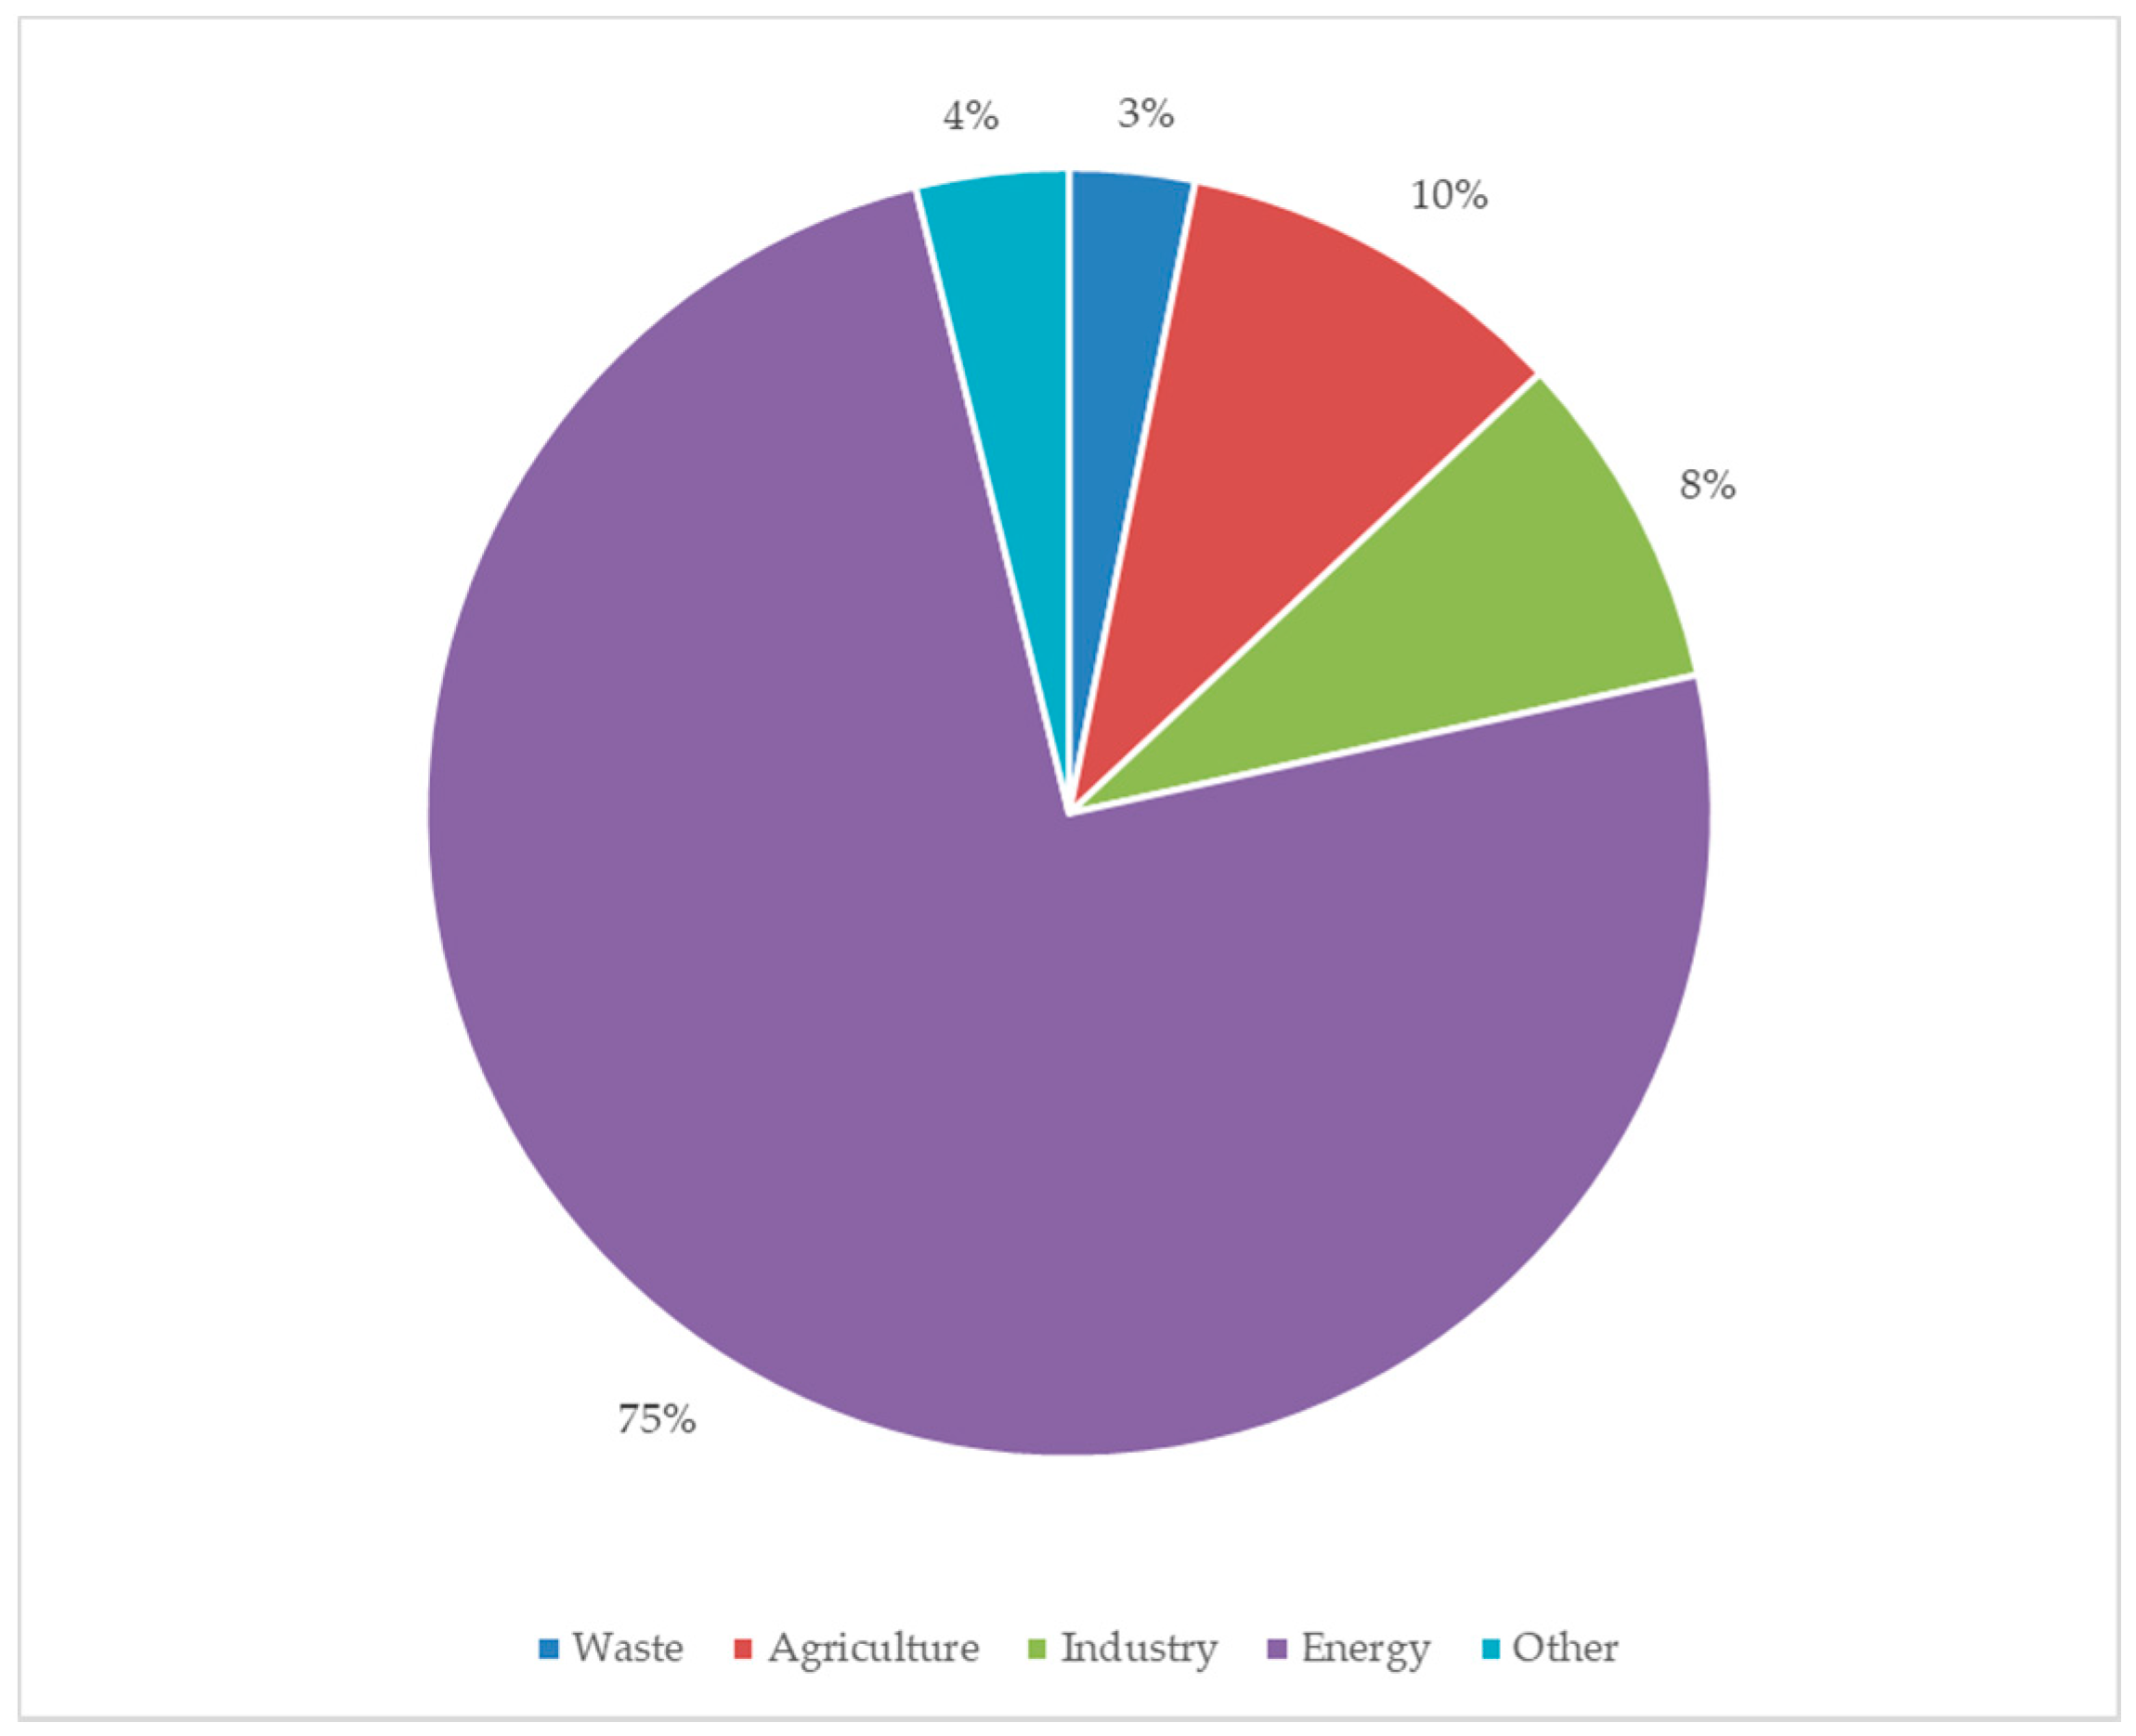
4.1. Total GHG Emissions from Agriculture
4.2. GHG Emission from Energy Inputs in Agriculture
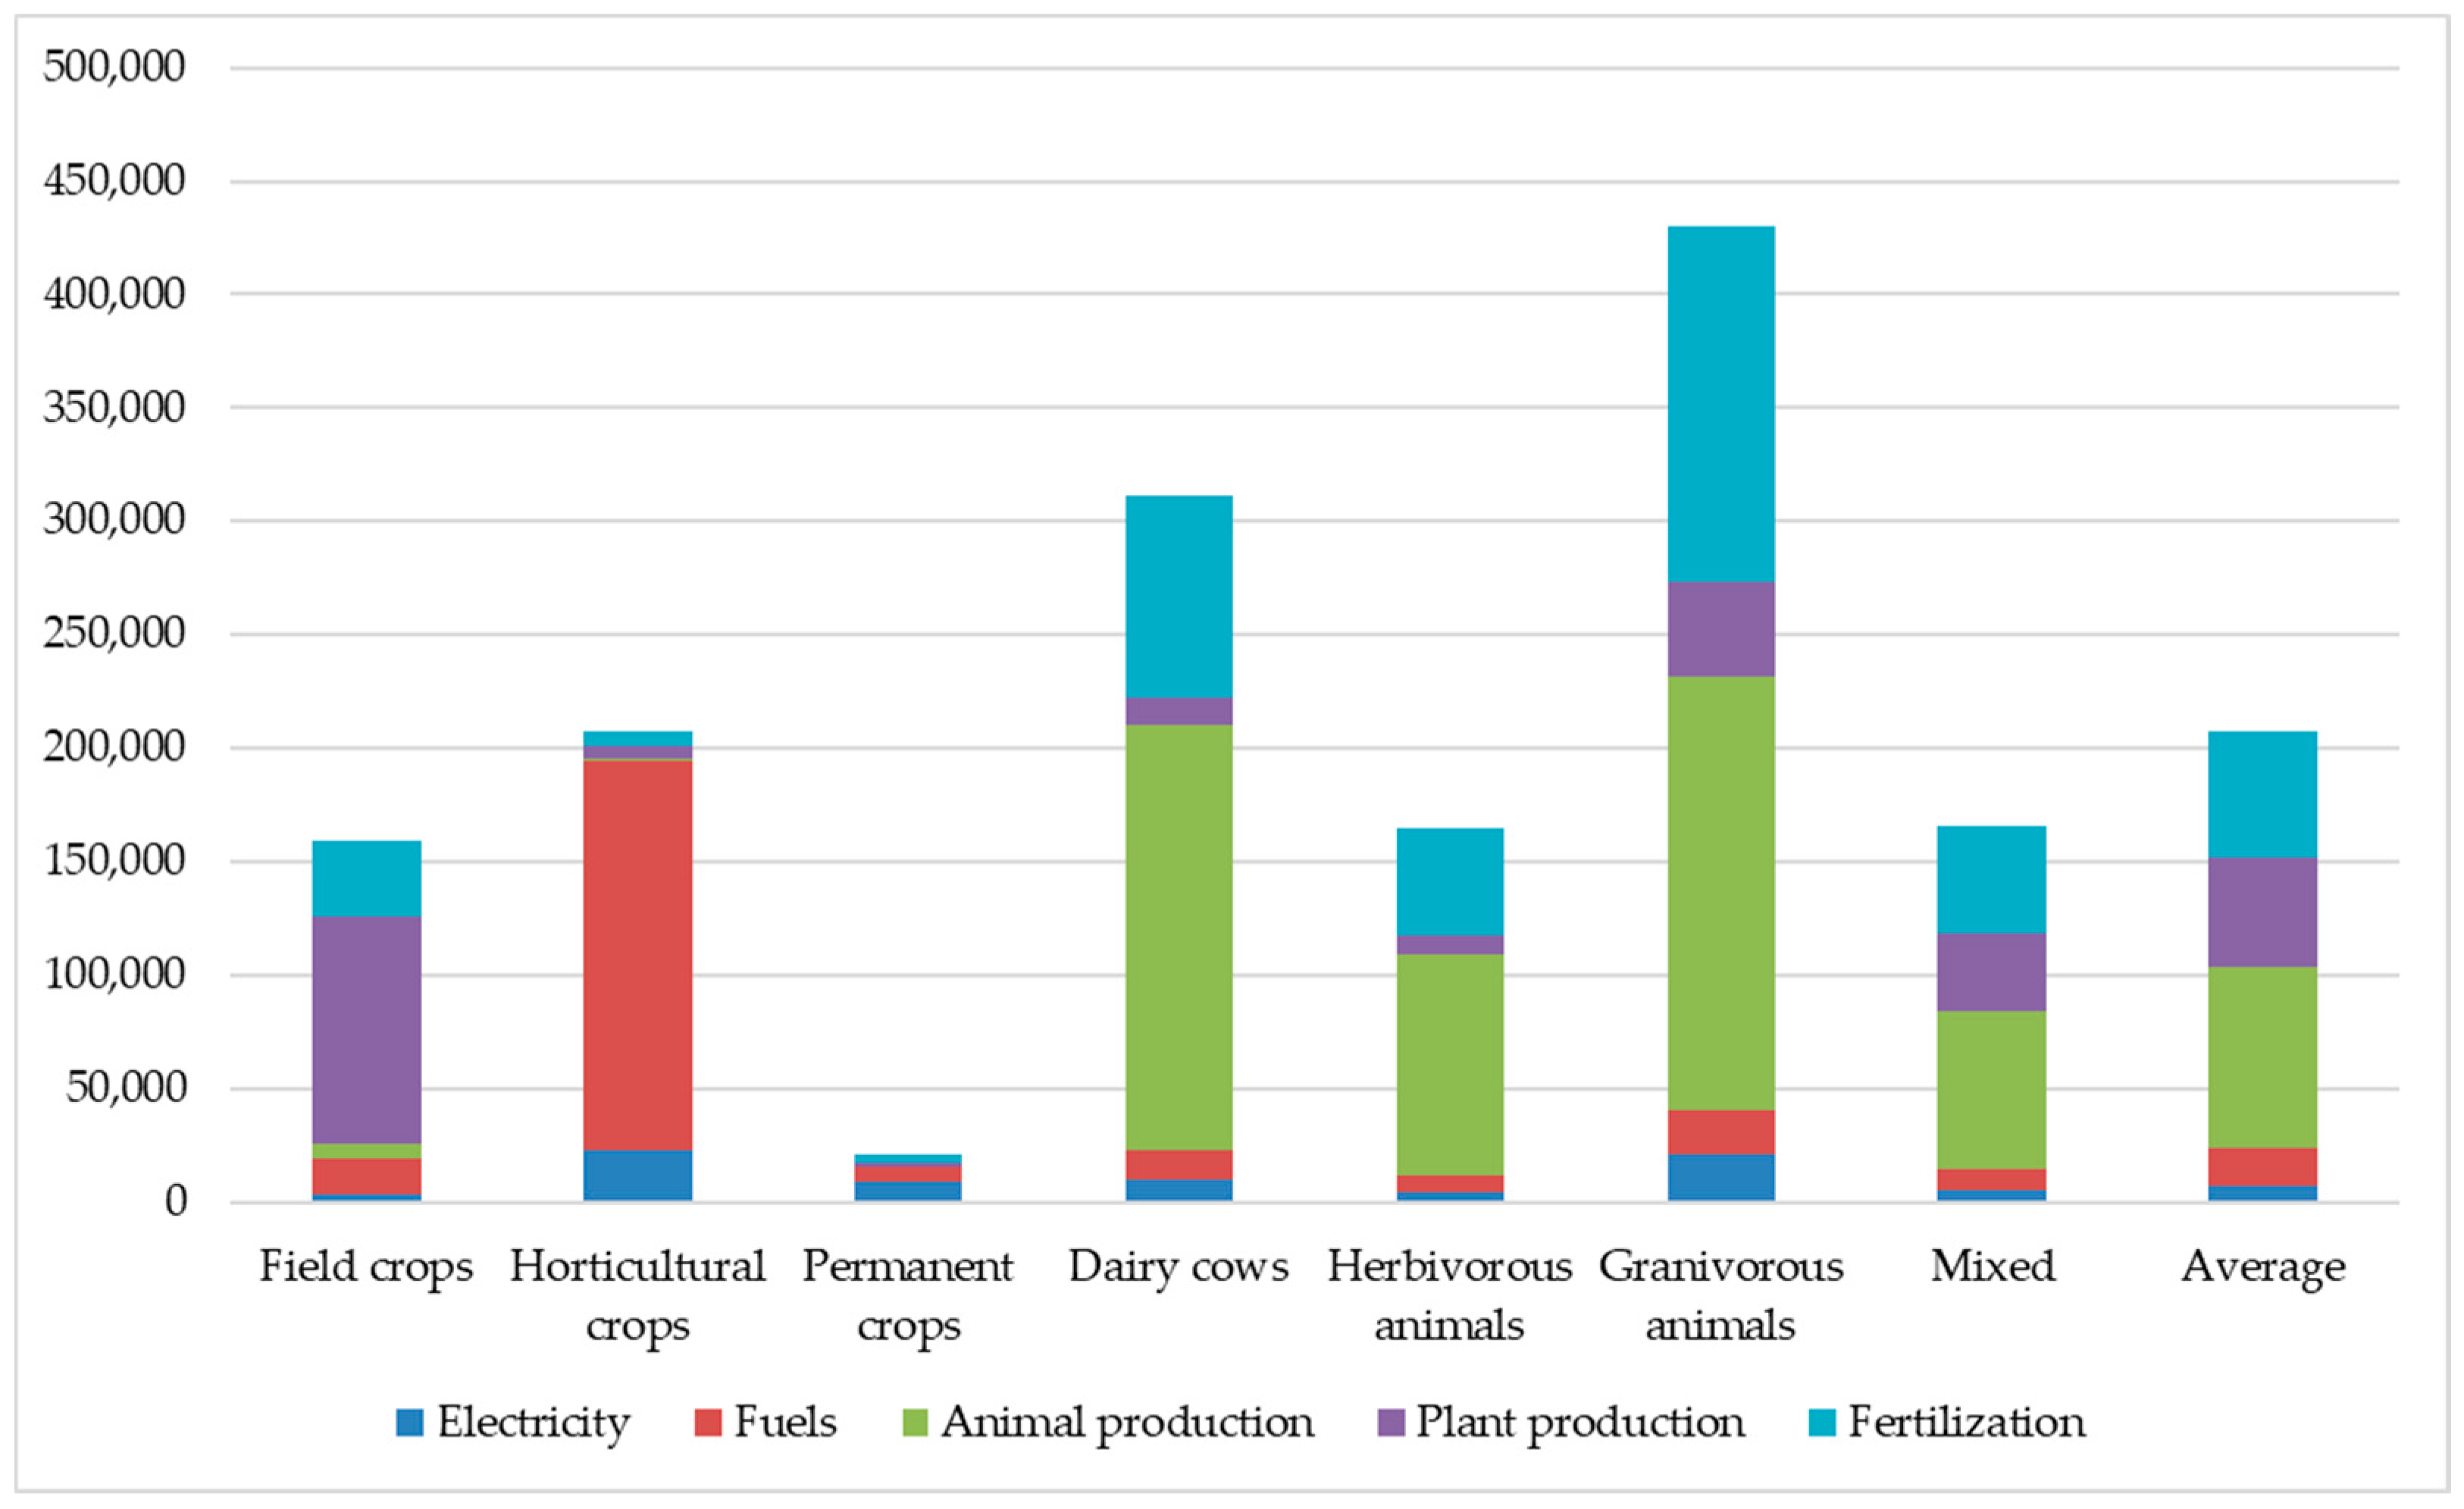
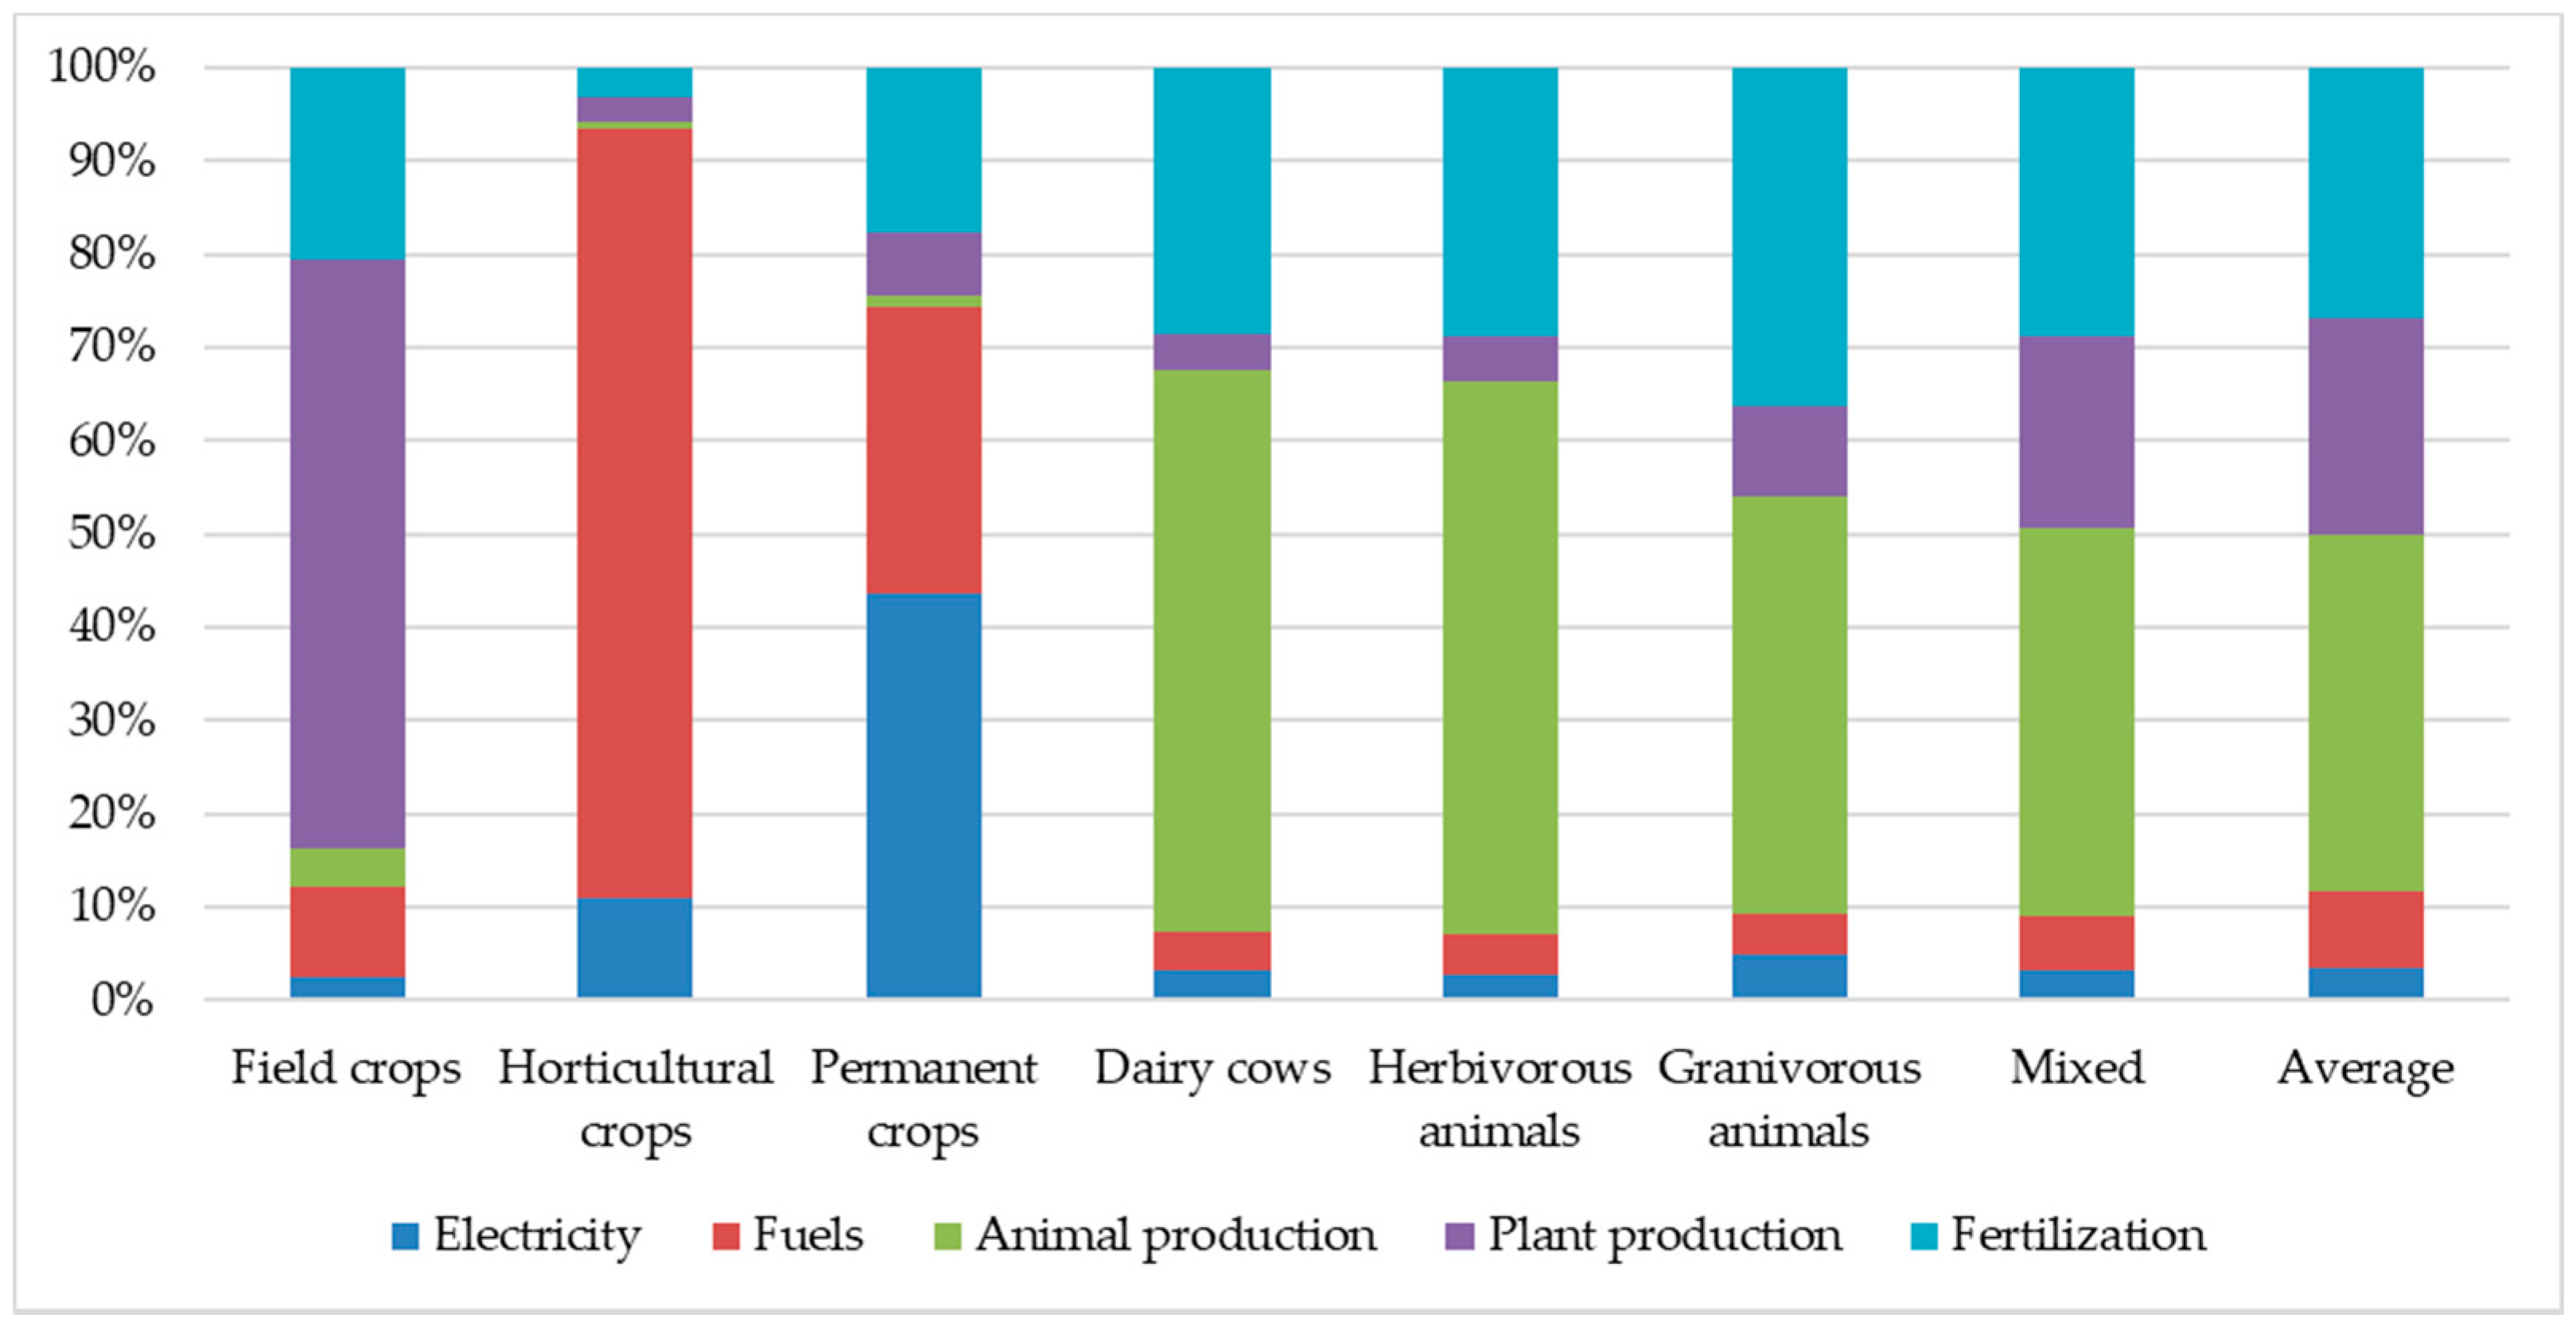
4.3. GHG Emissions from Energy Carriers Depending on the Type of Farm
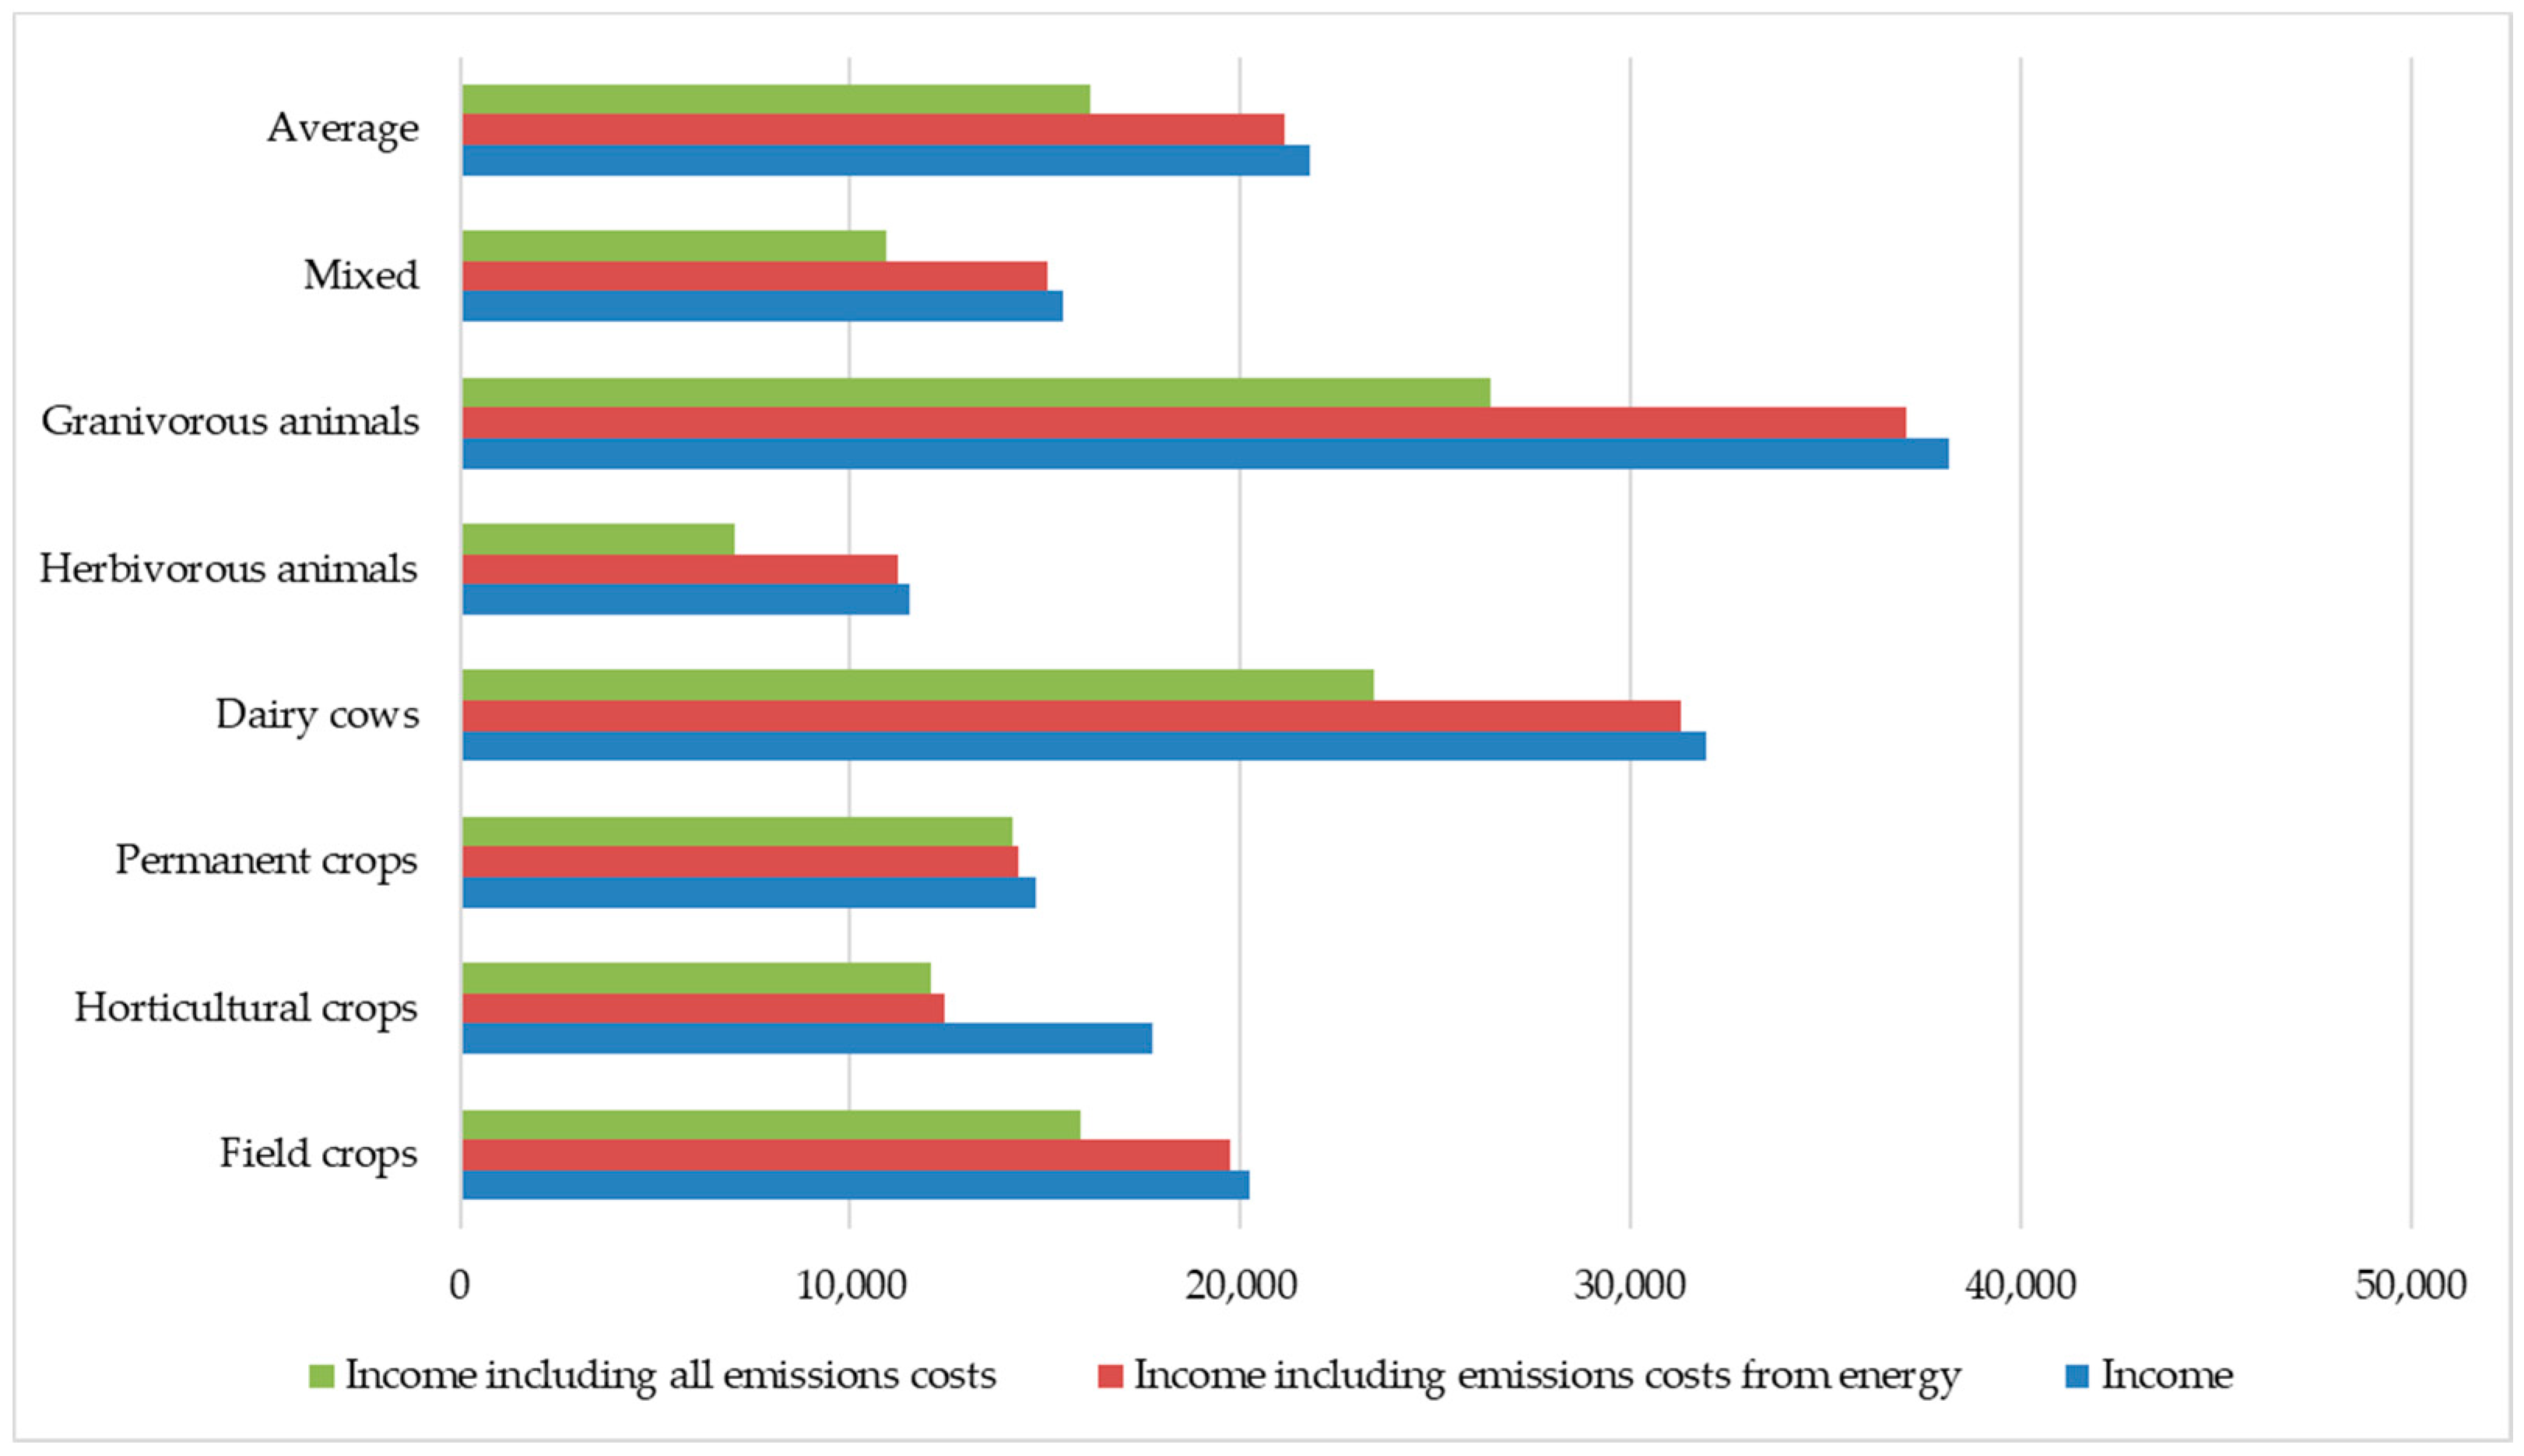
4.4. Farm Income and GHG Emission Costs from Energy Inputs
4.5. Outlook
- Reduction of emissions from nitrogen fertilizers:
- limiting the consumption of mineral fertilizers,
- selection of appropriate forms of nitrogen fertilizers,
- use of inhibitors,
- maintaining an appropriate soil pH [87].
- Carbon retention in soil and biomass.
- Breeding progress:
- increasing the area of legume crops,
- introducing more fats into the diet of ruminants [88],
- Genetic improvement of animals.
- Increasing energy efficiency, the use of renewable energy and improved sources of nuclear energy [91].
- Fossil fuel consumption reduction
- Cultivation without plowing (simplified cultivation)—although it is difficult to convince farmers to this type of cultivation, it causes even a threefold decrease in GHG levels [92].
- Precision agriculture and precision agriculture technologies (PAT) [93]. One of the main tasks of precision agriculture is to optimize the use of agricultural inputs, fertilisers, fuel. From the point of view of GHG emissions, techniques that reduce the consumption of nitrogen fertilizers and the number of activities seem to be crucial. This allows a reduction in fuel consumption [94].
- Electrically powered agricultural tractors. Despite the serious obstacle of low battery capacity, agricultural tractor manufacturers are trying to placing them on the market. Two versions of the machines are tested: with batteries and with a cable connection to the power source [94,95]. There are also ideas for introducing agricultural tractors with modern combustion engines, powering electric motors.
- Technical progress in the construction of traditional combustion engines. 2020 is a transition period for engines below 75hp and above 175hp due to the introduction of the Stage V standard. Until 30 June 2020, manufacturers could install transition engines on their machines and market them until 31 December 2020. For machines with a capacity of 75–175 hp, the transition year is 2021 [96].
- Appropriate use of existing agricultural tractors. Appropriate management of tires and weights, use of start-stop systems, longer work sequence, eco-driving, replacing agricultural tractors with more energy-efficient machines [97].
- 2.
- Renewable energy
5. Conclusions
Author Contributions
Funding
Institutional Review Board Statement
Informed Consent Statement
Data Availability Statement
Conflicts of Interest
References
- Intergovernmental Panel on Climate Change (IPCC). Climate Change. The IPCC Scientific Assessment; Cambridge University Press: Cambridge, MA, USA, 1990; p. 202. [Google Scholar]
- Stern, N. The Structure of Economic Modelling of the Potential Impacts of Climate Change: Grafting Gross Underestimation of Risk onto Already Narrow Science Models. J. Econ. Lit. 2013, 51, 838–859. [Google Scholar] [CrossRef] [Green Version]
- Zachos, J.C.; Dickens, G.R.; Zeebe, R.E. An early Cenozoic perspective on greenhouse warming and carbon-cycle dynamics. Nature 2008, 451, 279–283. [Google Scholar] [CrossRef] [PubMed]
- Arrhenius, S. On the Influence of Carbonic Acid in the Air upon the Temperature of the Ground. Philos. Mag. J. Sci. 1896, 41, 268. [Google Scholar] [CrossRef] [Green Version]
- Revelle, R.; Suess, H.E. Carbon dioxide exchange between atmosphere and ocean and the question of an increase of atmospheric CO2 during the past decades. Tellus 1957, 9, 18–27. [Google Scholar] [CrossRef] [Green Version]
- Freudenburg, W.R.; Muselli, V. Global warming estimates, media expectations, and the asymmetry of scientific challenge. Glob. Environ. Chang. 2010, 20, 483–491. [Google Scholar] [CrossRef]
- Brysse, K.; Oreskes, N.; O’Reilly, J.; Oppenheimer, M. Climate change prediction: Erring on the side of least drama? Glob. Environ. Chang. 2013, 23, 327–337. [Google Scholar] [CrossRef]
- Hansen, J.; Sato, M.; Hearty, P.; Ruedy, R.; Kelley, M.; Masson-Delmotte, V.; Russell, G.; Tselioudis, G.; Cao, J.; Rignot, E.; et al. Ice melt, sea level rise and superstorms: Evidence from paleoclimate data, climate modeling, and modern observations that 2 °C global warming is highly dangerous. Atmos. Chem. Phys. Discuss. 2016, 16, 3761–3812. [Google Scholar] [CrossRef] [Green Version]
- Sherwood, S.C.; Huber, M. An adaptability limit to climate change due to heat stress. Proc. Natl. Acad. Sci. USA 2010, 107, 9552–9555. [Google Scholar] [CrossRef] [Green Version]
- Slater, T.; Hogg, A.E.; Mottram, R. Ice-sheet losses track high-end sea-level rise projections. Nat. Clim. Chang. 2020, 10, 879–881. [Google Scholar] [CrossRef]
- Kriegler, E.; Hall, J.W.; Held, H.; Dawson, R.; Schellnhuber, H.J. Imprecise probability assessment of tipping points in the climate system. Proc. Natl. Acad. Sci. USA 2009, 106, 5041–5046. [Google Scholar] [CrossRef] [Green Version]
- Lenton, T.M.; Livina, V.N.; Dakos, V.; van Nes, E.H.; Scheffer, M. Early warning of climate tipping points from critical slowing down: Comparing methods to improve robustness. Philos. Trans. R. Soc. A 2012, 370, 1185–1204. [Google Scholar] [CrossRef] [PubMed]
- Turetsky, M.R.; Abbott, B.W.; Jones, M.C.; Walter Anthony, K.M.; Olefeldt, D.; Schuur, E.A.G.; Grosse, G.; Kuhry, P.; Hugelius, G.; Koven, C.; et al. Carbon release through abrupt permafrost thaw. Nat. Geosci. 2020, 13, 138–143. [Google Scholar] [CrossRef]
- Intergovernmental Panel on Climate Change (IPCC). Climate Change and Land: An IPCC Special Report on Climate Change, Desertification, Land Degradation, Sustainable Land Management, Food Security, and Greenhouse Gas Fluxes in Terrestrial Ecosystems; IPCC: Geneva, Switzerland, 2019. [Google Scholar]
- Lal, R. Carbon emission from farm operations. Environ. Int. 2004, 30, 981–990. [Google Scholar] [CrossRef]
- Leclère, D.; Jayet, P.A.; de Noblet-Ducoudré, N. Farm-level autonomous adaptation of European agricultural supply to climate change. Ecol. Econ. 2013, 87, 1–14. [Google Scholar] [CrossRef]
- Brisson, N.; Gate, P.; Gouache, D.; Charmet, G.; Oury, F.X.; Huard, F. Why are wheat yields stagnating in Europe? A comprehensive data analysis for France. Field Crops Res. 2010, 119, 201–212. [Google Scholar] [CrossRef]
- Lobell, D.B.; Schlenker, W.; Costa-Roberts, J. Climate Trends and Global Crop Production since 1980. Science 2011, 333, 616–620. [Google Scholar] [CrossRef] [PubMed] [Green Version]
- Intergovernmental Panel on Climate Change (IPCC). Climate Change 2014: Impacts, Adaptation, and Vulnerability. Part. A: Global and Sectoral Aspects. Contribution of Working Group II to the Fifth Assessment Report of the Intergovernmental Panel on Climate Change; Cambridge University Press: Cambridge, MA, USA, 2014; p. 495. [Google Scholar]
- Godfray, H.C.J.; Beddington, J.R.; Crute, I.R.; Haddad, L.; Lawrence, D.; Muir, J.F.; Pretty, J.; Robinson, S.; Thomas, S.M.; Toulmin, C. Food Security: The Challenge of Feeding 9 Billion People. Science 2010, 327, 812–818. [Google Scholar] [CrossRef] [PubMed] [Green Version]
- Brown, L.R. Full Planet, Empty Plates: The New Geopolitics of Food Scarcity; W.W. Norton Company: New York, NY, USA; London, UK, 2012; p. 5. [Google Scholar]
- Food and Agricultural Organization of the United Nations (FAO). The State of the World’s Biodiversity for Food and Agriculture; FAO Commission on Genetic Resources for Food and Agriculture Assessment: Rome, Italy, 2019; Available online: http://www.fao.org/3/CA3129EN/CA3129EN.pdf (accessed on 5 May 2021).
- Food and Agricultural Organization of the United Nations (FAO); International Fund for Agricultural Development (IFAD); World Food Programme (WFP). The State of Food Insecurity in the World 2012. Economic Growth Is Necessary but Not Sufficient to Accelerate Reduction of Hunger and Malnutrition; Food and Agriculture Organization of the United Nations: Rome, Italy, 2012; p. 9. Available online: http://www.fao.org/3/i3027e/i3027e.pdf (accessed on 5 May 2021).
- Food and Agricultural Organization of the United Nations (FAO); International Fund for Agricultural Development (IFAD); United Nations Children’s Fund (UNICEF); World Food Programme (WFP); World Health Organization (WHO). The State of Food Security and Nutrition in the World 2020. Transforming Food Systems for Affordable Healthy Diets; Food and Agriculture Organization of the United Nations: Rome, Italy, 2020. [Google Scholar] [CrossRef]
- European Enviroment Agency (EEA). Climate Change, Impacts and Vulnerability in Europe 2016—An Indicator-Based Report; Publications Office of the European Union: Luxembourg, 2017; pp. 223–240. [Google Scholar] [CrossRef]
- Communication from the Commission to the European Parliament; the European Council; the Council; the European Economic and Social Committee; the Committee of the Regions and the European Investment Bank. A Clean Planet. for All—A European Strategic Long-Term Vision for a Prosperous, Modern, Competitive and Climate Neutral Economy; COM: Brussels, Belgium, 2018. [Google Scholar]
- Smil, V. Energy and Civilization—A History; MIT Press: Cambridge, MA, USA, 2017. [Google Scholar] [CrossRef]
- Solow, R.M. The Economics of Resources or the Resources of Economics. Am. Econ. Rev. 1974, 64, 1–14. [Google Scholar]
- Nordhaus, W.D. The Allocation of Energy Resources. Brook. Pap. Econ. Act. 1973, 4, 529–576. [Google Scholar] [CrossRef] [Green Version]
- Pfeiffer, D.A. Eating Fossil Fuels: Oil, Food, and the Coming Crisis in Agriculture; New Society Publishers: Gabriola Island, BC, Canada, 2006. [Google Scholar]
- Smil, V. Energy in Nature and Society: General Energetics of Complex Systems; MIT Press: Cambridge, MA, USA, 2008. [Google Scholar] [CrossRef]
- Martinho, V.D. Energy consumption across European Union farms: Efficiency in terms of farming output and utilized agricultural area. Energy 2016, 103, 543–556. [Google Scholar] [CrossRef]
- Veysset, P.; Lherm, M.; Bébin, D.; Roulenc, M.; Benoit, M. Variability in greenhouse gas emissions, fossil energy consumption and farm economics in suckler beef production in 59 French farms. Agric. Ecosyst. Environ. 2014, 188, 180–191. [Google Scholar] [CrossRef]
- Sefeedpari, P.; Rafiee, S.; Akram, A.; Komleh, S.H.P. Modeling output energy based on fossil fuels and electricity energy consumption on dairy farms of Iran: Application of adaptive neural-fuzzy inference system technique. Comput. Electron. Agric. 2014, 109, 80–85. [Google Scholar] [CrossRef]
- Ramedani, Z.; Rafiee, S.; Heidari, M. An investigation on energy consumption and sensitivity analysis of soybean production farms. Energy 2011, 36, 6340–6344. [Google Scholar] [CrossRef]
- Ilahi, S.; Wu, Y.; Raza, M.A.A.; Wei, W.; Imran, M.; Bayasgalankhuu, L. Optimization Approach for Improving Energy Efficiency and Evaluation of Greenhouse Gas Emission of Wheat Crop using Data Envelopment Analysis. Sustainability 2019, 11, 3409. [Google Scholar] [CrossRef] [Green Version]
- Khoshnevisan, B.; Rafiee, S.; Omid, M.; Mousazadeh, H. Applying data envelopment analysis approach to improve energy efficiency and reduce GHG (greenhouse gas) emission of wheat production. Energy 2013, 58, 588–593. [Google Scholar] [CrossRef]
- Saldukaitė, L.; Šarauskis, E.; Lekavičienė, K.; Savickas, D. Predicting energy efficiency and greenhouse gases reduction potential under different tillage management and farm size scenarios for winter wheat production. Sustain. Energy Technol. Assess. 2020, 42. [Google Scholar] [CrossRef]
- Yan, Q.; Yin, J.; Baležentis, T.; Makutėnienė, D.; Štreimikienė, D. Energy-related GHG emission in agriculture of the European countries: An application of the Generalized Divisia Index. J. Clean. Prod. 2017, 164, 686–694. [Google Scholar] [CrossRef]
- Li, T.; Baležentis, T.; Makutėnienė, D.; Streimikiene, D.; Kriščiukaitienė, I. Energy-related CO2 emission in European Union agriculture: Driving forces and possibilities for reduction. Appl. Energy 2016, 180, 682–694. [Google Scholar] [CrossRef]
- Dyer, J.; Desjardins, R. Simulated Farm Fieldwork, Energy Consumption and Related Greenhouse Gas Emissions in Canada. Biosyst. Eng. 2003, 85, 503–513. [Google Scholar] [CrossRef]
- Simplified Energy Balances. Available online: https://appsso.eurostat.ec.europa.eu/nui/show.do?dataset=nrg_bal_s&lang=en (accessed on 5 May 2021).
- Agri-Environmental Indicator—Energy Use. Available online: https://ec.europa.eu/eurostat/statistics-explained/index.php/Agri-environmental_indicator_-_energy_use (accessed on 5 May 2021).
- Complete Energy Balances. Available online: https://appsso.eurostat.ec.europa.eu/nui/show.do?dataset=nrg_bal_c (accessed on 5 May 2021).
- Final Energy Consumption by Agriculture/Forestry per Hectare of Utilised Agricultural Area. Available online: http://appsso.eurostat.ec.europa.eu/nui/show.do?dataset=tai04&lang=en (accessed on 5 May 2021).
- Regulation No 79/65/EEC of the Council of 15 June 1965 Setting Up a Network for the Collection of Accountancy Data on the Incomes and Business Operation of Agricultural Holdings in the European Economic Community. Available online: https://eur-lex.europa.eu/legal-content/EN/TXT/PDF/?uri=CELEX:31965R0079&from=EN (accessed on 23 June 2021).
- Kelly, E.; Latruffe, L.; Desjeux, Y.; Ryan, M.; Uthes, S.; Diazabakana, A.; Dillon, E.; Finn, J. Sustainability indicators for improved assessment of the effects of agricultural policy across the EU: Is FADN the answer? Ecol. Indic. 2018, 89, 903–911. [Google Scholar] [CrossRef] [Green Version]
- Zieliński, M. Emisja Gazów Cieplarnianych a Wyniki Ekonomiczne Gospodarstw Specjalizujących się w Uprawach Polowych; Institute of Agricultural and Food Economics National Research Institute, Studia i Monografie: Warsaw, Poland, 2016; p. 71. [Google Scholar]
- Coderoni, S.; Bonati, G.; D’Angelo, L.; Longhitano, D.; Mambella, M.; Papaleo, A.; Vanino, S. Using FADN data to estimate agricultural GHG emissions at farm level. In Pacioli 20—Complex Farms and Sustainability in Farm Level Data Collection; Vrolijk, H., Ed.; LEIWageningen UR: The Hague, The Netherlands, 2013; pp. 86–102. [Google Scholar]
- Coderoni, S.; Esposti, R. CAP payments and agricultural GHG emissions in Italy. A farm-level assessment. Sci. Total Environ. 2018, 627, 427–437. [Google Scholar] [CrossRef]
- Syp, A.; Osuch, D. Assessing Greenhouse Gas Emissions from Conventional Farms Based on the Farm Accountancy Data Network. Pol. J. Environ. Stud. 2018, 27, 1261–1268. [Google Scholar] [CrossRef]
- Klepacki, B.; Gołasa, P.; Wysokiński, M. Efektywność emisji gazów cieplarnianych w rolnictwie w UE. Wieś i Rolnictwo 2016, 3, 129–144. [Google Scholar] [CrossRef]
- Dabkienė, V.; Baležentis, T.; Štreimikienė, D. Calculation of the carbon footprint for family farms using the Farm Accountancy Data Network: A case from Lithuania. J. Clean. Prod. 2020, 262. [Google Scholar] [CrossRef]
- Baldoni, E.; Coderoni, S.; Esposti, R. The productivity and environment nexus with farm-level data. The Case of Carbon Footprint in Lombardy FADN farms. Bio-Based Appl. Econ. J. 2017, 6, 119–137. [Google Scholar] [CrossRef]
- The National Centre for Emission Management (KOBiZE) at the Institute of Environmental Protection—National Research Institute. Krajowy Raport Inwentaryzacyjny 2014. Inwentaryzacja Gazów Cieplarnianych w Polsce dla lat 1988–2012; The National Centre for Emission Management: Warsaw, Poland, 2014. [Google Scholar]
- The National Centre for Emission Management (KOBiZE) at the Institute of Environmental Protection—National Research Institute. Poland’s National Inventory Report 2017. Greenhouse Gas. Inventory for 1988–2015; The National Centre for Emission Management: Warsaw, Poland, 2017. [Google Scholar]
- Intergovernmental Panel on Climate Change (IPCC). Revised 1996 IPCC Guidelines for National Greenhouse Gas. Inventories; Intergovernmental Panel for Climate Change: Geneva, Switzerland, 1996. [Google Scholar]
- Intergovernmental Panel on Climate Change (IPCC). IPCC Guidelines for National Greenhouse Gas—Inventories 2006, Volume 4 Agriculture, Forestry and Other Land Use; Institute for Global Environmental Strategies: Hayama, Japan, 2006. [Google Scholar]
- The National Centre for Emission Management (KOBiZE) at the Institute of Environmental Protection—National Research Institute. Wskaźniki emisyjności CO2, SO2, NOx, CO i Pyłu Całkowitego dla Energii Elektrycznej na Podstawie Informacji Zawartych w Krajowej Bazie o Emisjach Gazów Cieplarnianych i Innych Substancji za 2018 rok; The National Centre for Emission Management: Warsaw, Poland, 2019. [Google Scholar]
- Intergovernmental Panel on Climate Change (IPCC). Climate Change 2013: Working Group I: The Physical Science Basis; Cambridge University Press: Cambridge, MA, USA, 2013. [Google Scholar]
- Aukcje Polskich Uprawnień do Emisji. Available online: https://www.kobize.pl/pl/article/aktualnosci-2020/id/1717/aukcje-polskich-uprawnien-do-emisji (accessed on 5 May 2021).
- Prandecki, K.; Gajos, E. Ekonomiczna Wycena Emisji Wybranych Substancji do Powietrza w Polsce ze Szczególnym Uwzględnieniem Rolnictwa. Kwartalnik Naukowy Uczelni Vistula 2017, 3, 189–207. Available online: http://cejsh.icm.edu.pl/cejsh/element/bwmeta1.element.desklight-537927e7-daaf-4405-bc01-637fcd3b30a4 (accessed on 5 May 2021).
- Tol, R.S.J. On the Uncertainty About the Total Economic Impact of Climate Change. Environ. Resour. Econ. 2012, 53, 97–116. [Google Scholar] [CrossRef] [Green Version]
- Tubiello, F.N.; Salvatore, M.; Rossi, S.; Ferrara, A.; Fitton, N.; Smith, P. The FAOSTAT database of greenhouse gas emissions from agriculture. Environ. Res. Lett. 2013, 8. [Google Scholar] [CrossRef]
- Smith, P.; Martino, D.; Cai, Z.; Gwary, D.; Janzen, H.; Kumar, P.; McCarl, B.; Ogle, S.; O’Mara, F.; Rice, C.; et al. Policy and technological constraints to implementation of greenhouse gas mitigation options in agriculture. Agric. Ecosyst. Environ. 2007, 118, 6–28. [Google Scholar] [CrossRef]
- Mohammed, S.; Alsafadi, K.; Takács, I.; Harsányi, E. Contemporary changes of greenhouse gases emission from the agricultural sector in the EU-27. Geol. Ecol. Landsc. 2020, 4, 282–287. [Google Scholar] [CrossRef] [Green Version]
- Pérez Domínguez, I.; Fellmann, T.; Weiss, F.; Witzke, P.; Barreiro-Hurlé, J.; Himics, M.; Jansson, T.; Salputra, G.; Leip, A. An Economic Assessment of GHG Mitigation Policy Options for EU Agriculture (EcAMPA 2); JRC Science for Policy Report: Seville, Spain, 2016. [Google Scholar] [CrossRef]
- Greenhouse Gas Emissions by Source Sector. Available online: http://appsso.eurostat.ec.europa.eu/nui/show.do?dataset=env_air_gge&lang=en (accessed on 5 May 2021).
- Piwowar, A. Low-Carbon Agriculture in Poland: Theoretical and Practical Challenges. Pol. J. Environ. Stud. 2019, 28, 2785–2792. [Google Scholar] [CrossRef]
- The National Centre for Emission Management (KOBiZE) at the Institute of Environmental Protection—National Research Institute. Poland’s National Inventory Report 2019. Greenhouse Gas. Inventory for 1988–2017; The National Centre for Emission Management: Warsaw, Poland, 2019. [Google Scholar]
- Rokicki, T.; Koszela, G.; Ochnio, L.; Golonko, M.; Żak, A.; Szczepaniuk, E.K.; Szczepaniuk, H.; Perkowska, A. Greenhouse Gas Emissions by Agriculture in EU Countries. Rocznik Ochrona Środowiska 2020, 22, 809–824. [Google Scholar]
- Balafoutis, A.; Beck, B.; Fountas, S.; Vangeyte, J.; Wal, T.V.d.; Soto, I.; Gómez-Barbero, M.; Barnes, A.; Eory, V. Precision Agriculture Technologies Positively Contributing to GHG Emissions Mitigation, Farm Productivity and Economics. Sustainability 2017, 9, 1339. [Google Scholar] [CrossRef] [Green Version]
- Measures at Farm Level to Reduce Greenhouse Gas Emissions from EU Agriculture. Available online: http://www.europarl.europa.eu/RegData/etudes/note/join/2014/513997/IPOL-AGRI_NT(2014)513997_EN.pdf (accessed on 5 May 2021).
- Gradziuk, P.; Gradziuk, B. Gospodarka niskoemisyjna—Nowe wyzwanie dla gmin wiejskich. Wieś i Rolnictwo 2016, 1, 105–126. [Google Scholar] [CrossRef]
- Steinfeld, H.; Gerber, P.J.; Wassenaar, T.; Castel, V.; Rosales, M.; de Haan, C. Livestock’s Long Shadow: Environmental Issues and Options; Food and Agriculture Organization of the United Nations: Rome, Italy, 2006. [Google Scholar]
- Intergovernmental Panel on Climate Change (IPCC). Climate Change 2014: Mitigation of Climate Change. Contribution of Working Group III to the Fifth Assessment Report of the Intergovernmental Panel on Climate Change; Cambridge University Press: Cambridge, MA, USA, 2014. [Google Scholar]
- MacLeod, M.J.; Vellinga, T.; Opio, C.; Falcucci, A.; Tempio, G.; Henderson, B.; Makkar, H.; Mottet, A.; Robinson, T.; Steinfeld, H.; et al. Invited review: A position on the Global Livestock Environmental Assessment Model (GLEAM). Animal 2018, 12, 383–397. [Google Scholar] [CrossRef] [PubMed] [Green Version]
- Wainwright, H.; Jordan, C.; Day, H. Environmental impact of production horticulture. In Horticulture: Plants for People and Places; Dixon, G.R., Aldous, D.E., Eds.; Springer: Dordrecht, The Netherlands, 2014; Volume 1, pp. 503–522. [Google Scholar]
- Gołasa, P.; Wysokiński, M.; Bieńkowska, W. Magazynowanie jabłek jako proces logistyczny w rolnictwie. Logistyka 2012, 6, 429–433. [Google Scholar]
- Akdemir, S.; Akcaoz, H.; Kizilay, H. An analysis of energy use and input costs for apple production in Turkey. J. Food Agric. Environ. 2012, 10, 473–479. [Google Scholar] [CrossRef]
- Król, E. Porównanie emisji zanieczyszczeń pojazdów z napędem elektrycznym i spalinowym. Napędy Sterow. 2017, 7/8, 140–143. [Google Scholar]
- Hedenus, F.; Wirsenius, S.; Johansson, D.J.A. The importance of reduced meat and dairy consumption for meeting stringent climate change targets. Clim. Chang. 2014, 124, 79–91. [Google Scholar] [CrossRef] [Green Version]
- World Health Organization (WHO). Healthy Diet; Fact. Sheet No. 394; WHO: Geneva, Switzerland, 2018; Available online: https://www.who.int/publications/m/item/healthy-diet-factsheet394 (accessed on 5 May 2021).
- Wirsenius, S.; Hedenus, F.; Mohlin, K. Greenhouse gas taxes on animal food products: Rationale, tax scheme and climate mitigation effects. Clim. Chang. 2010, 108, 159–184. [Google Scholar] [CrossRef]
- Edjabou, L.D.; Smed, S. The effect of using consumption taxes on foods to promote climate friendly diets—The case of Denmark. Food Policy 2013, 39, 84–96. [Google Scholar] [CrossRef]
- Pellerin, S.; Bamière, L.; Angers, D.; Béline, F.; Benoit, M.; Butault, J.-P.; Chenu, C.; Colnenne-David, C.; De Cara, S.; Delame, N.; et al. Identifying cost-competitive greenhouse gas mitigation potential of French agriculture. Environ. Sci. Policy 2017, 77, 130–139. [Google Scholar] [CrossRef] [Green Version]
- Sosulski, T.; Szymańska, M.; Szara, E. Assessment of various practices of the mitigation of N2O emissions from the arable soils of Poland. Soil Sci. Annu. 2017, 68, 55–64. [Google Scholar] [CrossRef]
- MacLeod, M.; Eory, V.; Gruère, G.; Lankoski, J. Cost-Effectiveness of Greenhouse Gas Mitigation Measures for Agriculture. OECD Food Agric. Fish. Pap. 2015, 89. [Google Scholar] [CrossRef]
- Piechota, G.; Igliński, B. Biomethane in Poland—Current status, potential, perspective and development. Energies 2021, 14, 1517. [Google Scholar] [CrossRef]
- Pilarski, G.; Kyncl, M.; Stegenta, S.; Piechota, G. Emission of biogas from sewage sludge in psychrophilic conditions. Waste Biomass Valorization 2020, 11, 3579–3592. [Google Scholar] [CrossRef]
- Haneklaus, N.; Schnug, E.; Tulsidas, H.; Tyobeka, B. Using high temperature gas-cooled reactors for greenhouse gas reduction and energy neutral production of phosphate fertilizers. Ann. Nucl. Energy 2015, 75, 275–282. [Google Scholar] [CrossRef]
- Syp, A.; Faber, A. Zastosowanie Modelu DNDC do Symulacji Plonów Roślin i Oceny Wpływu Zmian na Środowisko w Zmieniających Się Warunkach Klimatycznych i Różnych Systemach Uprawy. Roczniki Naukowe Stowarzyszenia Ekonomistów Rolnictwa i Agrobiznesu 2012, 14, 183–187. Available online: https://rnseria.com/resources/html/article/details?id=172128 (accessed on 9 June 2021).
- Soto Embodas, I.; Barnes, A.; Balafoutis, A.; Beck, B.; Sanchez Fernandez, B.; Vangeyte, J.; Fountas, S.; Van Der Wal, T.; Eory, V.; Gomez Barbero, M. The Contribution of Precision Agriculture Technologies to Farm Productivity and the Mitigation of Greenhouse Gas Emissions in the EU; Publications Office of the European Union: Luxembourg, 2019. [Google Scholar] [CrossRef]
- Future of Farming. Available online: https://www.deere.co.uk/en/agriculture/future-of-farming/ (accessed on 9 June 2021).
- Monarch Tractor: The World’s Smartest, Fully Electric, Autonomous Tractor. Available online: https://www.monarchtractor.com/monarch-blogs/#/news/1toEOumnkEksWakieoeC6M (accessed on 9 June 2021).
- Regulation (EU) 2016/1628 of the European Parliament and of the Council of 14 September 2016 on Requirements Relating to Gaseous and Particulate Pollutant Emission Limits and Type-Approval for Internal Combustion Engines for Non-Road Mobile Machinery, Amending Regulations (EU) No 1024/2012 and (EU) No 167/2013, and Amending and Repealing Di-rective 97/68/EC. Available online: https://eur-lex.europa.eu/legal-content/EN/TXT/PDF/?uri=CELEX:32016R1628&from=EN (accessed on 23 June 2021).
- Pellerin, S.; Bamière, L.; Angers, D.; Béline, F.; Benoît, M.; Butault, J.P.; Chenu, C.; Colnenne-David, C.; De Cara, S.; Delame, N.; et al. How Can French Agriculture Contribute to Reducing Greenhouse Gas Emissions? Abatement Potential and Cost of Ten Technical Measures; Synopsis of the Study Report; INRA: Paris, France, 2013; Available online: https://hal.inrae.fr/hal-02809908/document (accessed on 9 June 2021).
- Ocena Wpływu Polityki Klimatycznej na Sektor Polskich Gospodarstw Rolnych. Available online: http://climatecake.pl/wp-content/uploads/2020/07/CAKE_Rolnictwo_ocena_wplywu_polityki_klimatycznej_Podsumowanie_final.pdf (accessed on 5 May 2021).


| Countries | Energy Consumption by Agriculture in 2018 | Change 2018/2004 (%) | Total Energy Consumption in 2018 | Change 2018/2004 (%) | Share of Energy Consumption by Agriculture in Final Energy Consumption in 2018 | Change 2018/2004 (pp.) |
|---|---|---|---|---|---|---|
| EU-28 * | 25,166 | −5.4 | 860,754 | −5.4 | 3.2 | 0.0 |
| Belgium | 792 | −3.0 | 33,111 | −5.2 | 2.4 | 0.1 |
| Bulgaria | 185 | −33.0 | 9750 | 6.5 | 1.9 | −1.1 |
| Czechia | 619 | 11.2 | 24,180 | −3.7 | 2.6 | 0.3 |
| Denmark | 596 | −13.8 | 14,070 | −3.9 | 4.2 | −0.5 |
| Estonia | 124 | 18.4 | 2889 | 3.7 | 4.3 | 0.5 |
| Ireland | 223 | −28.8 | 11,219 | 0.2 | 2.0 | −0.8 |
| Greece | 264 | −76.3 | 15,169 | −23.0 | 1.7 | −3.9 |
| Spain | 2458 | −26.6 | 82,020 | −9.4 | 3.0 | −0.7 |
| France | 4089 | −3.2 | 139,829 | −7.7 | 2.9 | 0.1 |
| Croatia | 211 | −0.7 | 6682 | −3.6 | 3.2 | 0.1 |
| Italy | 2798 | −5.5 | 114,422 | −10.7 | 2.4 | 0.1 |
| Cyprus | 42 | 332.7 | 1581 | 3.8 | 2.7 | 2.0 |
| Latvia | 181 | 44.8 | 4025 | 4.3 | 4.5 | 1.3 |
| Lithuania | 108 | 2.3 | 5446 | 24.8 | 2.0 | −0.4 |
| Luxembourg | 24 | 8.6 | 3737 | −5.6 | 0.6 | 0.1 |
| Hungary | 641 | 9.3 | 17,865 | 4.8 | 3.6 | 0.1 |
| Malta | 5 | − | 515 | 50.5 | 0.9 | 0.9 |
| Netherlands | 3647 | −3.3 | 44,933 | −9.4 | 8.1 | 0.5 |
| Austria | 529 | −3.5 | 26,036 | 3.7 | 2.0 | −0.2 |
| Poland | 3918 | −8.9 | 69,983 | 23.3 | 5.6 | −2.0 |
| Portugal | 382 | −28.6 | 16,201 | −11.0 | 2.4 | −0.6 |
| Romania | 566 | 144.0 | 23,445 | −1.3 | 2.4 | 1.4 |
| Slovenia | 73 | −1.3 | 4940 | 0.1 | 1.5 | 0.0 |
| Slovakia | 133 | −18.0 | 9912 | 0.3 | 1.3 | −0.3 |
| Finland | 688 | −6.7 | 25,074 | 0.6 | 2.7 | −0.2 |
| Sweden | 613 | −19.7 | 31,777 | −1.7 | 1.9 | −0.4 |
| United Kingdom | 1257 | 46.2 | 121,944 | −12.2 | 1.0 | 0.4 |
| Symbol | Name | Description of the Type of Farm |
|---|---|---|
| 1 | Field crops | Specializing in the cultivation of cereals (including rice), oilseeds, and protein crops for seeds |
| 2 | Horticultural crops | Specializing in outdoor horticulture, under high cover, (vegetables, strawberries, flowers, and ornamental plants) and the cultivation of mushrooms and in nursery and horticulture |
| 3 | Vineyards | Specializing in viticulture |
| 4 | Permanent crops | Specializing in the cultivation of fruit trees and shrubs |
| 5 | Dairy cows | Specializing in dairy cattle farming |
| 6 | Herbivorous animals | Specializing in rearing cattle for slaughter (including breeding), sheep, goats, and other animals fed on roughage |
| 7 | Granivorous animals | Specializing in rearing pigs, poultry, and other animals fed with concentrated fodder |
| 8 | Mixed | Mixed-different crops, different animals |
| Description | Unit | Type of Farm | Average | ||||||
|---|---|---|---|---|---|---|---|---|---|
| Field Crops | Horticultural Crops | Permanent Crops | Dairy Cows | Herbivorous Animals | Granivorous Animals | Mixed | |||
| Sample size | pcs. | 3922 | 304 | 445 | 2665 | 735 | 729 | 3313 | − |
| Economic size | EUR | 38,380 | 80,157 | 24,251 | 50,189 | 27,662 | 120,671 | 37,008 | 45,432 |
| Labor inputs | AWU | 1.73 | 3.48 | 2.28 | 1.99 | 1.59 | 2.08 | 1.74 | 1.87 |
| Agricultural land area | ha | 47.89 | 7.21 | 13.14 | 31.99 | 27.76 | 33.77 | 29.68 | 35.04 |
| Total production value | EUR | 47,111 | 79,738 | 35,891 | 65,427 | 23,821 | 144,360 | 40,855 | 54,272 |
| The value of livestock production | EUR | 1790 | 292 | 126 | 57,532 | 17,321 | 118,932 | 22,073 | 27,470 |
| The value of plant production | EUR | 44,931 | 79,257 | 35,311 | 7642 | 5973 | 24,974 | 18,519 | 26,462 |
| Income from the farm | EUR | 20,263 | 17,744 | 14,747 | 31,918 | 11,551 | 38,177 | 15,458 | 21,794 |
| Income per full-time employee | EUR | 13,844 | 10,033 | 9612 | 16,699 | 7393 | 22,036 | 9239 | 13,197 |
| Emission Source | Emission Factor | Reference |
|---|---|---|
| X1—Energy production for agriculture | Energy consumption [MWh] × Factors of the produced electricity for the end-user [1 MWh = 781 kg CO2] | [59] |
| X2—Combustion of fuels in agriculture | Fuel consumption x Emission factor for fuels [Diesel: 1 GJ = 74.1 t CO2; Petrol: 1 GJ = 69.3 t CO2] | |
| X3—Intestinal fermentation | Number of animals of a certain species and age × Emission factor for species and age × 28 (Global Warming Potential-GWP) [Emission factor: from 5 kg CH4/year for goats to 75.59 kg CH4/year for bulls over 2 years of age] | [56,60] |
| X4—Methane emissions from livestock manure | Number of animals per species × Emission factor for species × 28 (GWP) [Emission factor for species: from 0.02 kg CH4/year for broilers to 11.87 kg CH4/year for dairy cows] | [56] |
| X5—Direct emission of nitrous oxide from livestock manure | Number of animals of a certain species and age × Emission factor for species and age (Nex) × N2O-N to N2O conversion factor × 265 (GWP) [Nex: from 1 kg N2O/year for turkeys to 83 kg N2O/year for dairy cows; N2O-N to N2O conversion factor = 44/28] | [56] |
| X6—Indirect emission of nitrous oxide from livestock manure | Composed of two processes: Indirect N2O emissions due to volatilization of N from manure management and Indirect N2O emissions due to leaching from manure management | [58] Equations: 10.27 and 10.29 |
| X7—Use of mineral fertilizers | Amount of mineral fertilizers applied × Fertilizer emission factor × 44/28 × 265 (GWP) [Fertilizer emission factor = 0.01 kg N2O out of 1 kg of N] | [56,58] |
| X8—Use of organic fertilizers | Amount of organic fertilizers applied × Fertilizer emission factor × 44/28 × 265 (GWP) [Fertilizer emission factor = 0.01 kg N2O out of 1 kg of N] | [56,58] |
| X9—Animal manure on pastures and grasslands | Number of animals of a certain species and age × Emission factor for species and age (Nex) × Pasture maintenance factor × Emission factor for manure from grazing animals × 265 (GWP) [Pasture maintenance factor-from 0.103 (dairy cows) to 0.44 (sheep); Emission factor for manure from grazing animals–0.2 for cattle and pigs and 0.01 for sheep, goats, and horses] | [56,58] |
| X10—Plant residues | Annual harvest of a given crop × Dry matter share × Nitrogen content in biomass × (1—Share of burnt biomass−Share of biomass removed from the field) | [56,58] |
| X11—Nitrogen deposition from the atmosphere (indirect emissions) | Annual amount of mineral fertilizers × Factor of nitrogen participation in fertilizers emitted in the form of NH3 and NOx + Annual amount of organic fertilizers + Annual amount of animal manure on pastures x Factor of the share of nitrogen from the manure emitted in the form of NH3 and NOx × 44/28 × 265 (GWP) [Factor of nitrogen participation in fertilizers emitted in the form of NH3 and NOx = 0.01; Factor of the share of nitrogen from the manure emitted in the form of NH3 and NOx = 0.2] | [56,58] |
| X12—Leaching and oxidation of nitrogen from the ground (indirect emissions) | (Annual amount of mineral fertilizers + Annual amount of organic fertilizers + Annual amount of plant residues) × Factor of the share of nitrogen leached from the ground into the waters × Emission factor of leached nitrogen × 44/28 × 265 (GWP) [Factor of the share of nitrogen leached from the ground into the waters = 0.3; Emission factor of leached nitrogen = 0.0075] | [56,58,60] |
| X13—Liming | Annual amount of calcium fertilizers CaCO3 × CaCO3 emission factor + Annual amount of calcium fertilizers CaMg(CaCO3)2 × CaMg(CaCO3)2 emission factor [CaCO3 emission factor = 0.12; CaMg(CaCO3)2 emission factor = 0.13] | [56,58] |
| X14—Burning crop residues | (Annual harvest of a given crop × Dry matter share × Nitrogen content in biomass × Share of burnt biomass × Combustion efficiency) × Carbon content in biomass = Total amount of carbon released | [56,58] |
| X15—Urea fertilization | Amount of urea used during the year × Emission factor × Conversion factor [Emission factor = 0.2 kg C/kg N; Conversion factor of C in CO2 = 44/12] | [56,58] |
| Greenhouse Gas | Global Warming Potential (GWP) |
|---|---|
| CO2 | 1 |
| CH4 | 28 |
| N2O | 265 |
| SF6 | 23,500 |
| NF3 | 16,100 |
| Countries | Energy Inputs 2018 (TJ) | Change 2018/2004 (%) | GHG Emissions 2018 (t) | Change 2018/2004 (%) | Emissivity of Energy Inputs 2004 (t GHG/TJ) | Emissivity of Energy Inputs 2018 (t GHG/TJ) | Change 2018/2004 (%) |
|---|---|---|---|---|---|---|---|
| EU-28 | 1,193,555 | 3.1 | 103,671,715 | 5.6 | 84.80 | 86.86 | 2.4 |
| Slovenia | 3059 | −1.3 | 219,729 | −4.9 | 74.54 | 71.82 | −3.6 |
| Ireland | 9355 | −28.8 | 972,756 | −24.0 | 97.37 | 103.98 | 6.8 |
| Croatia | 8821 | 2.1 | 658,303 | 0.5 | 75.79 | 74.63 | −1.5 |
| Estonia | 5199 | 18.4 | 447,061 | 7.2 | 95.00 | 85.98 | −9.5 |
| Italy | 117,157 | −5.5 | 11,117,330 | −3.2 | 92.64 | 94.89 | 2.4 |
| Portugal | 15,992 | −28.6 | 1,704,399 | −19.7 | 94.83 | 106.58 | 12.4 |
| Spain | 102,896 | −26.6 | 9,691,288 | −20.7 | 87.24 | 94.19 | 8.0 |
| Luxembourg | 990 | 8.6 | 75,993 | −5.6 | 88.35 | 76.76 | −13.1 |
| Latvia | 7565 | 44.8 | 576,977 | 42.5 | 77.48 | 76.27 | −1.6 |
| Bulgaria | 7757 | −33.0 | 690,938 | −23.7 | 78.26 | 89.07 | 13.8 |
| France | 171,192 | −3.2 | 15,890,349 | 0.1 | 89.77 | 92.82 | 3.4 |
| Malta | 203 | − | 19,327 | − | − | 95.14 | − |
| Romania | 23,690 | 144.0 | 1,979,516 | 122.5 | 91.61 | 83.56 | −8.8 |
| Hungary | 26,834 | 9.3 | 2,167,087 | 7.3 | 82.19 | 80.76 | −1.7 |
| Poland | 164,050 | −8.9 | 13,125,832 | −6.6 | 78.07 | 80.01 | 2.5 |
| Germany | 139,904 | 1573.4 | 10,392,644 | 7231.5 | 16.96 | 74.28 | 338.1 |
| Czechia | 25,933 | 11.2 | 1,937,408 | −9.7 | 91.98 | 74.71 | −18.8 |
| Denmark | 24,938 | −13.8 | 2,555,070 | −13.9 | 102.56 | 102.46 | −0.1 |
| Cyprus | 1776 | 332.7 | 210,908 | 142.8 | 211.65 | 118.76 | −43.9 |
| Slovakia | 5555 | −18.0 | 415,070 | −38.2 | 99.20 | 74.72 | −24.7 |
| Finland | 28,822 | −6.7 | 2,379,596 | −9.4 | 84.96 | 82.56 | −2.8 |
| Sweded | 25,656 | −19.7 | 1,831,157 | −9.5 | 63.37 | 71.37 | 12.6 |
| Austria | 22,156 | −3.5 | 1,664,652 | −0.5 | 72.83 | 75.13 | 3.2 |
| Lithuania | 4507 | 2.3 | 373,509 | 2.5 | 82.66 | 82.87 | 0.2 |
| Belgium | 33,148 | −3.0 | 2,841,637 | 6.3 | 78.23 | 85.73 | 9.6 |
| United Kingdom | 52,631 | 46.2 | 4,961,670 | 17.8 | 116.98 | 94.27 | −19.4 |
| Netherlands | 152,697 | −3.3 | 12,942,532 | 16.5 | 70.36 | 84.76 | 20.5 |
| Greece | 11,069 | −76.3 | 1,828,980 | −62.0 | 103.07 | 165.24 | 60.3 |
| Index | Field Crops | Horticultural Crops | Permanent Crops | Dairy Cows | Herbivorous Animals | Granivorous Animals | Mixed | Average |
|---|---|---|---|---|---|---|---|---|
| GHG from energy inputs (kg/ha) | 407.42 | 26,976.23 | 1178.09 | 724.65 | 422.35 | 1196.15 | 511.28 | 689.40 |
| Production value per kg GHG from energy inputs (EUR) | 2.41 | 0.41 | 2.32 | 2.82 | 2.03 | 3.57 | 2.69 | 2.25 |
Publisher’s Note: MDPI stays neutral with regard to jurisdictional claims in published maps and institutional affiliations. |
© 2021 by the authors. Licensee MDPI, Basel, Switzerland. This article is an open access article distributed under the terms and conditions of the Creative Commons Attribution (CC BY) license (https://creativecommons.org/licenses/by/4.0/).
Share and Cite
Gołasa, P.; Wysokiński, M.; Bieńkowska-Gołasa, W.; Gradziuk, P.; Golonko, M.; Gradziuk, B.; Siedlecka, A.; Gromada, A. Sources of Greenhouse Gas Emissions in Agriculture, with Particular Emphasis on Emissions from Energy Used. Energies 2021, 14, 3784. https://doi.org/10.3390/en14133784
Gołasa P, Wysokiński M, Bieńkowska-Gołasa W, Gradziuk P, Golonko M, Gradziuk B, Siedlecka A, Gromada A. Sources of Greenhouse Gas Emissions in Agriculture, with Particular Emphasis on Emissions from Energy Used. Energies. 2021; 14(13):3784. https://doi.org/10.3390/en14133784
Chicago/Turabian StyleGołasa, Piotr, Marcin Wysokiński, Wioletta Bieńkowska-Gołasa, Piotr Gradziuk, Magdalena Golonko, Barbara Gradziuk, Agnieszka Siedlecka, and Arkadiusz Gromada. 2021. "Sources of Greenhouse Gas Emissions in Agriculture, with Particular Emphasis on Emissions from Energy Used" Energies 14, no. 13: 3784. https://doi.org/10.3390/en14133784
APA StyleGołasa, P., Wysokiński, M., Bieńkowska-Gołasa, W., Gradziuk, P., Golonko, M., Gradziuk, B., Siedlecka, A., & Gromada, A. (2021). Sources of Greenhouse Gas Emissions in Agriculture, with Particular Emphasis on Emissions from Energy Used. Energies, 14(13), 3784. https://doi.org/10.3390/en14133784