
Utilizing Local Flexibility Resources to Mitigate Grid Challenges at Electric Vehicle Charging Stations


Abstract
1. Introduction
2. Materials and Methods
2.1. The INSPIRIA Charging Station
- Rooftop PV panels at the INSPIRIA Science Center;
- Battery storage at the INSPIRIA Science Center;
- Demand response at the INSPIRIA Science Center;
- Smart charging;
- Vehicle-to-grid/vehicle-to-building (V2G/V2B) applications.
2.2. Utilizing Local Flexibility Resources
2.2.1. Smart Charging
2.2.2. Battery Energy Storage
2.2.3. Vehicle-to-Grid and Vehicle-to-Building Applications
2.2.4. Solar Panels at the INSPIRIA Charging Station
3. Results
3.1. Optimal Mix of Flexibility Resources to Support the INSPIRIA Charging Station Operation
3.2. Strategy for Choice of Battery
3.2.1. Calculating of Flexibility Benefits under a Capacity Tariff Regime
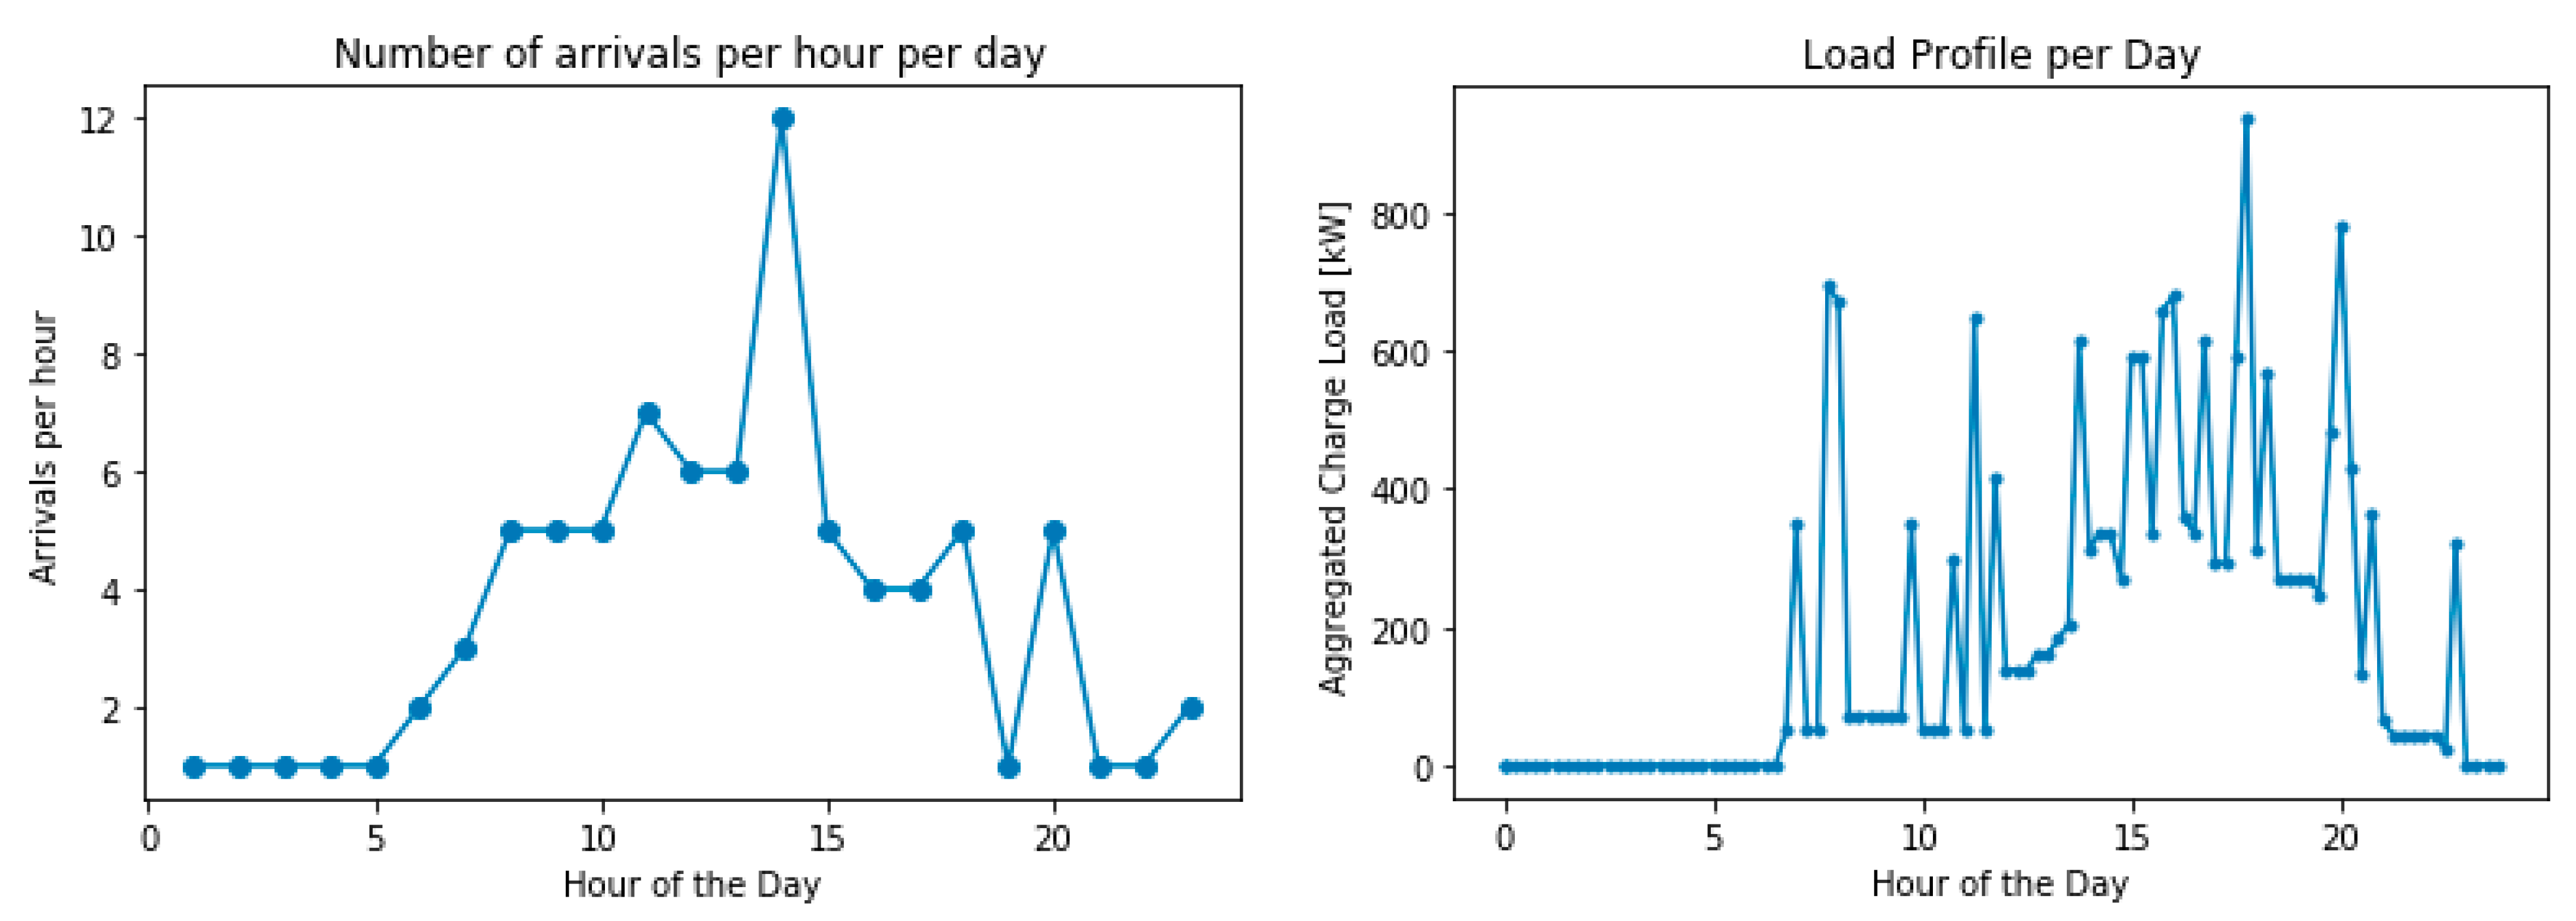
3.2.2. Load Requirements and Type of Charging
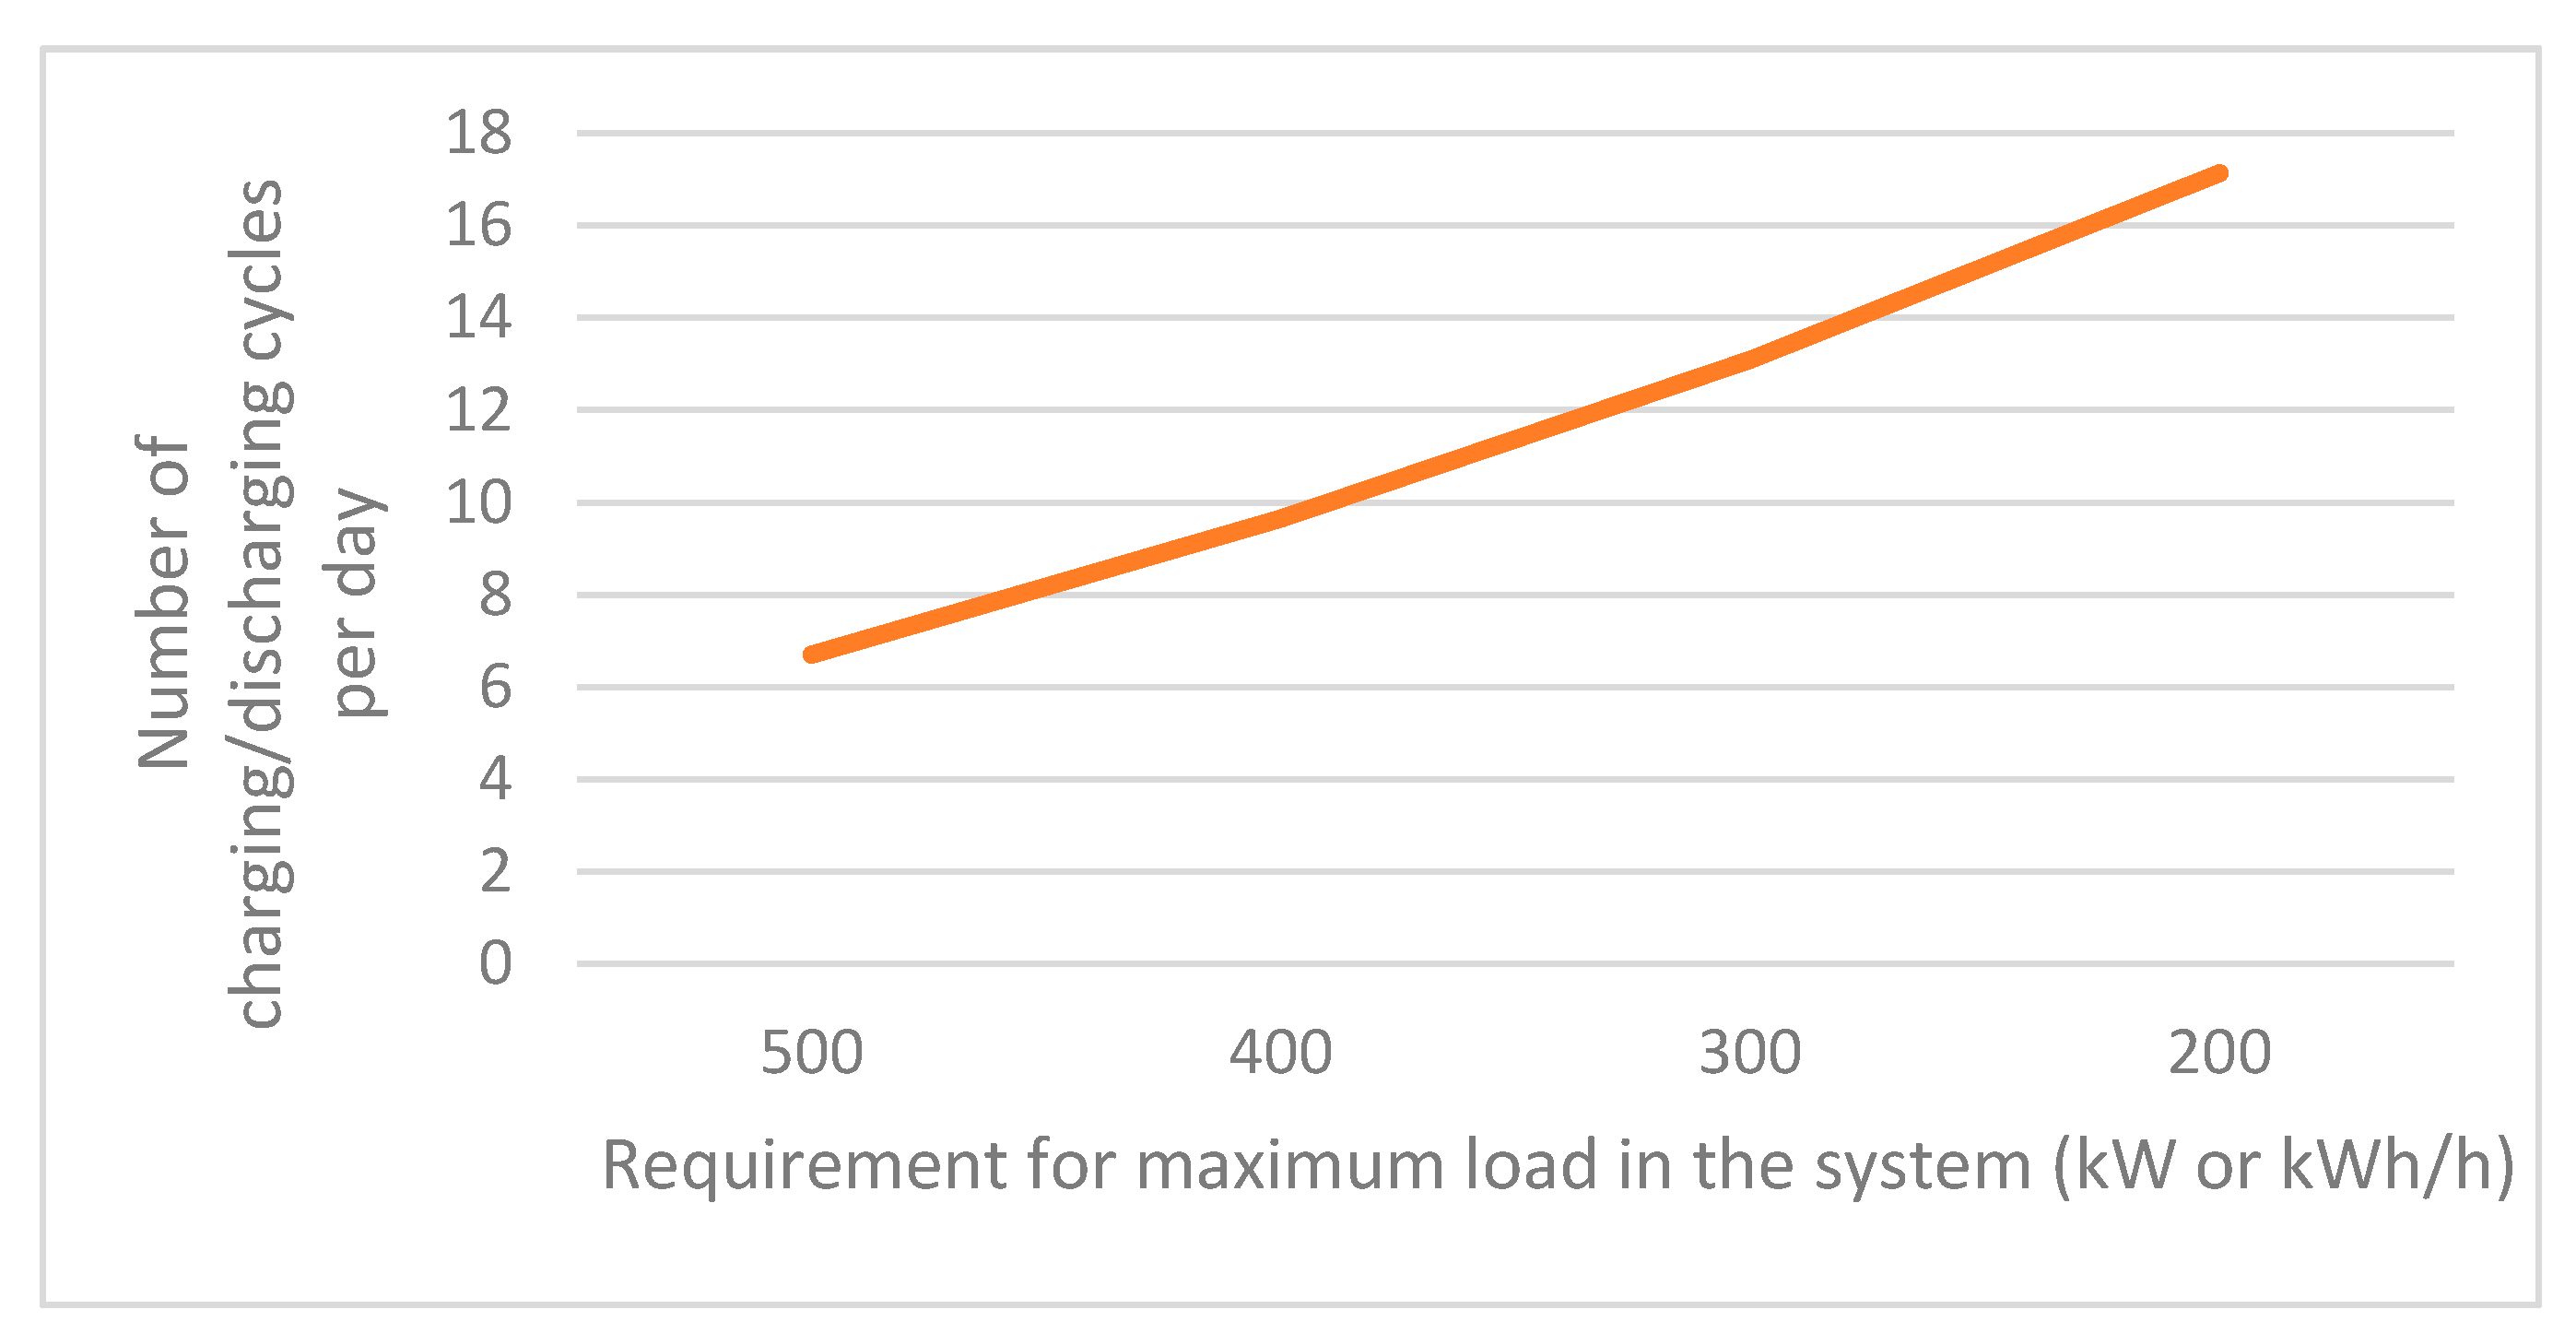
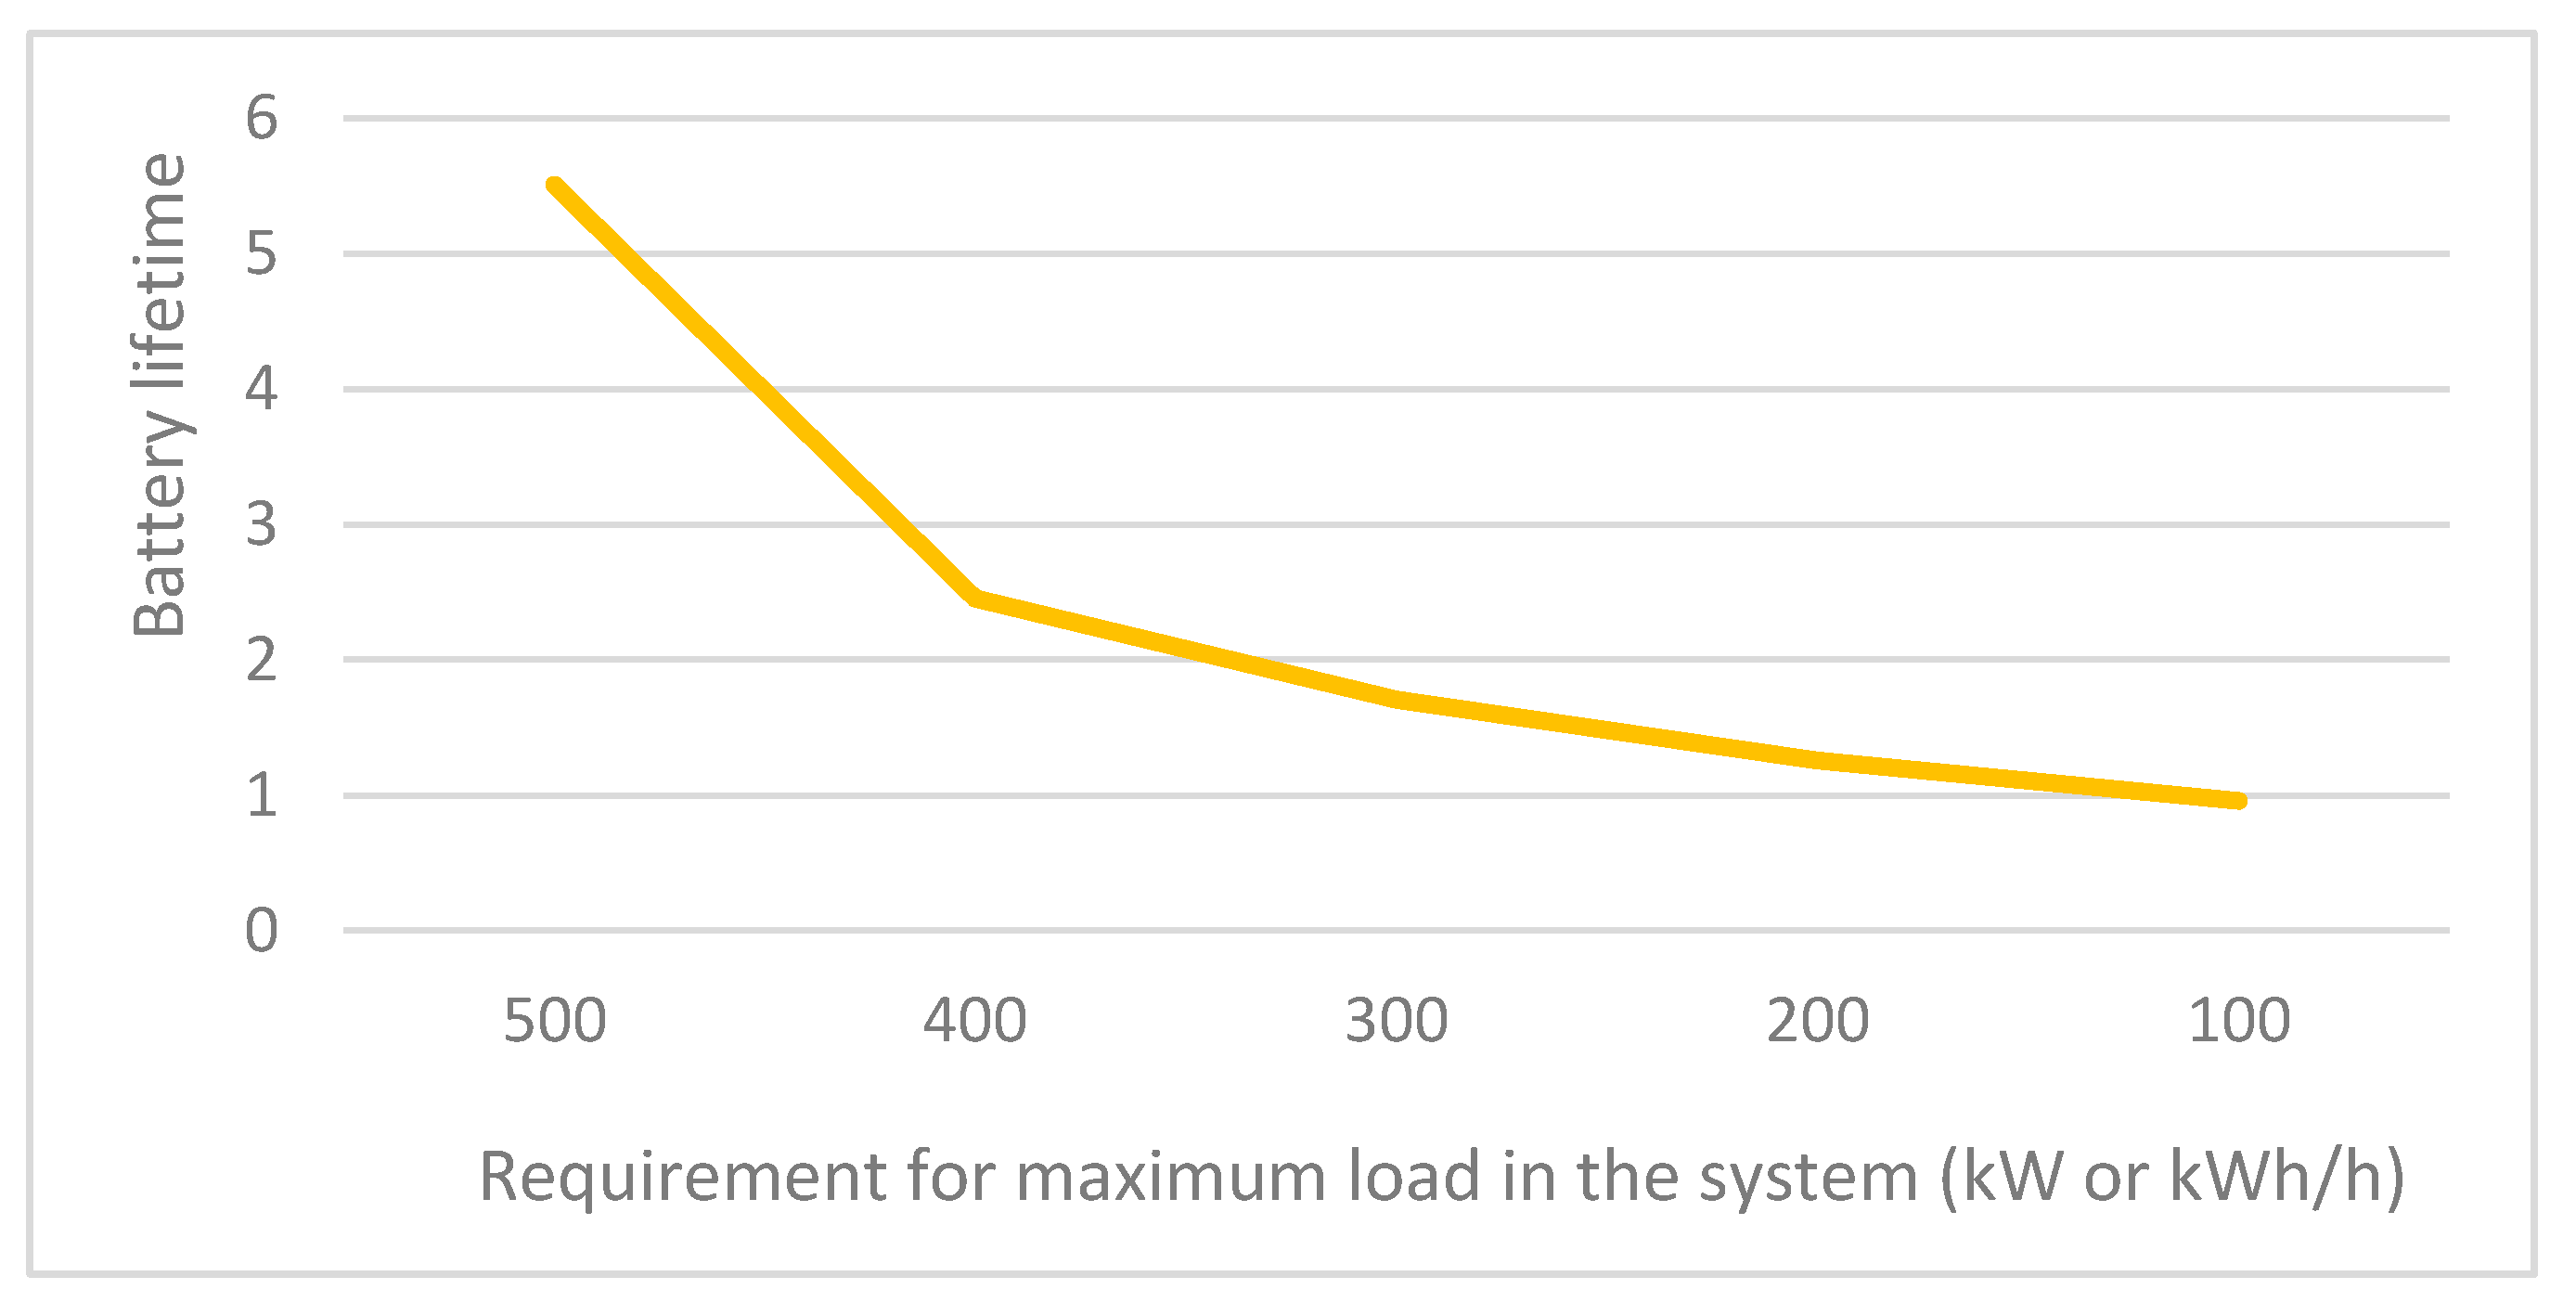
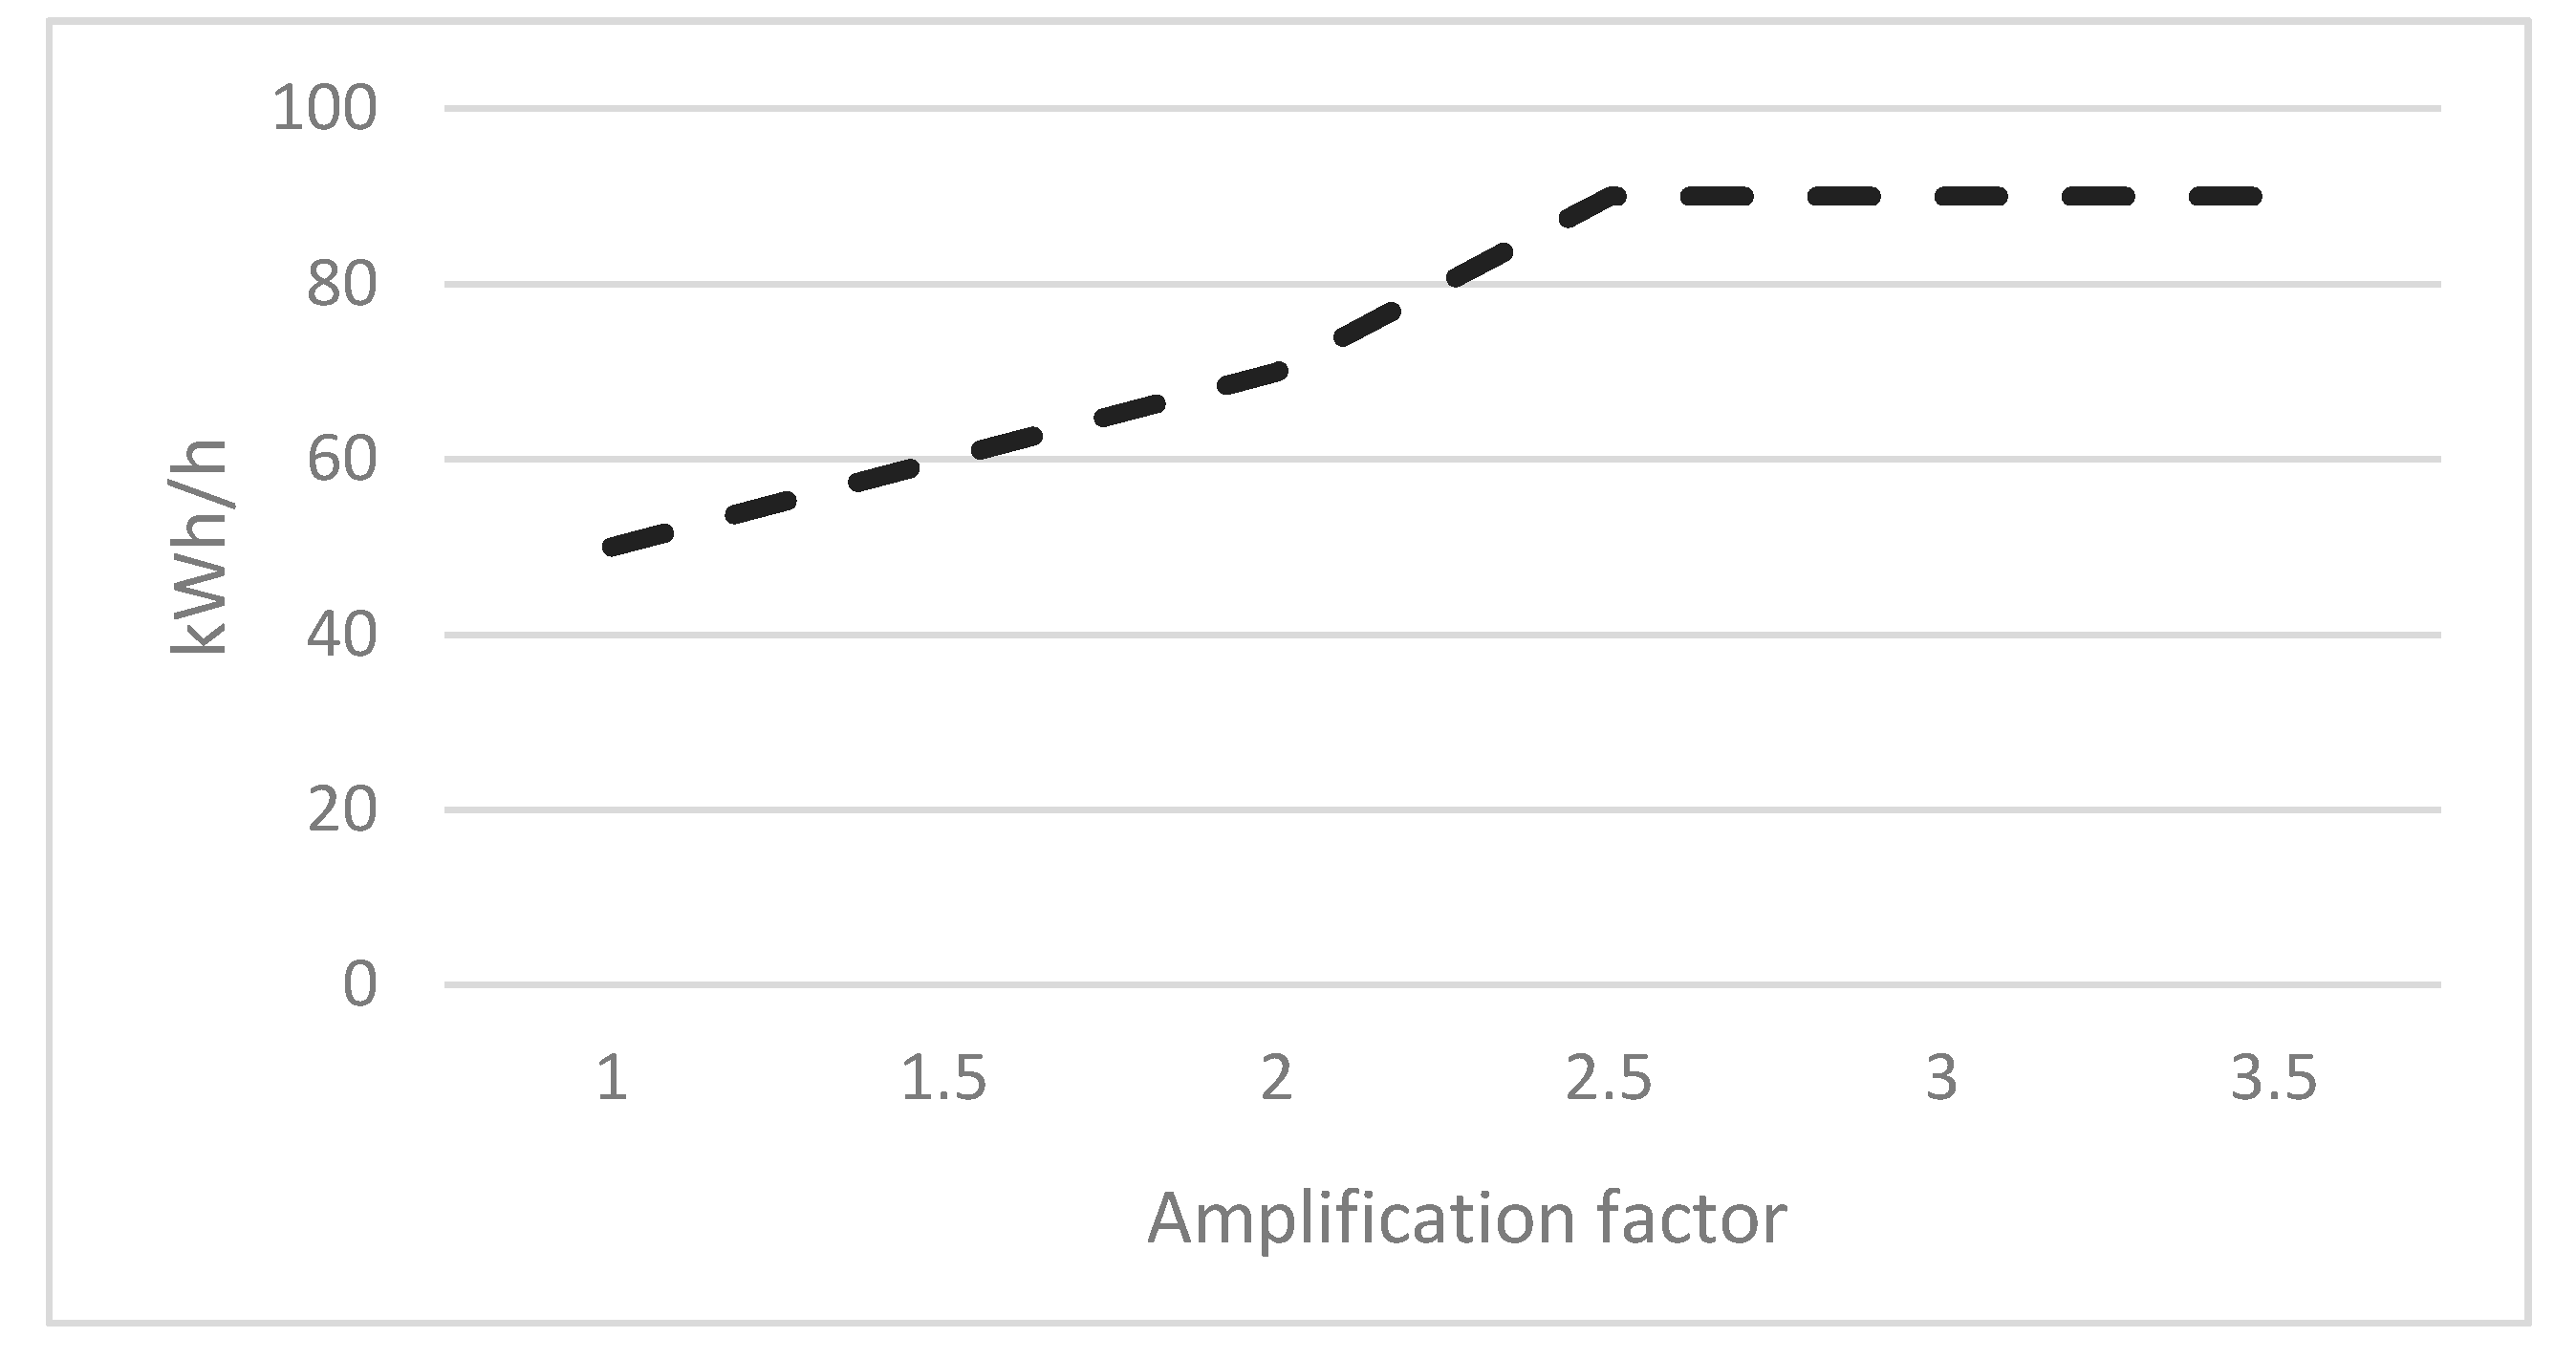
3.3. Requirements for the Battery—Size and Economy
4. Discussion
5. Conclusions
Author Contributions
Funding
Data Availability Statement
Conflicts of Interest
References
- Keramidas, K.; Diaz Vazquez, A.; Weitzel, M.; Vandyck, T.; Tamba, M.; Tchung-Ming, S.; Soria-Ramirez, A.; Krause, J.; Van Dingenen, R.; Chai, Q.; et al. Global Energy and Climate Outlook 2019: Electrification for the Low Carbon Transition; Publications Office of the European Union, Joint Research Center: Luxembourg, 2020. [Google Scholar] [CrossRef]
- Zhang, R.; Fujimori, S. The role of transport electrification in global climate change mitigation scenarios. Environ. Res. Lett. 2020, 15, 13. [Google Scholar] [CrossRef]
- Government.no. Norway Is Electric. Available online: https://www.regjeringen.no/en/topics/transport-and-communications/veg/faktaartikler-vei-og-ts/norway-is-electric/id2677481/ (accessed on 3 May 2021).
- Norwegian Electric Vehicle Association. Statistics Electric Vehicle (Norsk Elbilforening. Statistik Elbil). Available online: https://elbil.no/elbilstatistikk/ (accessed on 4 May 2021).
- Burnham, A.; Dufek, E.J.; Stephens, T.; Francfort, J.; Michelbacher, C.; Carlson, R.B.; Zhang, J.; Vijayagopal, R.; Dias, F.; Mohanpurkar, M.; et al. Enabling fast charging-Infrastructure and economic considerations. J. Power Sources 2017, 367, 237–249. [Google Scholar] [CrossRef]
- Al-Ogaili, A.S.; Hashim, T.J.T.; Rahmat, N.A.; Ramasamy, A.K.; Marsadek, M.B.; Faisal, M.; Hannan, M.A. Review on Scheduling, Clustering, and Forecasting Strategies for Controlling Electric Vehicle Charging: Challenges and Recommendations. IEEE Access 2019, 7, 128353–128371. [Google Scholar] [CrossRef]
- IRENA—International Renewable Energy Agency. Power System Flexibility for the Energy Transition, Part 1: Overview for Policy Makers; International Renewable Energy Agency: Abu Dhabi, United Arab Emirates, 2018. [Google Scholar]
- Hussain, M.T.; Sulaiman, N.B.; Hussain, M.S.; Jabir, M. Optimal Management strategies to solve issues of grid having Electric Vehicles (EV): A review. J. Energy Storage 2021, 33. [Google Scholar] [CrossRef]
- de Hoog, J.; Thomas, D.A.; Muenzel, V.; Jayasuriya, D.C.; Alpcan, T.; Brazil, M.; Mareels, I.M.Y. Electric Vehicle Charging and Grid Constraints: Comparing Distributed and Centralized Approaches. In Proceedings of the 2013 IEEE Power and Energy Society General Meeting, Vancouver, BC, Canada, 21–25 July 2013. [Google Scholar] [CrossRef][Green Version]
- SEPA—Smart Electric Power Alliance. A Comprehensive Guide to Electric Vehicle Managed Charging; Smart Electric Power Alliance: Washington, DC, USA, 2019. [Google Scholar]
- Knowledge and Innovation Center ElaadNL; The INVADEProject and ElaadNL. What Happens When Algorithms Take Control of the Charging of Electric Vehicles on a Massive Scale? A White Paper; ElaadNL: Arnhem, The Netherlands, 2019. [Google Scholar]
- Tran, V.T.; Islam, M.R.; Muttaqi, K.M.; Sutanto, D. An Efficient Energy Management Approach for a Solar-Powered EV Battery Charging Facility to Support Distribution Grids. IEEE Trans. Ind. Appl. 2019, 55, 6517–6526. [Google Scholar] [CrossRef]
- Dai, Q.; Liu, J.; Wei, Q. Optimal Photovoltaic/Battery Energy Storage/Electric Vehicle Charging Station Design Based on Multi-Agent Particle Swarm Optimization Algorithm. Sustainability 2019, 11, 1973. [Google Scholar] [CrossRef]
- Islam, M.S.; Nadarajah, M.; Bhumkittipich, K.N.; Sode-Yome, A. EV Charging Station Design with PV and Energy Storage Using Energy Balance Analysis. In Proceedings of the 2015 IEEE Innovative Smart Grid Technologies-Asia (ISGT ASIA), Bangkok, Thailand, 3–6 November 2015. [Google Scholar] [CrossRef]
- dos Santos, P.D.; de Souza, A.C.Z.; Bonatto, B.D.; Mendes, T.P.; Neto, J.A.S.; Botan, A.C.B. Analysis of solar and wind energy installations at lectric vehicle charging stations in a region in Brazil and their impact on pricing using an optimized sale price model. Int. J. Energy Res. 2020, 45, 6745–6764. [Google Scholar] [CrossRef]
- Wangsness, P.B.; Halse, A.H. The impact of electric vehicle density on local grid costs: Empirical evidence from Norway. Energy J. 2021, 42, 5. [Google Scholar] [CrossRef]
- Jiang, Z.; Tian, H.; Beshir, M.J.; Sibagatullin, R.; Mazloomzadeh, A. Statistical Analysis of Electric Vehicles Charging, Station Usage and Impact on the Grid. In Proceedings of the 2016 IEEE Power & Energy Society Innovative Smart Grid Technologies Conference (ISGT), Minneapolis, MN, USA, 6–9 September 2016. [Google Scholar]
- Ni, X.; Lo, K.L. A Methodology to Model Daily Charging Load in the EV Charging Stations Based on Monte Carlo Simulation. In Proceedings of the 2020 International Conference on Smart Grid and Clean Energy Technologies (ICSGCE), Kuching, Malaysia, 4–7 October 2020; pp. 125–130. [Google Scholar] [CrossRef]
- Ilieva, I.; Bremdal, B. Flexibility-Enhancing Charging Station to Support the Integration of Electric Vehicles. World Electr. Veh. J. 2021, 12, 53. [Google Scholar] [CrossRef]
- Fortum Charge and Drive. Available online: https://www.fortum.com/products-and-services/vehicle-charging/general-information/travelling-and-charging (accessed on 13 May 2021).
- INVADE Deliverable D6.2. Battery Techno-Economics Tool. Published 15 March 2018. Available online: https://h2020invade.eu/wp-content/uploads/2017/06/D6.2-Battery-techno-economics-tool.pdf (accessed on 13 May 2021).
- Bremdal, B.A. Batteries and Smart Electricity Grids. In The Technology Changes the Society (Teknologien Endrer Samfunnet); Rolstadås, A., Krokan, A., Dyrhaug, L.T., Eds.; Fagbokforlaget: Oslo, Norway, 2017. [Google Scholar]
- IRENA—International Renewable Energy Agency. Electricity Storage and Renewables. Costs and Markets to 2030; International Renewable Energy Agency: Abu Dhabi, United Arab Emirates, 2017. [Google Scholar]
- Dubarry, M.; Devie, A.; McKenzie, K. Durability and reliability of electric vehicle batteries under electric utility grid operations: Bidirectional charging impact analysis. J. Power Sources 2017, 358, 39–49. [Google Scholar] [CrossRef]
- Uddin, K.; Jackson, T.; Widanage, W.D.; Chouchelamane, G.; Jennings, P.A.; Marco, J. On the possibility of extending the lifetime of lithium-ion batteries through optimal V2G facilitated by an integrated vehicle and smart-grid system. Energy 2017, 133, 710–722. [Google Scholar] [CrossRef]
- Hennig, R.; Jonker, M.; Tindemans, S.; de Vries, L. Capacity Subscription Tariffs for Electricity Distribution Networks: Design Choices and Congestion Management. In Proceedings of the 2020 17th International Conference on the European Energy Market (EEM), Stockholm, Sweden, 16–18 September 2020; pp. 1–6. [Google Scholar] [CrossRef]
- Starka, M.; Buzna, L. Clustering algorithms applied to usage related segments of electric vehicle charging stations. Transp. Res. Procedia 2019, 40, 1576–1582. [Google Scholar] [CrossRef]
- Ramachandran, A.; Balakrishna, A.; Kundzicz, P.; Neti, A. Predicting Electric Vehicle Charging Station Usage: Using Machine Learning to Estimate Individual Station Statistics from Physical Configurations of Charging Station Networks; Cornell University: Ithaca, NY, USA, 2018. [Google Scholar]


| Flexibility Resource | Flexibility Potential (kW) | Maximum Duration of Flexibility (Hours) | Cost (NOK/kWh) |
|---|---|---|---|
| Demand response (in-house flexibility at the INSPIRIA Science Center) | 20–30 | 1–2 | <500 |
| Smart charging | TBD | 1–3 | 1500–3800 |
| Battery energy storage | TBD | TBD | 5000–7500 |
| V2G/V2B | 30–45 | 1–3 | 5000–8000 |
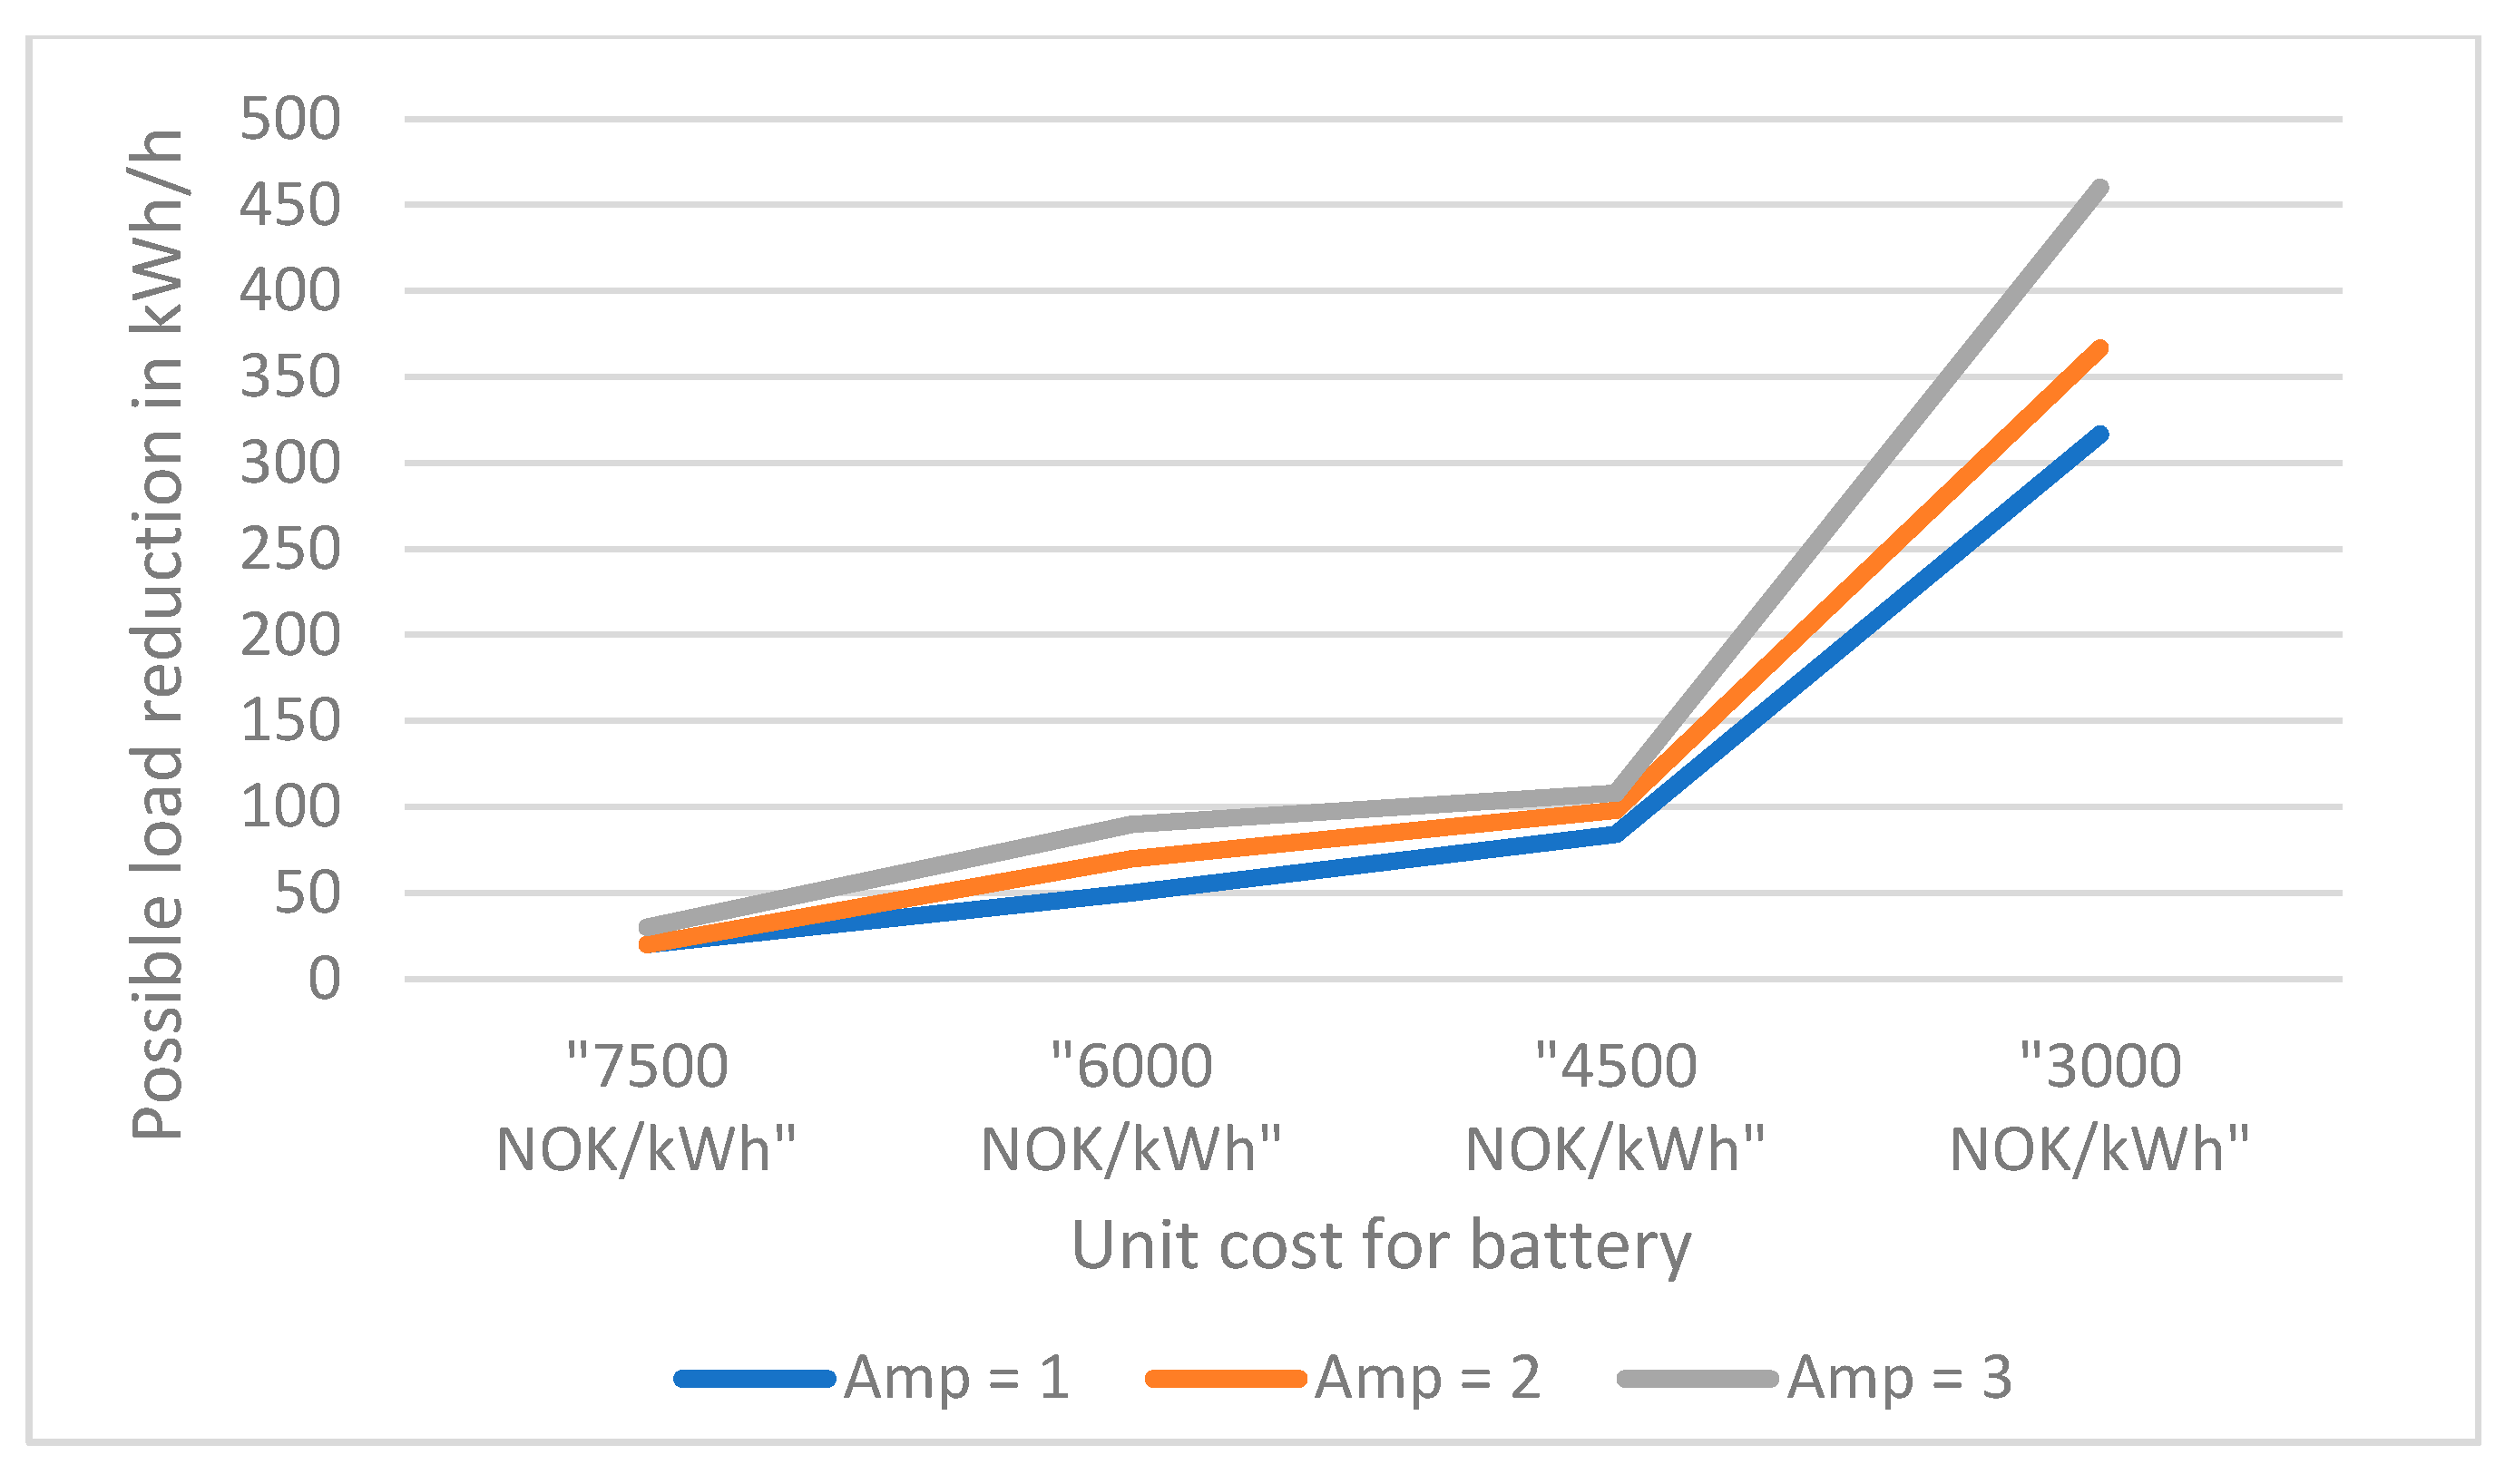
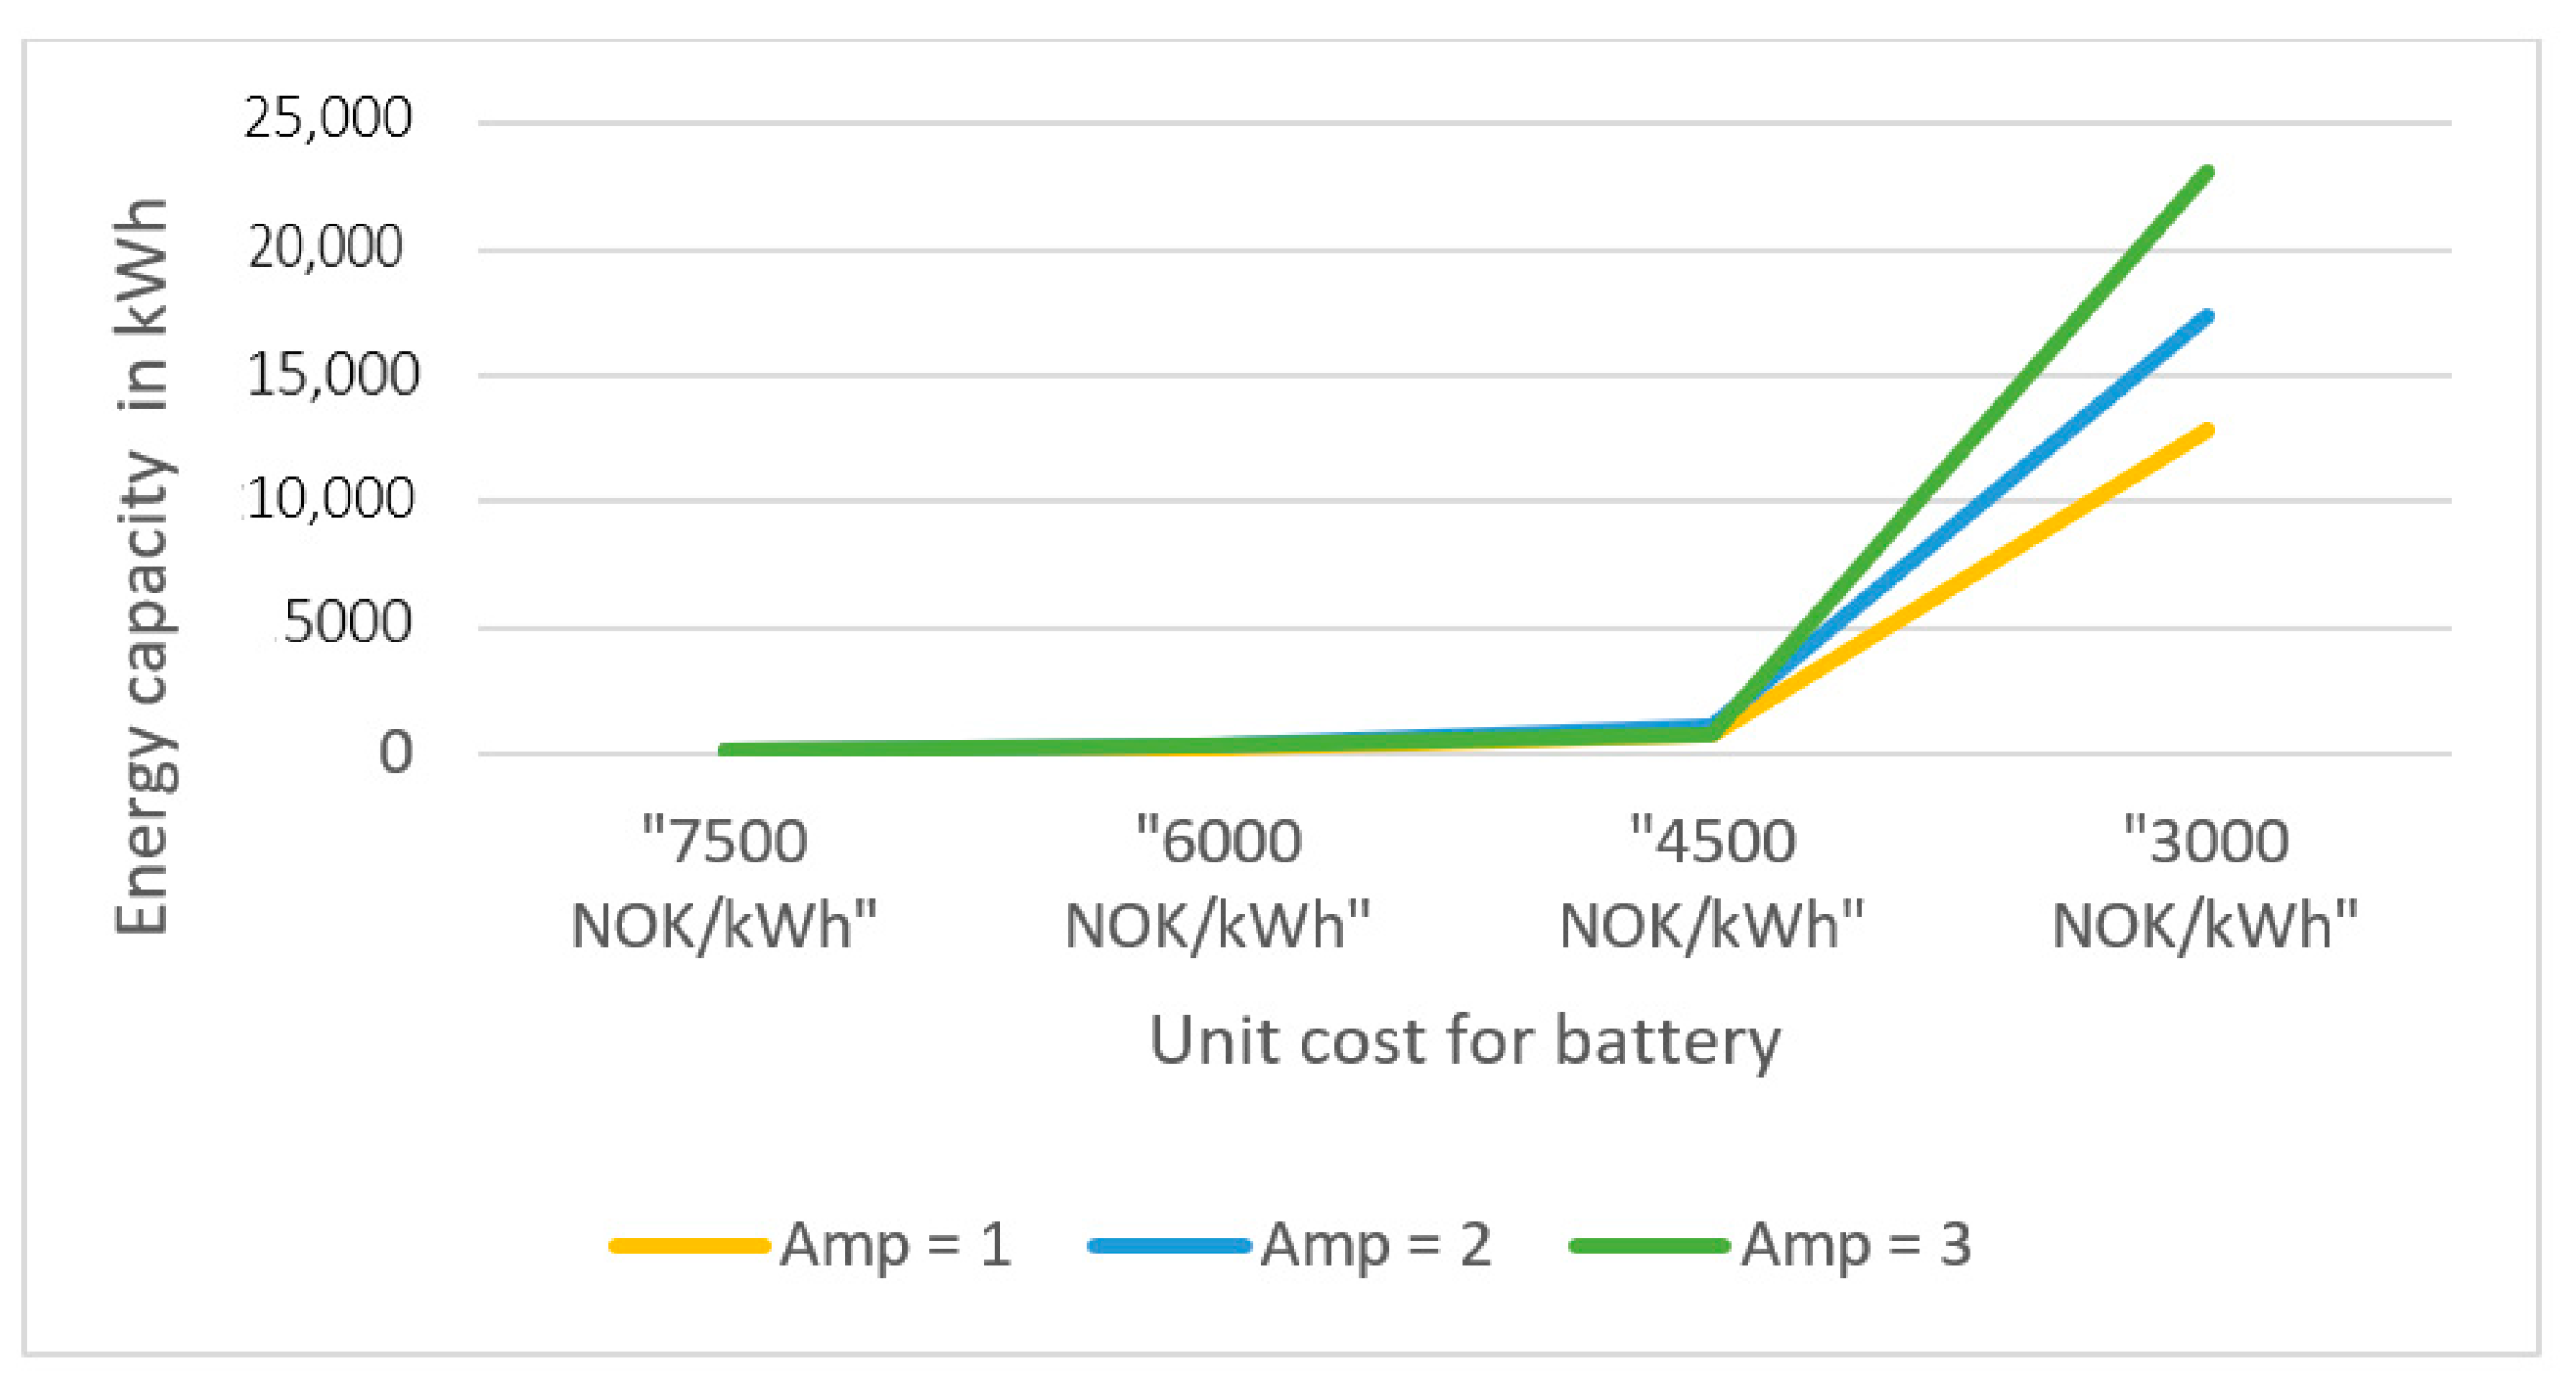
| Power (kW) | Power (kW) | Power (kW) | Energy (kWh) | Energy (kWh) | Energy (kWh) | |
|---|---|---|---|---|---|---|
| Cost per kWh | Amp = 1 | Amp = 2 | Amp = 3 | Amp = 1 | Amp = 2 | Amp = 3 |
| 7500 NOK/kWh | 20 | 20 | 30 | 30.4 | 37.6 | 54 |
| 6000 NOK/kWh | 50 | 70 | 90 | 154 | 277.2 | 310.8 |
| 4500 NOK/kWh | 84 | 98 | 108 | 738.8 | 1096 | 728 |
| 3000 NOK/kWh | 316.666667 | 366.666667 | 460 | 12,854.4 | 17,395.3333 | 23,106.8 |
| Phase | Battery | Smart Charging | Solar Panels | V2G/B | In-House Demand Response at the Nearby INSPIRIA Science Center |
|---|---|---|---|---|---|
| 2021–2022 | 70 kWh | 70 kWh | 60–70 kWp | 30 kWh | 10 kWh |
| After 2022 | 70 kWh | 100 kWh | 60–70 kWp | 30 kWh | ------ |
Publisher’s Note: MDPI stays neutral with regard to jurisdictional claims in published maps and institutional affiliations. |
© 2021 by the authors. Licensee MDPI, Basel, Switzerland. This article is an open access article distributed under the terms and conditions of the Creative Commons Attribution (CC BY) license (https://creativecommons.org/licenses/by/4.0/).
Share and Cite
Ilieva, I.; Bremdal, B. Utilizing Local Flexibility Resources to Mitigate Grid Challenges at Electric Vehicle Charging Stations. Energies 2021, 14, 3506. https://doi.org/10.3390/en14123506
Ilieva I, Bremdal B. Utilizing Local Flexibility Resources to Mitigate Grid Challenges at Electric Vehicle Charging Stations. Energies. 2021; 14(12):3506. https://doi.org/10.3390/en14123506
Chicago/Turabian StyleIlieva, Iliana, and Bernt Bremdal. 2021. "Utilizing Local Flexibility Resources to Mitigate Grid Challenges at Electric Vehicle Charging Stations" Energies 14, no. 12: 3506. https://doi.org/10.3390/en14123506
APA StyleIlieva, I., & Bremdal, B. (2021). Utilizing Local Flexibility Resources to Mitigate Grid Challenges at Electric Vehicle Charging Stations. Energies, 14(12), 3506. https://doi.org/10.3390/en14123506