Article

On the Built-Environment Quality in Nearly Zero-Energy Renovated Schools: Assessment and Impact of Passive Strategies

1
Italian National Agency for New Technologies, Energy and Sustainable Economic Development (ENEA), Via Anguillarese 301, 00123 Rome, Italy
2
Department of Astronautical Electrical and Energy Engineering, SAPIENZA University of Rome, Via Eudossiana 18, 00184 Rome, Italy
*
Author to whom correspondence should be addressed.
Energies 2021, 14(10), 2799; https://doi.org/10.3390/en14102799
Submission received: 7 April 2021 / Revised: 9 May 2021 / Accepted: 11 May 2021 / Published: 13 May 2021

Abstract

:
Indoor Environmental Quality (IEQ) is a crucial issue in school buildings, because of the conditions that pupils and students are exposed to. From this assumption, potentialities of retrofit actions with Nearly Zero-Energy Building (NZEB) targets were analyzed in existing school buildings, focusing on the impact of such measures of IEQ. Numerical analyses in a transient regime for a typical school building were carried out to assess the impacts on the thermal comfort and Indoor Air Quality (IAQ). The study took into account several building configurations and three reference cities. The results showed severe overheating risks in retrofitted schools: the operative temperature increased by several degrees with respect to the existing configuration, leading to thermal discomfort for a relevant part of the observation period. Passive techniques, namely external solar protection devices and night ventilative cooling, were applied to assess their mitigation potential. Results showed that the combination of the two solutions restored the pre-retrofit performance. CO2 levels were found to be too high for naturally ventilated buildings, regardless of the building configuration; acceptable levels might be reached only with long opening times of windows, which are unrealistic for real building operation.

1. Introduction

The total energy end use has dramatically increased in the past few decades, and buildings, accounting for 40% of such use, represent the largest energy-consuming sector [1]. The national implementation of the EU Directives led to a strong impulse to improve the energy performance in the building sector through different policies and actions [2]. One of them is the introduction of the Nearly Zero-Energy Buildings (NZEB), defined as buildings with a very high-energy performance where the nearly zero or very low amount of energy demand should be covered almost entirely by renewable energy sources produced on-site or nearby [2], and adopted as the construction standard in all EU countries. The NZEB target is set for new buildings and buildings subjected to deep renovation. The latter represents the major challenge to meet the energy and environment targets, because of the poor energy performance of the existing building stock [3]. The educational buildings represent an important segment of this stock, being responsible for high energy uses, and it is also necessary to provide adequate Indoor Environmental Quality (IEQ) for pupils and students [4,5]. The relevance of the topic is highlighted by several EU projects dealing with the deep energy renovation of school buildings [6,7,8,9,10].
Several studies dealt with NZEB and low-energy performance school buildings. Hong et al. [11] developed a decision support model to maintain and improve elementary electric energy consumption of school facilities, combining genetic algorithms and neural networks. Fiaschi et al. [12] reported an energy analysis of public buildings (including schools) discussing possible retrofitting strategies from energy and economic perspectives. Raatikainen et al. [13] carried out a study on six school buildings built in different periods, analyzing different days and different operative hours to evaluate the trends of electricity and district heating costs. Muñoz et al. [14] calculated the overall primary energy consumption of a new educational building during its whole lifespan according to the Life Cycle Energy Assessment (LCEA) method, concluding that the building did not satisfy NZEB requirements despite being designed as a low-energy building. Borrelli et al. [15] studied the heating system of an NZEB educational building in Belgium during the winter period; they implemented a building model validated with measured field data in order to optimize its control strategies.
Many NZEB studies focused on the energy performance and cost-effectiveness [16]; nevertheless, pursuing adequate IEQ levels affects the building energy demand [17,18,19]. Providing IEQ at minimum energy cost is a challenging task for building designers [20,21], since poor air quality and thermal comfort make human beings more vulnerable to disease [22,23,24,25]. IEQ is critical in school buildings, where pupils spend around 25% of their time [26]; furthermore, more than 50% of schoolchildren are affected by allergies or asthma [27]. Poor IEQ affects also the productivity and performance of students and teachers [28,29]. For the mentioned reasons, research on the relation among occupants’ productivity, energy efficiency and IEQ in school buildings was carried out [30]. Perez and Capeluto [31] found complex interdependences among different design parameters, which affect the energy use in school buildings; the study focused on a hot–humid climate, to provide specific design guidelines. Energy performance and air quality in a new school building were investigated by experimental and numerical analyses in [32]; the study explored the correlation between heat recovery ventilation and heat pump energy conservation, analyzing the displacement ventilation system and its thermal stratification. Allab et al. [33] analyzed a French university campus, adapting and implementing an energy audit protocol with indoor climate issues; the objective was to have a full picture of the building behavior, including its operating conditions. Hameem et al. [34] developed a unified protocol for Post-Occupational Evaluations and Measurements (POE + M) of critical IEQ variables in school facilities. Bogdanovica et al. [35] analyzed the CO2 concentration in a secondary school in Latvia, coupling measurement and a pupil survey; they observed an inverse correlation between the CO2 concentration level and the pupils’ performance. The impact of the COVID-19 pandemic measures on thermal comfort and IAQ conditions in Mediterranean classrooms was studied in [36]. The environmental monitoring carried out before and during the pandemic in two classrooms demonstrated that the “emergency” ventilation protocols provided good IAQ conditions with a decrease in CO2 concentrations; conversely, effects on thermal discomfort conditions were also registered.
The operational performance of NZEBs is a topic under investigation, as documented in [37,38]. POE on NZEBs located in Germany, Austria, Switzerland and the Netherlands evidenced a low comfort satisfaction related to IAQ and indoor temperature in summer [39]. The same result was obtained in a POE study performed in a low-energy building located in Italy [40], which evidenced how NZEB requirements do not always guarantee adequate indoor conditions. Trofimova et al. [41] investigated a Zero-Carbon Building (ZCB) in China to estimate occupants’ comfort; although results showed a general satisfaction with the environmental conditions, around half of the occupants experienced some sick building syndrome consequences.
The main causes of low IEQ levels can be summarized as follows: poor design of heating, cooling, ventilation and air conditioning (HVAC) systems [39,40,41,42]; excessively high level of thermal insulation in the building envelope [42,43,44,45]; incorrect design and application of passive technologies and strategies [39,40,44,45].
Building renovation is an important subject in Italy, since more than 50% of existing school buildings were built before 1970 [46]. A significant number of Italian schools present substantial structural hazards, which is a critical issue in a country characterized by a high seismic risk, and they were built without any energy conservation measures [47]. In Italian schools, space heating accounts for 80–90% of total energy end use, while active cooling systems are not installed, since schools are closed in summer. Mechanical ventilation systems, also, are seldom installed in existing schools because it was not the current practice at the time that most schools were built, and because several constraints apply in building renovation: noise control, structure of the building, significant additional cost. National policy requirements present high energy and environmental targets, including deep energy renovation of buildings [48]. Relevant measures regard the upgrade of the building envelope, for both air tightness and thermal insulation, as well as the improvement of the heating systems’ efficiency; conversely, aspects related to indoor comfort and quality are seldom taken into account.
The main objective of the present study is to qualitatively and quantitatively assess the indoor environmental quality changes in school buildings undergoing NZEB targeted renovation, starting from the preliminary analyses carried out by the authors in [49]. The study is carried out by numerical analyses focusing on the energy performance, thermal comfort and air quality issues, as well as on the contribution of passive cooling solutions to contrast the indoor overheating risk.

2. Materials and Methods

The methodology adopted to achieve the paper’s aim is structured as follows:
  • Identification of relevant parameters and indicators to describe thermal comfort and IAQ in the built environment;
  • Definition of the reference building (RB) considering the thermal characteristics of the envelope, the climatic conditions, the operational settings and the occupancy profile;
  • Definition of the RB variants, taking into account the Italian NZEB requirements, as well as the selected passive strategies and techniques to improve the indoor conditions;
  • Assessment of the energy performance of the RB before and after renovation, focusing on the use of space heating;
  • Assessment of the IEQ before and after the building renovation, evaluating and comparing the relevant indicators.
The numerical analyses focused on two crucial aspects for NEZB-targeted energy retrofit:
  • The energy performance assessment by applying the Italian standards, methodologies and tools.
  • The IEQ evaluation, here focused on the indoor thermal comfort and IAQ, assessed by analyses in transient regime, able to accurately reproduce the indoor environment of the buildings. According to the literature review, Italian schools do not have active cooling; hence, the thermal comfort analysis is performed during the off-heating period, when the building is in thermal free-floating conditions and the overheating risk is higher. The IAQ analysis is performed for the whole year, hence with the heating system on and off.
In order to fix boundary conditions to a wide and complex topic, the following limitation applies to the present study:
  • The analyses of the energy performances and the passive cooling technologies are focused on the building envelope, according to the current renovation measures and the building energy use in school buildings. Therefore, the technologies related to active and renewable energy systems were not taken into account, although they will play a crucial role in the future, thanks to their integration at district and community level.
  • The space heating system efficiency is not considered, since it would influence additional parameters not directly related to the paper topic. The other energy uses (domestic hot water, electricity for auxiliary and lighting systems) are not analyzed, since they are correlated to the energy measures here treated and have no relation with IEQ.

2.1. Identification of the Relevant Indicators

The building energy performance is expressed in terms of specific energy use (kWh/m2), which normalizes the energy used by the building to its useful area. The indicator chosen for this study is the net energy use, defined as the amount of energy supply needed to keep the building at the temperature set point (20 °C in winter), without taking into account the energy losses of the energy system. This choice was made to focus on the envelope performance, without introducing other variables not strictly related to the objective of the study.
Environmental quality is a complex field to investigate. The term sick building syndrome (SBS) was introduced by the World Health Organization (WHO) to describe the technical aspects related to the design of HVAC systems. SBS is generally used to characterize an indoor built environment equipped with HVAC systems where occupants suffer from illness symptoms due to poor IAQ. Different design standards were implemented in order to reach the requirements for both efficient energy systems and healthy environments [50].
The level of indoor carbon dioxide (CO2) is considered the main indicator to understand and assess the IAQ in the built environment [51,52], and its evolution is analyzed for the whole year. The operative temperature is identified as the main parameter to assess the thermal comfort conditions in buildings naturally ventilated and in thermal free-floating conditions during the off-heating period [53]. The procedure and performance target for both analyses were carried out during the building occupation hours according to the relevant standard [53].

2.2. Identification of Relevant Climatic Zones

The analyses were carried out in three Italian cities, characterized by different climatic conditions, to represent the heterogeneity of the Italian territory. The main characteristics of the chosen locations are as follows:
  • Milan—North Italy (lat. 45°37′ N, long. 08°44′ E): this location belongs to the Cfa class (humid subtropical climate) in the Köppen climate classification, characterized by hot, humid summers and cold, foggy winters.
  • Rome—Central Italy (lat. 41°48′ N, long. 12°14′ E): this location belongs to the Csa class (dry summer subtropical climate, often referred to as Mediterranean) in the Köppen climate classification, characterized by mild winters and warm to hot summers.
  • Palermo—South Italy (lat. 38°11′ N, long. 13°06′ E): this location also belongs to the Csa class, with temperatures consistently higher than Rome (around 3 °C as annual average).
Other climatic and operational data, as standardized in the national building code, are summarized in Table 1 [54]. The heating degree days (HDDs) are calculated considering a base temperature of 20 °C; no equivalent indicator exists for the cooling season.

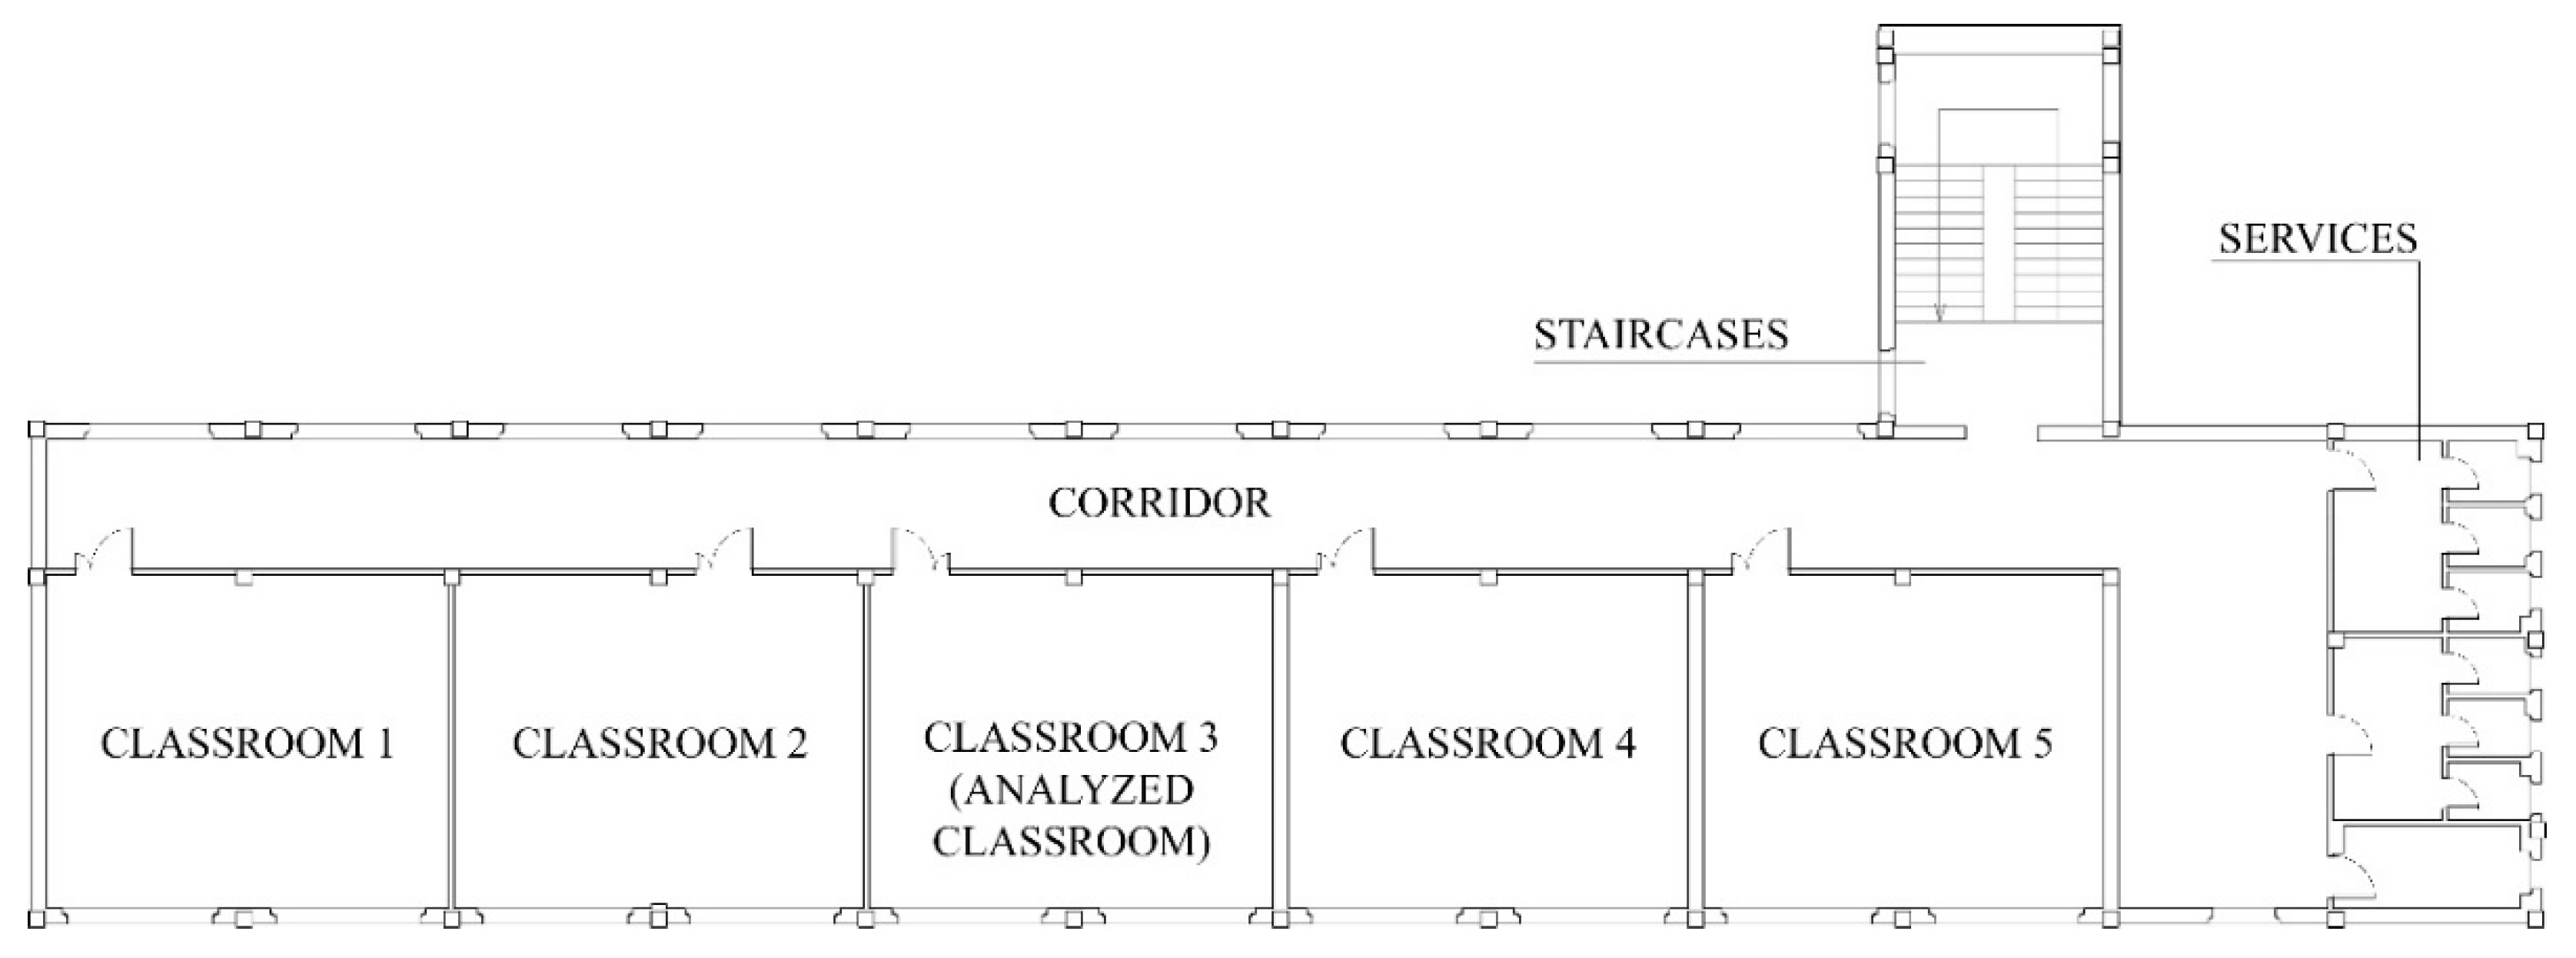
2.3. Definition of the Reference Building

The building was modeled according to recurring characteristics of Italian schools: three floors, classrooms oriented along one side and corridor on the other, services and stairs at one extreme of the corridor. The plan of a typical floor is presented in Figure 1. The classrooms are of the same size, and their main geometric data are: net area 50 m2; room height 3.2 m; two identical windows of around 5 m2 each (20% window to floor ratio, standard value in Italian classrooms).
The opaque components of this reference building (RB) envelope are not thermally insulated; the windows have an aluminum frame without thermal break and a single glass unit, with a solar factor of 0.85. Thermal transmittance values of the facade components are the same for the three climatic zones, assuming that the school was built before the introduction of the energy saving legislation. The values are summarized in the first column of Table 2. Internal shading devices are mounted for daylight control, and their shading factor is 0.8 (in a 0–1 range, where 0 is no shading); no shadings are installed on the windows in the corridors.
As previously indicated, the building is equipped with a heating system but no active cooling systems are installed. The manual opening of the windows provides natural ventilation; this is the usual solution used in Italian school buildings, and it is applied to RB and its variants. Concerning the ventilation rate, Italian standards define the Air Changes per Hour (ACH) requirements according to building use [55]. The rates indicated for schools are largely overestimated with respect to real conditions in buildings ventilated by manual window opening. ACH was also calculated implementing a realistic operational schedule for window opening: 10 minutes per hour and 30 additional minutes during the morning break at 10:30; full details can be found in Section 3.2.
Other operational data used in the numerical analyses are:
  • Daily schedule: 08:00–14:00 from Monday to Saturday;
  • People density: 2.17 m2/person [56];
  • Metabolic rate: 1.2 MET (seated or very light writing);
  • Clothing: 0.7 CLO during warm and hot seasons [57];
  • Equipment sensible heat: 5 W/m2 [58].
A typical yearly schedule was considered for the building opening: Italian schools usually open on 10 September and close on 10 June. This implies that the teaching hours during the off-heating season are 546, 648 and 918 in Milan, Rome and Palermo, respectively.

2.4. Definition of the Building Variants

The initial RB variant is the NZEB configuration, characterized by a very high thermal insulation. U-values of the different components change as a function of the climatic zone, as defined in the relevant Italian standard [59]. Windows are made of aluminum with thermal-break frames and double glazing units with a low-emissivity coating (0.6 solar factor). U-values of such components are reported in Table 2.
The technologies and strategies implemented in the building variants to improve the indoor environment conditions were selected from a cost-effectiveness perspective, since other solutions would require a significant additional budget. The solutions identified are:
  • Solar-protection devices to reduce solar gains and improve thermal comfort during the off-heating season; the device has a shading factor of 0.8. It is assumed that the shading devices are moveable, according to current practices, and are activated only during the off-heating season. In winter, only the internal shading is activated for daylighting purposes. The external shading systems are not activated; thus, they do not affect the heating energy performance.
  • The nighttime ventilative cooling to reduce the indoor temperature, discharge the thermal mass at night and improve the thermal comfort during classes in the morning in the off-heating season. The strategy, hence, does not affect the energy performance in winter. Ventilation rates are set to 3 ACH from 21:00 to 07:00 a.m. This solution is analyzed in combination with the previous one.
  • Several window opening profiles are analyzed to assess the impact on IAQ during the occupation hours for the whole year.
Concerning the first mitigation solution, it has to be noted that the installation of the shading system affects the daylight availability in classrooms. The topic is relevant and has been explored in several studies [60,61]; however, it is beyond the scope of the present paper.

3. Calculation

3.1. Energy Performance

The energy performance of the building and its variants is calculated with EDILCLIMA [62], a software program based on the quasi-steady-state method with monthly heat balance and utilization factors, according to the Italian and EU related standards [63]. EDILCLIMA is a software program officially accredited by the national energy performance certification (EPC) scheme. The relevant indicator to express the results is the net heating energy demand, as previously indicated. The heating season for each location is presented in Table 1.
The building was modeled as a single thermal zone with an internal heat capacity of 165 kJ/m2 K. The simulations were carried out for the existing and NZEB building configurations. The passive strategies were not considered in this calculation, since they are activated during the off-heating season only. The energy performance was calculated for the three selected locations (Milan, Rome and Palermo) and for the building oriented across for the four cardinal points. Two ventilation rates were set:
  • ACH 1.4 h−1, according to the Italian relevant standard [55];
  • ACH 0.3 h−1, derived from common practice and field experiences in school buildings ventilated only by manual window opening [58].

3.2. Thermal and Air Qualities of the Built Environment

TRNSYS 16 [64] was used to perform the analyses on thermal comfort and air quality. TRANSYS 16 is a well-known and validated tool, able to simulate the thermal response of buildings and energy systems in transient regime. The software is structured in different modules (called Types) linked together, each of them with a specific calculation task. The following routines were used for this project: weather data file; solar processing; sky temperature calculation module; psychrometrics; equations component; building description; occupancy and shading schedules.
A multizone model was developed, and the relevant parameters were calculated in each room of the building. The results, however, are presented for two reference classrooms located on the second (intermediate) floor and at the top floor, respectively. This choice was made assuming that no relevant differences are expected among rooms with the same orientation, floor and occupation profile, whilst the impact of the roof on overheating risk was considered worthy of specific analyses.
According to the size and the compact geometry form of the classrooms, the operative temperature was calculated as the arithmetic average of air temperature and mean radiant temperature in the classroom. The operative temperature was thus calculated according to Equation (1):
T o = T a + i = 1 N t i F i 2
where
  • To (°C) operative temperature;
  • Ta (°C) air temperature;
  • ti (K) absolute temperature of the i surface of the classroom;
  • Fi (-) view factor of the i surface respect to the calculation point;
  • N (-) number of surfaces of the classrooms.
Natural ventilation ACH and CO2 concentration were calculated applying a validated empirical model for a single side of a naturally ventilated room [65]. This approach was considered sufficiently accurate, assuming the above-explained window opening during classes. Preliminary calculations showed that the impact of the wind is lower with respect to the stack effect; thus, the latter can be considered as a driving force for ventilation. These results were checked versus monitored data in real school environments [58]. The ventilation rate can be expressed using the following Equations (2)–(4):
Q = A f ( G r , M ) ( Δ θ g h θ ) 0.5
G r = ( Δ θ g h 3 / θ U 2 )
M = ( h b )
where
  • Q ( m 3 s ) air exchange rate;
  • A ( m 2 ) window area;
  • g ( m s 2 ) acceleration of gravity;
  • θ (K) mean of the internal and external absolute air temperatures;
  • Δθ (K) difference between internal and external air temperature;
  • M (-) aspect ratio of the opening;
  • H (m) height of the window;
  • b (m) width of the window;
  • Gr (-) Grashof Number;
  • u ( m s ) wind velocity.
If the Gr number is high and the vertical component of the air velocity at the opening is small compared to the horizontal component, it is possible to apply the following approximation (5):
[ f ( G r , M ) ] = C d / 3
where Cd (−) is the discharge coefficient of the opening. In the case of sharp-edged window openings, it can be assumed that Cd is 0.61. The other parameters were derived from the calculation outputs and the building characteristics.

4. Results and Discussion

4.1. Energy Performance

The energy performance results of the RB and NZEB variant for the three cities and to the four building orientations are summarized in Table 3 and Table 4. The results refer to the ACH values defined by the national standards (Table 3) and are based on the real operating conditions (Table 4), respectively.
The results highlight the direct dependence of the energy performance versus the climate conditions. The orientation averaged net energy is 211.5, 125.5 and 71.5 kWh/m2 for Milan, Rome and Palermo, respectively, with ACH = 1.4−1. Despite the significant differences in absolute terms, the relative savings are similar, ranging from 69% in Milan to 74% in Palermo. The relative variation in the energy performance as a function of the orientation falls within 10% compared to the average value for the same climate and thermal insulation level.
Reducing the natural ventilation from theoretical (1.4 h−1) to effective (0.3 h−1) values led to 25–28% energy savings; thus, the average net energy for the existing building decreased to 157.5, 90.5 and 52.3 kWh/m2 for Milan, Rome and Palermo, respectively. The effective ventilation emphasizes the high impact of the transmission losses on the energy performance; in fact, the relative savings after the energy renovation are in the range of 88–92%.

4.2. Overheating Risk Assessment

The first set of results refers to the average operative temperature during the occupancy hours of the off-heating period, and it is summarized in Table 5. The absolute operative temperatures are reported for the existing classrooms, while the temperature increase with respect to RB is reported for the other configurations. The RB results do not present significant differences between the intermediate rooms and the top floor, with 0.23 and 0.15 °C being the operative temperature difference for Milan/Rome and Palermo, respectively. The NZEB renovation causes a rise in the orientation-averaged operative temperature by 6.3, 5.2 and 4.9 °C for Milan, Rome and Palermo, respectively. The difference depends on the thermal insulation levels required for envelope components, which are proportional to the severity of the climate. Thus, the lower U-values in Milan lead to a higher overheating risk during the mild and warm seasons. The peak temperature rise is recorded in Milan: 6.8 °C for the north room on the second floor. It should be noted that the average operative temperature is always above 28.9 °C in all cases but the case of the north-oriented, first-floor classroom in Milan, scoring 28.3 °C. These figures provide a clear picture of the overheating risk in NZEB, uniquely designed to achieve energy conservation in winter.
The external solar protection devices installed on the NZEB building (NZEB + shad) cause a reduction in the average operative temperature by 3.0, 2.8 and 2.5 °C compared to the standard case in Milan, Rome and Palermo, respectively. The impact is lower (1.2–1.8 °C) on the north-oriented classrooms, because of the lower solar load on such facades. The combination of ventilative cooling and solar shading (NZEB + shad + vent) greatly improves the response of the NZEB; in fact, the average operative temperature is close to RB, the differences being in the range of −0.1–0.6 °C for the three cities.
An exemplary case of the indoor operative and external air temperature evolution versus time is plotted in Figure 2. It refers to the case of Rome, for an east-oriented classroom, for an entire week from 1 to 7 May. The temperature profiles are similar, but the different building configurations lead to a vertical shift in the curves. Despite mild outdoor temperatures, the operative temperature reaches 30 °C for the NZEB case and it is around 5–6 °C higher than the non-insulated configurations, peaking at 7 °C at nighttime. The NZEB configuration with external solar protection exhibits intermediate performance compared to the two previous case, while the natural ventilative cooling during the night provides a significant mitigation of the thermal conditions, with the temperature profile aligned to that of RB.
The impact of solar gains through the roof on the thermal comfort was assessed analyzing the operative temperature differences calculated at the top floor and at the intermediate level. The frequency distribution plot of Figure 3 presents the exemplary case of the south-oriented classroom in Milan. The operative difference is lower than 0.5 and 0.8 °C in more than 50% and 90% of the observation period, respectively. Similar results were achieved for other building configurations; thus, they are not presented here for brevity. This result shows that temperature differences among floors were often negligible. For such reasons, further elaboration on the operative temperature is presented for the classroom at the intermediate floor, as representative of all the classrooms with the same orientation. The role of the roof, as a source of heat in classrooms, is reintroduced again for the discomfort analysis.
Figure 4 shows the influence of the orientation on the overheating risk for different building configurations. The three cities produced similar results; hence, the case of Milan is presented as exemplary. The north-orientated classroom is the coolest for the RB case, with the operative temperature below 26 °C (OP_26) in 77% of the period, because of the low solar gains through windows. Conversely, the east-oriented classroom is the warmest (OP_26 in 62%) because of the solar irradiation through the windows during the morning teaching hours. South and west rooms have a quasi-identical profile, due to similar irradiation conditions during the off-heating season; the calculated OP_26 is 71% and 70%, respectively. Indoor operative temperatures rise significantly for the NZEB, but the trend does not compare to the RB case; hence, it is not presented here for brevity. The trend changes instead for the NZEB + shad; in fact, the south-oriented classrooms are cooler than north-facing ones, the operative temperature being below 28 °C (OP_28) in 73% and 67% of the observation period, respectively. This phenomenon is explained by the temperature increase in the unshaded south-oriented corridor, which, in turn, warms up the north-oriented classrooms. This behavior is also observed for the west classrooms, whose performance is very close to that of the east-oriented classrooms, with OP_28 at, respectively, 59% and 56%. The same trend is observed for NZEB + shad + vent configuration, but the differences are smaller compared to the previous case, i.e., the hours with the operative temperature below 26 °C are in the range of 70% (east)–80% (south) for all cases.
The final analysis is carried out to correlate the indoor operative temperatures and the thermal discomfort occurrence, according to the procedure defined in the relevant standard [53]. The discomfort hours are those in which the operative temperature falls outside of the acceptance range, the latter being a function of the daily mean running outdoor temperature and the user category. Category II, which refers to a normal level of comfort in new and renovated buildings, was applied in the present study. The results are expressed in relative terms to facilitate a comparison among the off-season periods in the selected cities.
The results for Milan are reported in Figure 5 and they show that the second floor (classroom below the roof) is more exposed to thermal discomfort than the intermediate classroom. The difference in discomfort hours is in the range of 3–6% for all the configurations but the NZEB + shad; this is explained by the effective control of the solar loads on the first floor, while the upper classroom is affected by the solar gains through the roof as well. Regarding the impact of the façade orientation, it is observed that the north classroom causes fewer discomfort hours, at 9–11%, than the orientations’ average; this value drops to 0–3% for the configurations equipped with solar shading. Comparing the building configurations, the highest differences were recorded between RB and NZEB, in fact. The discomfort hours rise from 14% to 88% of the period, highlighting the deterioration of thermal conditions because of the NZEB renovation. The shading systems reduce the discomfort hours to 51%, which is a significant figure in any case. Solar gains are only part of the thermal load; thus, it is also important to cool down air and structures to mitigate the indoor environment. The night ventilation, coupled with solar protection, fulfills the objective and ensures that discomfort hours remain below 5%, improving the RB indoor conditions.
Figure 6 presents the results of the discomfort hours obtained for the RB located in Rome. The top-floor classroom has 3–8% more discomfort hours than the room below; the difference rises to 15% for the NZEB-shad case. The north is the most comfortable orientation in RB, with 9% discomfort hours compared to 21% of the orientation average. The solar shading systems are most effective in the south-oriented classroom (discomfort hours 12% lower than the average), since this orientation is the most affected by solar gains in the intermediate season. These results prove the relevant impact of solar gains in the mild Mediterranean climate and the need to implement solar control strategies on transparent and opaque components as well. Comparing the different configurations, the discomfort hours are 21% for the existing RB and the indoor microclimate is improved (10% discomfort hours) in the case of building renovation with solar protection and night ventilative cooling. NZEB either equipped without or with solar protection leads to extremely poor thermal conditions, with 98% and 66% of discomfort hours, respectively.
Figure 7 reports the Palermo results. The high irradiance levels and ambient temperatures typical of South Italy lead to significant discomfort conditions in all the building configurations. The discomfort hours account for around 40% of the period for RB, and no significant differences are observed between the two floors. The results show a strong dependence on the orientation, e.g., RB in the south-oriented classroom has almost twice the discomfort hours (50%) of the north-oriented one (27%). The benefit of solar protection devices in the NZEB south-oriented rooms is not relevant in this case (5% with respect to average), because the high temperature is the driving force behind overheating in Palermo. Comparing the different configurations, the lowest average discomfort hours were calculated for NZEB + shad + vent (35%), 5% less than the existing RB. Extremely poor thermal conditions were observed for the NZEB configurations, either with or without solar protection systems, which led to 80% and 98% discomfort hours, respectively.

4.3. Indoor Air Quality Assessment

Preliminary calculations showed that the CO2 concentration does not depend on the classroom floor. It was also found that the CO2 concentration slightly changes with the climatic zone and the building configuration, since it is mainly a function of the gas produced by the occupants inside the built environment. Aggregate results are presented in Table 6, where the average concentrations are presented for three cities, four building configurations and two orientations, south and east. The high CO2 concentration levels in the occupied classrooms are in agreement with the data provided by the field survey [58]. These values are not acceptable according to the relevant standard [53], which sets the CO2 concentration limit to 1200 ppm.
The frequency distribution of CO2 concentration in the south-oriented classroom in Rome is selected as an exemplary case, and it is plotted for the different building configurations in Figure 8. The maximum CO2 concentration is above 4000 ppm in all cases, while levels above 2800 ppm are reached in around 40% of hours. Concentrations below 2000 ppm are calculated for around 20% of the period, and they are mainly recorded during the morning break hour, when windows are kept open for a longer period of time. Concentrations below the relevant standard requirements (1200 ppm) are achieved for between 16% and 18% of the hours only.
In general, the effect of the energy renovation has a small positive impact (reduction of between 6% and 9% in CO2 concentration with respect to the average values), because the increase in the indoor air temperature in the NZEB configuration creates favorable conditions for natural ventilation. The concentration is variable for the NZEB with external shading, ranging from a 4% reduction for the south classroom in Milan to a 1% rise in Rome. The night ventilation and consequent lower temperatures lead to an increase in the gas concentration, ranging from 2% in south classrooms in Palermo up to 9% in Rome.
An additional set of calculations were carried out to verify under which conditions the natural ventilation is sufficient to provide adequate IAQ. The results are presented in Figure 9 and refer to the NZEB + shad. The results are expressed as a function of a progressive increase in the window opening time per hour—that is, the increase in the air exchange rate. The trend and the absolute values are very similar for the reference cities, in accordance with the previous results. According to these outcomes, acceptable CO2 concentration levels might be achieved with window openings of longer than 30 min per hour. This option is not realistic because of the evident implications, such as the cold air inlet in winter and the noise from outside during teaching hours.

5. Conclusions

This study investigated the impact of deep energy retrofit on the IEQ in a reference school building for different climates in Italy. A typical school building was accurately modeled, and several geographic and operating configurations were analyzed. The energy simulations demonstrated that the net energy use for space heating might decrease from 68% to 82% in the case of an NZEB retrofit, with the highest and lowest relative savings achieved in Palermo and Milan, respectively. Calculations in the transient regime were performed to assess the indoor air and thermal quality; the results evidenced a serious worsening of the environmental conditions during the off-heating season, which is the period most exposed to overheating. A relevant increase in the average operative temperature was calculated, ranging from 4.5 °C of the east-oriented first-floor classroom in Palermo to 7.1 °C in the west-oriented second-floor classroom in Milan. The thermal comfort analysis showed that existing buildings are in the comfort range for the majority of the time in Milan and Rome, but only 60% of the period in Palermo. Conversely, the NZEB renovation leads to discomfort conditions for most of the teaching hours at all latitudes, and the application of external protection devices confirms the risk for 50–80% of the period. The combined effect of solar shading and night ventilation reduces the overheating risk to a lower level compared to the existing configuration (from 5% in Milan to 35% in Palermo). CO2 concentration analyses showed that the Indoor Air Quality is ensured in neither existing buildings nor in retrofitted ones when ventilation is provided by window opening. Average concentrations above 2000 ppm were calculated for all the configurations and acceptable values might be reached only with unsustainable window opening times during classes.
The study thus demonstrated the poor IEQ in school buildings. The situation is particularly dangerous in warmer climates: the case of Palermo clearly proves that thermal comfort conditions are not provided for a significant part of the year, even in non-insulated buildings. The use of additional passive solutions, as phase change materials and advanced ground coupled ventilation, might be envisaged, even if such technologies will significantly increase the renovation costs. Recent developments in the positive energy districts and energy communities provide new perspectives on the shared energy generation by renewables, exchange and use among buildings. The use of an active cooling system might be acceptable and sustainable in school buildings within these scenarios, in which the energy use might be optimized through proper management at district level.
It is, finally, advised that the deep energy retrofit actions should include measures aimed at preserving and improving the thermal comfort and the air quality conditions, even if they might not provide benefits from a life cycle cost perspective, assuming that the health and comfort of pupils and students are beyond economic issues. This implies a rethinking of the renovation process, often considered as a simple technological effort, where a multi-objective approach to the building design provides a healthier and comfortable built environment, besides a very high energy target.

Author Contributions

Conceptualization, D.I. and M.Z.; methodology, S.A., F.B., F.P. and M.Z.; software, S.A., D.I., F.P.; formal analysis, S.A., F.B., D.I., F.P. and M.Z.; investigation, S.A., F.B., D.I., F.P. and M.Z.; data curation, S.A.; writing—original draft preparation, F.B., F.P., M.Z.; writing—review and editing, F.P. and M.Z; visualization, M.Z; supervision, F.B. All authors have read and agreed to the published version of the manuscript.

Funding

This research received no external funding.

Institutional Review Board Statement

Not applicable.

Informed Consent Statement

Not applicable.

Data Availability Statement

Not applicable.

Conflicts of Interest

The authors declare no conflict of interest.

References

  1. International Energy Agency (IEA). Key World Energy Trends: Excerpt from World Energy Balances; International Energy Agency (IEA): Paris, France, 2016. [Google Scholar]
  2. European Parliament. Directive 2010/31/EU of the European Parliament and of the Council of 19 May 2010 on the energy performance of buildings (recast). Off. J. Eur. Union 2010, 153, 13–35. [Google Scholar]
  3. European Union. The European Green Deal—ANNEX to the Communication from the Commission to the European Parliament, the European Council, the Council, the European Economic and Social Committee and the Committee of the Regions. COM (2019) 640 Final; European Union: Brussels, Belgium, 2019. [Google Scholar]
  4. Pereira, L.D.; Raimondo, D.; Corgnati, S.P.; da Silva, M.G. Energy consumption in schools—A review paper. Renew. Sustain. Energy Rev. 2014, 40, 911–922. [Google Scholar] [CrossRef]
  5. Dimoudi, A.; Kostarela, P. Energy monitoring and conservation potential in school buildings in the C′ climatic zone of Greece. Renew. Energy 2009, 34, 289–296. [Google Scholar] [CrossRef]
  6. School of the future—Towards Zero Emission with High Performance Indoor Environment. Available online: http://www.school-of-the-future.eu/ (accessed on 9 June 2020).
  7. CHECK IT OUT! Project. Available online: https://ec.europa.eu/energy/intelligent/projects/en/projects/check-it-out (accessed on 9 June 2020).
  8. RENEWSCHOOL Project. Available online: http://www.renew-school.eu/en/home/ (accessed on 9 June 2020).
  9. ZEMedS—Zero Energy MEDiterranean Schools. Available online: http://www.zemeds.eu/ (accessed on 9 June 2020).
  10. Desideri, U.; Leonardi, D.; Arcioni, L.; Sdringola, P. European project Educa-RUE: An example of energy efficiency paths in educational buildings. Appl. Energy 2012, 97, 384–395. [Google Scholar] [CrossRef]
  11. Hong, T.; Koo, C.; Jeong, K. A decision support model for reducing electric energy consumption in elementary school facilities. Appl. Energy 2012, 95, 253–266. [Google Scholar] [CrossRef]
  12. Fiaschi, D.; Bandinelli, R.; Conti, S. A case study for energy issues of public buildings and utilities in a small municipality: In-vestigation of possible improvements and integration with renewables. Appl. Energy 2012, 97, 101–114. [Google Scholar] [CrossRef]
  13. Raatikainen, M.; Skön, J.-P.; Leiviskä, K.; Kolehmainen, M. Intelligent analysis of energy consumption in school buildings. Appl. Energy 2016, 169, 416–429. [Google Scholar] [CrossRef]
  14. Muñoz, P.; Morales, P.; Letelier, V.; Muñoz, L.; Mora, D. Implications of Life Cycle Energy Assessment of a new school building, regarding the nearly Zero Energy Buildings targets in EU: A case of Study. Sustain. Cities Soc. 2017, 32, 142–152. [Google Scholar] [CrossRef]
  15. Borrelli, M.; Merema, B.; Ascione, F.; De Masi, R.F.; Vanoli, G.P.; Breesch, H. Evaluation and optimization of the performance of the heating system in a nZEB educational building by monitoring and simulation. Energy Build. 2021, 231, 110616. [Google Scholar] [CrossRef]
  16. Guillén-Lambea, S.; Rodríguez-Soria, B.; Marín, J.M. Comfort settings and energy demand for residential NZEB in warm cli-mates. Appl. Energy 2017, 202, 471–486. [Google Scholar] [CrossRef]
  17. Harlan, S.L.; Chowell, G.; Yang, S.; Petitti, D.B.; Morales Butler, E.J.; Ruddell, B.L.; Ruddell, D.M. Heat-related deaths in hot cities: Estimates of human tolerance to high temperature thresholds. Int. J. Env. Res. Public Health 2014, 11, 3304–3326. [Google Scholar] [CrossRef] [PubMed] [Green Version]
  18. Yang, L.; Yan, H.; Lam, J.C. Thermal comfort and building energy consumption implications—A review. Appl. Energy 2014, 115, 164–173. [Google Scholar] [CrossRef]
  19. Zhaoa, Z.; Houchati, M.; Beitelmal, A. An Energy Efficiency Assessment of the Thermal Comfort in an Office building. Energy Procedia 2017, 134, 885–893. [Google Scholar] [CrossRef]
  20. Ortiz, M.A.; Kurvers, S.R.; Bluyssen, P.M. A review of comfort, health, and energy use: Understanding daily energy use and wellbeing for the development of a new approach to study comfort. Energy Build. 2017, 152, 323–335. [Google Scholar] [CrossRef]
  21. Zhengen, R.; Dong, C. Modelling study of the impact of thermal comfort criteria on housing energy use in Australia. Appl. Energy 2018, 210, 152–166. [Google Scholar]
  22. Grogan, H.; Hopkins, P.M. Heat stroke: Implications for critical care and anaesthesia. Br. J. Anaesth. 2002, 88, 700–707. [Google Scholar] [CrossRef] [PubMed] [Green Version]
  23. Gosling, S.N.; Lowe, J.A.; McGregor, G.R.; Pelling, M.; Malamud, B.D. Associations between elevated atmospheric temperature and human mortality: A critical review of the literature. Clim. Chang. 2008, 92, 299–341. [Google Scholar] [CrossRef]
  24. AECOM. Investigation into Overheating in Homes: Analysis of Gaps and Recommendations; Department for Communities and Local Government: London, UK, 2012.
  25. Wong, L.; Mui, K.; Hui, P. A multivariate-logistic model for acceptance of indoor environmental quality (IEQ) in offices. Build. Environ. 2008, 43, 1–6. [Google Scholar] [CrossRef]
  26. Ghita, S.A.; Catalina, T. Energy efficiency versus indoor environmental quality in different Romanian countryside schools. Energy Build. 2015, 92, 140–154. [Google Scholar] [CrossRef]
  27. Karimipanah, T.; Awbi, H.; Sandberg, M.; Blomqvist, C. Investigation of air quality, comfort parameters and effectiveness for two floor-level air supply systems in classrooms. Build. Environ. 2007, 42, 647–655. [Google Scholar] [CrossRef]
  28. Clements-Croome, D.; Awbi, H.; Bakó-Biró, Z.; Kochhar, N.; Williams, M. Ventilation rates in schools. Build. Environ. 2008, 43, 362–367. [Google Scholar] [CrossRef] [Green Version]
  29. Wang, Y.; Zhao, F.-Y.; Kuckelkorn, J.; Liu, D.; Liu, L.-Q.; Pan, X.-C. Cooling energy efficiency and classroom air environment of a school building operated by the heat recovery air conditioning unit. Energy 2014, 64, 991–1001. [Google Scholar] [CrossRef]
  30. Niemelä, T.; Kosonen, R.; Jokisalo, J. Cost-optimal energy performance renovation measures of educational buildings in cold climate. Appl. Energy 2016, 183, 1005–1020. [Google Scholar] [CrossRef]
  31. Perez, Y.V.; Capeluto, I.G. Climatic considerations in school building design in the hot–humid climate for reducing energy consumption. Appl. Energy 2009, 86, 340–348. [Google Scholar] [CrossRef]
  32. Wang, Y.; Zhao, F.-Y.; Kuckelkorn, J.; Spliethoff, H.; Rank, E. School building energy performance and classroom air envi-ronment implemented with the heat recovery heat pump and displacement ventilation system. Appl. Energy 2014, 114, 58–68. [Google Scholar] [CrossRef]
  33. Allab, Y.; Pellegrino, M.; Guo, X.; Nefzaoui, E.; Kindinis, A. Energy and comfort assessment in educational building: Case study in a French university campus. Energy Build. 2017, 143, 202–219. [Google Scholar] [CrossRef]
  34. Hameen, E.C.; Ken-Opurum, B.; Son, Y.J. Protocol for Post Occupancy Evaluation in Schools to Improve Indoor Environmental Quality and Energy Effciency. Sustainability 2020, 12, 3712. [Google Scholar] [CrossRef]
  35. Bogdanovica, S.; Zemitis, J.; Bogdanovics, R. The Effect of CO2 Concentration on Children’s Well-Being during the Process of Learning. Energies 2020, 13, 6099. [Google Scholar] [CrossRef]
  36. Alonso, A.; Llanos, J.; Escandón, R.; Sendra, J. Effects of the COVID-19 Pandemic on Indoor Air Quality and Thermal Comfort of Primary Schools in Winter in a Mediterranean Climate. Sustainability 2021, 13, 2699. [Google Scholar] [CrossRef]
  37. Zhou, Z.; Feng, L.; Zhang, S.; Wang, C.; Chen, G.; Du, T.; Li, Y.; Zuo, J. The operational performance of “net zero energy building: A study in China. Appl. Energy 2016, 177, 716–728. [Google Scholar] [CrossRef]
  38. Ye, B.; Jiang, J.; Miao, L.X.; Yang, P. Sustainable energy options for a low carbon demonstration city project in Shenzhen, China. J. Renew. Sustain. Energy 2015, 7, 23117–23122. [Google Scholar]
  39. Mlecnik, E.; Schütze, T.; Jansen, S.; de Vries, G.; Visscher, H.; van Hal, A. End-user experiences in nearly zero-energy houses. Energy Build. 2012, 49, 471–478. [Google Scholar] [CrossRef]
  40. Fabbri, K.; Tronchin, L. Indoor Environmental Quality in Low Energy Buildings. Energy Procedia 2015, 78, 2778–2783. [Google Scholar] [CrossRef] [Green Version]
  41. Trofimova, P.; Cheshmehzangi, A.; Deng, W.; Hancock, C. Post-Occupancy Evaluation of Indoor Air Quality and Thermal Performance in a Zero Carbon Building. Sustainability 2021, 13, 667. [Google Scholar] [CrossRef]
  42. Zalejska-Jonsson, A. Evaluation of low-energy and conventional residential buildings from occupants’ perspective. Build. Environ. 2012, 58, 135–144. [Google Scholar] [CrossRef]
  43. Larsen, T.S.; Jensen, R.L.; Daniels, O. The Comfort Houses—Measurements and Analysis of the Indoor Environment and Energy Consumption in 8 Passive Houses 2008–2011; DCE Technical Report No. 145; Department of Civil Engineering, Aalborg University: Aalborg, Denmark, 2012. [Google Scholar]
  44. Derbez, M.; Berthineau, B.; Cochet, V.; Pignon, C.; Ribéron, J.; Wyart, G.; Mandin, C.; Kirchner, S. A 3-year follow-up of indoor air quality and comfort in two energy-efficient houses. Build. Environ. 2014, 82, 288–299. [Google Scholar] [CrossRef]
  45. Duran, Ö.; Taylor, S.; Lomas, K. The Impact of Refurbishment on Thermal Comfort in Post-war Office Buildings. Energy Procedia 2015, 78, 877–882. [Google Scholar] [CrossRef] [Green Version]
  46. Salvalai, G.; Malighetti, L.E.; Luchini, L.; Girola, S. Analysis of different energy conservation strategies on existing school buildings in a Pre-Alpine Region. Energy Build. 2017, 145, 92–106. [Google Scholar] [CrossRef]
  47. Ministero dell’Istruzione dell’Università e della Ricerca (MIUR). Anagrafe Dell’edilizia Scolastica; Ministero dell’Istruzione dell’Università e della Ricerca (MIUR): Rome, Italy, 2015.
  48. Agenzia Nazionale per l’Efficienza Energetica, ENEA. Rapporto Annuale Sull’efficienza Energetica—Analisi e Risultati delle Policy di Efficienza Energetica del Nostro Paese; ENEA: Rome, Italy, 2017. [Google Scholar]
  49. Zinzi, M.; Pagliaro, F.; Agnoli, S.; Bisegna, F.; Iatauro, D. Assessing the overheating risks in Italian existing school buildings renovated with nZEB targets. Energy Procedia 2017, 142, 2517–2524. [Google Scholar] [CrossRef]
  50. ASHRAE 62/89. Ventilation for Acceptable Indoor Air Quality; ASHRAE: Peachtree Corners, GE, USA, 1989. [Google Scholar]
  51. Wong, L.T.; Mui, K.; Wai, M.K. A transient ventilation demand model for air-conditioned offices. Appl. Energy 2008, 85, 545–554. [Google Scholar] [CrossRef]
  52. Mui, K.W.; Wong, L.T. Evaluation of the neutral criterion of indoor air quality for air-conditioned offices in subtropical climates. Build. Serv. Eng. Res. Technol. 2007, 28, 23–33. [Google Scholar] [CrossRef]
  53. BSI. EN 15251—Indoor Environmental Input Paramters to Design and Assessment of Energy Performance of Buildings—Addressing Indoor Air Quality, Thermal Environment, Lighting and Acoustics, CEN; BSI: London, UK, 2007. [Google Scholar]
  54. Presidential Decree 412/1993. Regolamento Recante Norme per la Progettazione, L’installazione, L’esercizio e la Manutenzione degli Impianti termici degli Edifici ai fini del Contenimento dei Consumi di Energia, in Attuazione dell’art. 4, Comma 4, della L. 9 Gennaio 1991, n. 10. Available online: https://www.gazzettaufficiale.it/eli/id/1993/10/14/093G0451/sg (accessed on 9 June 2020).
  55. Ente Nazionale Italiano di Unificazione. UNI 10339:1995—Air-conditioning Systems for Thermal Comfort in Buildings. General, Classification and Requirements. Offer, Order and Supply Specifications; Ente Nazionale Italiano di Unificazione: Milano, Italy, 1995. [Google Scholar]
  56. Ministerial Decree 18 December 1975. Norme Tecniche Aggiornate Relative All’edilizia Scolastica, ivi Compresi gli Indici di Funzionalità Didattica, Edilizia ed Urbanistica, da Osservarsi nella Esecuzione di Opere di Edilizia Scolastica. Available online: https://www.minori.gov.it/sites/default/files/dm_18_dicembre_1975.pdf (accessed on 9 June 2020).
  57. ISO. Ergonomics of the Thermal Environment—Analytical Determination and Interpretation of Thermal Comfort using Calculation of the PMV and PPD Indices and Local Thermal Comfort Criteria. ISO 7730:2005; International Organization for Standardization: Geneva, Switzerland, 2015. [Google Scholar]
  58. Zinzi, M.; Agnoli, S.; Battistini, G.; Bernabini, G. Deep energy retrofit of the TM Plauto School in Italy—A five years experience. Energy Build. 2016, 126, 239–251. [Google Scholar] [CrossRef]
  59. Ministerial Decree 26 June 2015. Applicazione delle Metodologie di Calcolo delle Prestazioni Energetiche e Definizione delle Prescrizioni e dei Requisiti Minimi degli Edifici. Available online: https://www.mise.gov.it/images/stories/normativa/DM_requisiti_minimi.pdf (accessed on 9 June 2020).
  60. Heschong, L.; Wright, R.; Okura, S. Daylighting in Schools. In Proceedings of the ACEEE Summer Study on Energy Efficiency in Buildings, Pacific Grove, CA, USA, 16–21 August 2000. [Google Scholar]
  61. Wu, W.; Ng, E. A review of the development of daylighting in schools. Light Res. Technol. 2003, 35, 111–124. [Google Scholar] [CrossRef] [Green Version]
  62. Edilclima Software. Available online: www.edilclima.it (accessed on 9 June 2020).
  63. Ente Nazionale Italiano di Unificazione. UNI-TS 11300 Prestazioni Energetiche Degli Edifice—Parte 1: Determinazione del Fabbisogno di Energia Termica Dell’edificio per la Climatizzazione Estiva ed Invernale; Ente Nazionale Italiano di Unificazione: Milano, Italy, 2014. [Google Scholar]
  64. TRNSYS 16. Available online: www.trnsys.com (accessed on 9 June 2020).
  65. Warren, P.R.; Parkins, L.M. Single-sided ventilation through open windows. In Thermal Performance of the Exterior Envelopes of Buildings; ASHRAE: Peachtree Corners, GE, USA, 1985; p. 20. [Google Scholar]
Figure 1. Scheme of the typical school floor.
Energies 14 02799 g001
Figure 2. Operative temperature evolution in an east-oriented classroom in Rome—1 to 7 May.
Energies 14 02799 g002
Figure 3. Frequency distribution of operative temperature differences between south-oriented classrooms at intermediate and upper floors in Milan.
Energies 14 02799 g003
Figure 4. Cumulative distribution of the operative temperature in Milan for the following RB configurations: RB (a), NZEB + shad (b) and NZEB + shad + vent (c).
Energies 14 02799 g004
Figure 5. Relative discomfort hours of the different building configurations in Milan.
Energies 14 02799 g005
Figure 6. Relative discomfort hours of the different building configurations in Rome.
Energies 14 02799 g006
Figure 7. Relative discomfort hours of the different building configurations in Palermo.
Energies 14 02799 g007
Figure 8. Frequency distribution of CO2 concentration in the south-oriented classroom in Rome.
Energies 14 02799 g008
Figure 9. Average CO2 concentration versus window opening period per hour for the NZEB with external shading devices and the south-oriented classroom.
Energies 14 02799 g009
Table 1. Climatic and operational data in the selected cities.
CityClimatic ZoneHDDsHeating Season
PalermoB7511 December–15 March
RomeD14151 November–15 April
MilanE240415 October–15 April
Table 2. U-values for the RB configurations: existing and retrofitted depending on the Italian location.
ComponentU (W/m2 K)
Existing ConfigurationNZEB Configurations
PalermoRomeMilan
External wall1.700.390.300.28
Concrete and masonry roof1.330.310.250.24
Concrete and masonry base floor1.290.400.310.29
Windows5.81.61.61.3
Table 3. Space heating energy performance with ACH 1.4 h−1.
Building ConfigurationSpace Heating Needs (kWh/m2)
MilanRomePalermo
SouthNorthWestEastSouthNorthWestEastSouthNorthWestEast
Existing configuration20121121022411512512413868706979
NZEB configuration626968633137363218191919
Table 4. Space heating energy performance with ACH 0.3 h−1.
Building ConfigurationSpace Heating Needs (kWh/m2)
MilanRomePalermo
SouthNorthWestEastSouthNorthWestEastSouthNorthWestEast
Existing configuration14515715617280898910450504960
NZEB configuration1520212158884444
Table 5. Average operative temperature in the classrooms.
Building ConfigurationAbsolute and Difference Average Operative Temperature (°C)
MilanRomePalermo
SouthEastNorthWestSouthEastNorthWestSouthEastNorthWest
Top_Existing (int. floor)23.324.022.723.424.925.424.024.725.625.524.324.8
Top_Existing (up. floor)23.624.123.023.625.225.624.224.925.825.624.524.9
ΔTop_NZEB (int. floor)6.46.45.66.85.25.24.65.554.54.34.9
ΔTop_NZEB (up. floor)6.66.85.97.15.55.65.15.95.45.14.85.4
ΔTop_NZEB + shad (int. floor)2.83.03.83.41.72.03.12.61.31.83.12.4
ΔTop_NZEB + shad (up. floor)3.03.44.03.82.02.53.63.11.72.43.63.0
ΔTop_NZEB + shad + vent (int. floor)0.40.21.10.6−0.6−0.50.5−0.1−0.8−0.40.60.1
ΔTop_NZEB + shad + vent (up. floor)0.50.51.20.8−0.5−0.30.80.2−0.60.01.00.5
Table 6. Average CO2 concentration in the selected cities, for south- and east-oriented classrooms.
CityCO2 Concentration (ppm)
ExistingNZEBNZEB + ShadNZEB + Shad + VentExistingNZEBNZEB + ShadNZEB + Shad + Vent
SouthEast
Milan22032002212422942170197920952262
Rome21482025217023352115199021262287
Palermo22212051218322722198204921672253
Publisher’s Note: MDPI stays neutral with regard to jurisdictional claims in published maps and institutional affiliations.

