Article

A Novel Bio-Architectural Temporary Housing Designed for the Mediterranean Area: Theoretical and Experimental Analysis

1
Mechanical, Energy and Management Engineering Department, University of Calabria (Italy), 87036 Rende, Italy
2
Department of Agriculture, Mediterranean University of Reggio Calabria (Italy), 89124 Reggio Calabria, Italy
*
Author to whom correspondence should be addressed.
Energies 2022, 15(9), 3243; https://doi.org/10.3390/en15093243
Submission received: 20 March 2022 / Revised: 15 April 2022 / Accepted: 27 April 2022 / Published: 28 April 2022

Abstract

:
Energy performances of an innovative Temporary Housing Unit (THU), made of natural materials and developed for the Mediterranean area, were determined. Cork panels limit winter transmission losses, whereas bio-PCMs were applied to reduce cooling needs properly. Assuming a split system for air-conditioning purposes, simulations in EnergyPlus allowed for identifying the optimal configuration that minimizes the annual electric demand. Bio-PCM melting temperatures, locations inside the external walls and the PCM quantities were varied. An ideal melting temperature of 23 °C was identified, whereas a double PCM layer uniformly distributed in the external walls is recommended, mainly for the limitation of the cooling demands. Negligible differences in electric requirements have been observed between the continuous and the scheduled functioning of the split system. A PV generator installed on the available roof surface allows for covering the electric demands satisfactorily. Experimental tests carried out in a climatic chamber have allowed for determining the dynamic thermal performance of the optimized panel by considering variable external conditions. Results show how the considered PCM in summer is able to delay and attenuate the indoor air temperature peaks considerably, confirming the crucial role of bio-PCM to reduce cooling demands, in line with the simulation results.

1. Introduction

In recent years, the research in the building sector has been focused on the study and the identification of appropriate natural materials to use in envelope assembling to increase the sustainability level, in terms of energy consumption [1], limitation and reduction of artificially manufactured goods [2]. Indeed, buildings are a large source of environmental pollution due to the energy needs, extraction, processing, transport, assembly and successive disposal of the involved materials [3,4]. The “bio-architecture” approach allows for rational exploitation of natural resources, reducing artificial raw materials and wastes, and promoting the use of natural materials to be recycled after the disposal phase [5,6]. For this purpose, buildings also have to be planned and designed by considering eventual disassembling procedures and this target can be attained by preferring dry-assembled wall solutions [7,8]. This approach is particularly indicated for Temporary Housing Units (THUs), quickly assembled in emergency cases and successively disposed, and whose demand, in recent years, has seen a large increase due to the management of migratory fluxes. In 2021 in Europe, in fact, 123,000 economic immigrants arrived [9], and in 2022 further growth is expected due to the events connected with the Russia–Ukraine war, with an estimate of more than 1 million refugees [10]. A rapid solution to manage this emergency is represented by THUs, which allow for assembling temporary structures in reduced times [11]. In this context, the “Sustanzeb” project started in Italy in 2018 [12] can be mentioned, because it was targeted to design an innovative bio-architectural THU specifically optimized for warm climates [13]. In the Mediterranean area, in fact, envelopes have to be built to find the best compromise to reduce heating and cooling needs, with the latter often prevailing over the first [14,15]. This goal is difficult to achieve because design choices that limit heating needs, such as large transparent surfaces toward the south [16], produce an increase in cooling requirements, and vice versa (e.g., the installation of fixed shading devices) [17,18]. In light of this, a modular innovative THU solution, specifically conceived to respond rationally to the particular climatic characteristics of the Mediterranean area, is proposed. The novel THU is assembled by a frame of wood-bearing beams easily adaptable on every ground configuration, on which suitable external panels that conciliate winter and summer needs are installed. In particular, cork panels are used as a natural element to exploit the excellent insulation properties, contrasting winter transmission losses [19]. Nevertheless, the use of the same cork panels could be counterproductive in summer because they could favor indoor overheating in the presence of high transmitted solar gains. Therefore, the inclusion of a proper bio-PCM, was considered for the envelope assembling in order to store the energy gains surplus in the form of latent heat, delaying the indoor air temperature dropping in winter and attenuating the indoor air temperature peaks in summer [20]. When PCMs are derived from natural elements, the need to make building envelopes with sustainable and recyclable materials is completely met. Currently, in the literature, no relevant and similar documents are found, with particular reference to the employment of bio-architectural THUs located in warm climates. Recently, in [21] a material review and a comparative analysis determining the THU feasibility were conducted for solutions developed in India to respond adequately to tropical hurricanes. In [22], an investigation to determine the greenhouse gas emissions from supplying emergency THUs developed for Japan’s needs was conducted by using a Life Cycle Assessment (LCA) considering construction methods and usage life. Results show that THUs with high thermal performance are profitable when the usage time is greater than 5 years. In the study conducted in [23], the authors investigated how the emergency housing units built in Japan after the 2011 earthquake were reused after the disposal phase. They found that the use of wooden piles for the THU foundation is frequently problematic because recycling is often impractical. The assessment of the sustainability index of different post-disaster THU configuration types was addressed in [24], by introducing a novel model that enables decision makers to select the most suitable THU, based on the characteristics and requirements of each case. Themes connected with another crucial target, represented by the achievable thermal comfort, were addressed in [25], in which the author, after obtaining information by targeted surveys, formulated design criteria including the issues connected with the achievement of proper comfort indices, in the arid region of the Gaza strip. In [26], a novel optimization model that maximizes the sustainability indices by simulating the design of THU interior geometries was developed to reduce the environmental impact. Similar work was conducted in [27], in which a multi-criteria decision-making method, developed to determine the sustainability of the temporary units, was referred to a case study in Bam (Iran). An investigation has also involved THUs developed for the Mediterranean area [28], however, the proposed modular and lightweight THU was not assembled from natural materials, but rather from artificial reinforced Expanded Polystyrene (EPS) panels. Many other documents concern the structural analysis of other innovative solutions and are therefore not relevant to the aim of this study.
The main goal of this document, in fact, is the identification of an optimized THU configuration based on the massive employment of natural elements that minimize the annual electric energy consumption for heating and cooling, supposing a split system to control the indoor air temperature. Furthermore, it was also verified if a PV generator is appropriate to make the proposed THU self-sustainable from an energy point of view to cover heating and cooling needs of the optimized configuration. The latter is identified by varying the features of particular external panels made of cork and bio-PCM and employed for the envelope assembling. In particular, analyses performed in the EnergyPlus environment were targeted mainly at the limitation of cooling requirements by considering bio-PCMs with different melting temperatures, location in the external walls and quantity. Finally, once the optimal external panels were identified, an experimental campaign carried out in a climatic chamber allowed for the thermal characterization in terms of the main dynamic parameters, that better describe the behavior of the proposed THU in cooling-dominant climates.

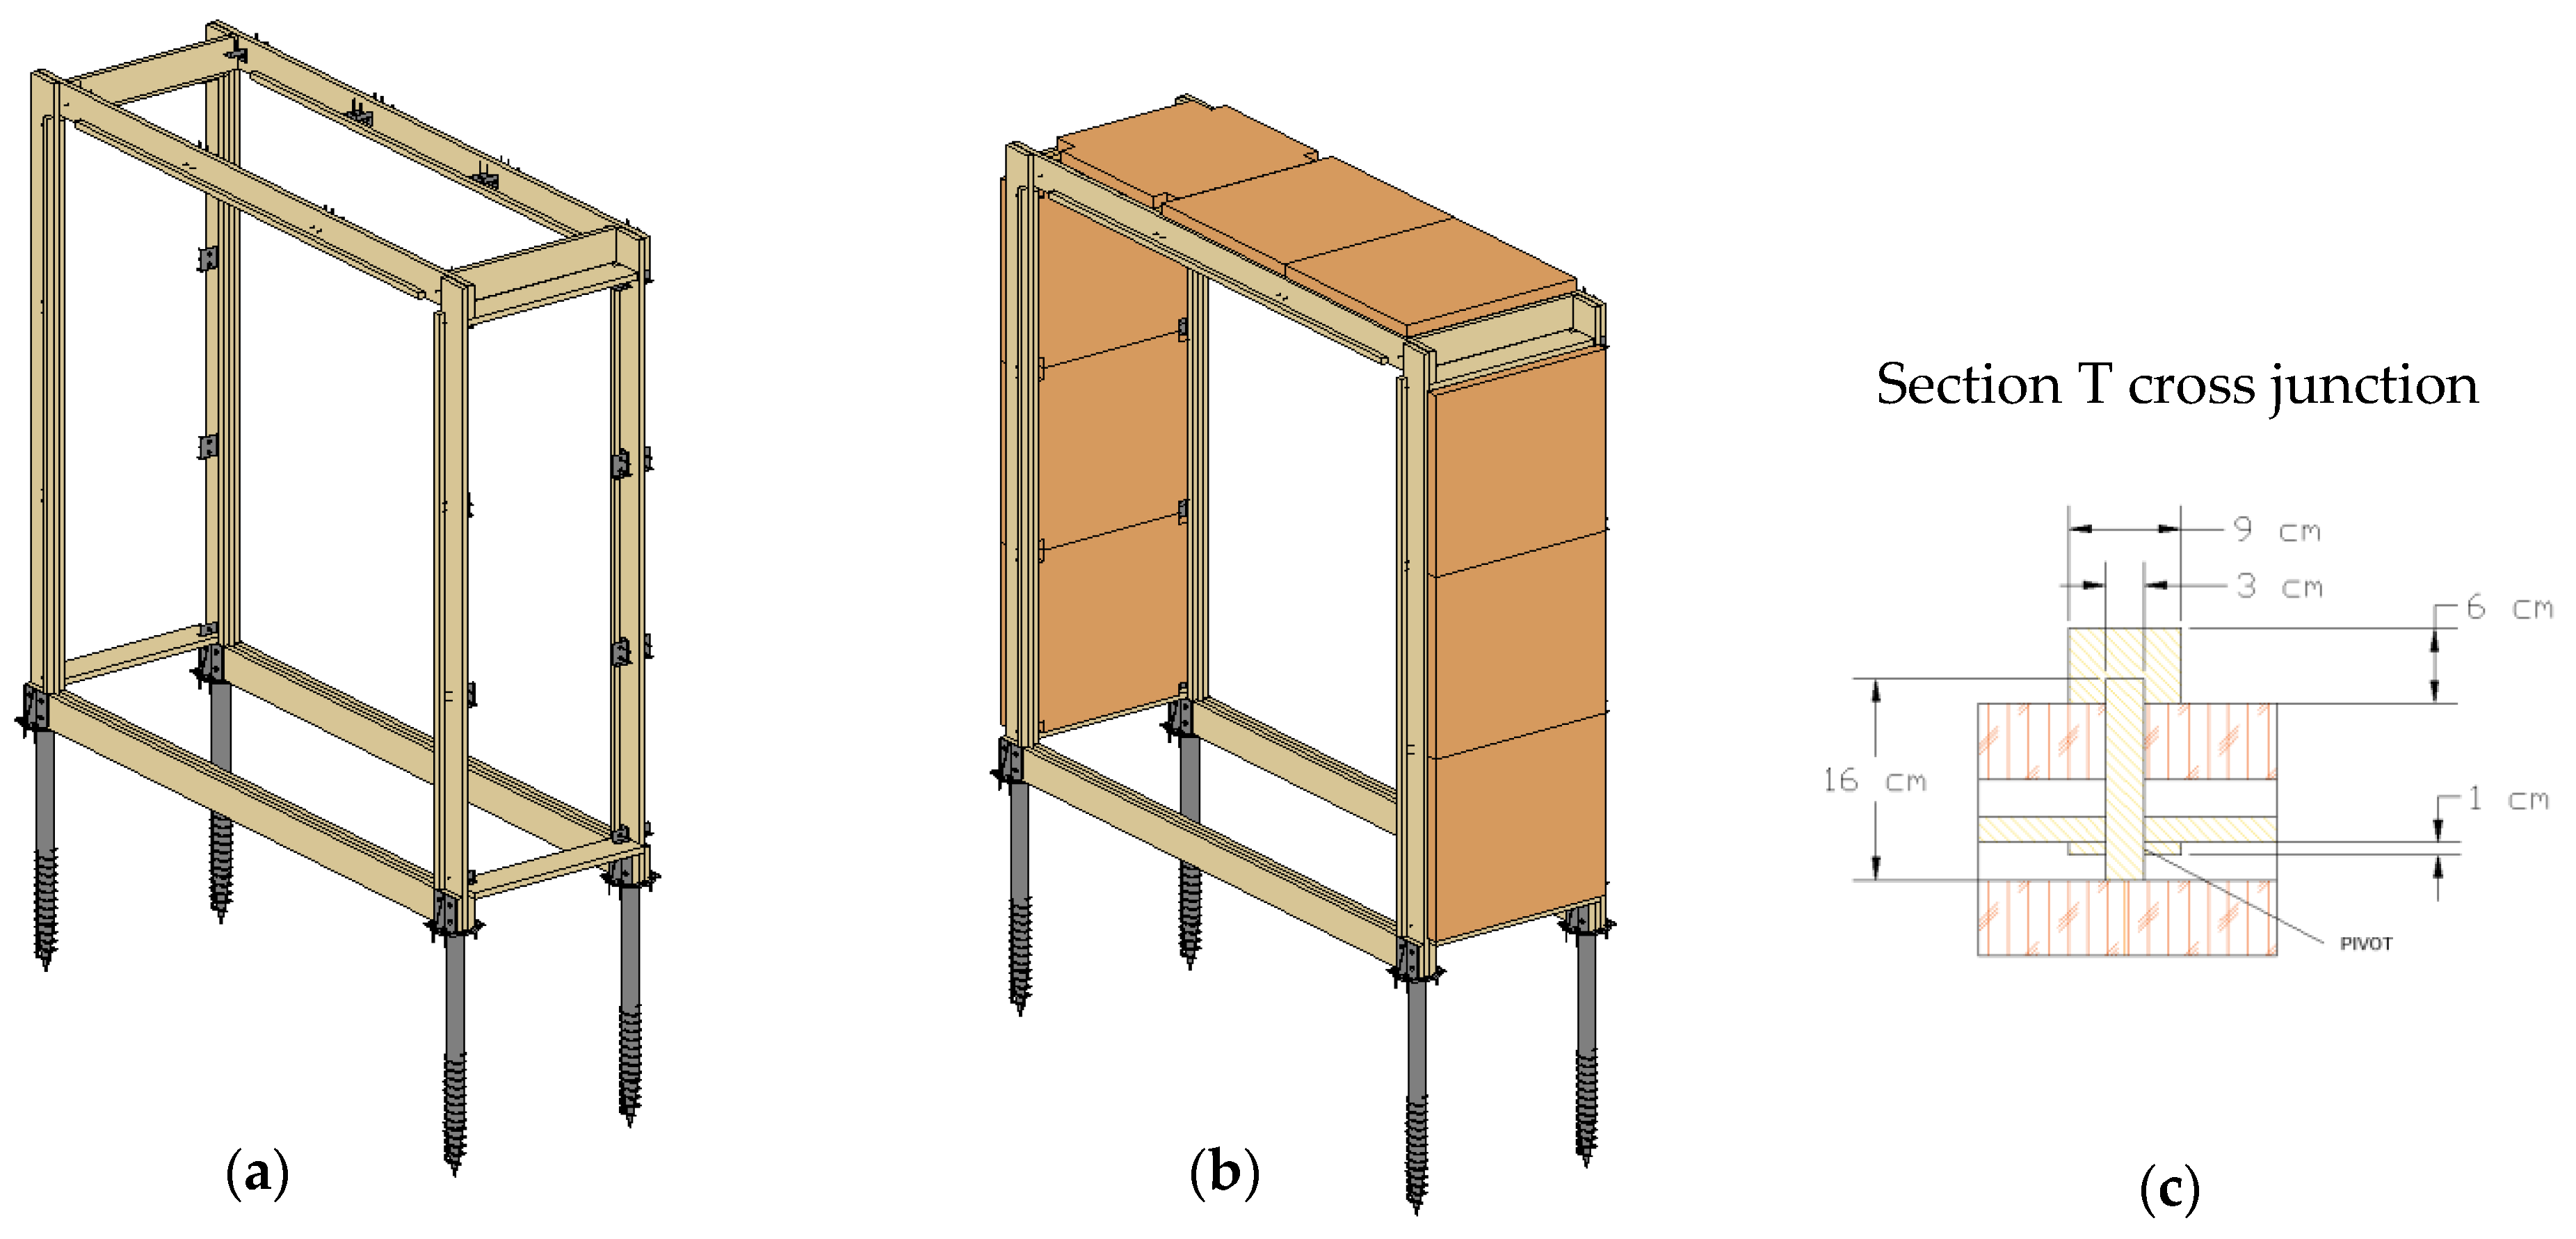
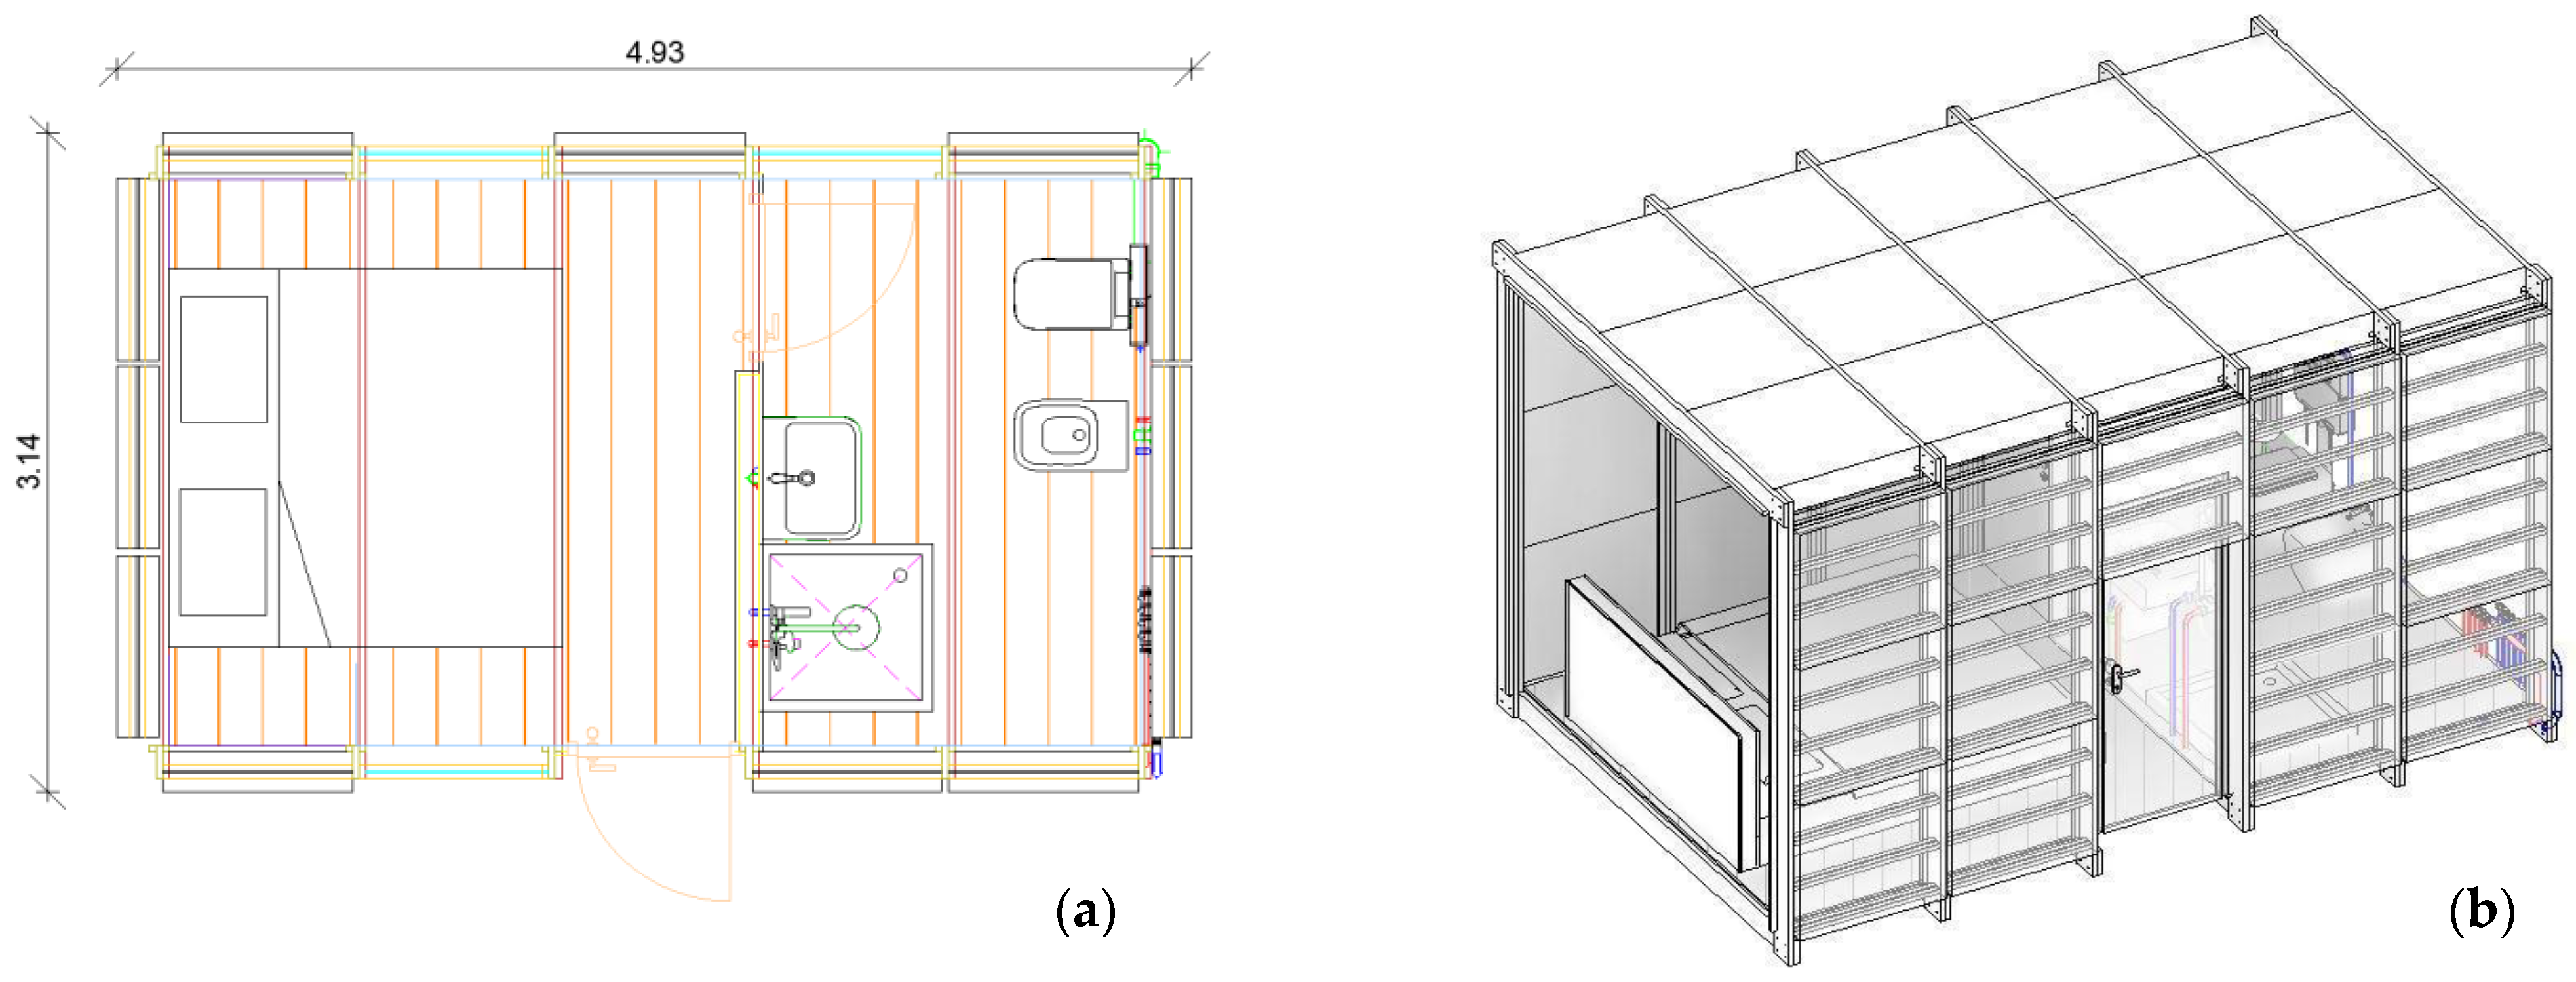
2. Materials and Methods

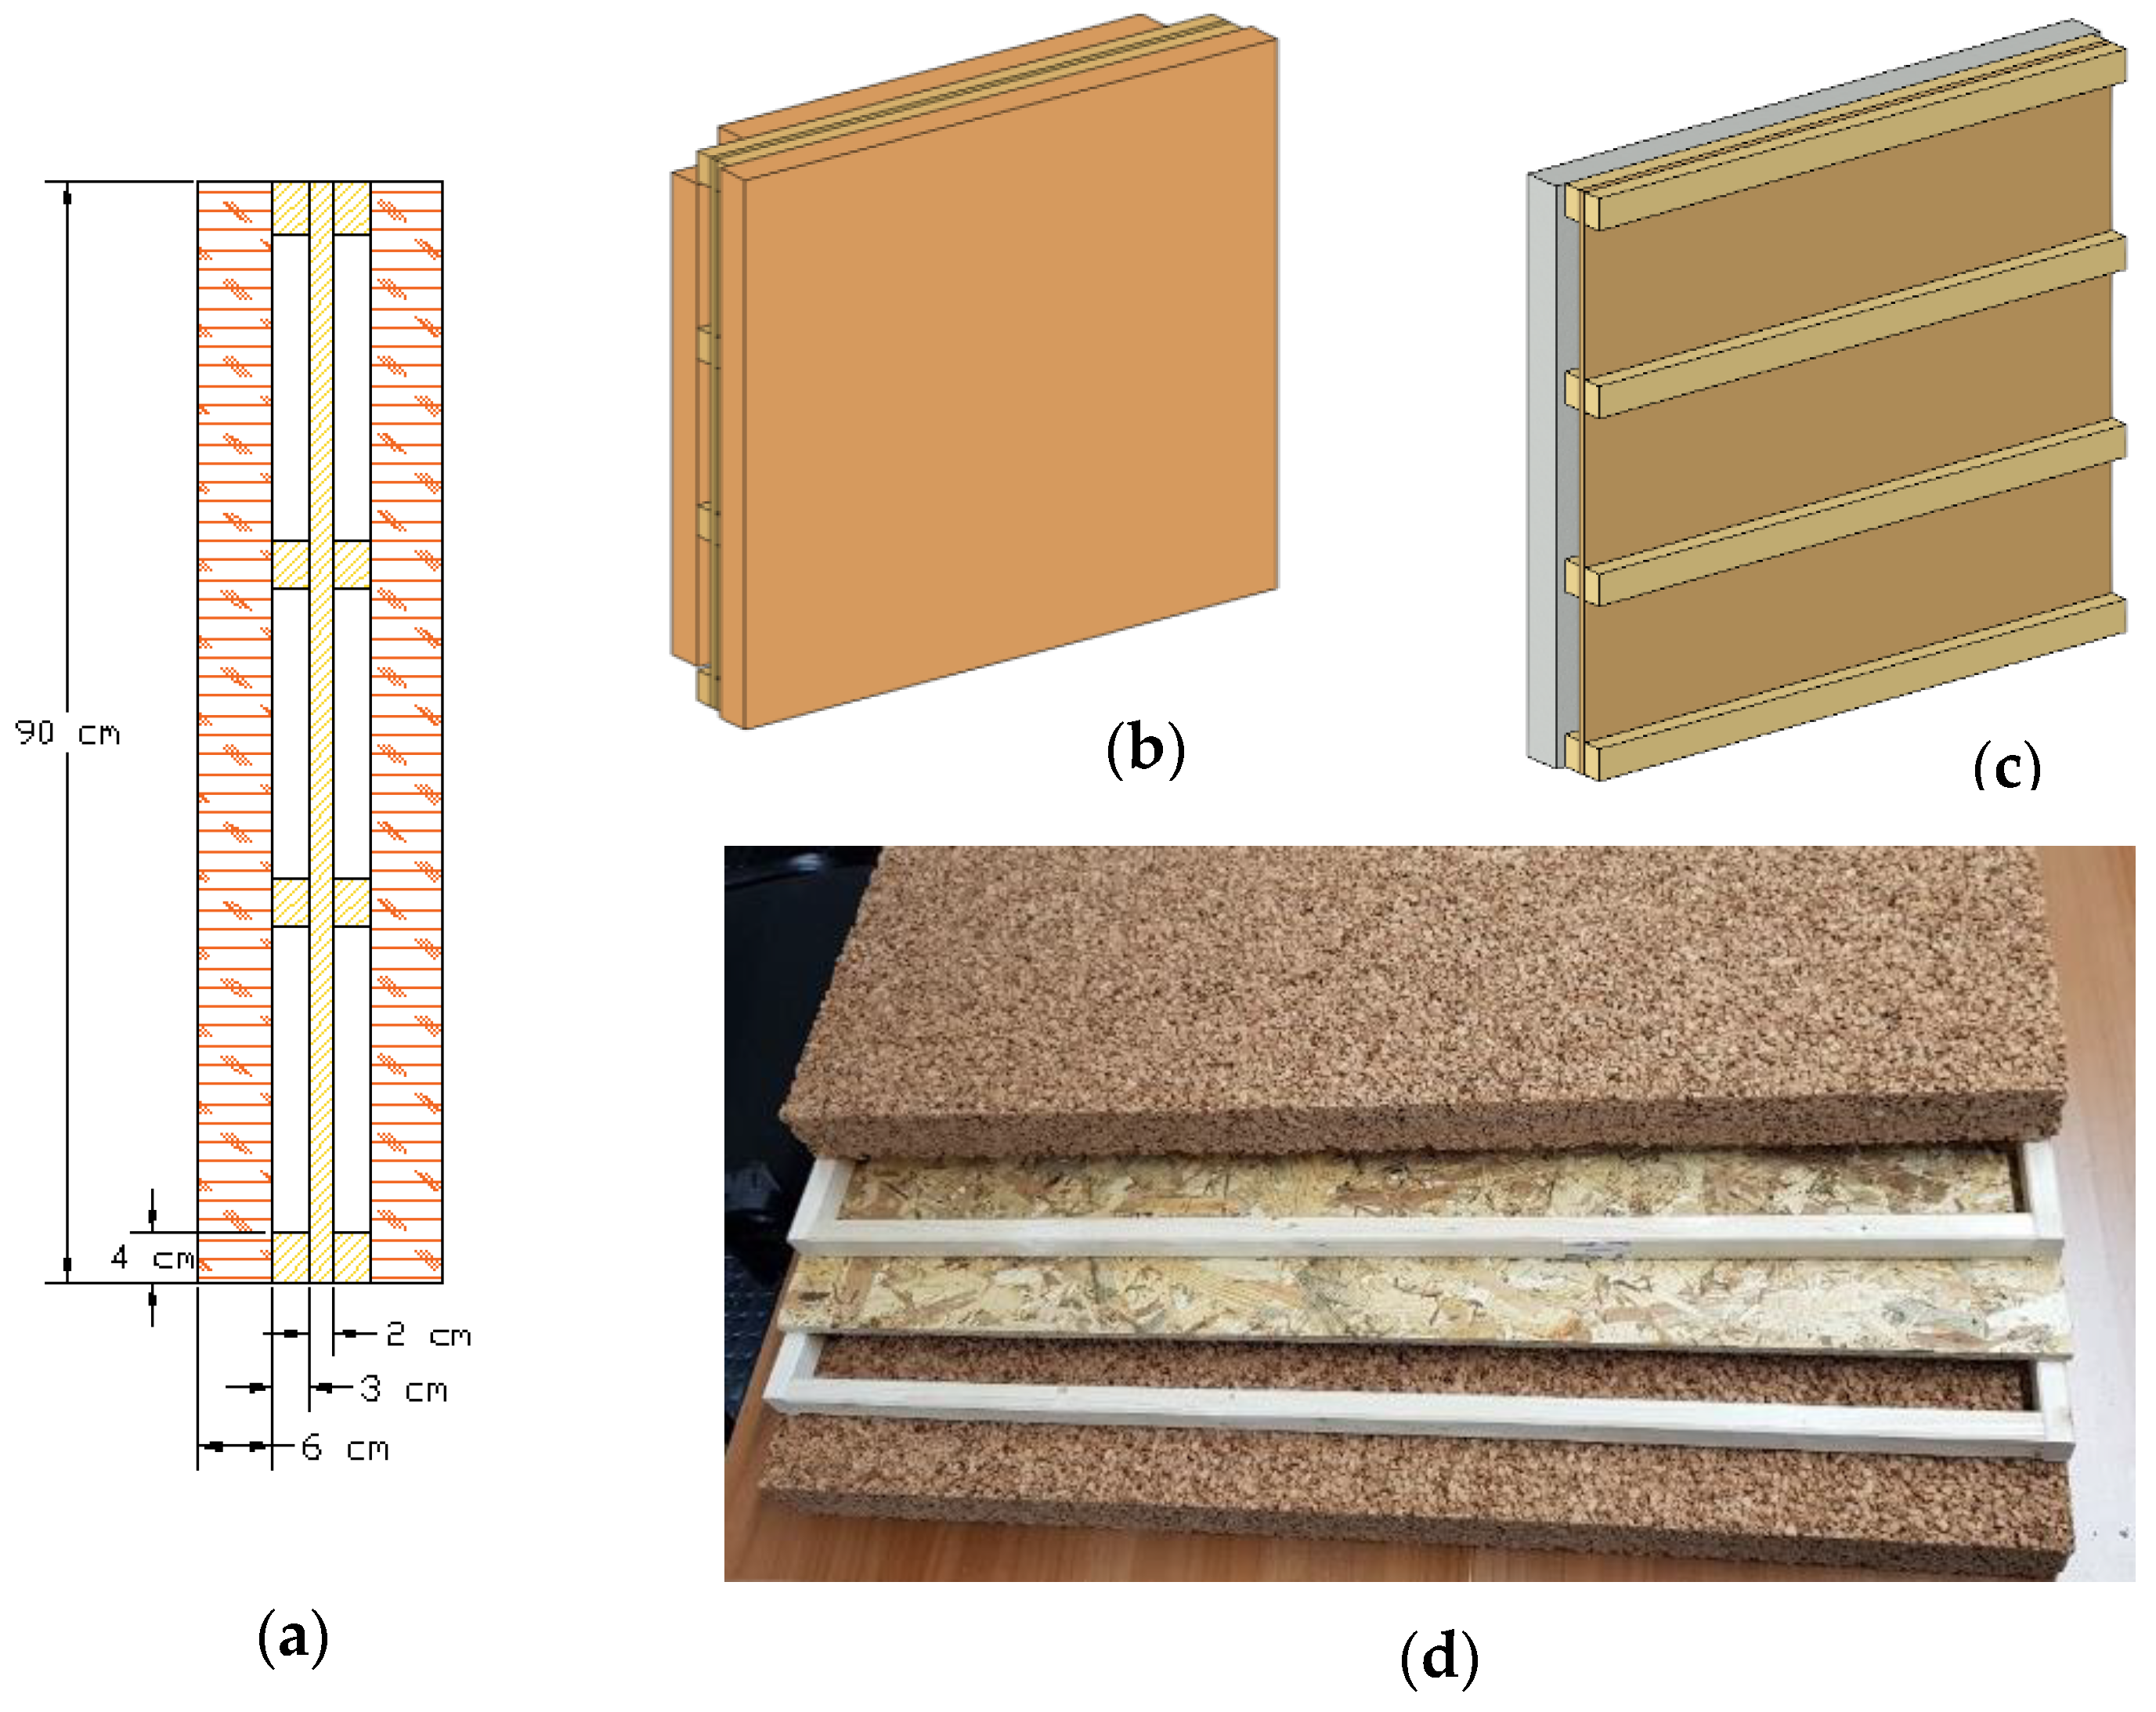
2.1. Physical Properties of the Panels Constituting the Envelope

The prototype derived from the “Sustanzeb” project is based on the massive use of cork because it is widely available in Italy. This country is one of the main exporters in the world, with 15 ktons produced per year, and Sardinia alone contributes 12 ktons [29]. The cork is biological, the extraction phase does not require the tree to be cut down, the regeneration time is about 9 years and the lifespan is 250–300 years. Furthermore, cork is completely recyclable to promote sustainable processing, reuse and limitation of the environmental impact [19,30]. Cork panels are suitable for the building sector due to their excellent mechanical, acoustic and insulating features, accompanied by light weight, elastic and vibration resistance characteristics [31]. Despite cork being an evident porous material, it is also waterproofing and it does not attract rodents and insects [32]. In Table 1, some properties of a commercial cork panel, to employ in buildings, are listed.
The low thermal conductivity makes cork an excellent insulating material, and this value is little affected by temperature variations and thermal dilatations are limited (see Table 2).
The proposed THU is assembled by modular panels named “SuberWall” [34], with a nominal size of 90 × 90 cm. It is composed of a cork layer 6 cm thick, a non-ventilated air gap of 3 cm, horizontally delimited at the top and the bottom by 4 cm of wooden laths, an internal support layer made by 2 cm of Oriented Strand Board (OSB) and finally another 3 cm of non-ventilated air gap and 6 cm of another cork layer (Figure 1a,b). Some physical properties are listed in Table 2. Therefore, two air gaps located on the inner and outer sides of the panel have been planned to host the PCMs. In order to increase the panel rigidity, other wooden laths are installed horizontally at a uniform distance to improve mechanical resistance (Figure 1c). In Figure 1d, the layers involved in the SuberWall panel are depicted after the disassembly phase, confirming the recovery of the materials when SuberWall panels are disposed of. The attained steady U-value is 0.336 W/m2K without PCMs.
The assembled SuberWall panel offers several strengths:
(1)
limitation of the assembling time;
(2)
limited weight (lower than 20 kg) that allows it to be managed by a single worker;
(3)
suitable mechanical, acoustic and thermal requirements;
(4)
potential complete recovery and recycling of every involved material.
In the proposed THU, the SuberWall panels are installed on a wooden frame (see Figure 2a) utilizing T junctions (Figure 2c) to form the base “M module” equipped with 3 horizontal and 6 vertical SuberWall panels (Figure 2b). There are geometric discontinuities on the THU’s vertical and horizontal corners that promote the thermal bridge effect; however, this aspect was considered properly in the THU energy analysis.
Every M module is equipped with four adjustable screws to use in the foundation system to regulate the housing unit’s horizontal level. This solution also allows for installing the structure on uneven terrains and, moreover, a safety height of at least 20 cm over the soil can be implemented to overcome issues connected, for instance, to the presence of water. Many appropriately located M structures allow for producing THUs with different shapes and sizes following users’ needs. The reference housing unit analyzed in this study is composed of 5 M structures with the plan layout shown in Figure 3a,b.
As depicted in Figure 2b, the SuberWall panel is also used for assembling the ceiling whereas the suspended floor is composed of a surface finish material in wood/OSB (1) that is 3 cm thick, over a cork layer of 12 cm (2) and another OSB panel of 3 cm (see Figure 4). Table 3 lists the thermophysical characteristics of the used materials.
From Figure 3a, the presence of 3 windows to ensure internal daylight can be noticed. Every window has a size of 90 × 90 cm and is equipped with a 4-12-4 double-pane glazing filled with air and installed on a wooden frame. An internal shading device with a high reflection coefficient was included for the control of solar gains [35]. The entrance door is made of two layers of wood panel, each 1 cm thick, wrapping a non-ventilated air gap of 3 cm, with a size 90 × 200 cm. However, to allow the door installation, a module that was specifically manufactured, different from the base M module, was conceived. Table 4 lists the thermal transmittances (steady U-values) of the several envelope elements as well as the normal solar factor of glazing, the latter assuming that shading devices are completely opened. Table 4 also lists, inside the round brackets, the correspondent thresholds that Italian regulations currently impose for building renovation [36]. It is worth noting that the reference normal solar factor denotes a glazing system with an activated shading device. Energy performances in simulation tools were determined regarding the weather data of Reggio Calabria (south Italy, 38.1° N, 15.6° E, CSa following the Köppen classification [37]) with typical Mediterranean climate features [38].

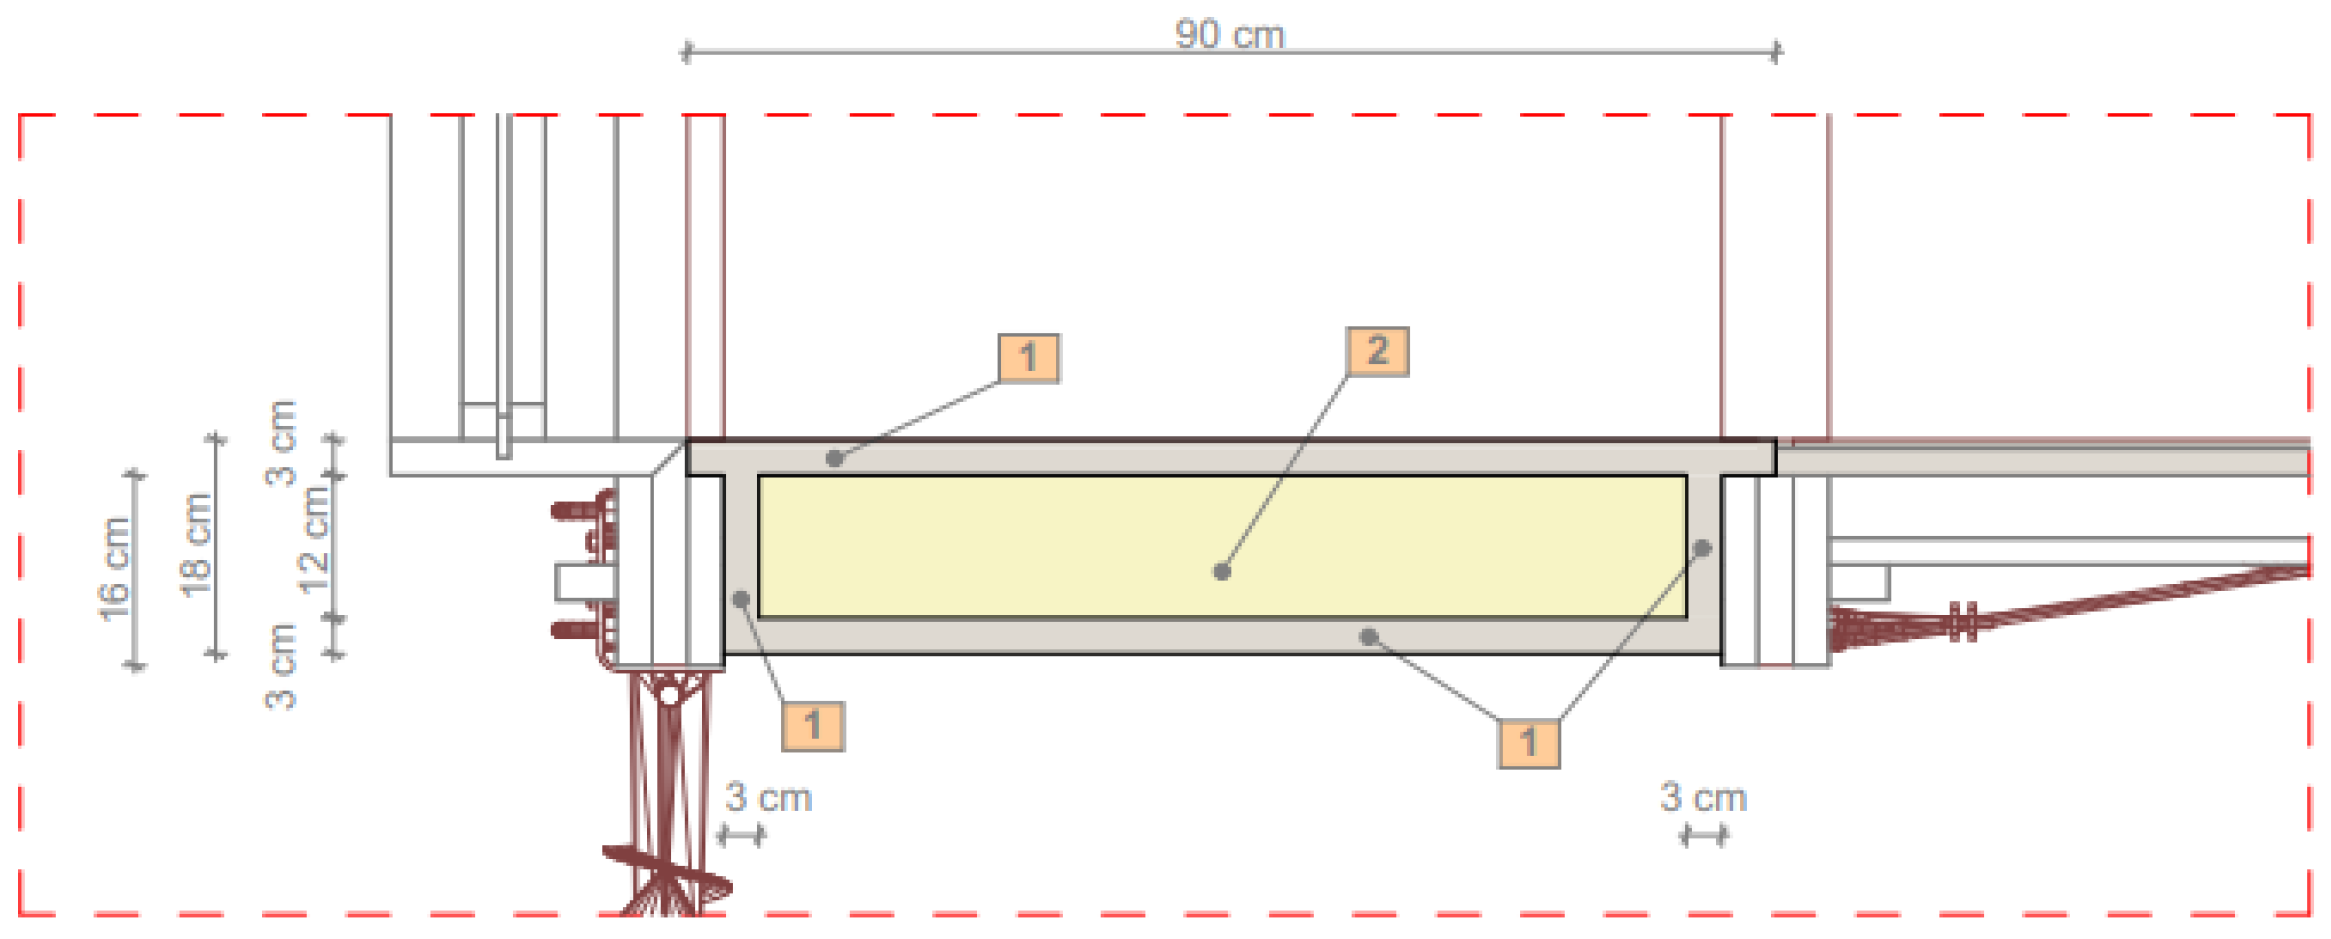
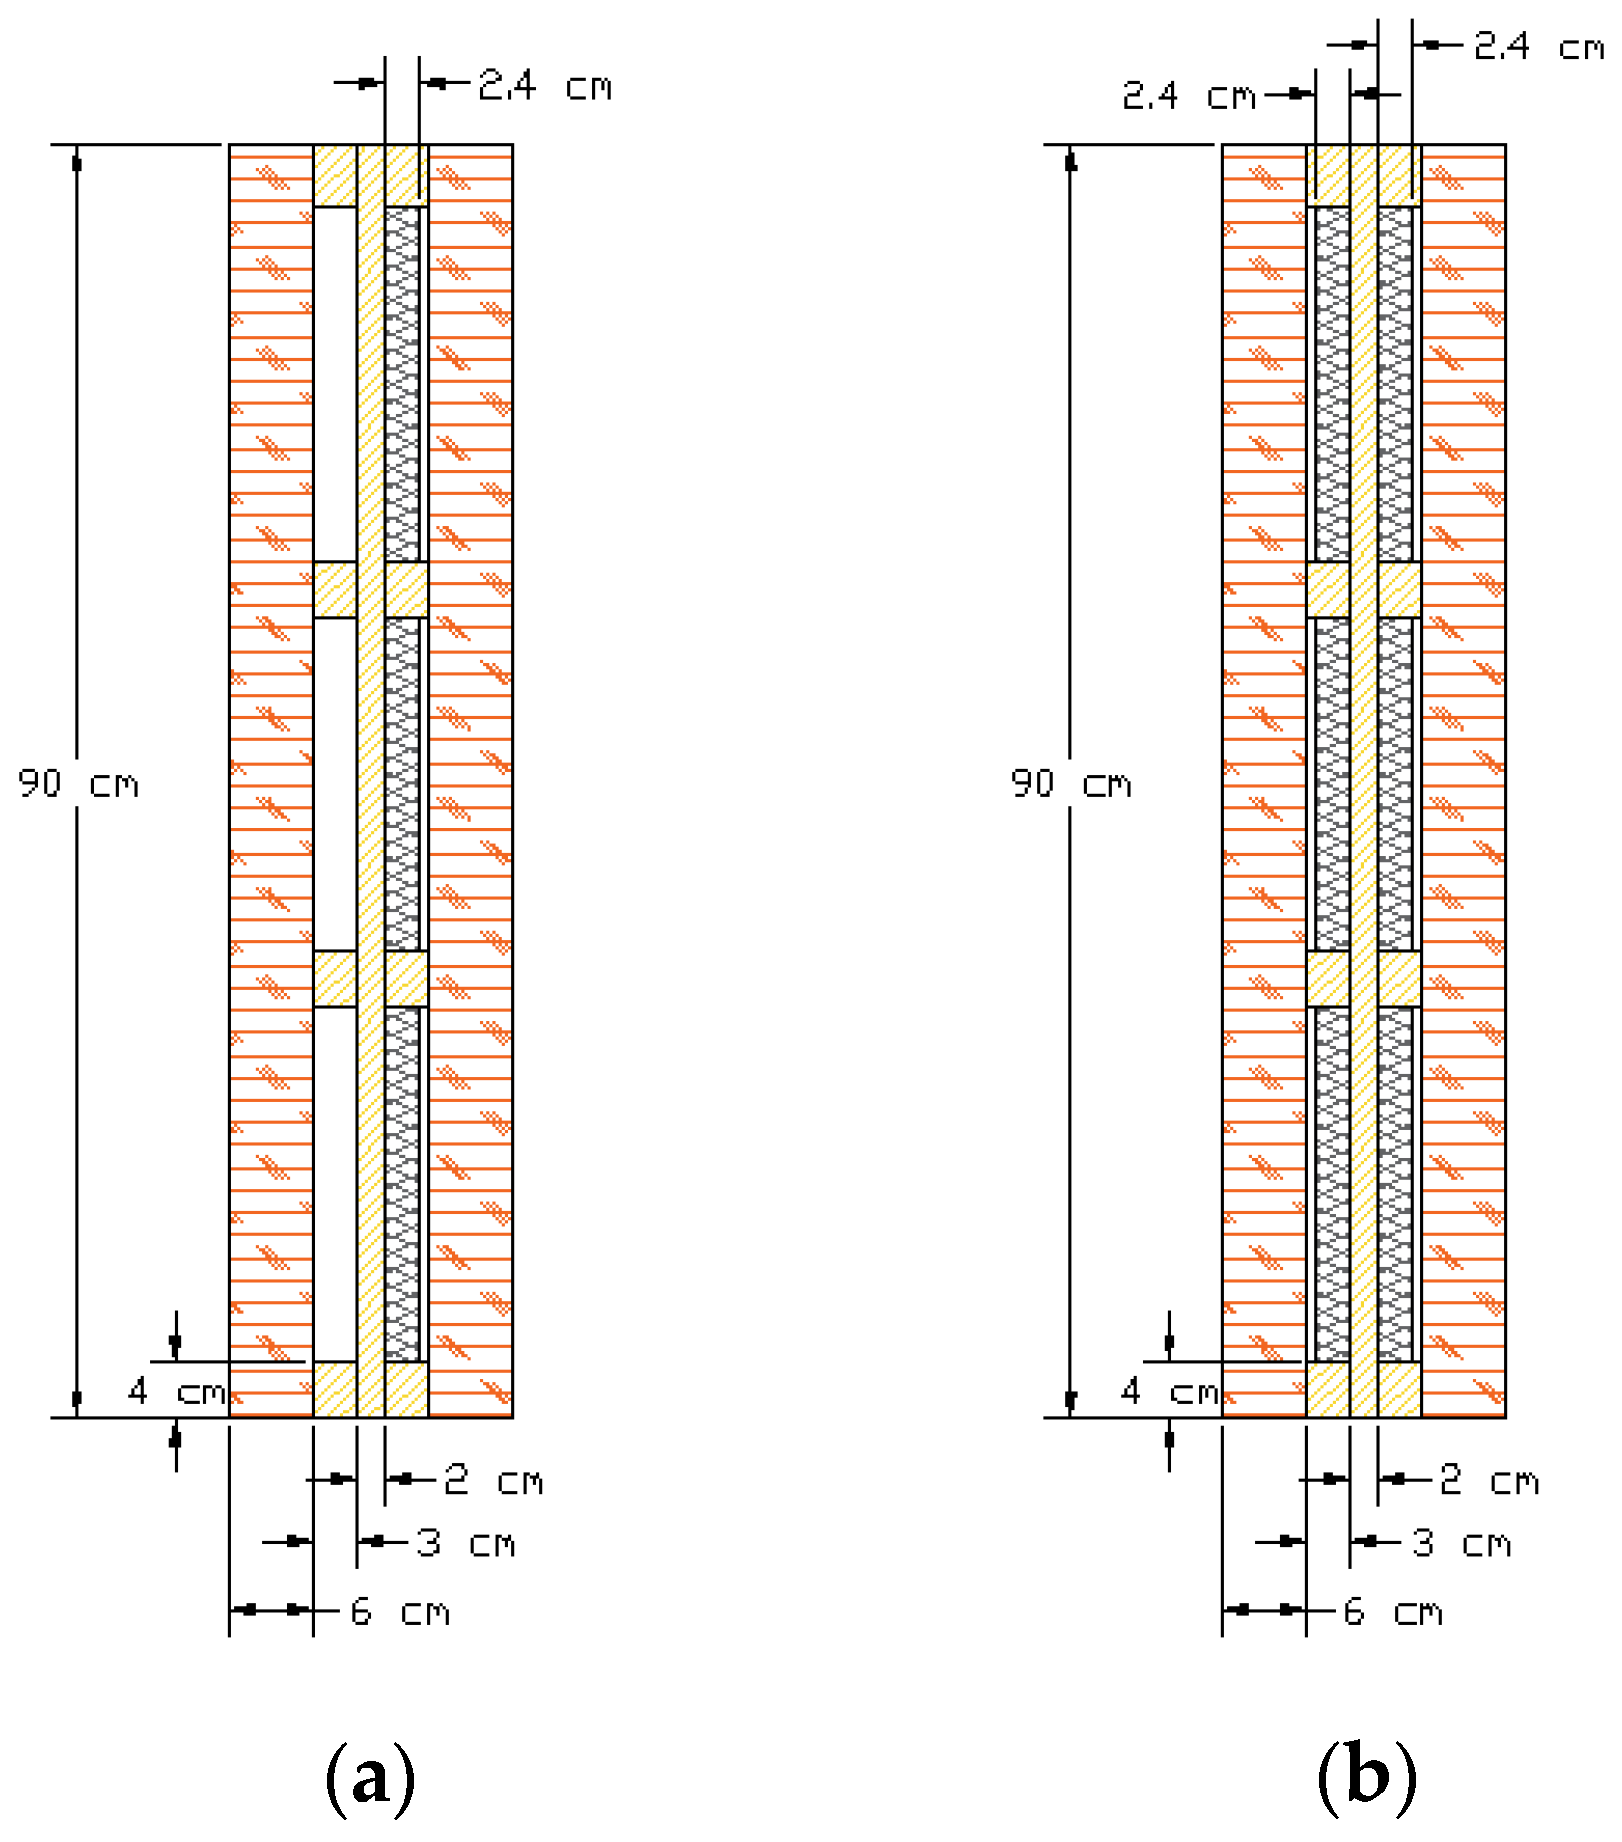
2.2. SuberWall Panels including Bio-PCM

It is well known that an appropriate thermal mass of the building fabric allows for limiting cooling requirements, nevertheless, the proposed THU is a lightweight solution due to the limited weight of cork and wood. A limitation of the summer thermal loads can be attained by alternative solutions such as the inclusion of Phase Change Materials (PCMs) inside the SuberWall panel [39]. These materials allow for improving the panel’s summer behavior by exploiting the phase transition, and therefore the latent heat storage, both with melting and solidification processes. In summer, the thermal flux transferred from the external to the internal environment is attenuated and delayed because it is stored in the PCM during liquefaction; this latent heat is usually discharged by the PCM solidification when natural ventilation at a favorable temperature can be exploited. In light of this, the suitable PCM location in summer is on the external side of the SuberWall panel to better interact with the solar loads and the external environment. In the event of elevated energy gains, overheating in winter can be avoided by storing the surplus in the liquefied PCM, and the same latent heat can be recovered during the material solidification when the indoor air temperature drops. Consequently, the rational position of the PCM in winter is on the inner side. Therefore, at an annual level, the proper location of the PCMs inside the panel has to be evaluated to conciliate the contrasting winter and summer needs, to limit indoor air temperature drops and peaks, as well as the energy requirements throughout the year. Currently, PCMs can be selected among different materials of natural origin [40] (bio-PCM derived from beeswax, vegetable oils, animal fats, non-toxic hydrated salts), by choosing the most appropriate in consideration of the specific application and the required melting temperature. Available commercial products encapsulated in proper sheets have been considered in this study, with the characteristics listed in Table 5, where the associated number indicates the melting temperature. The considered bio-PCM is made of a (patented) mixture of inorganic hydrated salts, has a non-toxic, class-A fire rating and has 25 years of warranty. It is encapsulated in proper flexible sheets to facilitate installation in every wall configuration allowing for an easy modification of the active surface. It is worth noting that these products differ exclusively from the melting temperatures, and they produce a slight increase in the U-value when the PCM fills in the air gaps because they are more conductive than the still air, interfering with the winter performances, and also when the transition phase does not occur.
For identifying the best bio-PCM, simulations were conducted by considering two different locations inside the SuberWall panel: in the air gap facing the internal environment (Figure 5a) and in both the air cavities (Figure 5b). The first choice allows for storing exceeding energy gains to be released at night and in winter to limit the indoor air temperature dropping, and in summer to hinder overheating. A strength of this configuration is also the lower cost, due to the employment of a single PCM layer, that cannot be placed directly on the external surface to preserve its integrity. The second choice also counterbalances the effects due to the incident solar radiation, however, the solution is more expensive due to the large quantity of PCM in the panel.

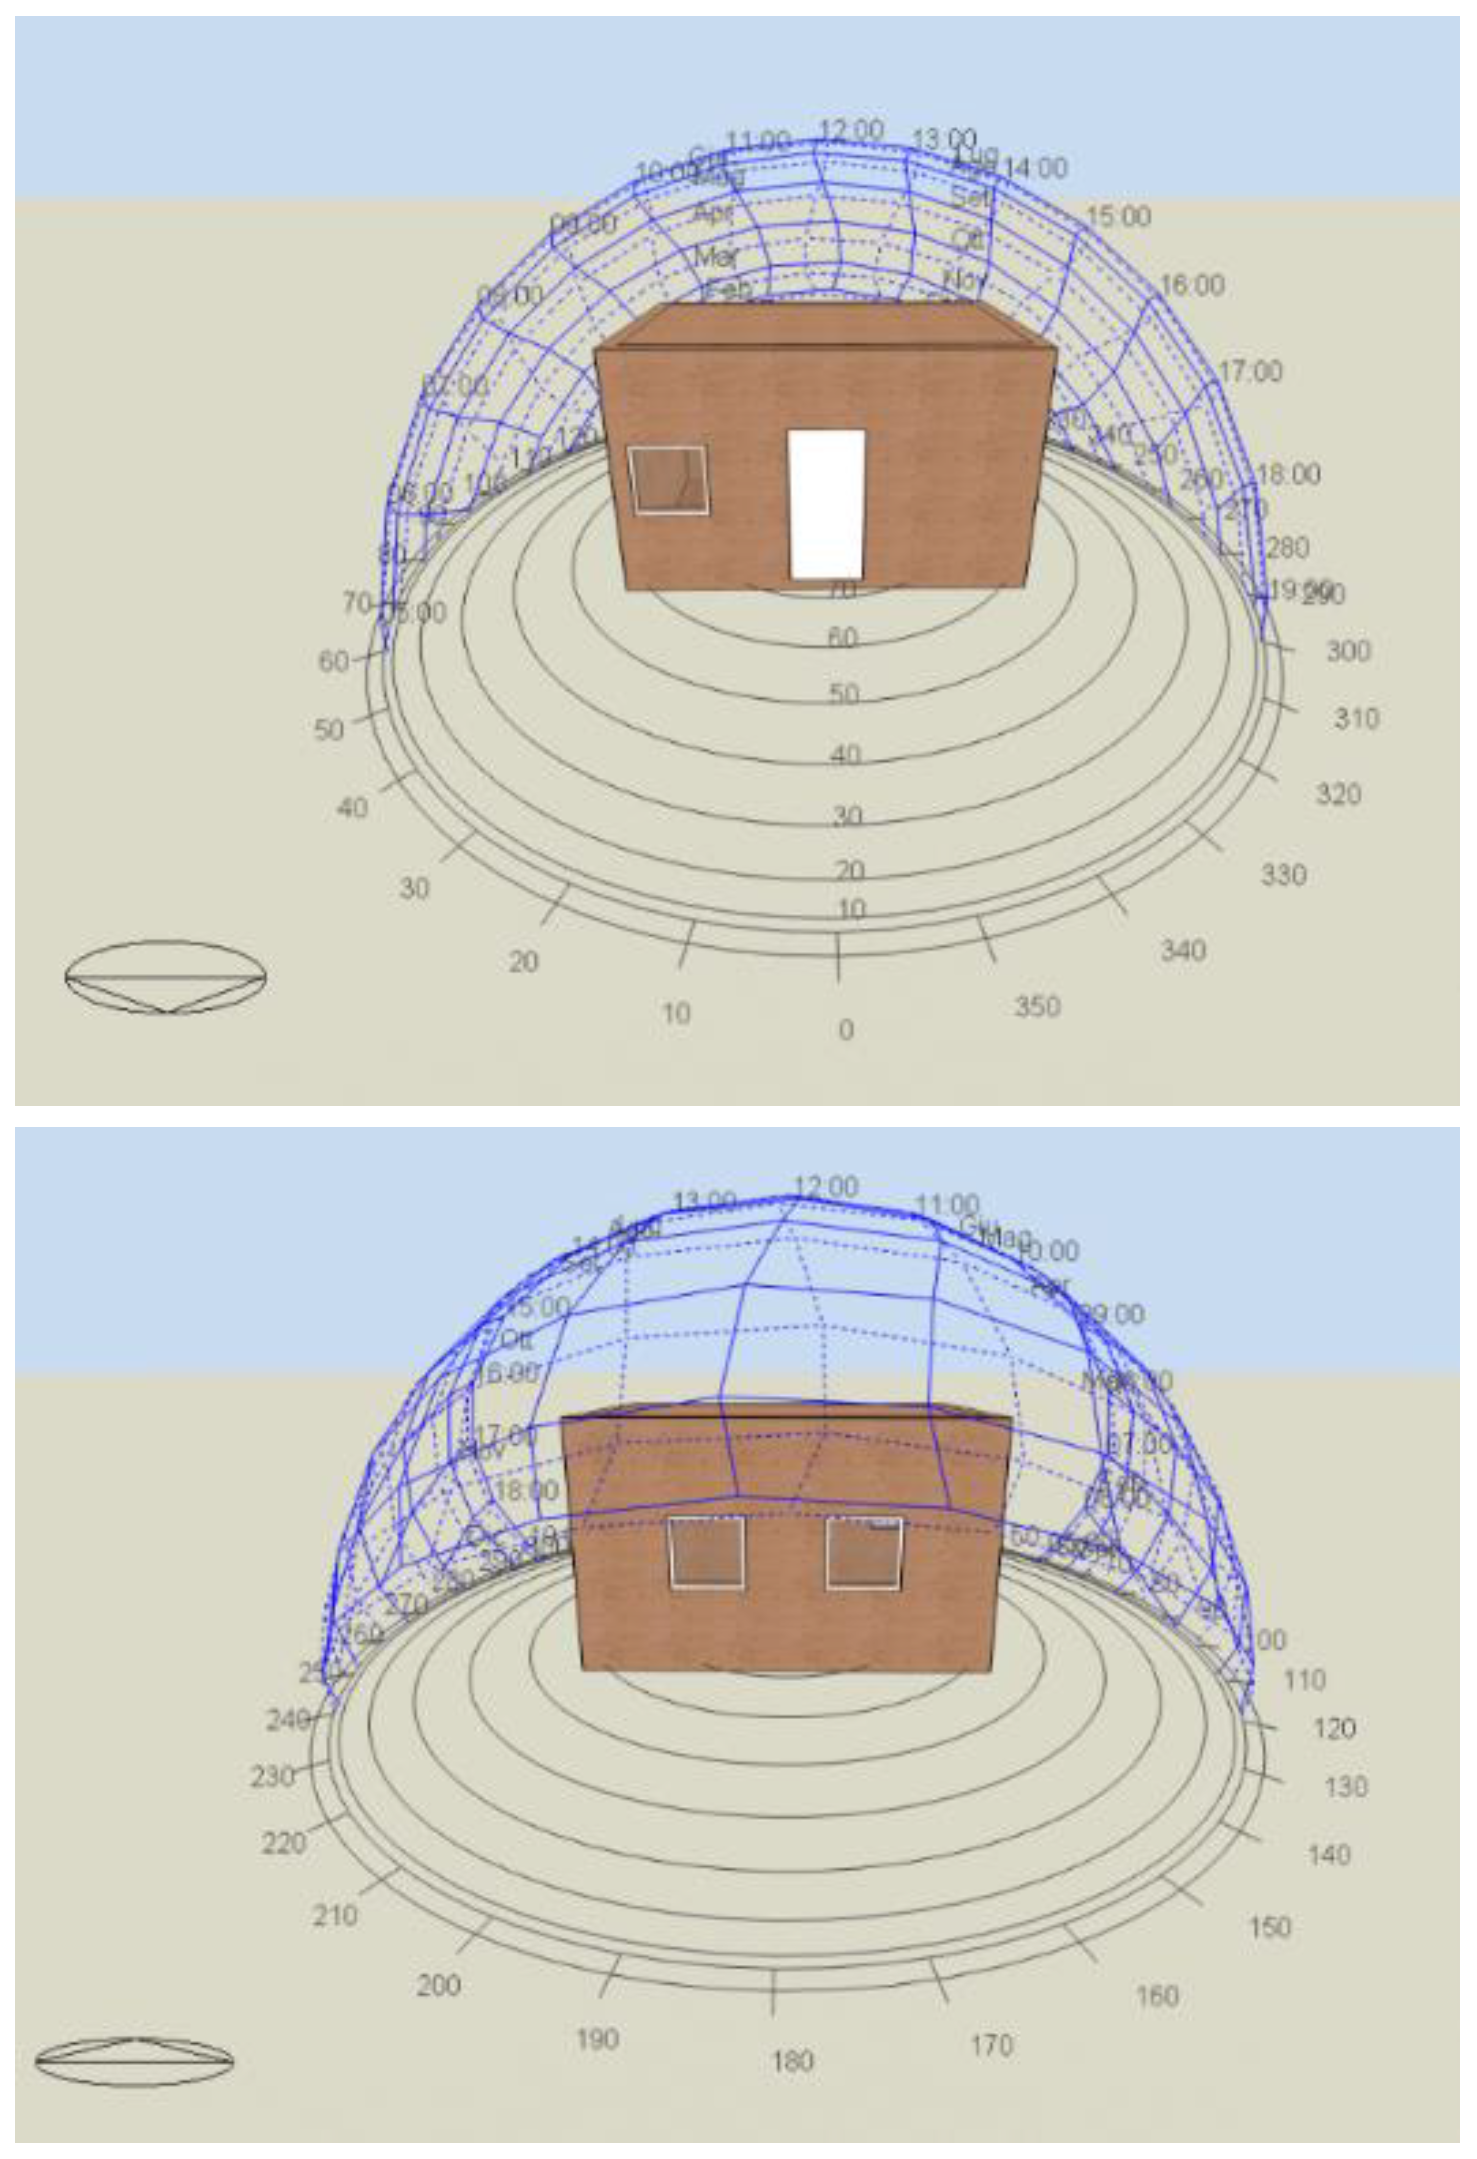
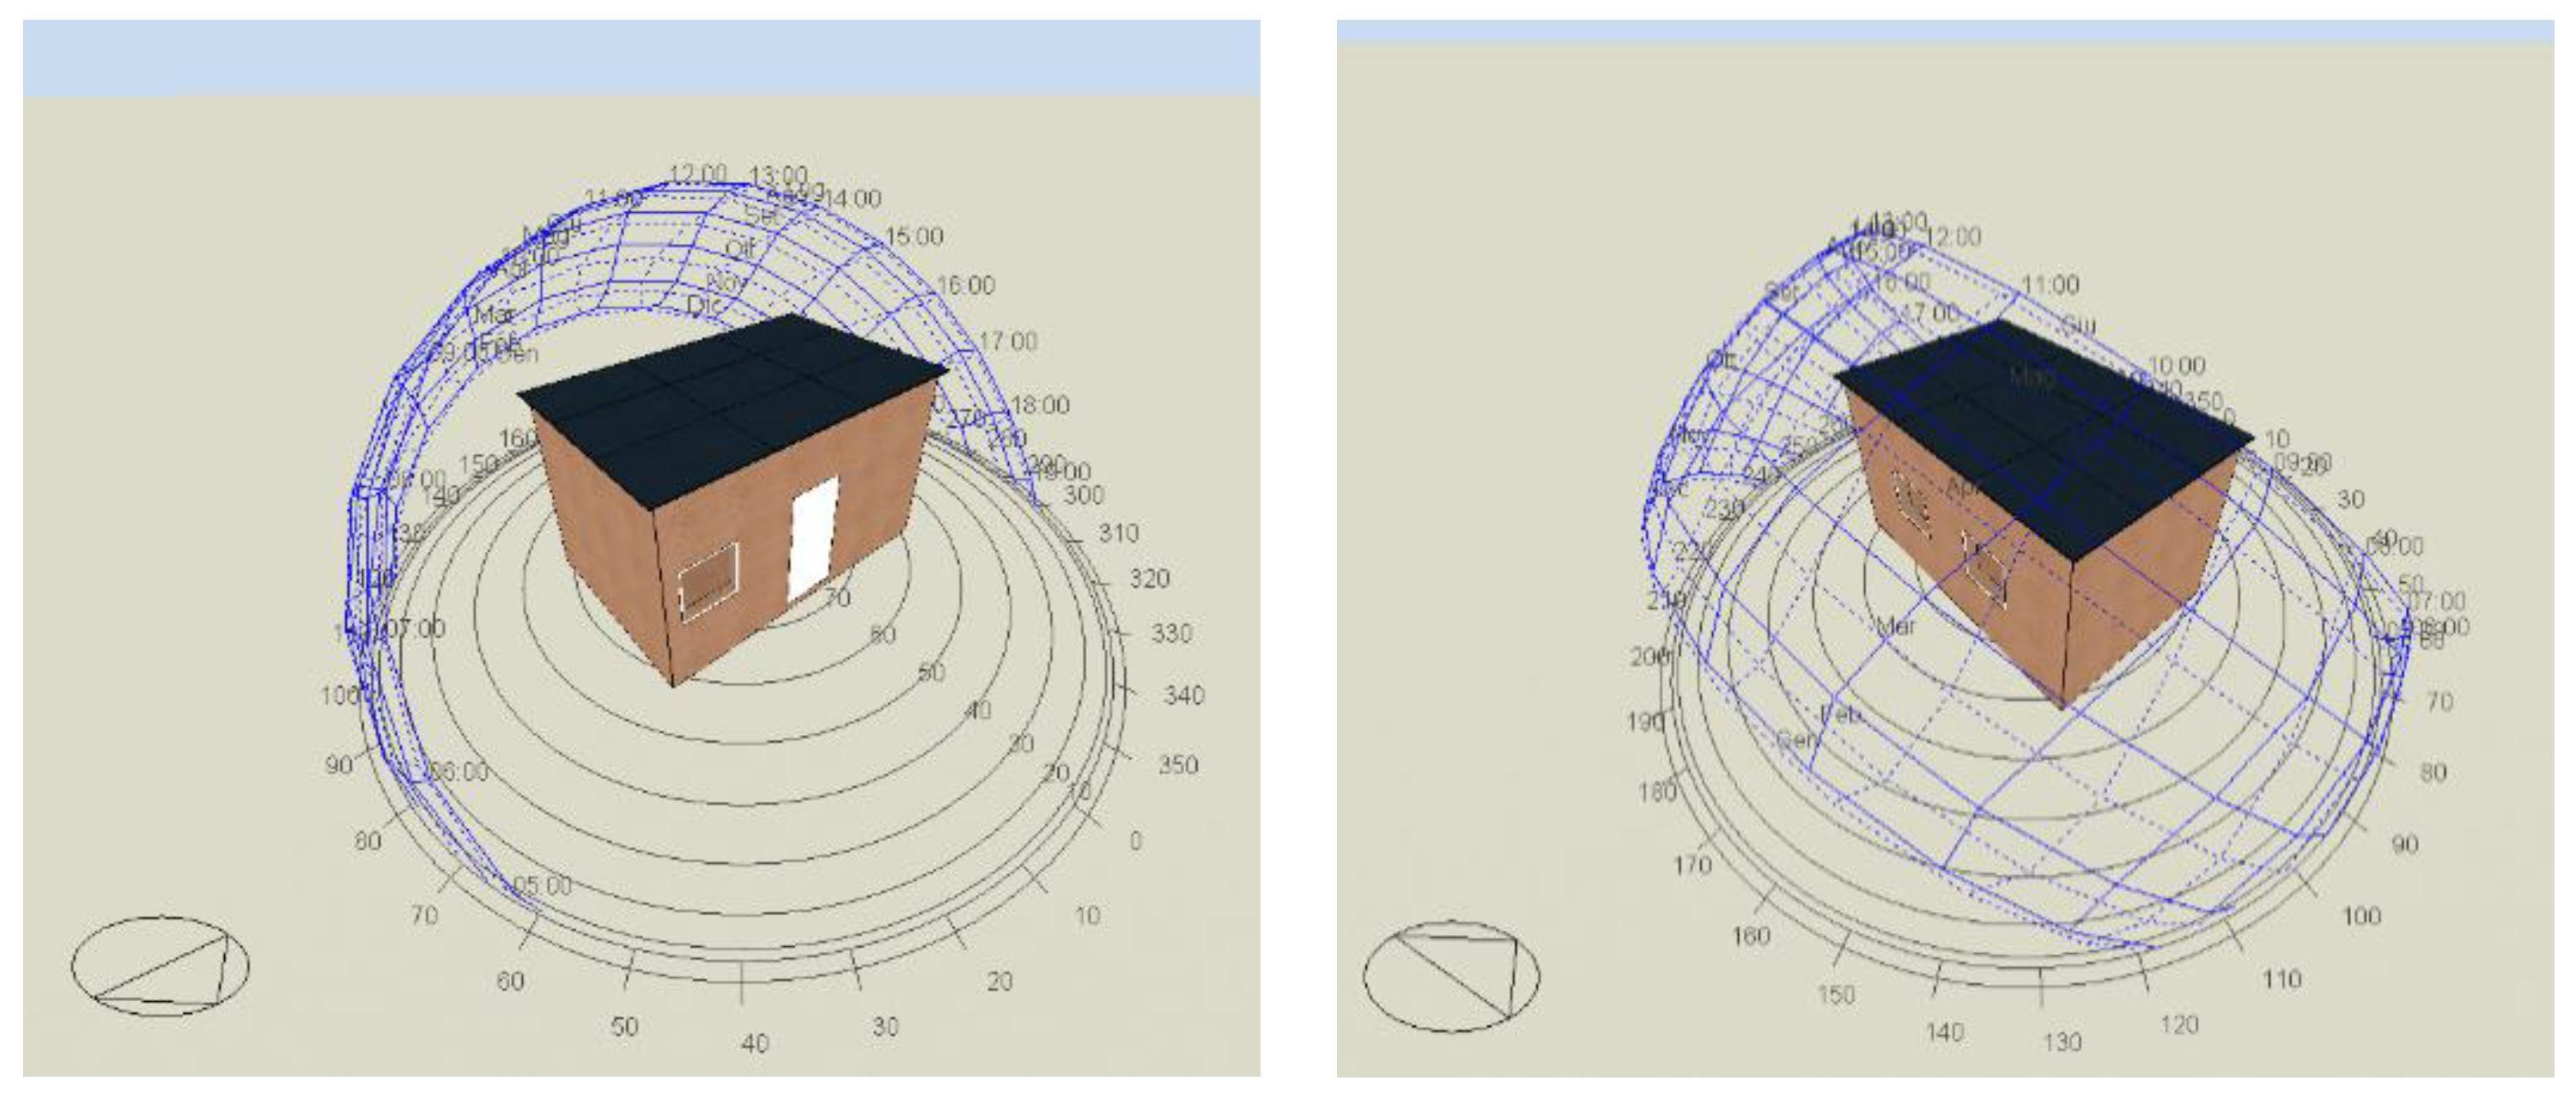
2.3. EnergyPlus Model

The software EnergyPlus [41] allows for modeling the performances of the proposed reference housing unit, as depicted in Figure 6.
For the calculation of the thermal energy demands, internal energy gains and a natural ventilation rate have been set following national regulations (Italian standard UNI/TS 11300-1:2014 [42]) that describe standardized procedures for building energy analyses. In particular, internal gains were quantified with the following relations:
ϕ i n t = 5.294 × A f 0.01557 × A f 2 = 5.3   W / m 2
in which Af (of about 8 m2) is the net walkable surface. The obtained value represents an average endogenous load that acts continuously on the simulated THU, 24 h per day throughout the year. The natural ventilation rate was determined by the Italian standard UNI EN 12831 to calculate the infiltration air flow rate (Vinf) and the share required to guarantee the air renewal (Vric) [43].
V i n f = 2 × n 50 × e i × ε i = 0.35 v o l h
V r i c = 0.5 v o l h
in which n50 is the renewal air change per hour produced by a pressure difference of 50 Pa between the internal and external environment, e is a wind shielding factor for the i-th window and ε is a correction factor that considers its height than the horizontal plane. All these parameters can be derived from UNI EN 12831 tables. Again, the mentioned values refer to the average renewal air flow rate, for use for the whole year in a continuous way for building energy analysis purposes.
Internal shading devices for the solar transmission control are instead activated in the diurnal hours when the incident solar radiation on the windows is greater than 120 W/m2. The reference THU was simulated with an electrically powered direct expansion system (split system) that has a nominal power of 1.5 kWth, sized according to the maximum cooling load, and it was implemented to consider the variation in the performance indices as a function of the source temperatures and the part-load operation mode.

3. Results

Energy performances of different SuberWall solutions were determined by simulating eight different cases, following the scheme depicted in Figure 7. In particular, the first two simulations concern a THU in free-floating conditions (THU with a not operating split system) to identify the best melting temperature among the PCMs listed in Table 5. This is recognized as the PCM that maximizes the annual period in which the indoor air temperature spontaneously ranges from 20–26 °C, consequently limiting the eventual intervention of an HVAC system. In these preliminary evaluations, PCMs were located following the configuration depicted in Figure 5a. Once the ideal PCM was chosen, in the successive step the advantages concerning the inclusion of the suitable PCM inside the SuberWall panel were quantified by comparing the thermal energy requirements with the THU of CASE 1, by setting indoor air temperature set-points of 20 °C in winter and 26 °C in summer. It has to be noticed that thermal energy requirements can be determined only when a not operating split system is modeled in DesignBuilder, justifying the choice to use the free-floating temperature as a parameter to evaluate the best PCM. Finally, a functioning split was simulated by considering two modalities: continuous and scheduled operation. In both cases, the annual electric demands were determined by referring to the SuberWall configurations depicted in Figure 5a,b and by comparing the results with the THU simulated without PCM, in order to verify the validity of this solution to minimize the annual electric need.

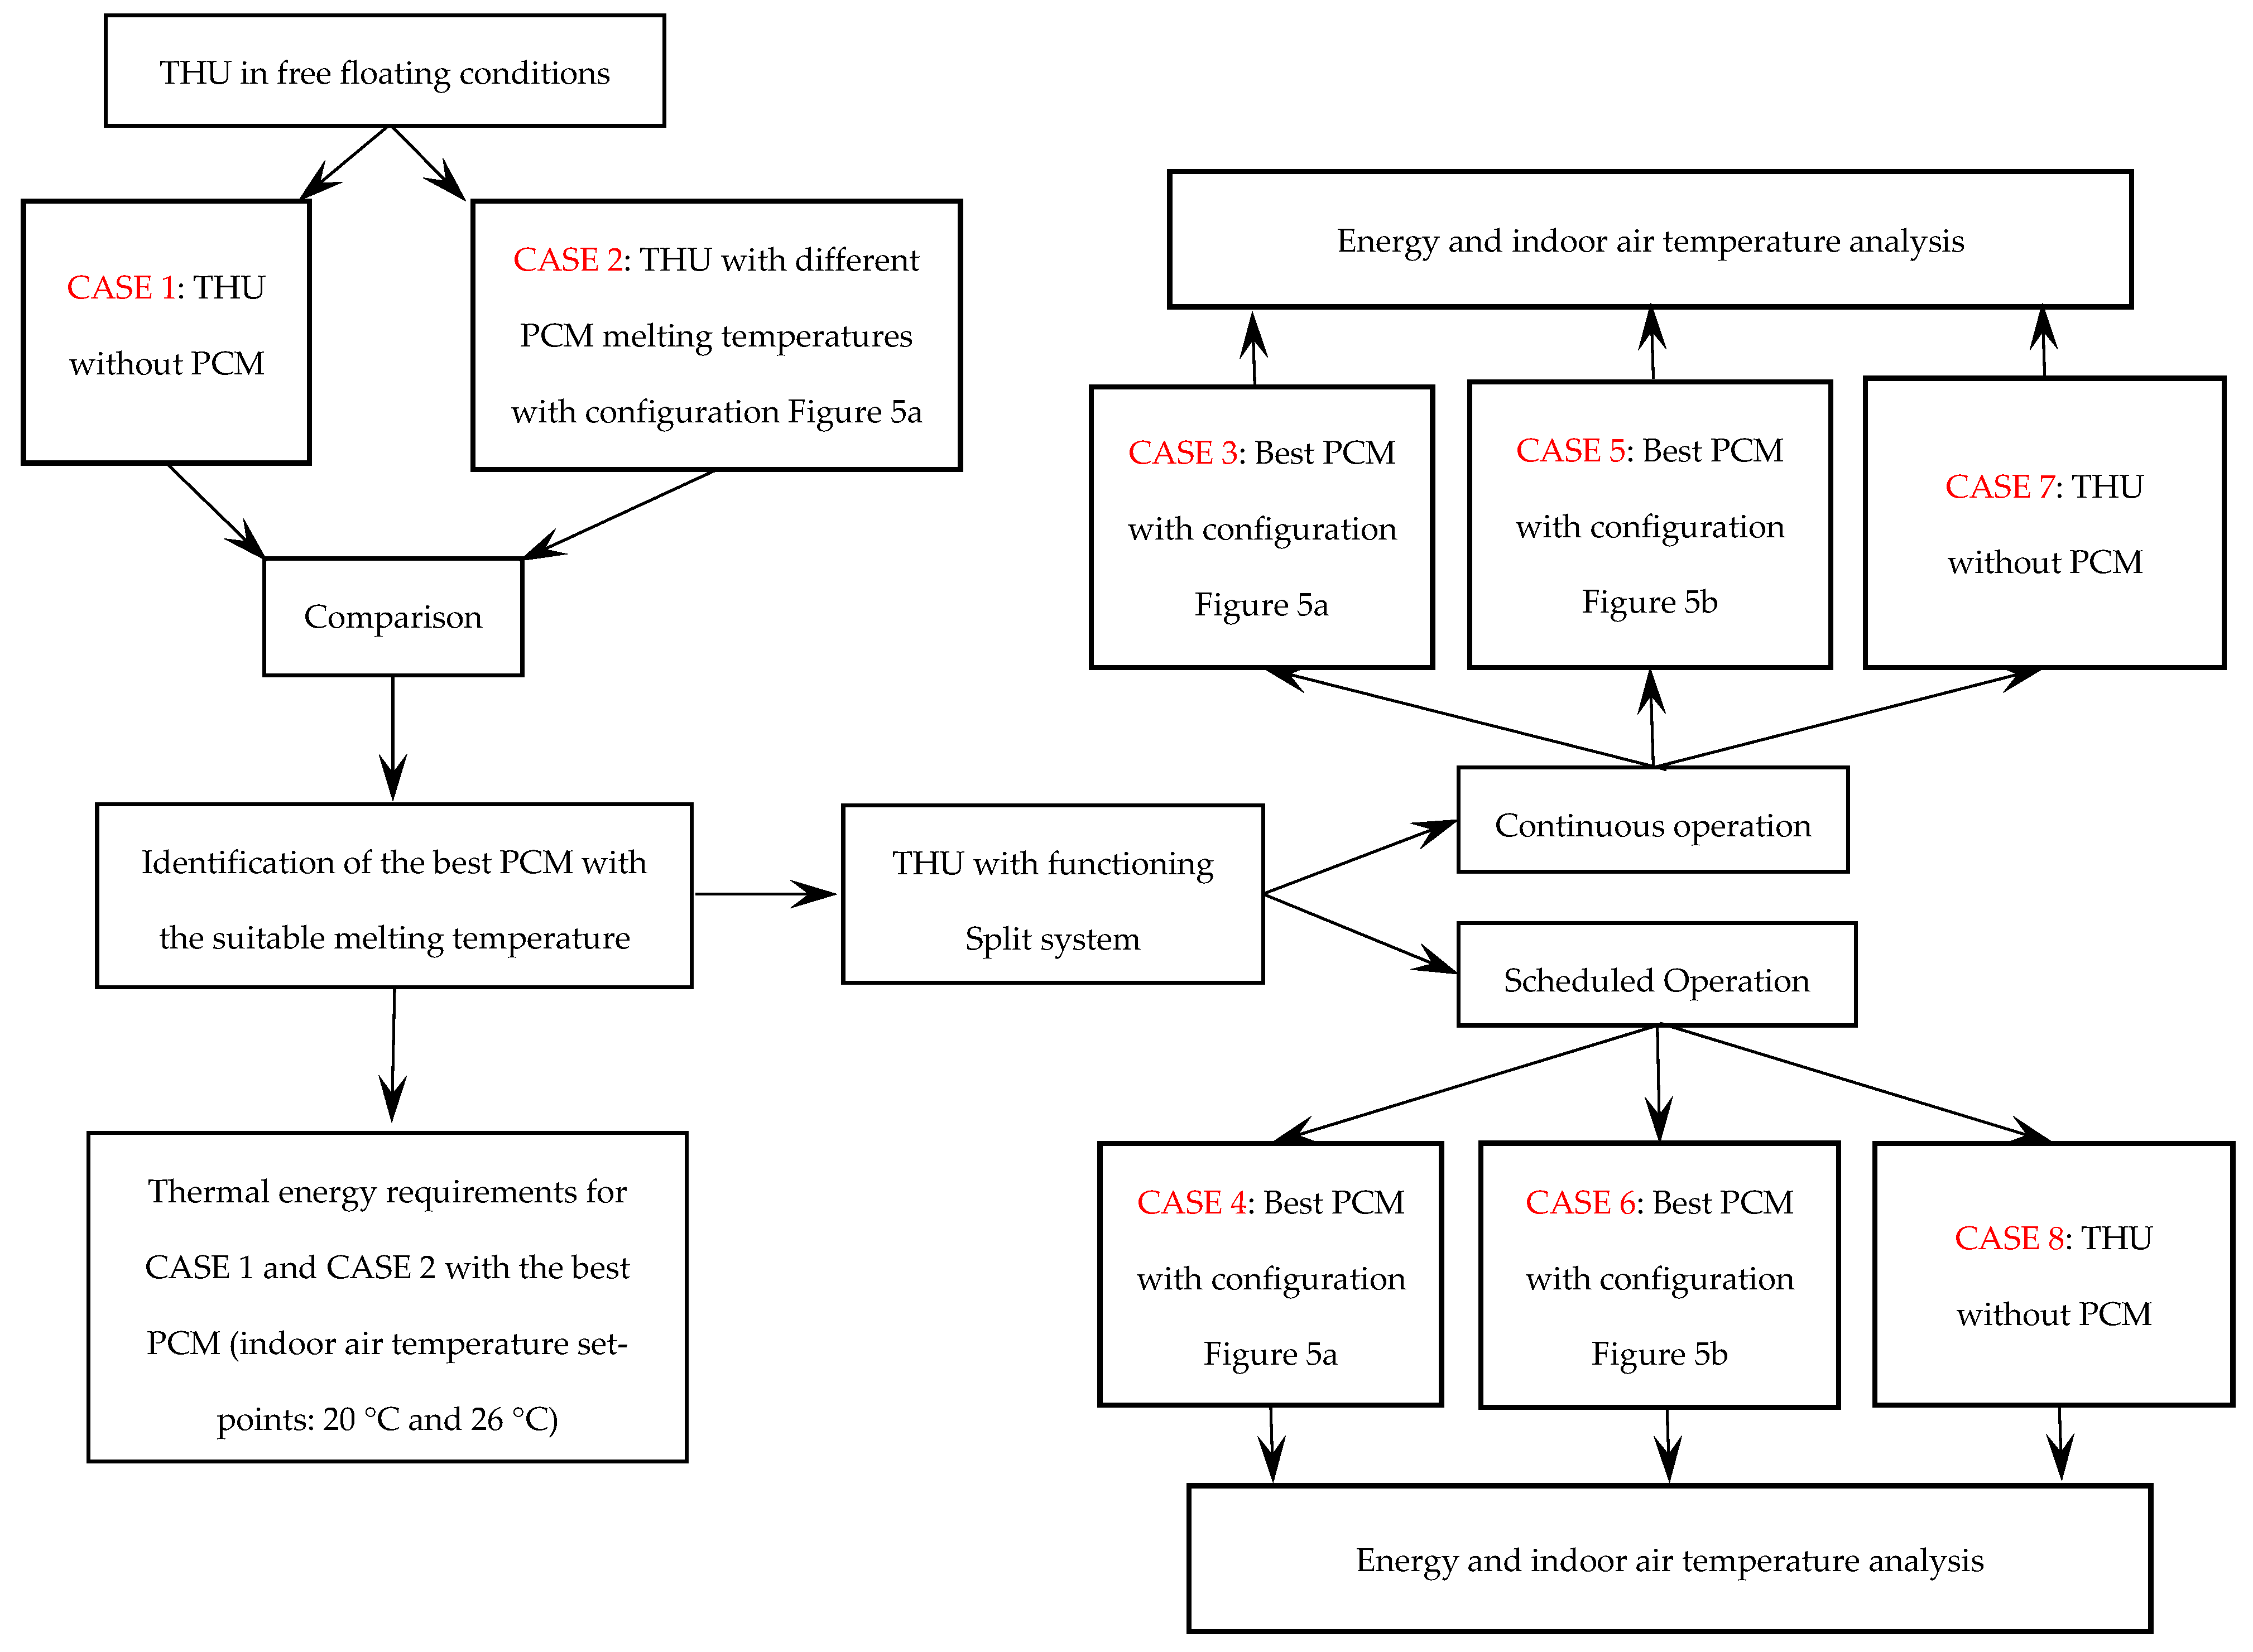
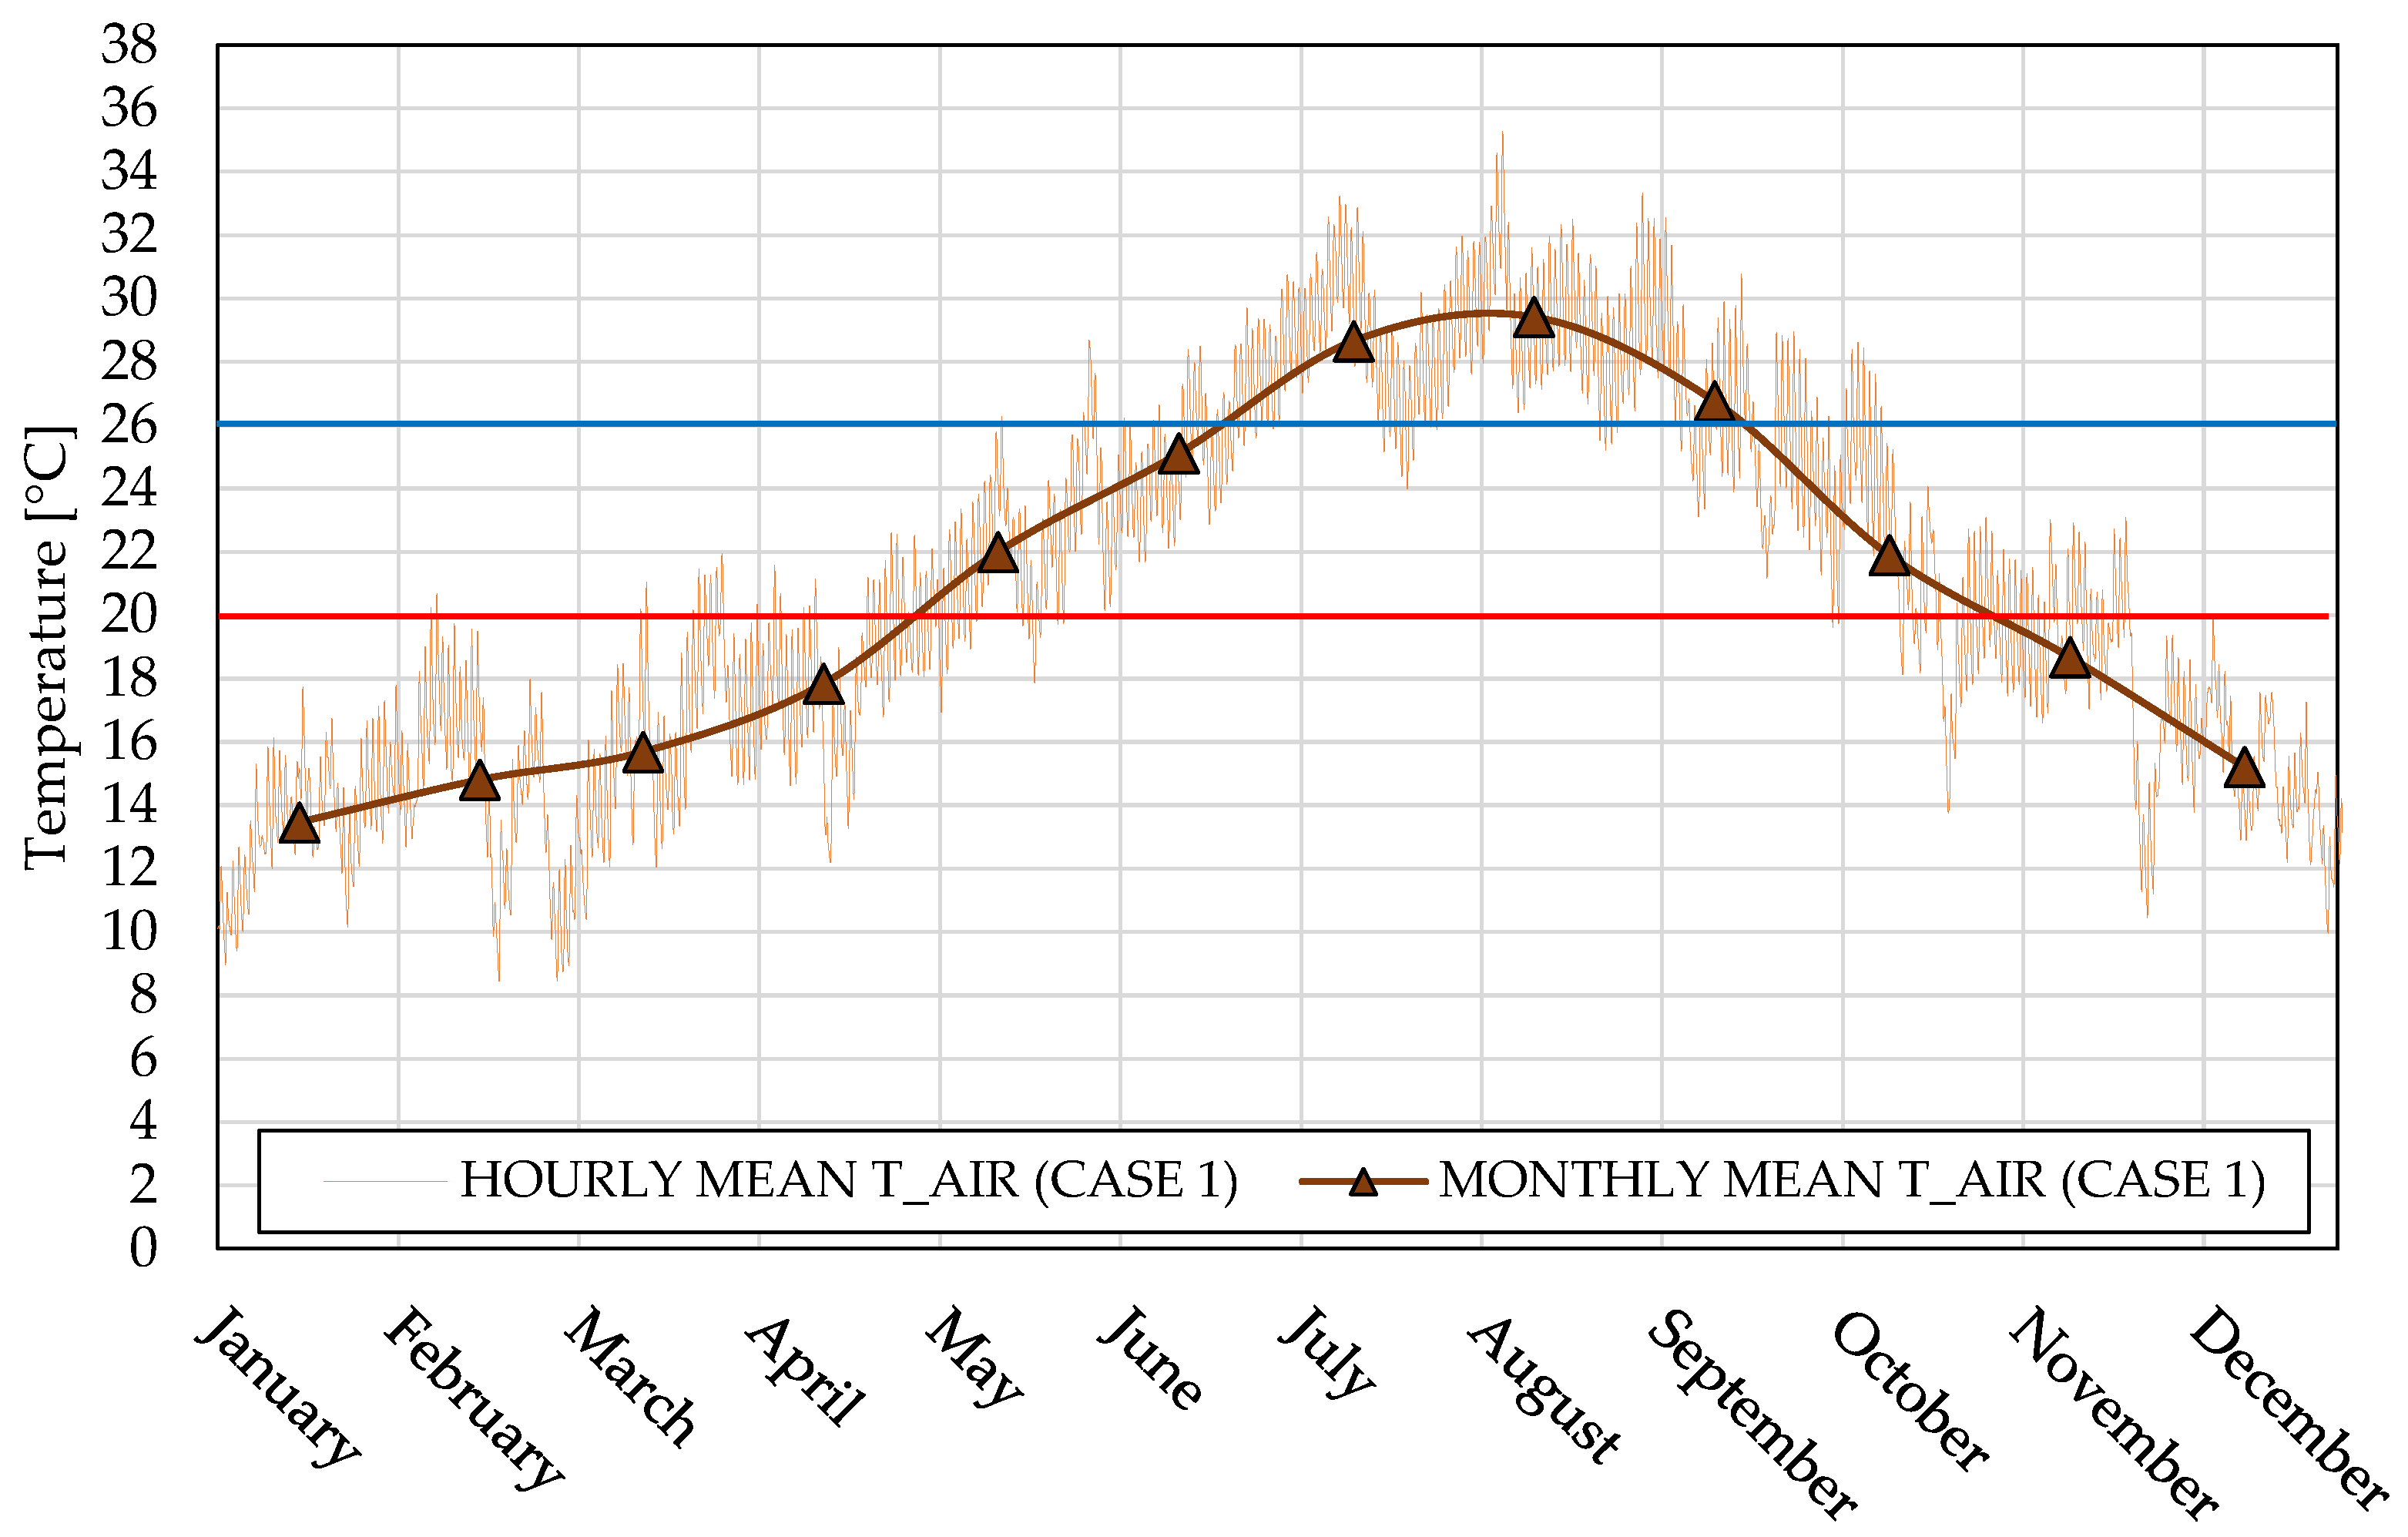
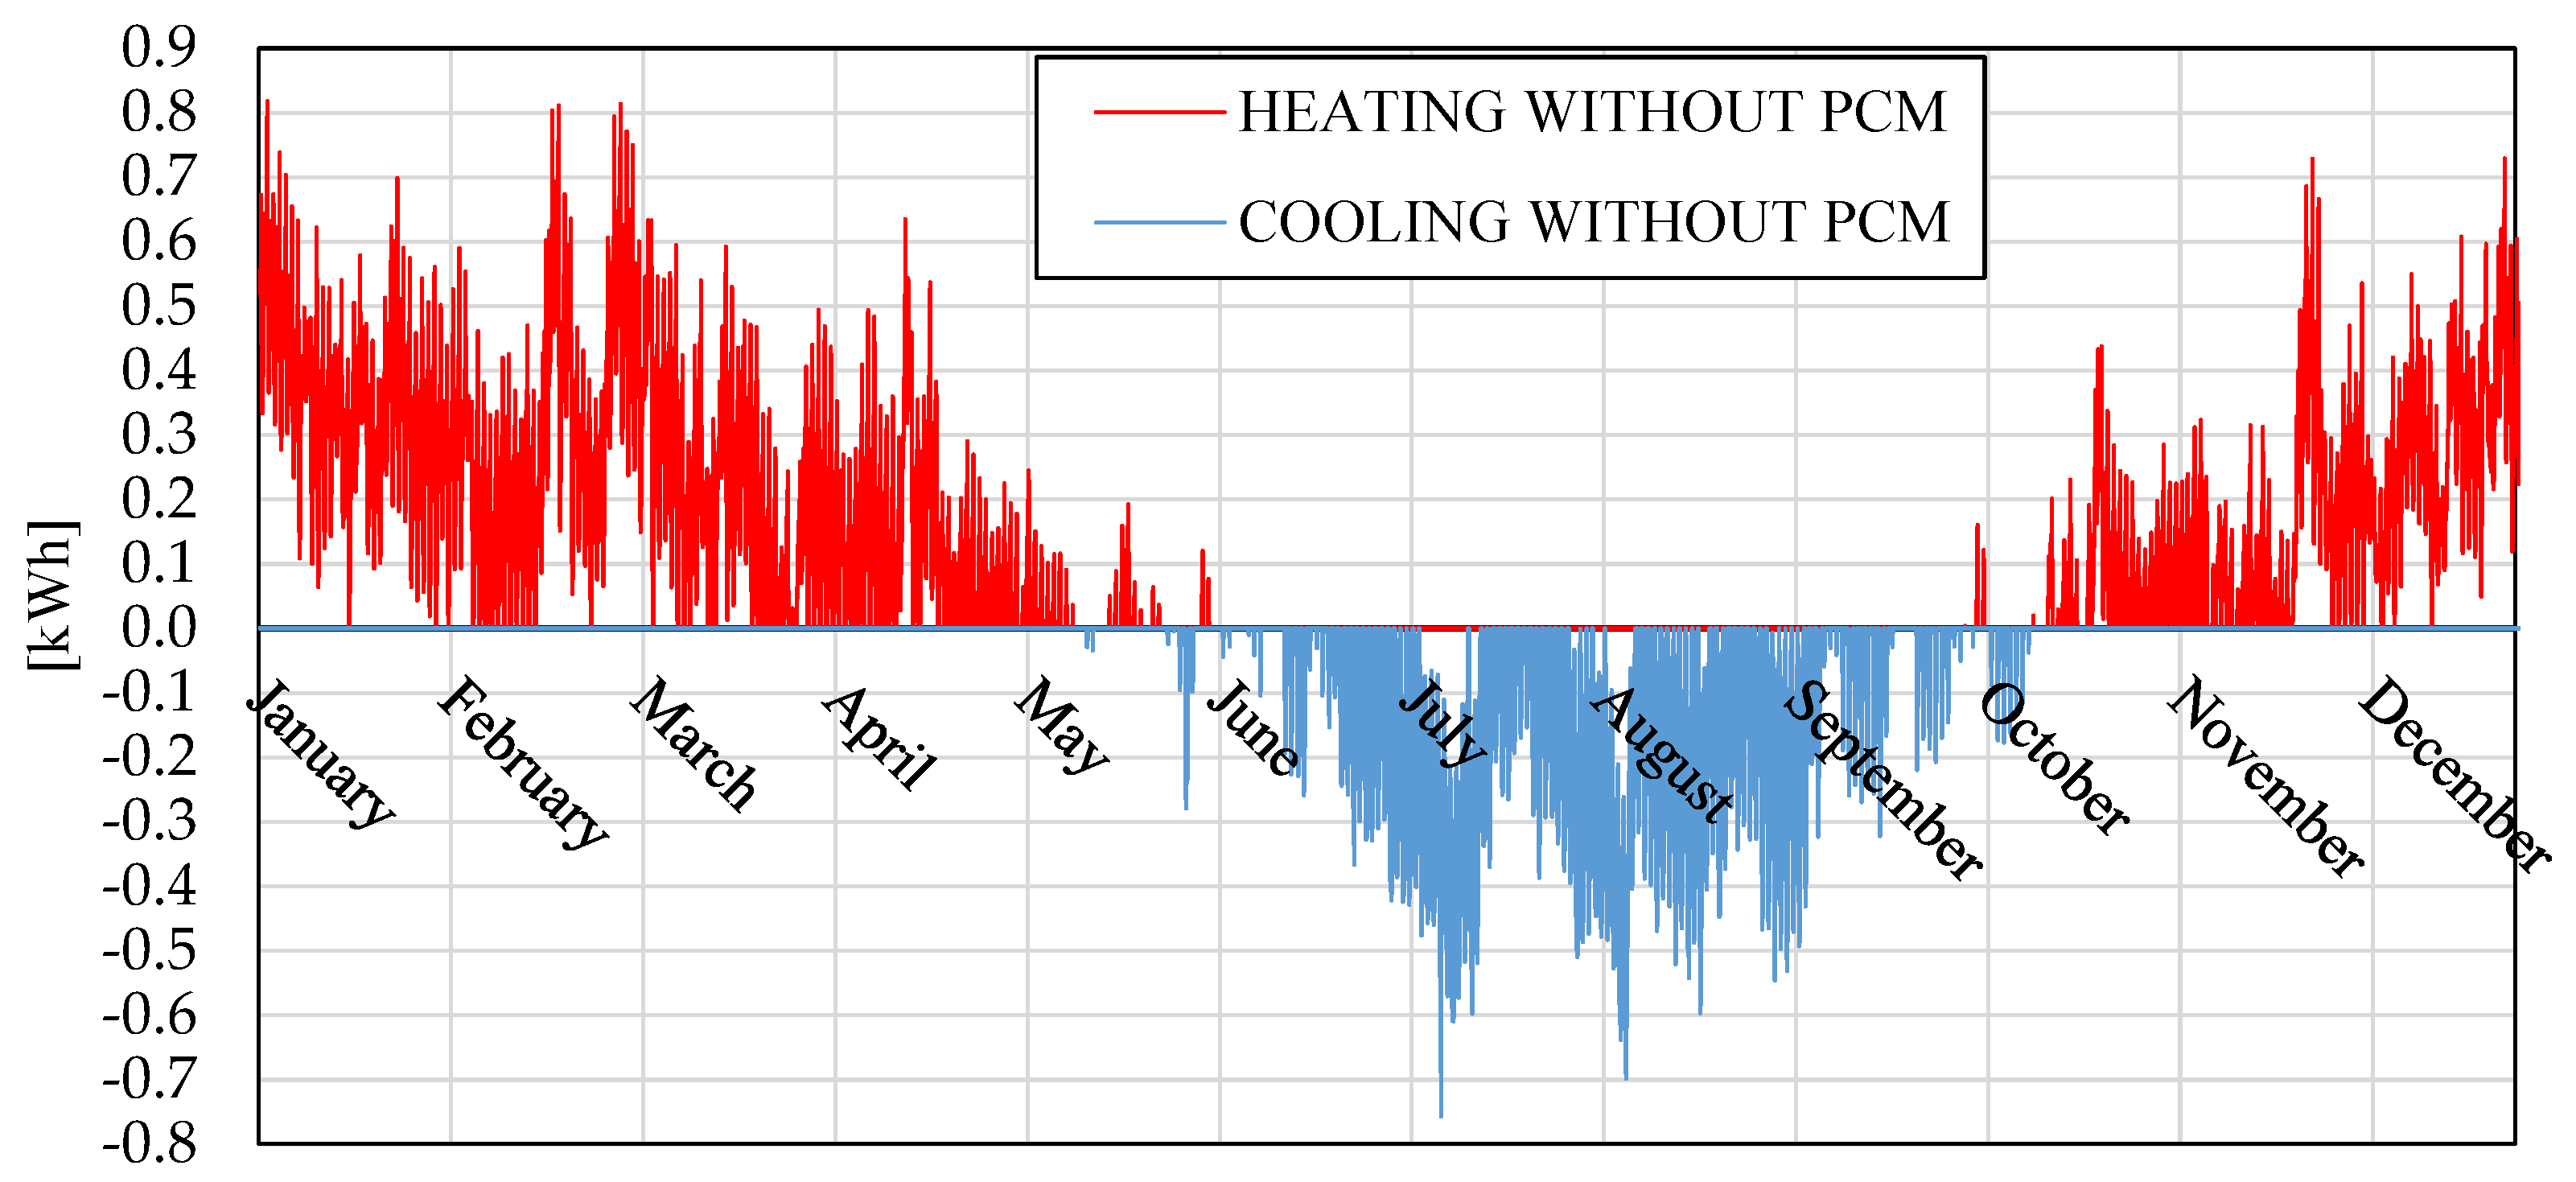
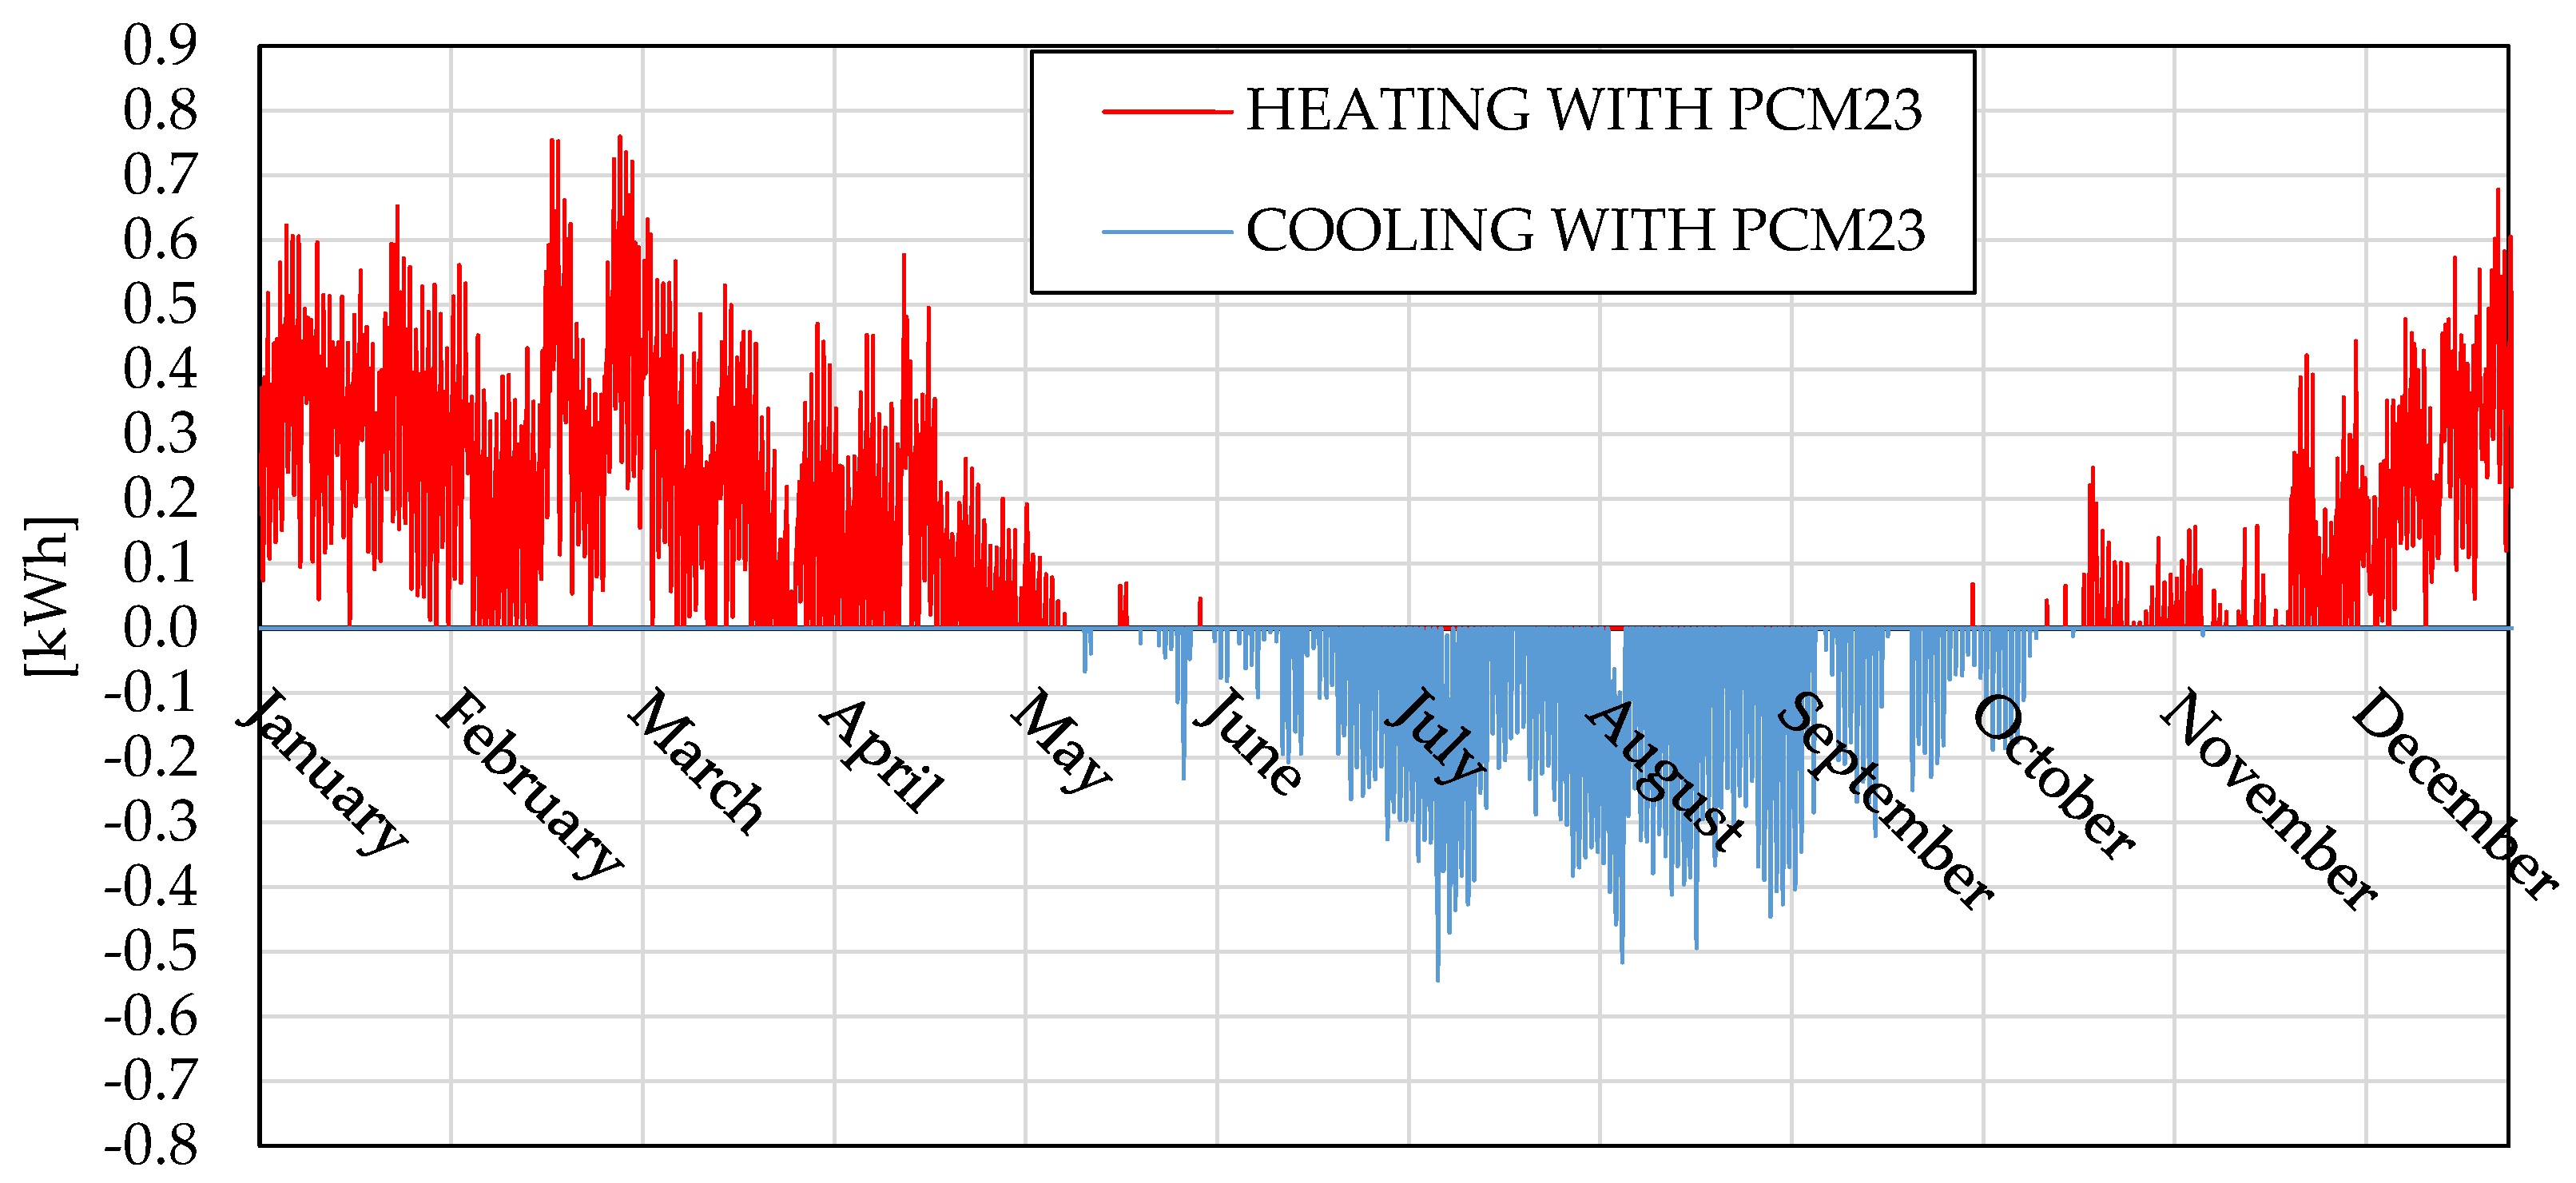
3.1. Bio-PCM Analysis in Free-Floating Conditions

The first simulated case determined the free-floating temperature of the THU in the absence of PCMs (CASE 1), and it was used as the reference case to quantify how PCMs influence the THU thermal performances. Figure 8 shows the trends of the hourly indoor temperature and the correspondent average monthly values. In a free-floating simulation, the evaluation parameter is represented by the percentage of time in which the indoor air temperature is spontaneously in the range of 20–26 °C, without considering an HVAC plant. In the absence of PCM in vertical walls and ceiling, 26% of the hours do not need plant intervention, largely in the intermediate months (May, June and October).
Successively, the typologies of bio-PCM listed in Table 5 were simulated assuming the panel configuration depicted in Figure 5a (CASE 2). These evaluations have allowed for identifying the best bio-PCM by choosing the solution that allows for enlarging the annual period in which the indoor air temperature is in the range of 20–26 °C. It can be noticed that PCM21 and PCM23 allow for extending the period in which the operation of an HVAC system is not required, whereas it is more restricted with PCM29. Table 6 lists the percentages obtained for every considered PCM typology.
It emerged that the employment of PCM23 (melting temperature of 23 °C) on the inner side of the SuberWall panel represents the best choice, providing the result of 36% of annual hours in which the indoor air temperature is spontaneously in the range 20–26 °C. Conversely, when the melting temperatures reduces, an improvement of the winter performance occurs, nevertheless, the summer performance worsens because the PCMs often remain in the liquid phase with no advantage in terms of latent energy storage. By increasing the melting temperatures, instead, the percentage value is lower due to the small frequency with which the PCM liquefaction occurs in summer, with correspondent cooling requirement growth. Moreover, PCM29 also produces a percentage value lower than CASE 1 because an increase in the winter transmission losses due to the U-value growth was observed.
In Table 7, the percentages of hours in which the indoor temperature ranges between 20 °C and 26 °C as a function of the PCM melting temperature are reported at a monthly level. It is worth noting that in the critical winter month (January), an envelope equipped with PCMs never reaches the set-point temperature spontaneously. Some benefits are observable in February, March and April, especially when the melting temperatures decrease because it is easier the use the stored latent heat to reduce heating needs. These results highlight that, despite the internal cork panel interfering negatively with the PCM activation, a slight contribution to the limitation of the heating needs is detected due to the recovery of part of the solidification heat. PCM21 shows appreciable results, especially in May, June and September, whereas PCM23 provides the best results for the majority of the months, nevertheless, in June it is surpassed by CASE 1 because the nocturnal release of the stored solar gains is not adequately removed by natural ventilation. Similar behavior was detected for PCM25 in September whereas PCM29 allows for a slight improvement only in June due to proper management of the solar gains. Globally, bio-PCM23 is the best choice for 6 months per year, followed by PCM21. These results suggest that, for the considered climate, it is not recommended to proceed with bio-PCMs with melting temperatures greater than 23 °C.
In Figure 9, the trends of the hourly temperature and the monthly average temperature values are displayed for CASE 2 for the SuberWall panel equipped with PCM23.
There is an evident enlargement of the non-operative zone of the HVAC system and, furthermore, in July and August the monthly average indoor air temperatures approach the indoor set-up value, promoting minimal energy expense for cooling. Figure 10 and Figure 11 depict a comparison in terms of incoming and exiting thermal energy through walls and ceiling between CASE 2 with PCM23 and the reference CASE 1.
These figures show the advantages concerning the transition phases of PCM23: in the winter months (January, February, March, October, November and December) an increase in the incoming thermal energy compared to CASE 1 was detected, meaning better exploitation of the energy gains that can be reused to limit heating needs. As expected, an evident limitation was detected in summer because the solar gains are stored in terms of latent energy and this share does not affect the indoor environment as a cooling load. Referring to the exiting thermal energy, a limitation is observable in the winter months meaning a reduction in the transmission losses and, conversely, in summer PCM23 promotes the thermal exchange with the external environment by favoring the limitation of cooling loads.

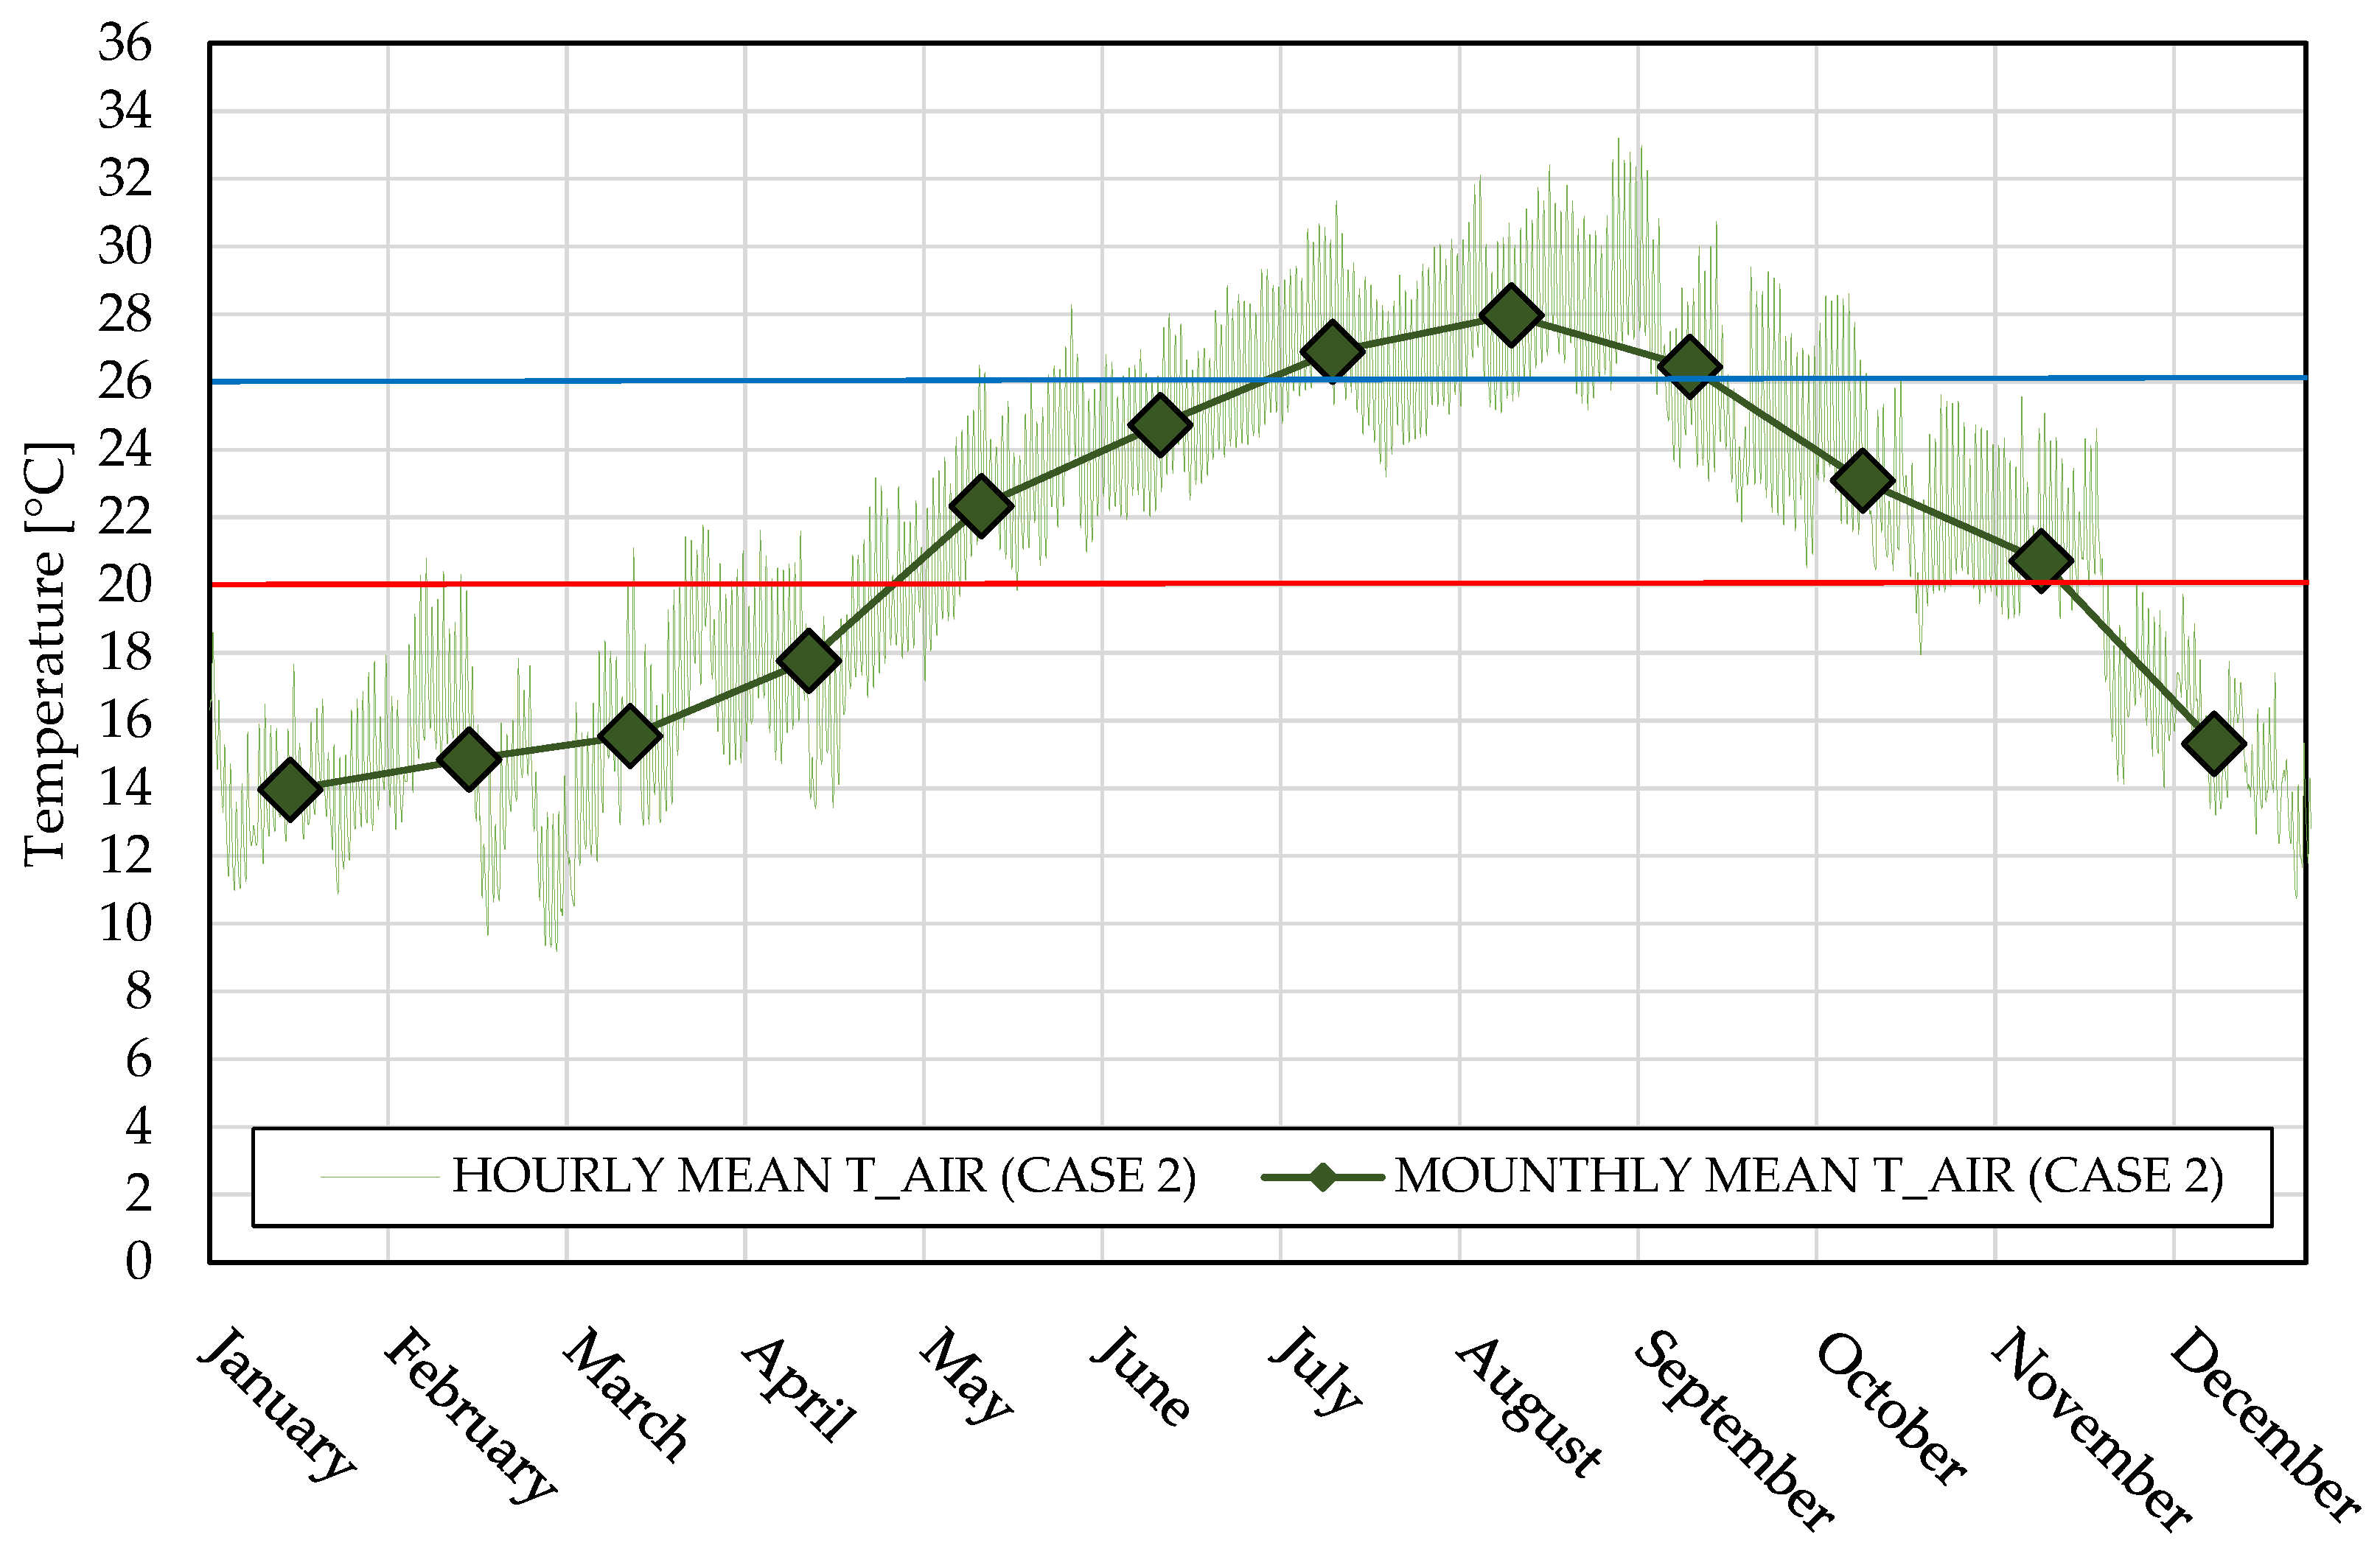
3.2. Bio-PCM Analysis with an Operating Split System

Other simulations were carried out assuming a split system operating continuously to control the indoor air temperature and to determine the THU thermal energy requirements with bio-PCM23. The activation of the air conditioning system is based on a temperature zone control to always keep it over 20 °C in winter and never over 26 °C in summer. The results obtained in terms of thermal energy requirements, assuming the employment of an ideal HVAC system, are shown in Figure 12 (CASE 1) and Figure 13 (CASE 2), assuming the SuberWall panel including PCM23 with the configuration of Figure 5a.
It can be noticed that hourly needs are between −0.75 kWh (summer) and 0.82 kWh (winter) for the THU without PCM and between −0.54 kWh (summer) and 0.76 kWh (winter) for CASE 2, demonstrating that the inclusion of bio-PCM23 also produces advantages in terms of hourly thermal energy demand.
In successive steps, simulations with an operating HVAC system were implemented, in particular a scheduled split functioning was simulated in CASE 4, 6 and 8 assuming PCM23 and in accordance with the Italian law DPR 412/93 [44] which, for Reggio Calabria, describes a plant operation not exceeding 8 h per day, following the scheme depicted in Figure 14. Similarly, other simulations were carried out in CASE 3, 5 and 7 assuming PCM23 in THUs equipped with a split system operating in a continuous regime, namely an HVAC system activated 24 h per day when required.
An in-depth analysis of the results obtained regarding internal temperatures and electrical needs is presented in the following.

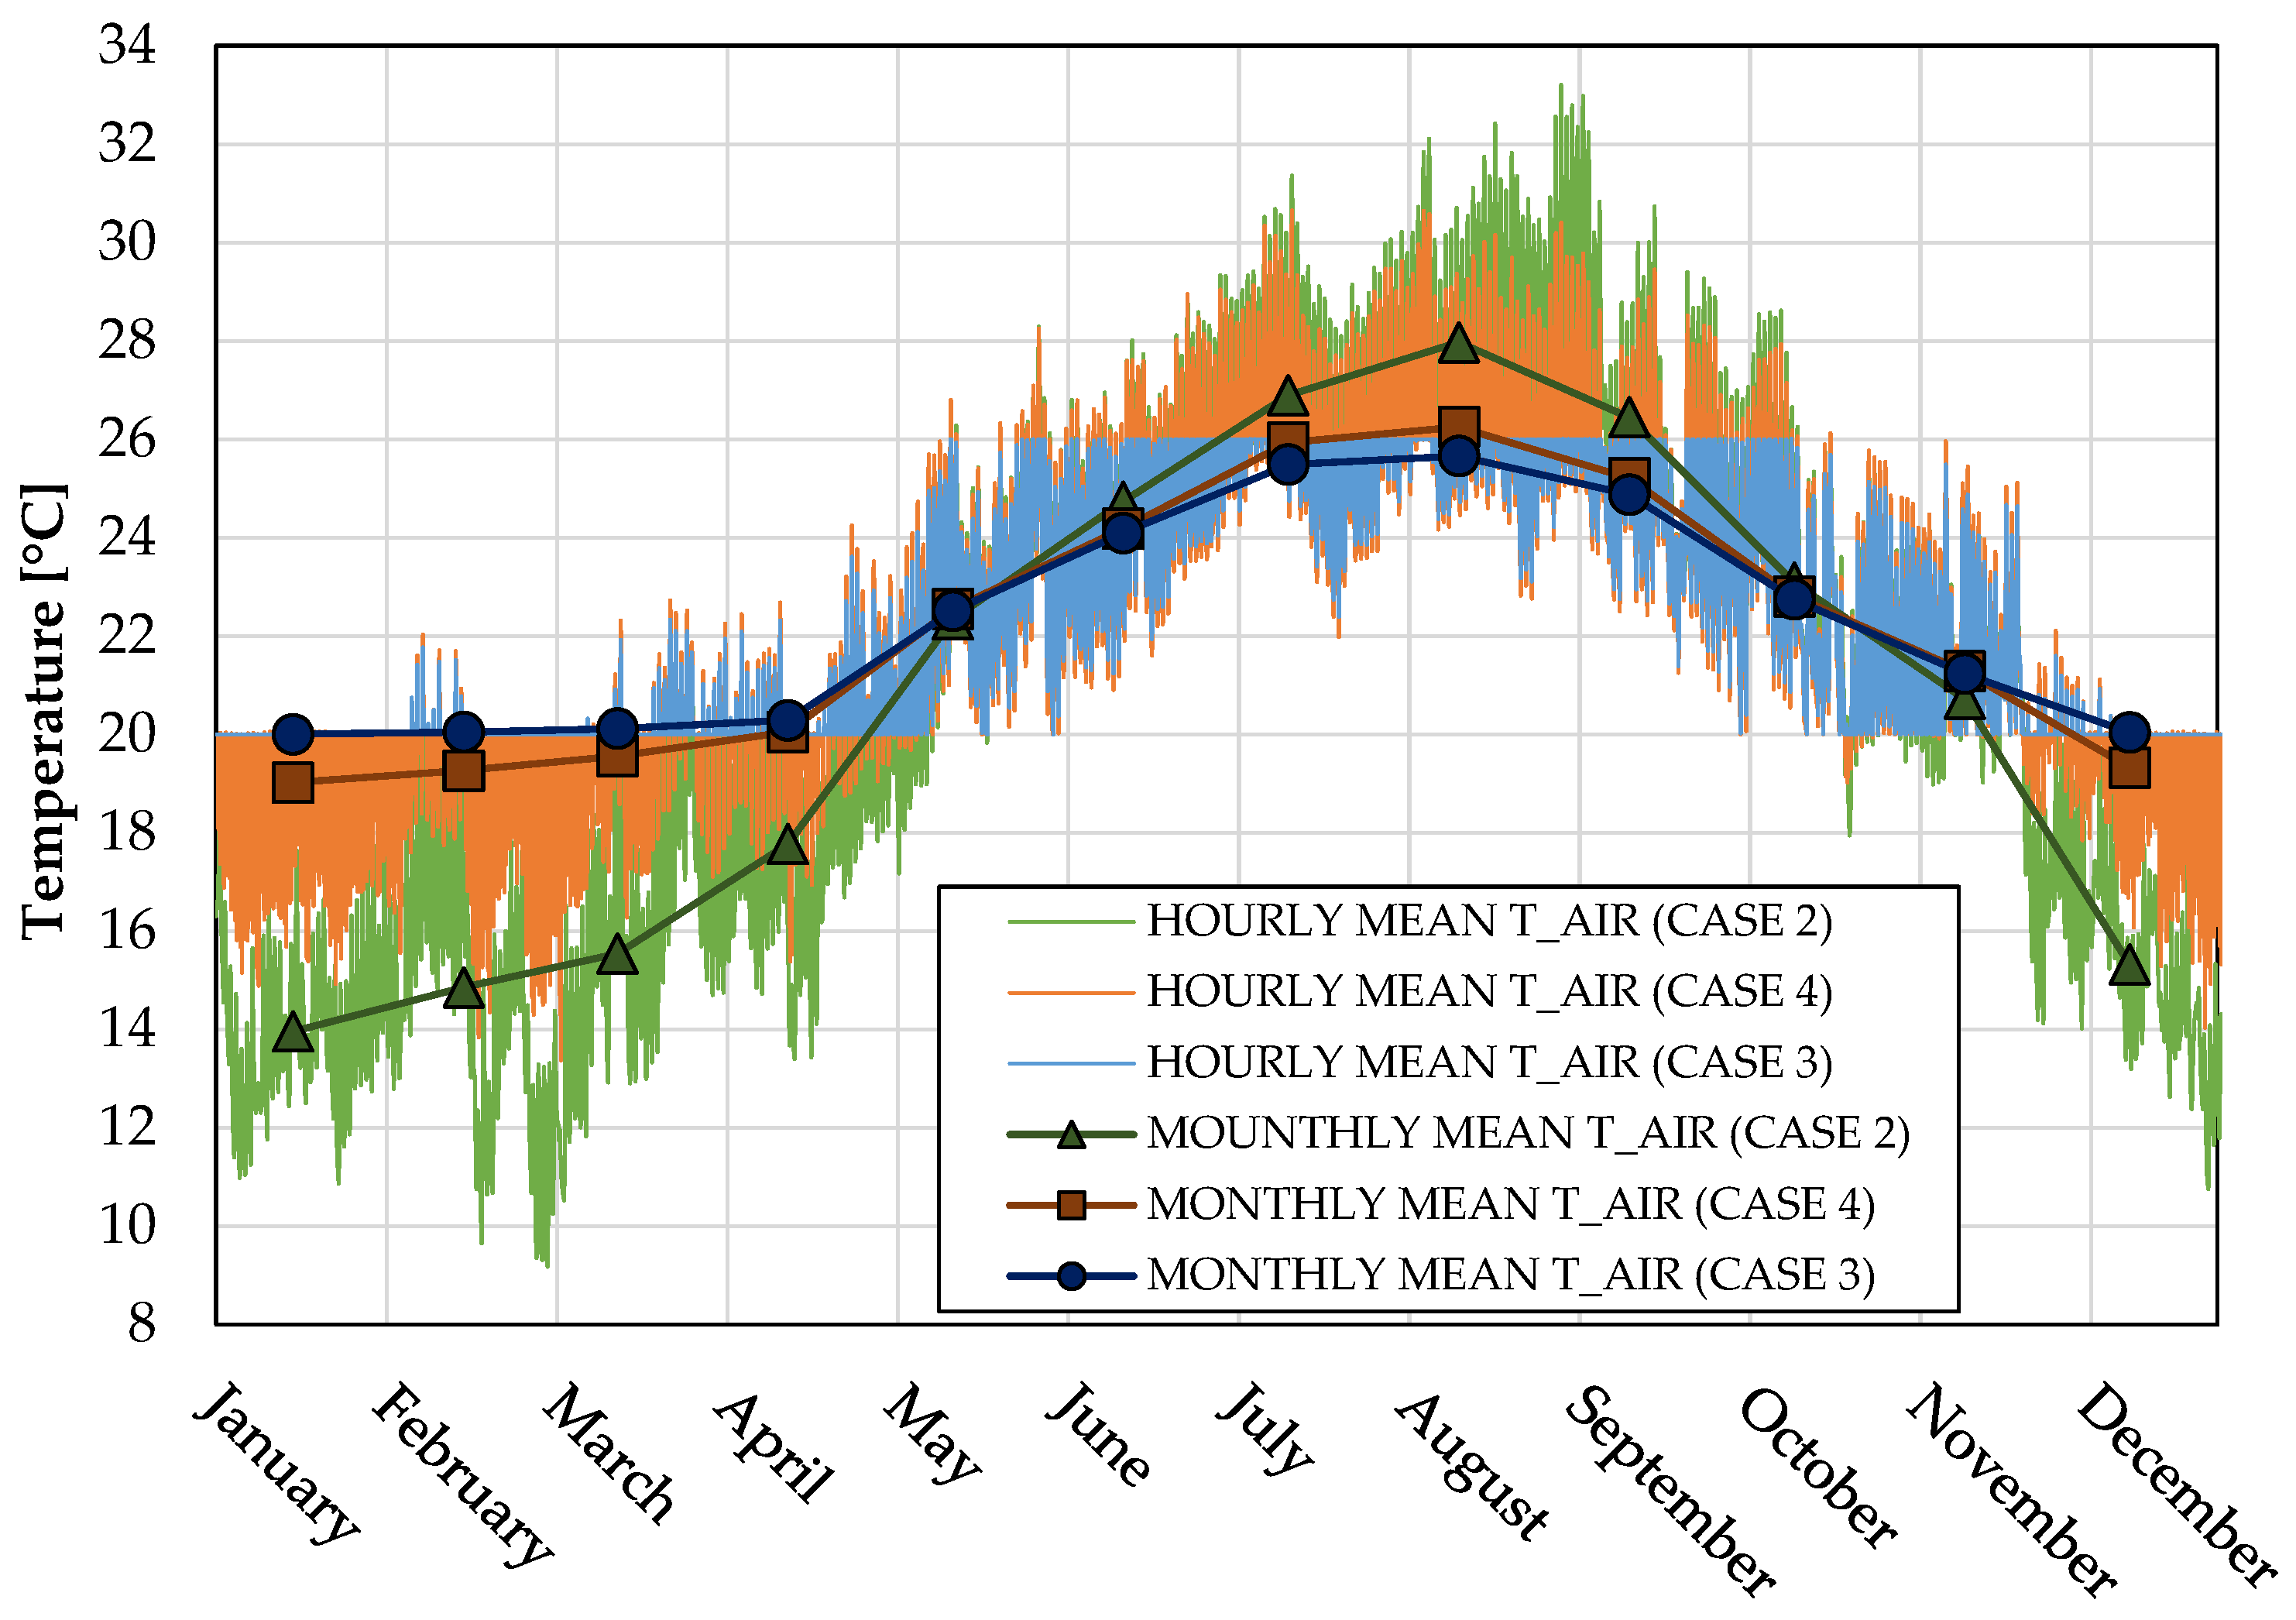
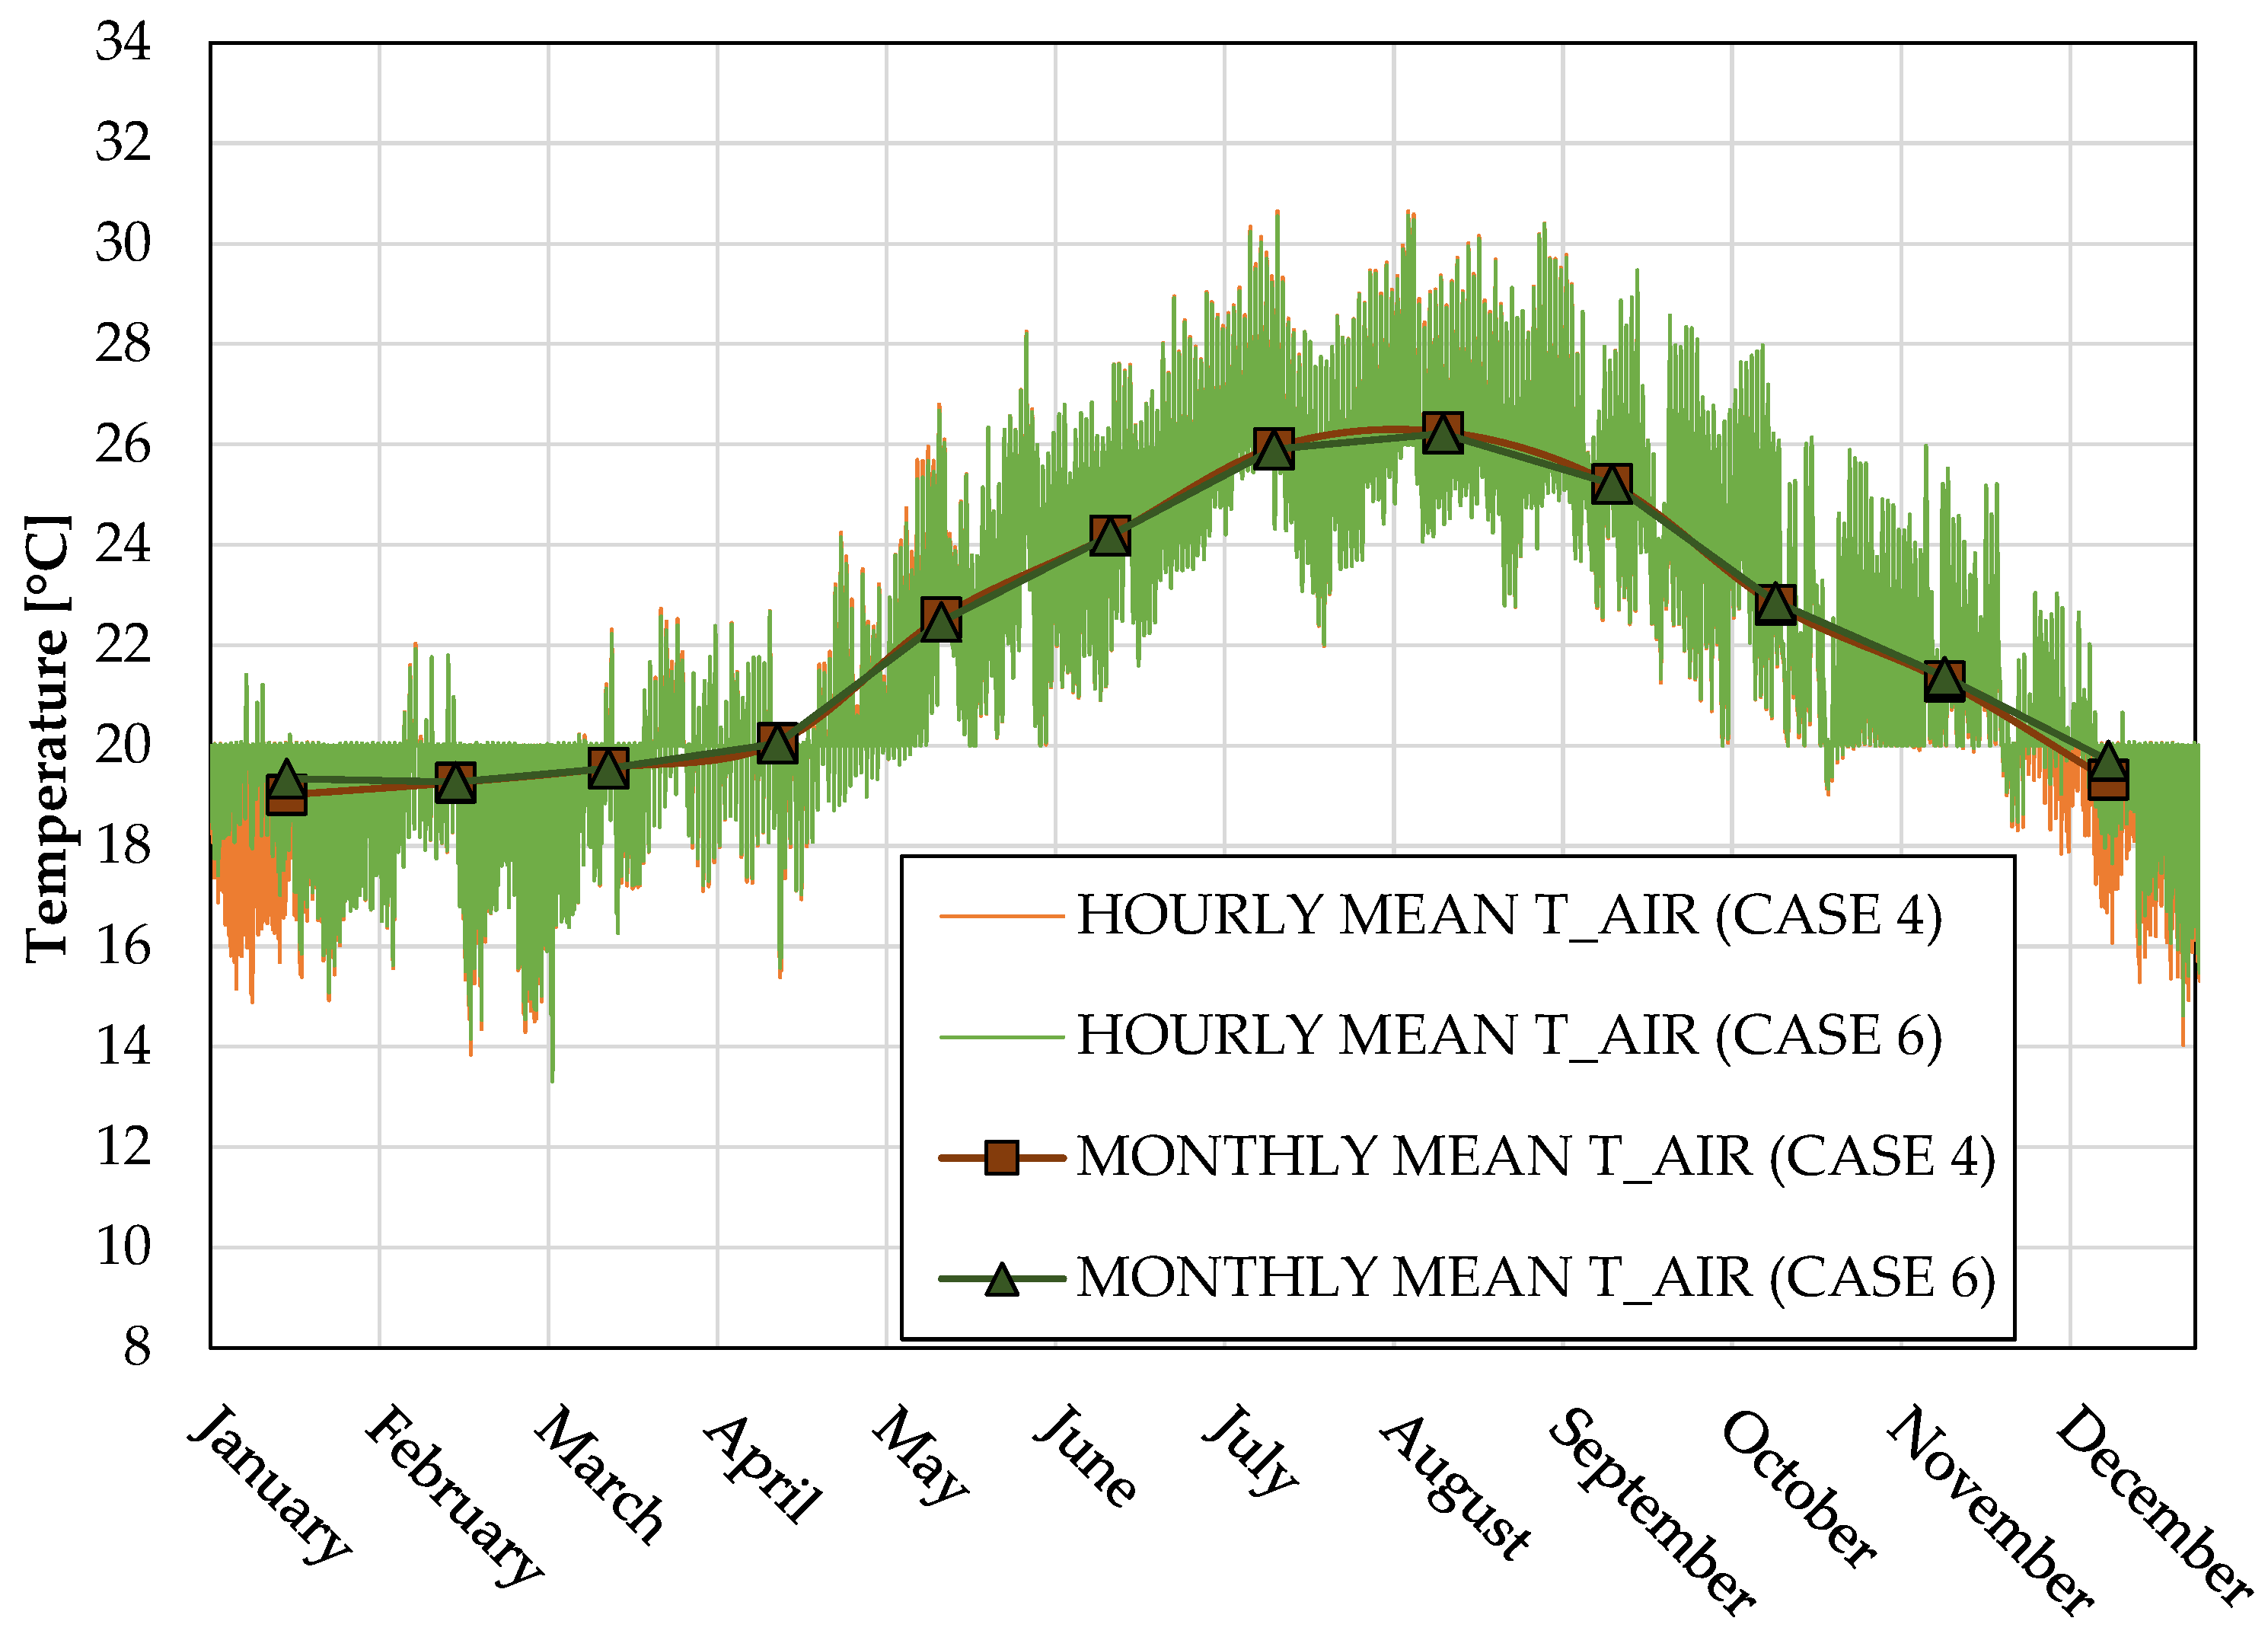
3.2.1. Temperature Analysis

Figure 15 shows the hourly average indoor air temperatures and the correspondent monthly average values for CASE 2 (no split), CASE 3 (continuous split functioning) and CASE 4 (scheduled split functioning). It can be noticed that in CASE 3, the range of 20–26 °C for the indoor air temperature is respected throughout the year, demonstrating that the split system was sized properly. At an average monthly level, the indoor air temperature for CASE 4, as expected, is between the trends obtained for CASE 2 and CASE 3. However, it has to be noticed that the average monthly temperatures are very close to those of CASE 3, therefore the intermittent HVAC functioning ensures appropriate thermal comfort conditions and energy savings. Quantitatively, in CASE 4 the set-point indoor temperatures are respected for about 76% of the hours.
Figure 16 shows a comparison among the hourly average indoor air temperatures and the monthly average values relating to CASE 4 and CASE 6, with the latter considering a double PCM23 quantity assuming a scheduled split functioning. It can be noticed that CASE 6 improves results mainly in January and December (critical months in winter) whereas the average monthly temperature slightly increases by 0.3 °C. In light of this, the employment of a large quantity of PCM23 may be insufficient to justify the use of this configuration in the face of unavoidable initial cost growth. Nevertheless, to confirm this, a parallel in-depth energy analysis has to be performed.

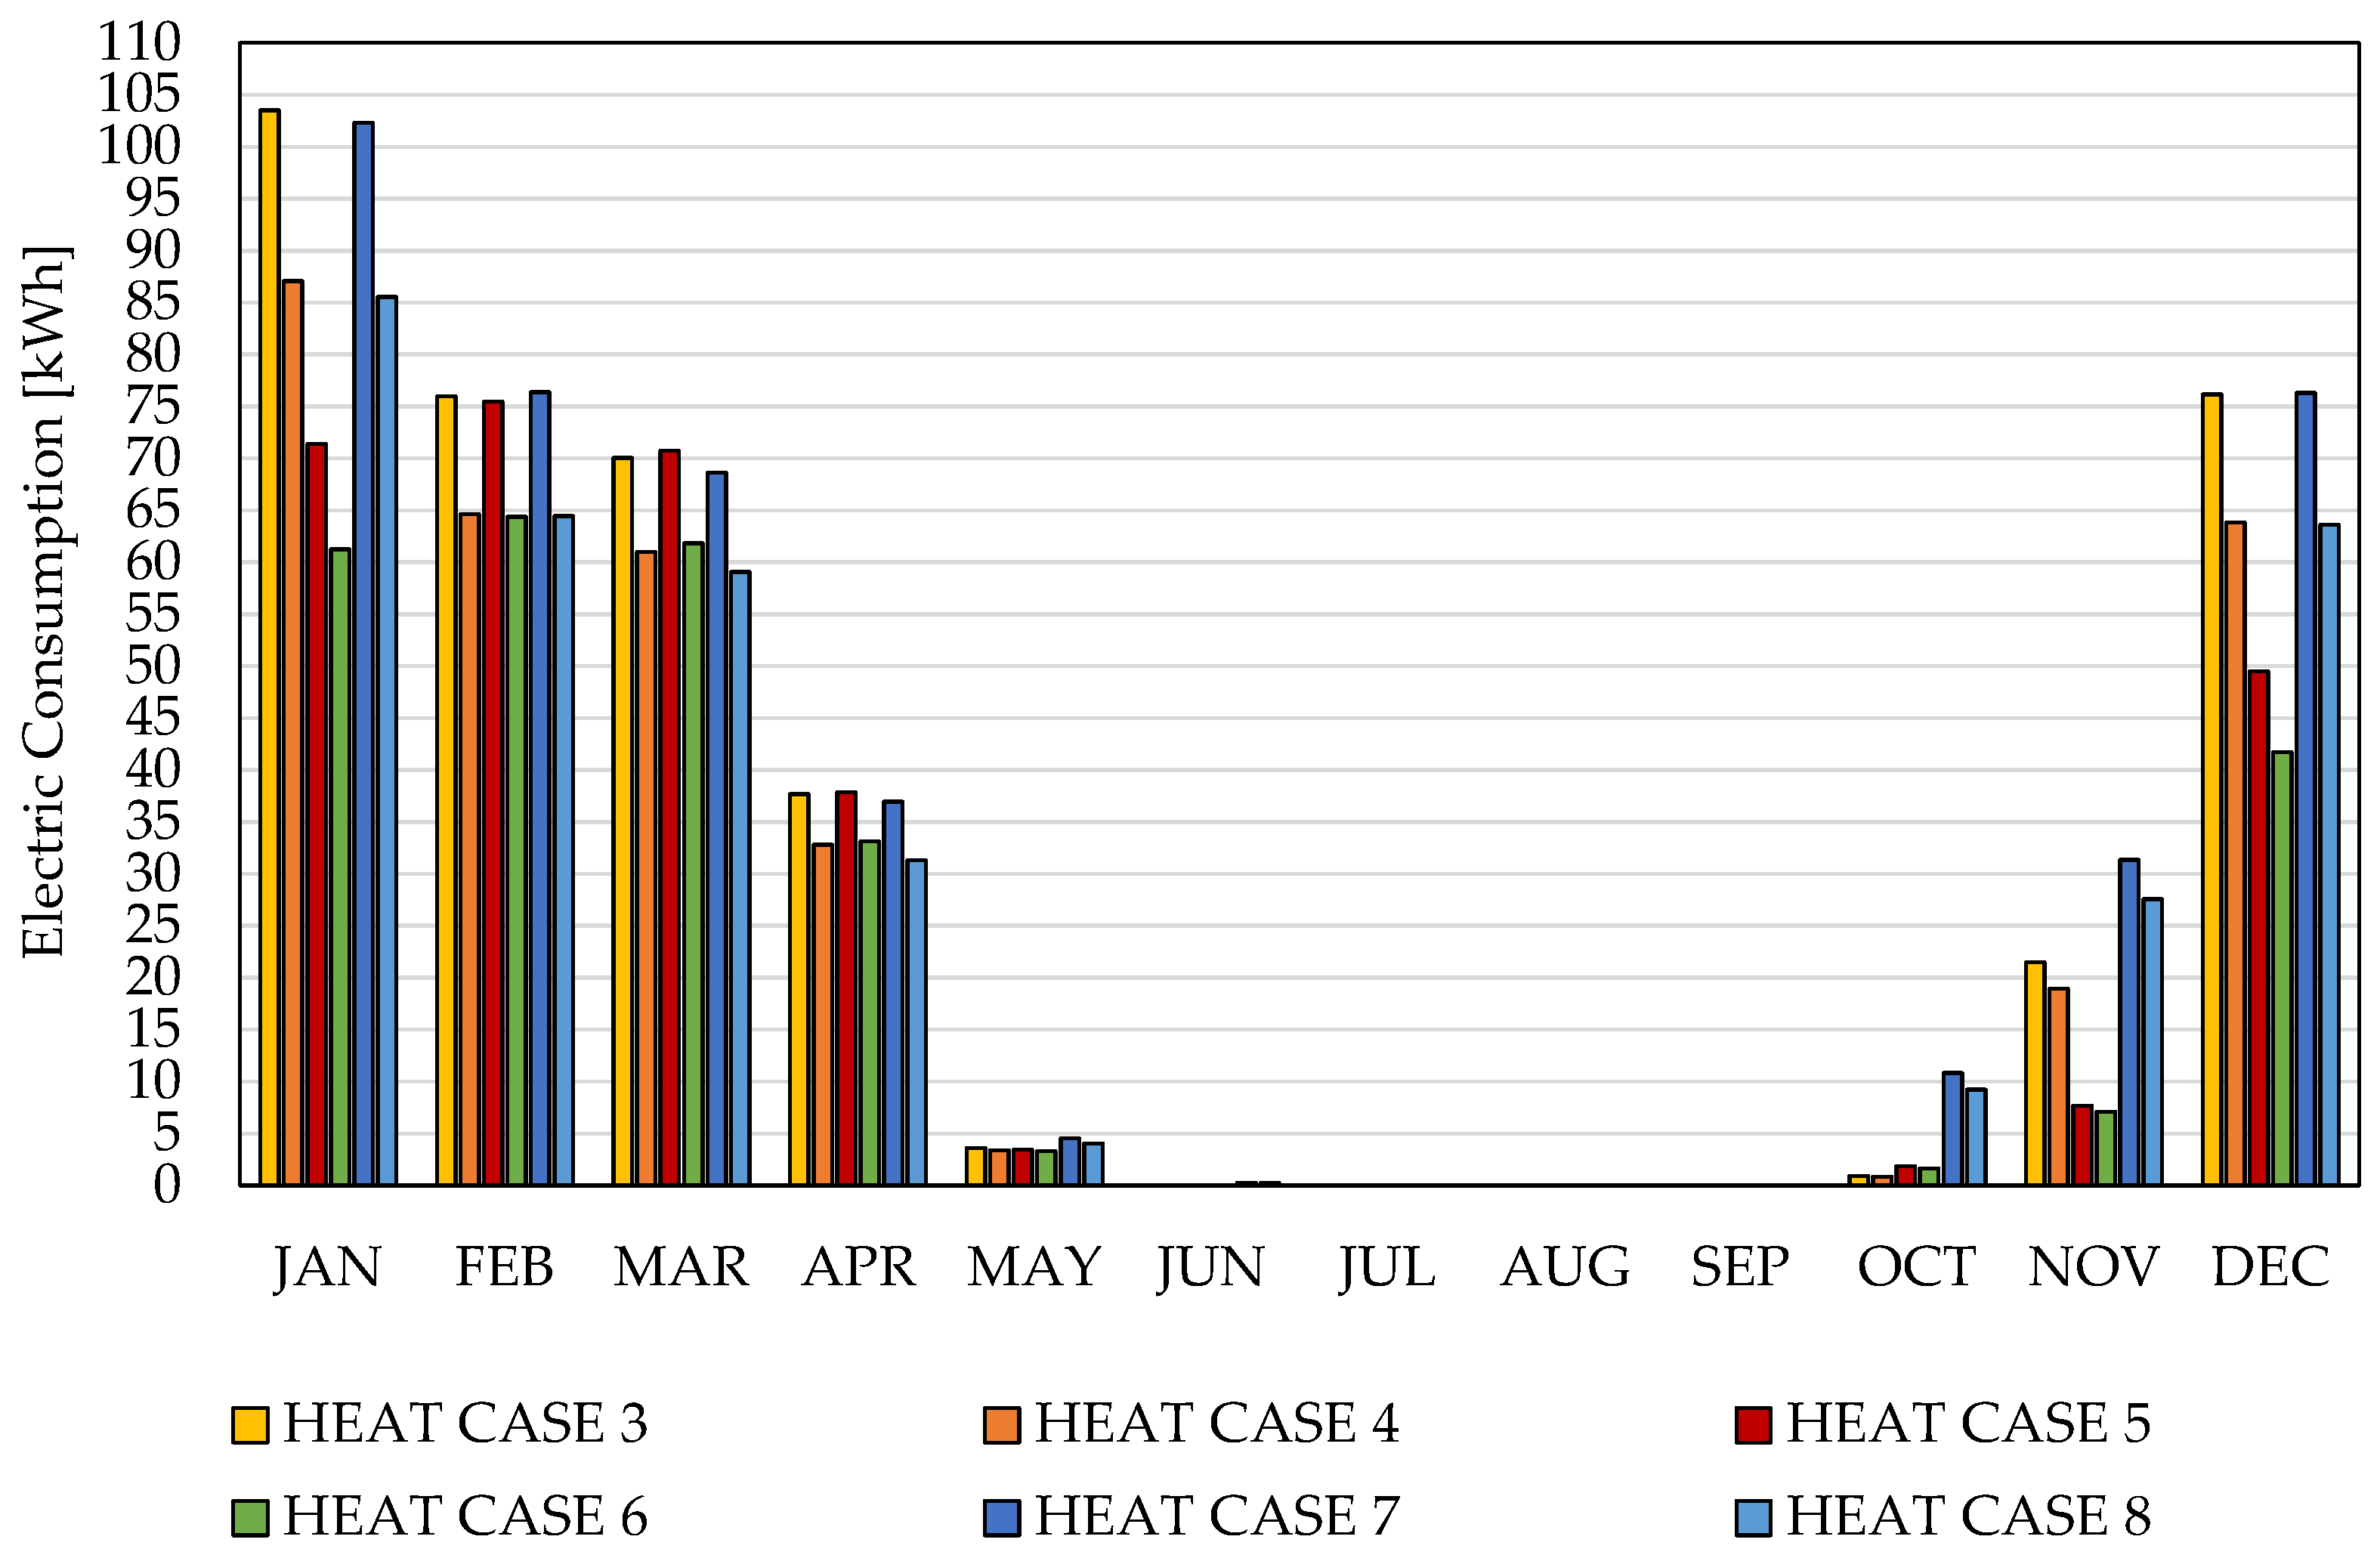
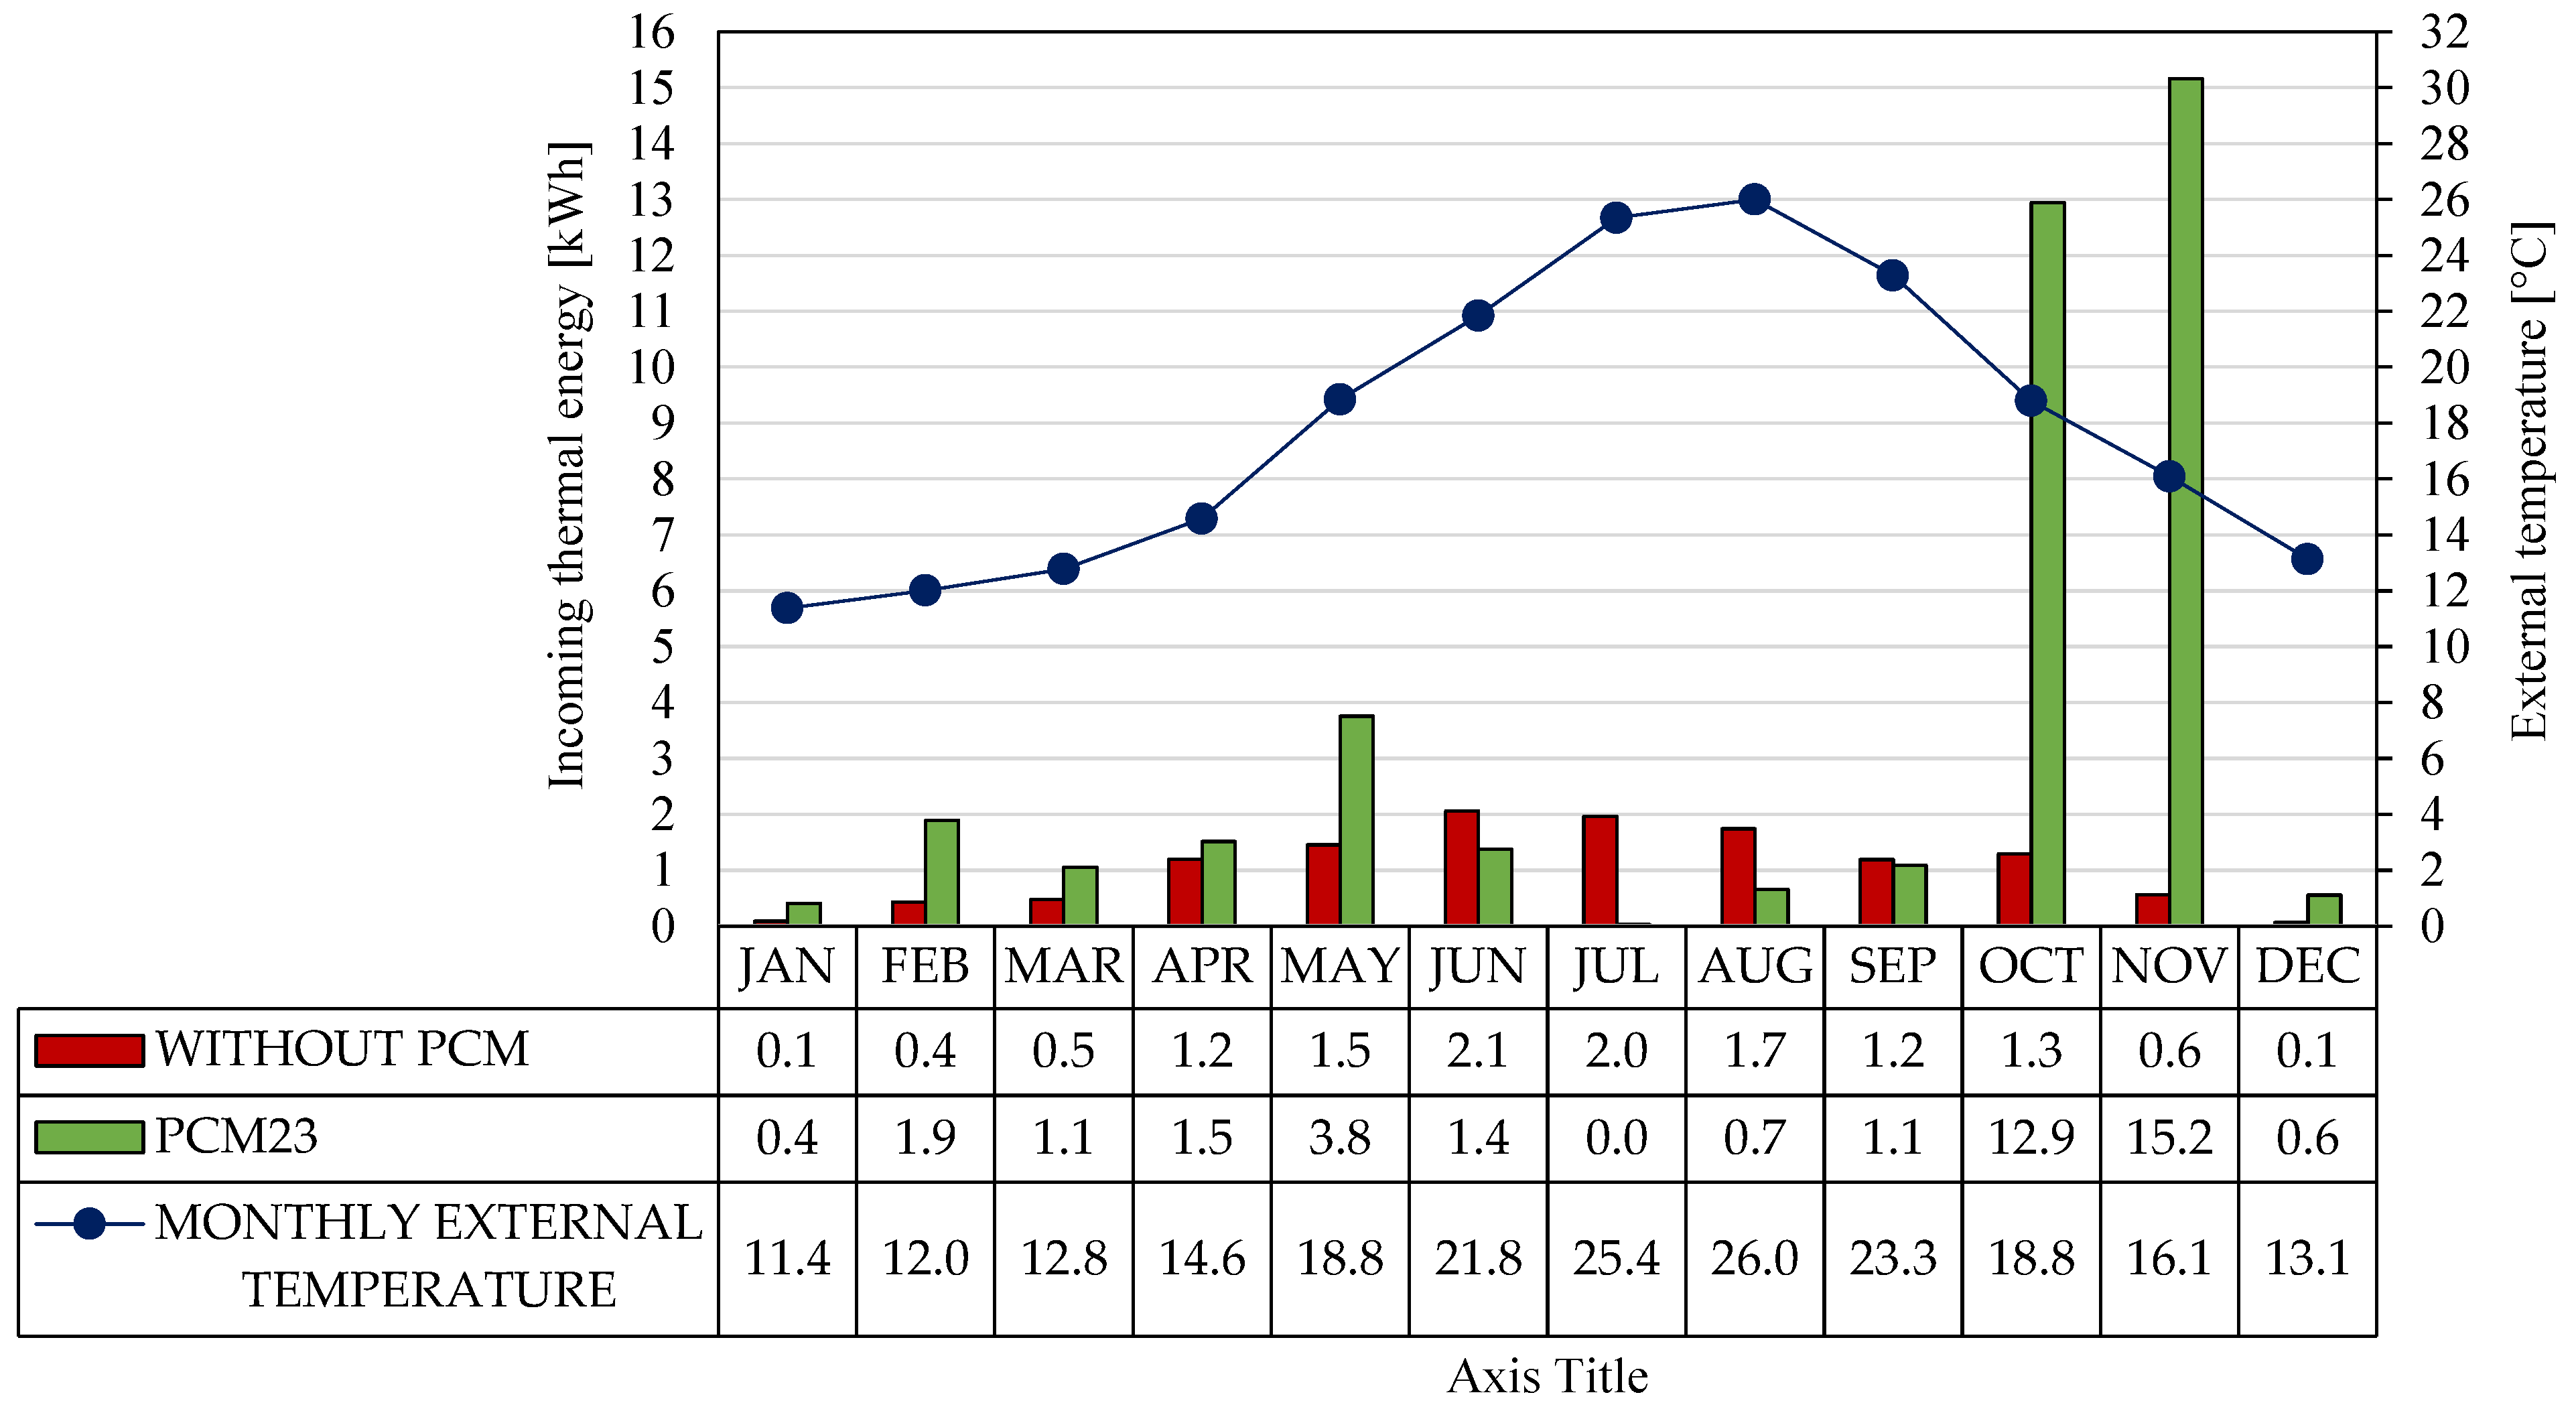
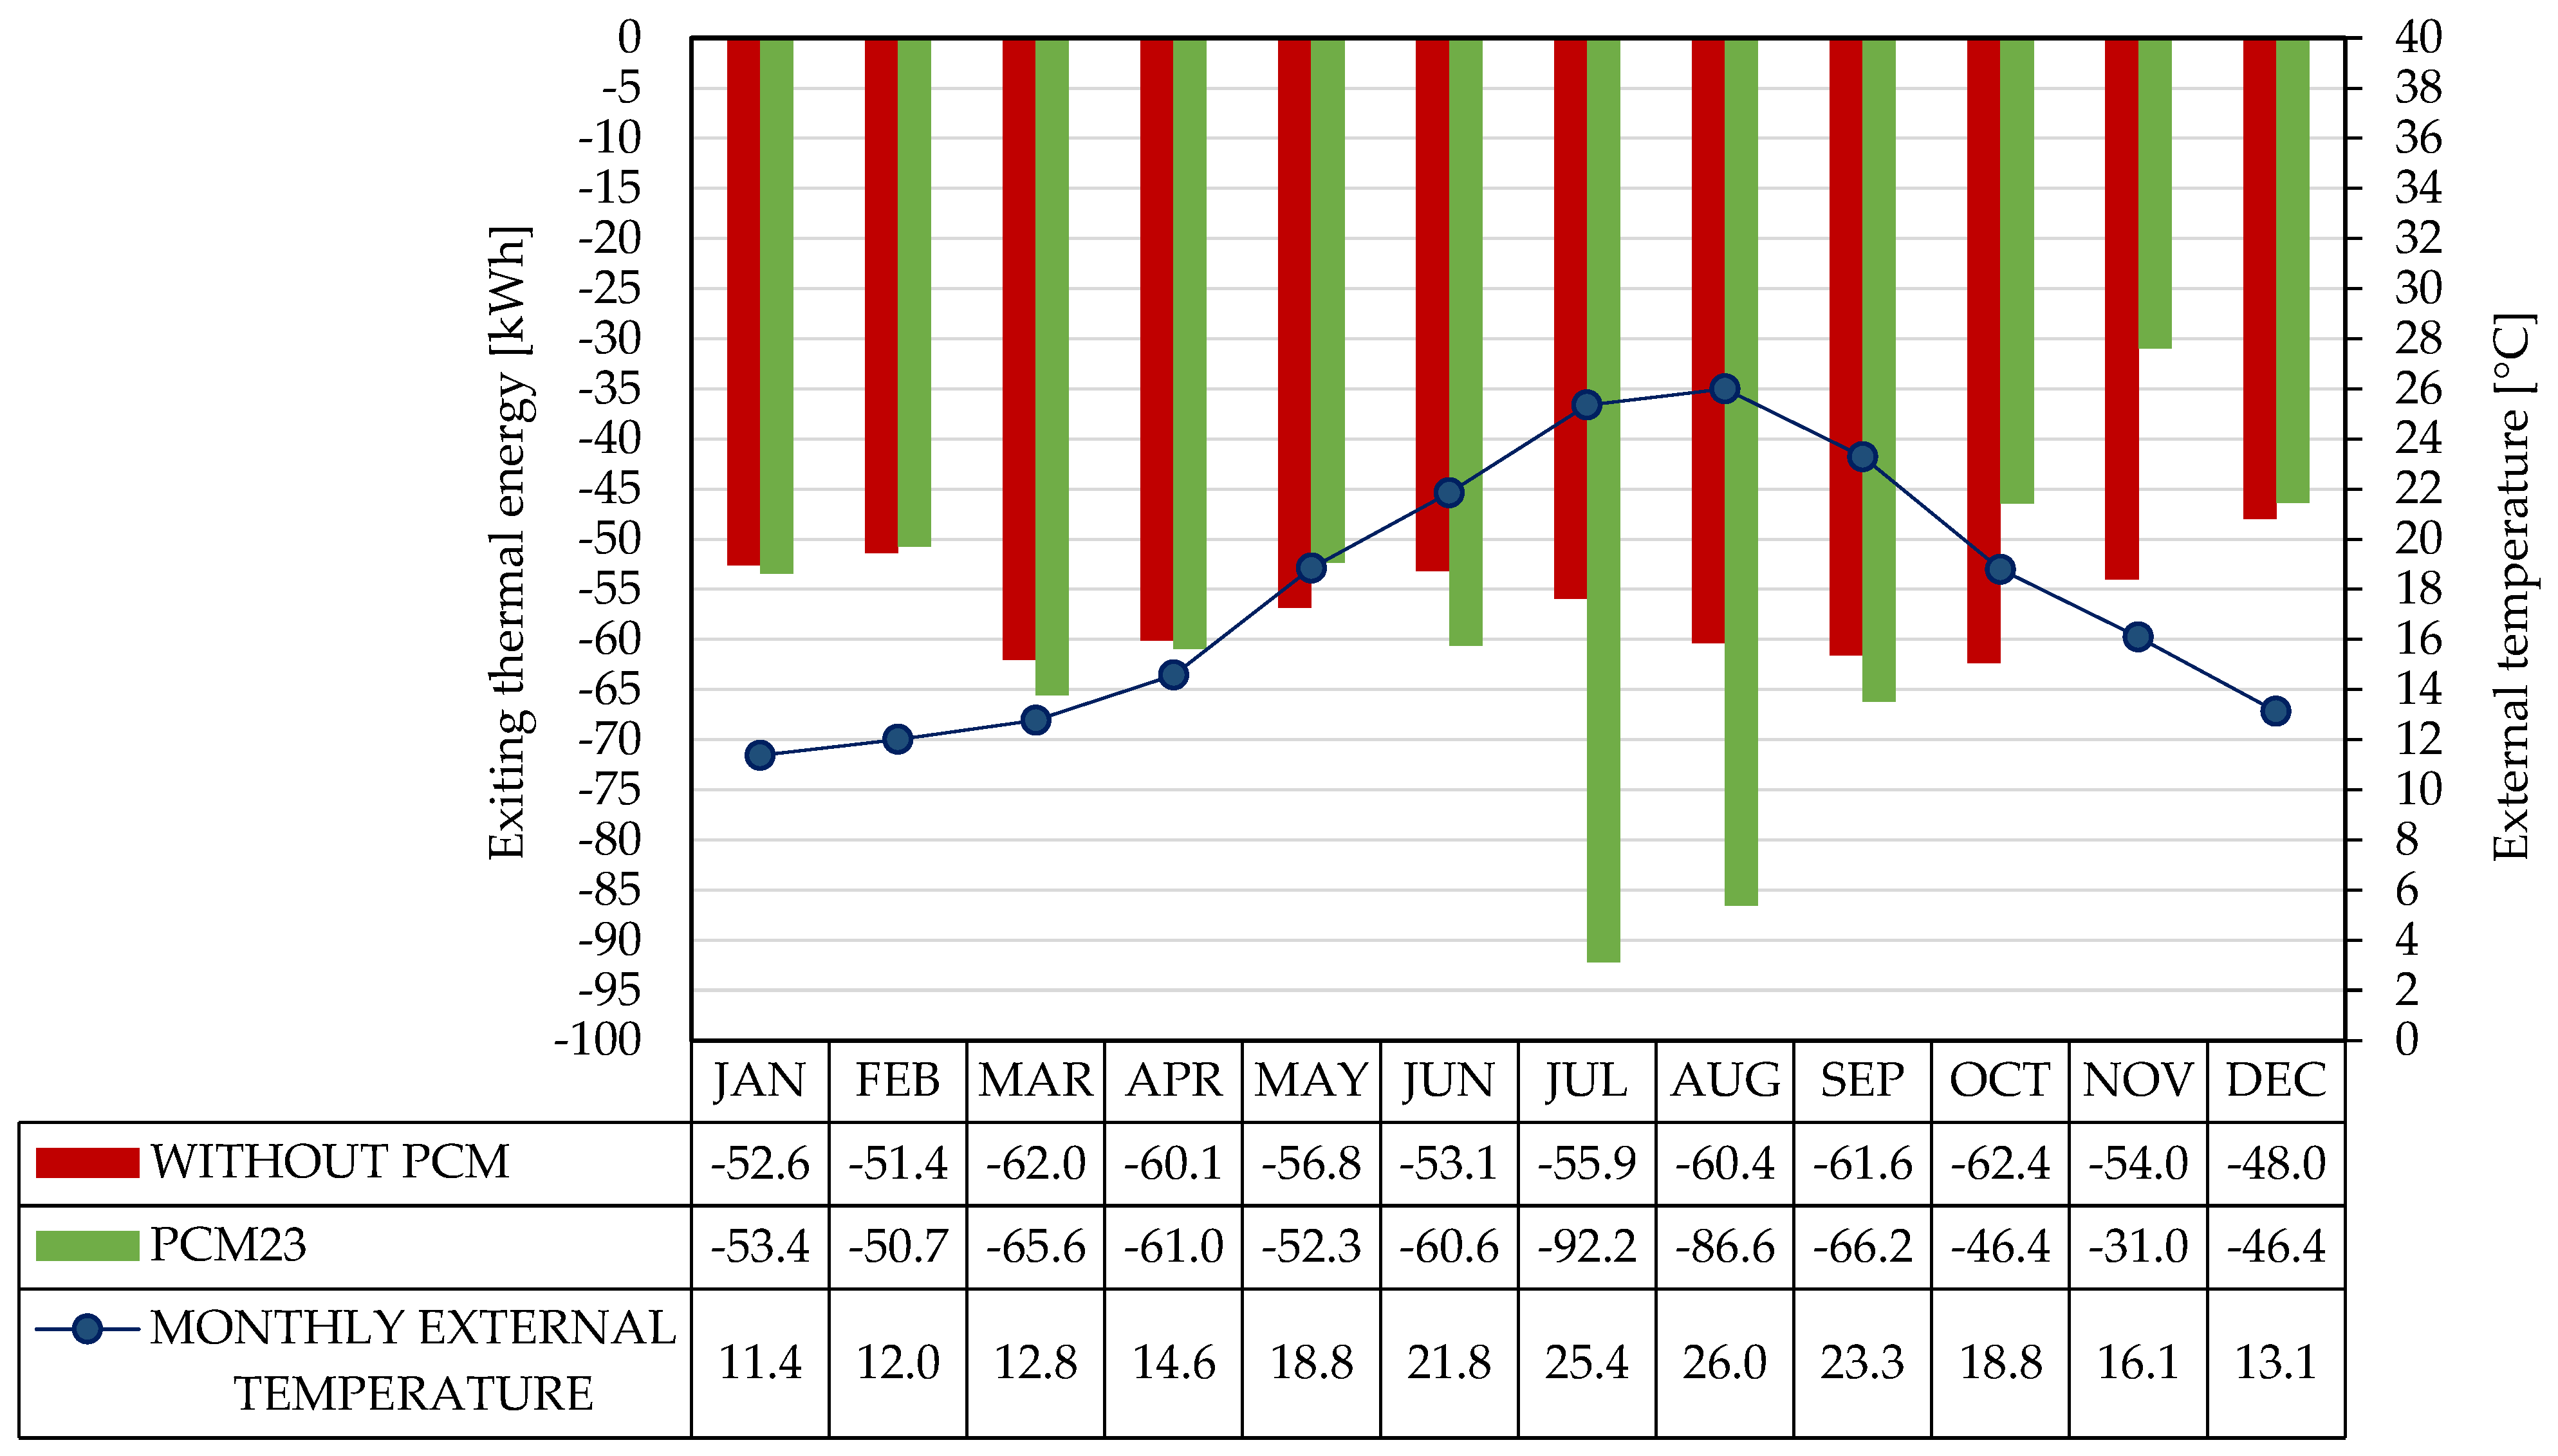
3.2.2. Energy Analysis
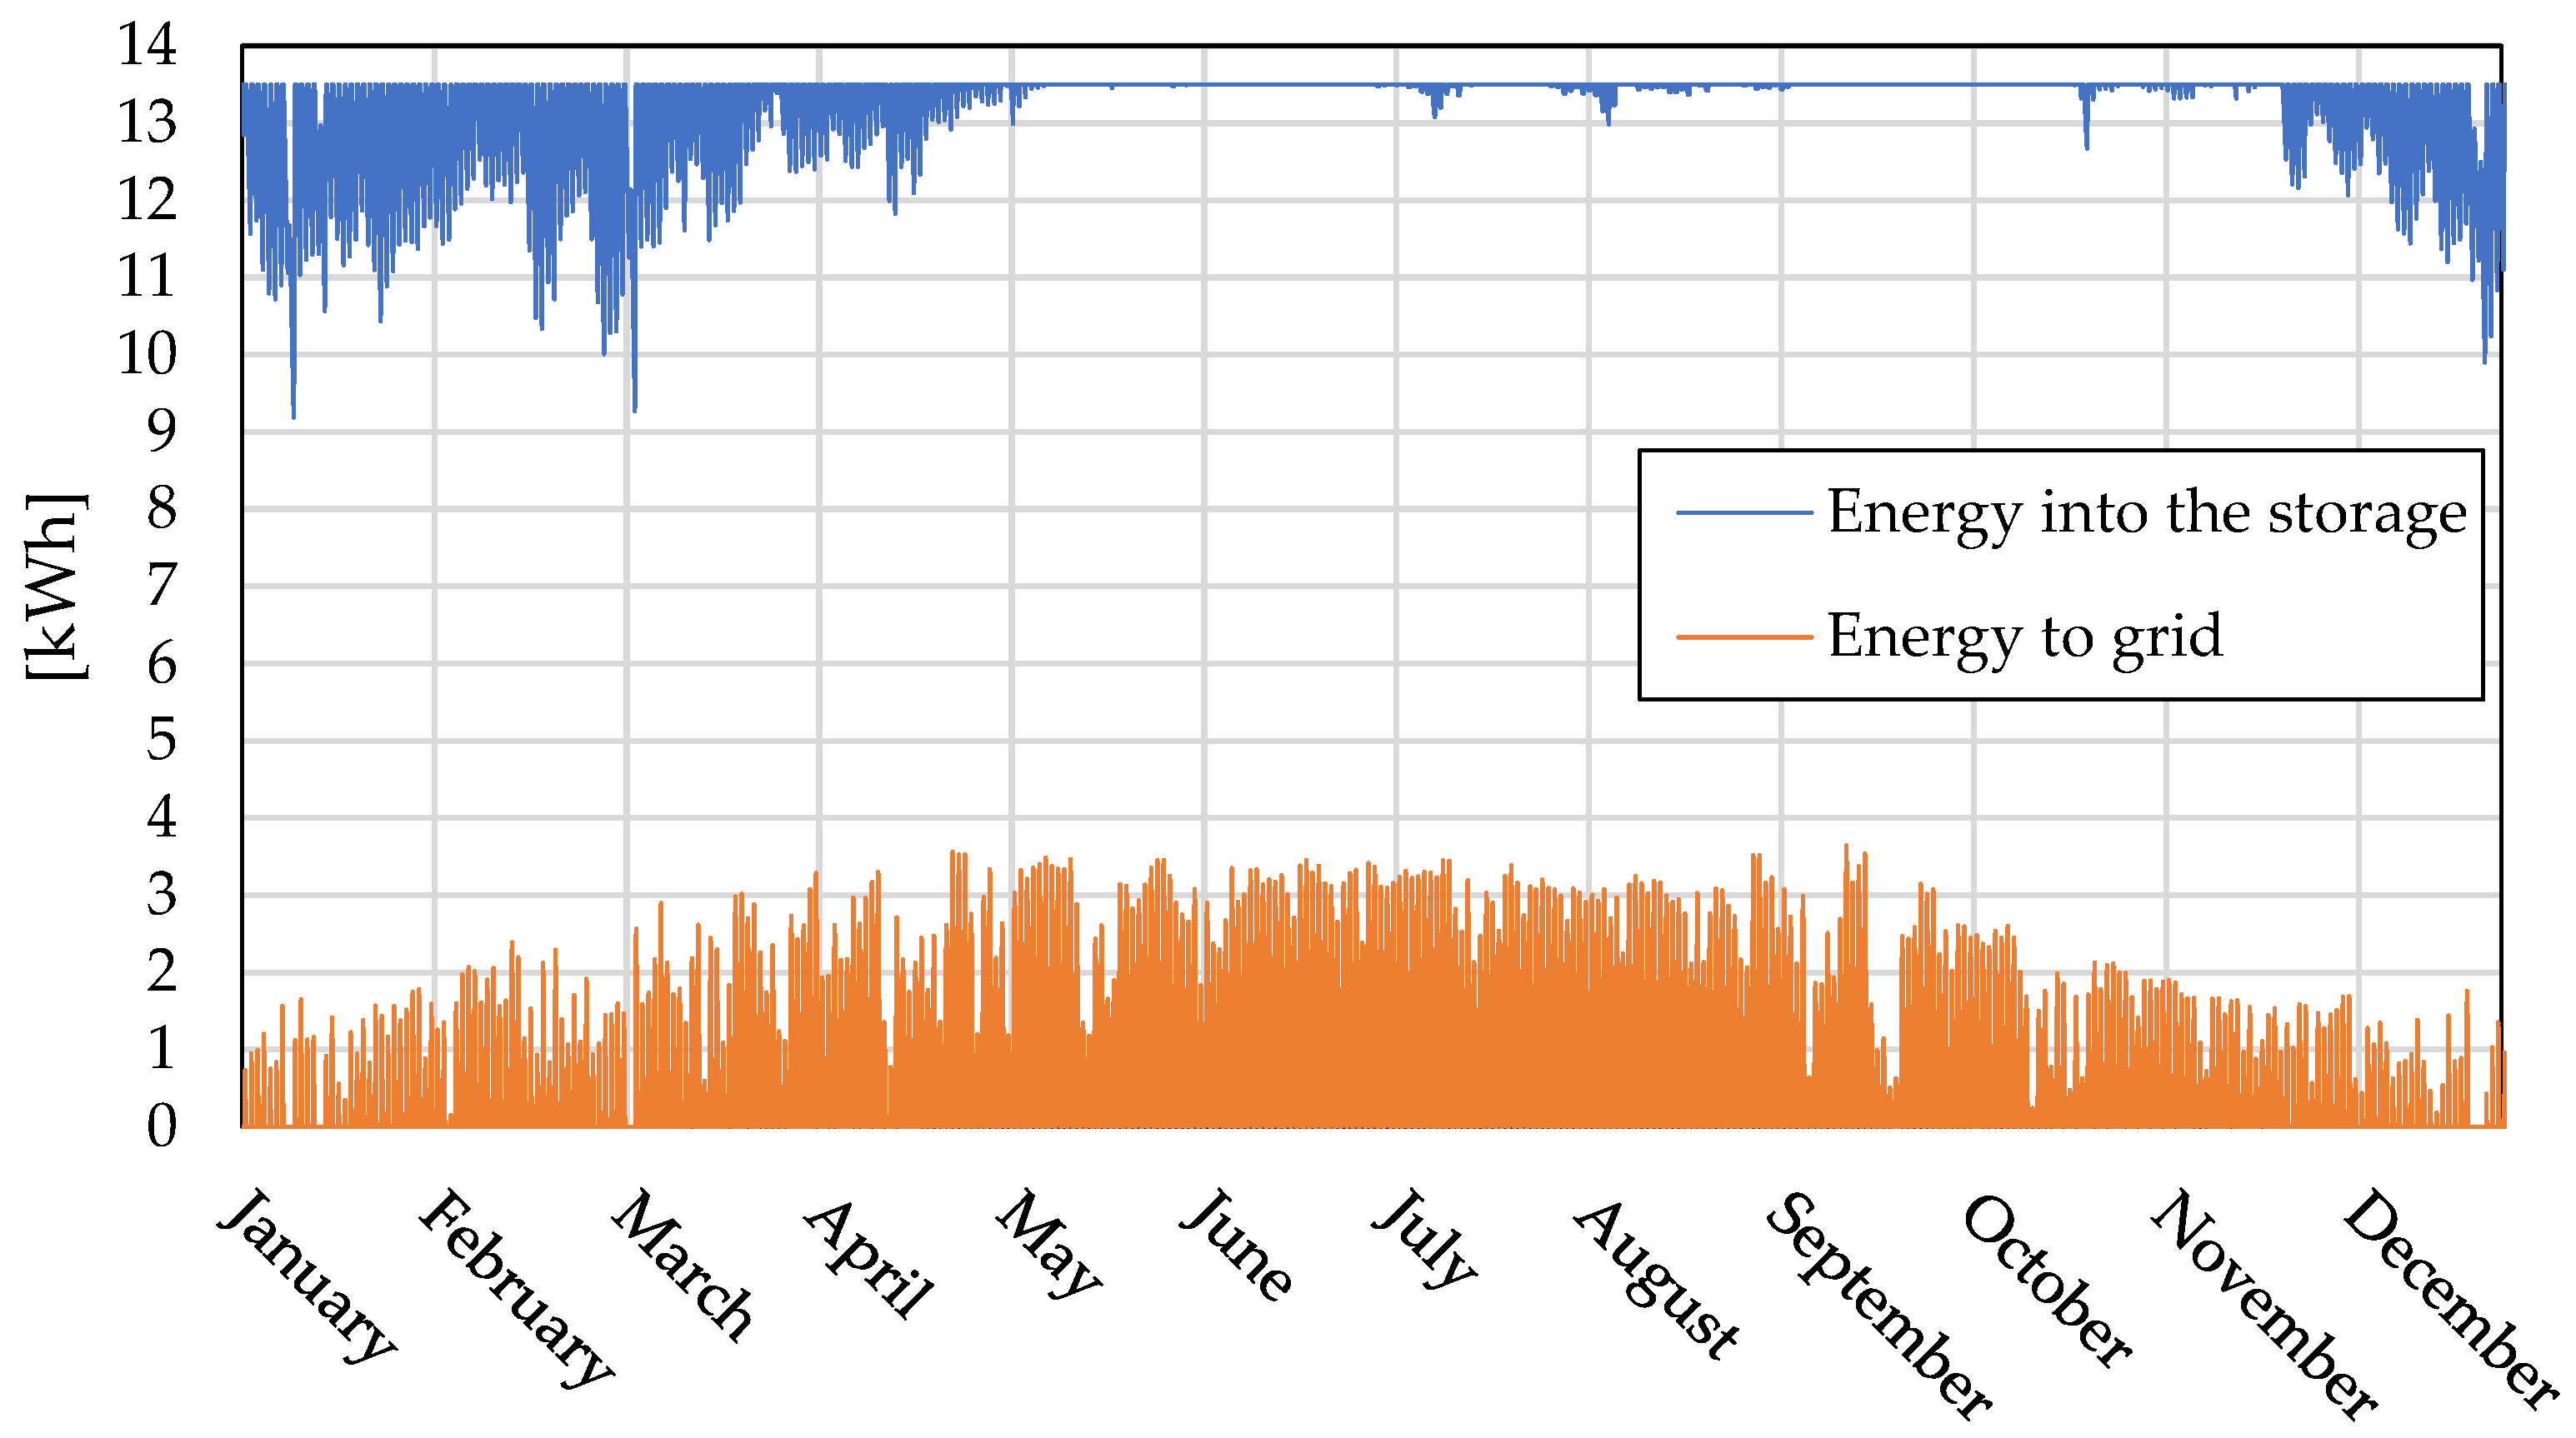
The proposed solutions were compared in terms of electricity consumption absorbed from the split system. Figure 17 and Figure 18 depict the monthly electric consumptions, respectively, in heating mode and cooling mode. In particular, CASE 3 and CASE 4, with a single PCM layer on the inner side, CASE 5 and CASE 6 with a double quantity of PCM23 and CASE 7 and CASE 8 referring to THUs without PCM were considered with a continuous and a scheduled HVAC operation. It can be appreciated that electric consumption is reduced by 65% in November and by 35% in December, both with a continuous and scheduled operation regime, referring to the THU configuration without PCM. The main advantages were detected with a double quantity of PCM, especially in the colder months, whereas a single PCM layer produces appreciable savings in May, October and November.
In the considered climatic context, more favorable results were detected in the cooling mode. A double layer significantly reduces the electricity consumption every month, nevertheless, in CASE 5 the results are similar to those determined for CASE 4, meaning that the scheduled operation with a single PCM layer allows for compensating the gap in terms of electricity with a double PCM with a split continuous operation. In order to quantify the impact of a double PCM23 layer, the electric consumption reduction ranges between 35% and 47% between CASE 5 and CASE 7 and between 25% and 45% between CASE 5 and CASE 3, confirming that greater PCM quantities are favorable, especially in the cooling period. Similar results were obtained with a scheduled split operation, in light of similar percentages detected between CASE 6 and CASE 8 and between CASE 6 and CASE 4. These values highlight the aptitude of the SuberWall panel to partly absorb energy gains by the second innermost PCM23 layer, with the advantage of releasing the solidification heat mainly toward the external environment. Globally, the panel layout shown in Figure 5b is beneficial in the colder months and summer, promoting an efficient dropping delay in winter and attenuation in summer of the indoor air temperatures. This allows a great reduction in the electrical consumption and justifies the use of this configuration in locations characterized by high external air temperatures and high intensity of solar radiation, in light of the higher percentage of electric savings detected in summer.
What has been observed previously on a monthly level is depicted at an annual level in Figure 19. The greatest savings are obtainable by including PCM23 in both the panel air gaps with a scheduled split functioning. Electric consumption slightly increases with an HVAC system operating in a continuous regime but offers sure advantages in terms of thermal comfort conditions. A larger electric consumption was detected with a single PCM23 layer in a continuous operating regime, and the result is similar to that obtained for a THU without PCM but with a scheduled split functioning.
To quantitatively evaluate the deviances among the analyzed cases, Table 8 summarizes the differences between the considered scenarios under the same split operating conditions using the cases without PCM as a reference. Therefore, CASE 3 and CASE 5 were compared with CASE 7 and CASE 4 and CASE 6 with CASE 8. Again, a double layer of PCM23 significantly reduces electricity consumption, but mainly in cooling mode, and the PCM role is more accentuated with an intermittent HVAC functioning, improving the exploitation of the building fabric thermal mass. However, to determine the most profitable solution, other investigations considering the initial and operative costs are required to determine the actual profitability of every solution.

4. THU with a BIPV

A photovoltaic generator with characteristics listed in Table 9 integrated into the building roof (BIPV) not only improves the structure sustainability [45], but it can allow for achieving multiple benefits, including:
  • self-produced electricity that meets the users’ needs by reducing the withdrawal of electricity from the grid and by favoring the energy community’s development;
  • roof protection from atmospheric agents;
  • roof shading in summer.
An electric storage system could increase the self-consumption share and favor the transfer of energy among THUs [46]. Given the space available on the roof, it was decided to create a PV generator consisting of nine horizontal panels framed on a support structure slightly raised above the roof surface to promote natural ventilation [47]. The system designed and implemented in EnergyPlus looks like the sketch in Figure 20.
In Figure 21 it is possible to observe the hourly trends of PV production and user electricity consumption (the only hypothesized electrical load is the split system). It is observed that electricity production exceeds consumption. Therefore, the convenience of using a storage system, to make the electricity user-independent, clearly emerges.
In Figure 22, the hourly trends of the energy actually accumulated at each instant are reported starting from an initial situation with a saturated battery and energy surplus supplied to the grid. It is observed that the battery charge is maintained on average above 93% most of the time. This can also be observed in Table 10 which shows the average monthly storage system charges. Furthermore, it has to be noticed that the production allows, once the storage system has been recharged, a further provision of electricity into the grid to be exploited by adjacent THUs in electric deficit. Alternatively, the shares of available energy would power additional users’ appliances.

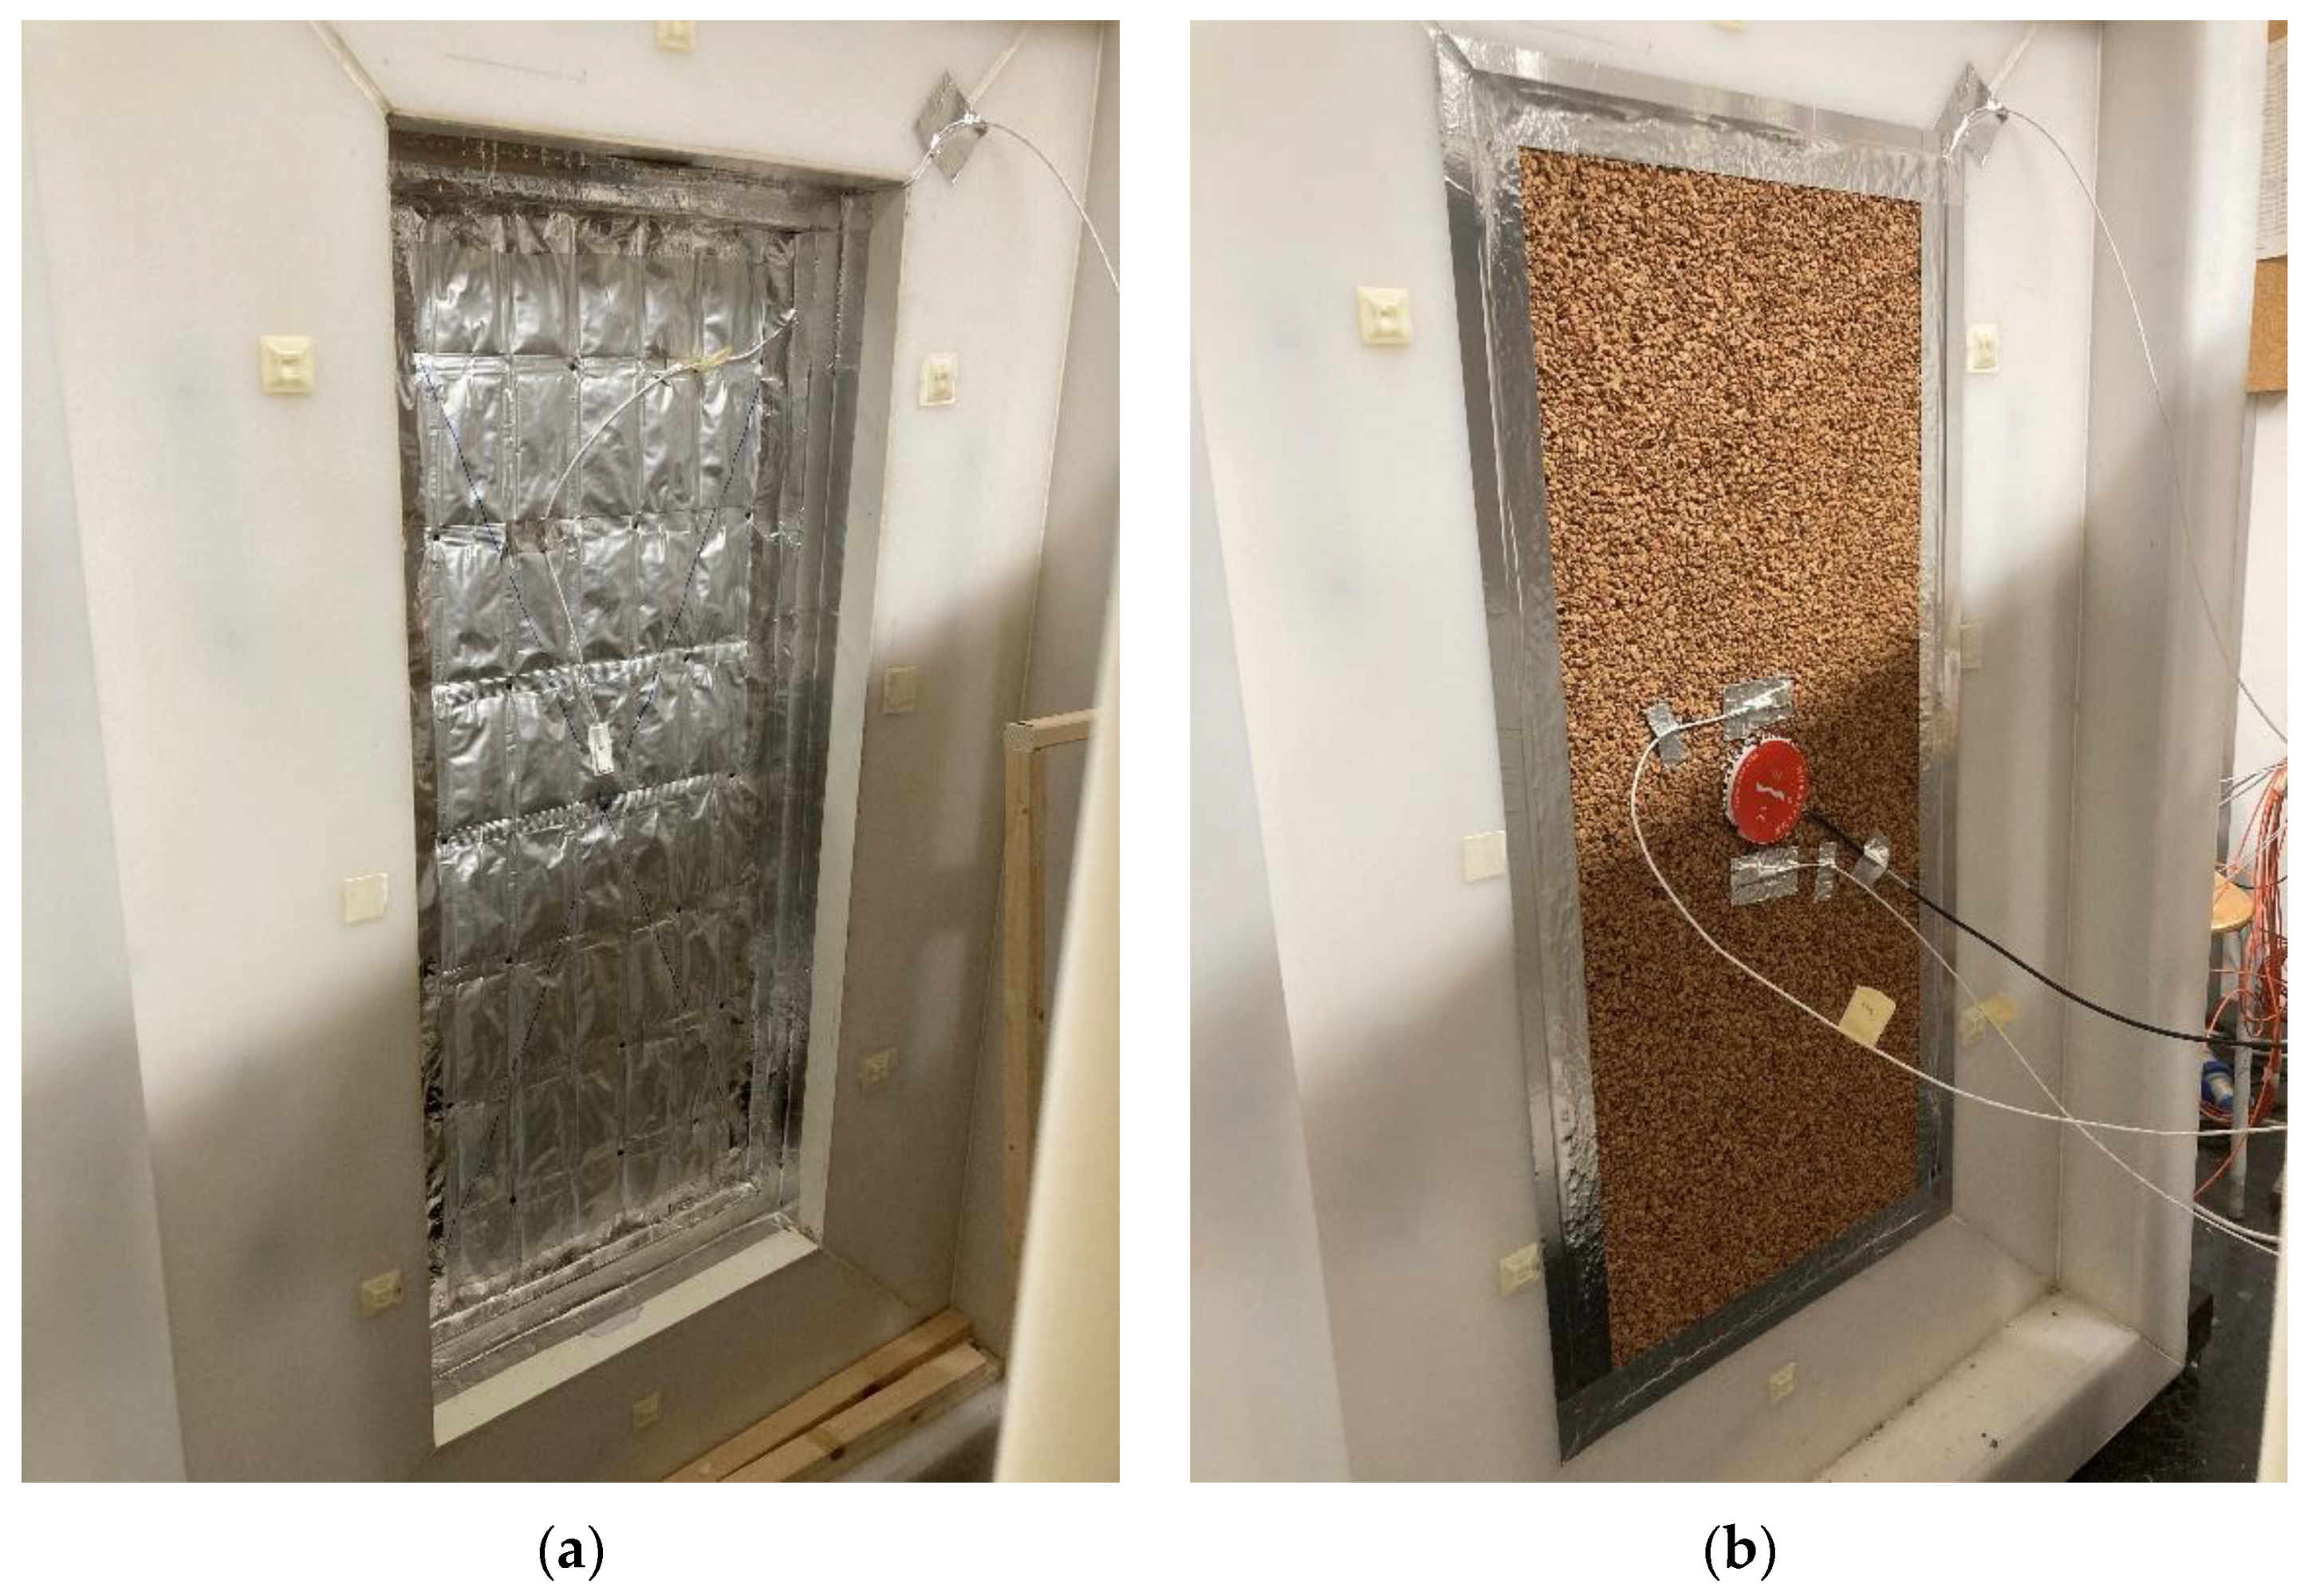
5. Experimental Tests

A prototype of the SuberWall panel, equipped with a single bio-PCM23 layer on the inner side, was tested in a climatic chamber available at the Mechanical, Energy and Management Engineering Department of the University of Calabria by using the heat flux meter method. The measurements were conducted by simulating dynamic solicitation on the external side (to consider typical summer conditions) and a constant temperature on the internal one to simulate an indoor environment at the set-point temperature. Features of the employed climatic chamber can be found in [48], whereas in Figure 23 details of the installation of the PCM sheet inside the panel (a) and the heat flux meter and two temperature probes installed on the internal cork panel (b) are shown.
Figure 24 depicts the response of the surface temperatures when the sample is subjected to a sudden air temperature increase; in particular, the external environment was set to 10 °C for a certain period, then the temperature was increased instantaneously up to 35 °C. It is worth noting that a few minutes are sufficient to establish a new regime temperature on the hot sample surface and, conversely, the retardant effects of the PCM layer are evident on the other side, whose surface temperature showed a large delay before stabilization. In particular, after 6000 min the temperature is not constant, because the PCM layer is still absorbing thermal energy from the hot side to carry out the complete PCM liquefaction.
In Figure 25, the results the test in which the external sample surface is subjected to a sinusoidal solicitation are shown, in which external temperature has an amplitude of 12.5 °C and an average value of 22.5 °C. It is worth noting that the right y-axis has a different scale than the left y-axis to appreciate the sinusoidal trend also achieved on the inner sample surface. However, time shift and the limitation of the internal sinusoid amplitude (attenuation) are widely appreciable. Quantitatively, the single PCM23 layer has produced a time shift of 6.7 h (the x-distance between the positive peaks of the two sinusoids), whereas the attenuation factor was determined at 0.309 following UNI EN 13786 [49]. The sample is thermally qualified by the periodic thermal transmittance (Yie) that for the monitored case amounted to 0.093 W/m2K. The attenuation factor is appreciable, but the phase shift is not so excellent: the latter suffers from a dry stratigraphy which makes the wall “light” from a thermal point of view with limited accumulation properties, as expected for the dry-assembled panel. The single PCM layer allows, for instance, a sufficient delay in the internal temperature peak, meaning that energy gains in the first afternoon hours will be manifested in the evening.

6. Conclusions

In this paper, the energy performances of a THU specifically designed for the Mediterranean climate and based on massive employment of natural materials have been determined. The building envelope is composed of “SuberWall” panels made of cork and bio-PCM that have several advantages:
  • lower environmental impact compared to traditional materials used in the construction sector;
  • low weight and facilitation in the transport and the assembling phases;
  • simplification of the subsequent disassembly and possible recycling of the materials;
  • appreciable structural, thermal and acoustic performances.
If the cork induces excellent insulation properties to reduce winter demands, an accurate choice of the bio-PCM is required to maximize the limitation of the cooling loads. Indeed, the THU has a limited thermal mass, therefore it can be made suitable for warm climates only by equipping it with PCMs with an appropriate melting temperature, properly located inside the panel and in a suitable quantity. Energy performances were evaluated in the EnergyPlus environment by considering different SuberWall layering and operating conditions of an electric air–air heat pump, and by comparing the results with a similar THU not equipped with bio-PCM. The analysis and the comparisons carried out on the various panel configurations have highlighted the following aspects:
  • PCMs allow for obtaining evident benefits in terms of annual thermal energy requirements due to the obtained increase in the number of hours per year in which it is possible to avoid the operation of the HVAC system. In particular, in the best of cases, the percentages of hours go from 26% (without PCM) to 36% (with a bio-PCM with a melting temperature of 23 °C);
  • the bio-PCM with a melting temperature of 23 °C produced large benefits, especially in the summer and autumn months, due to the considered climatic context in which cooling needs are dominant. Instead, it was observed that a PCM with a melting temperature equal to 29 °C produces a worse energy performance due to the low frequency with which the material liquefaction occurs;
  • bio-PCM23 was also confirmed as the best choice by the analysis of the thermal energy coming into the internal environment in the winter and the autumn months, confirmed by the storage and the subsequent release of the latent energy that delays the indoor air temperature drop by limiting heating demands. Similarly, there is a noticeable reduction in the incoming thermal energy in the summer months due to the solar gain storage of latent energy, successively discharged outward by natural ventilation with favorable temperatures;
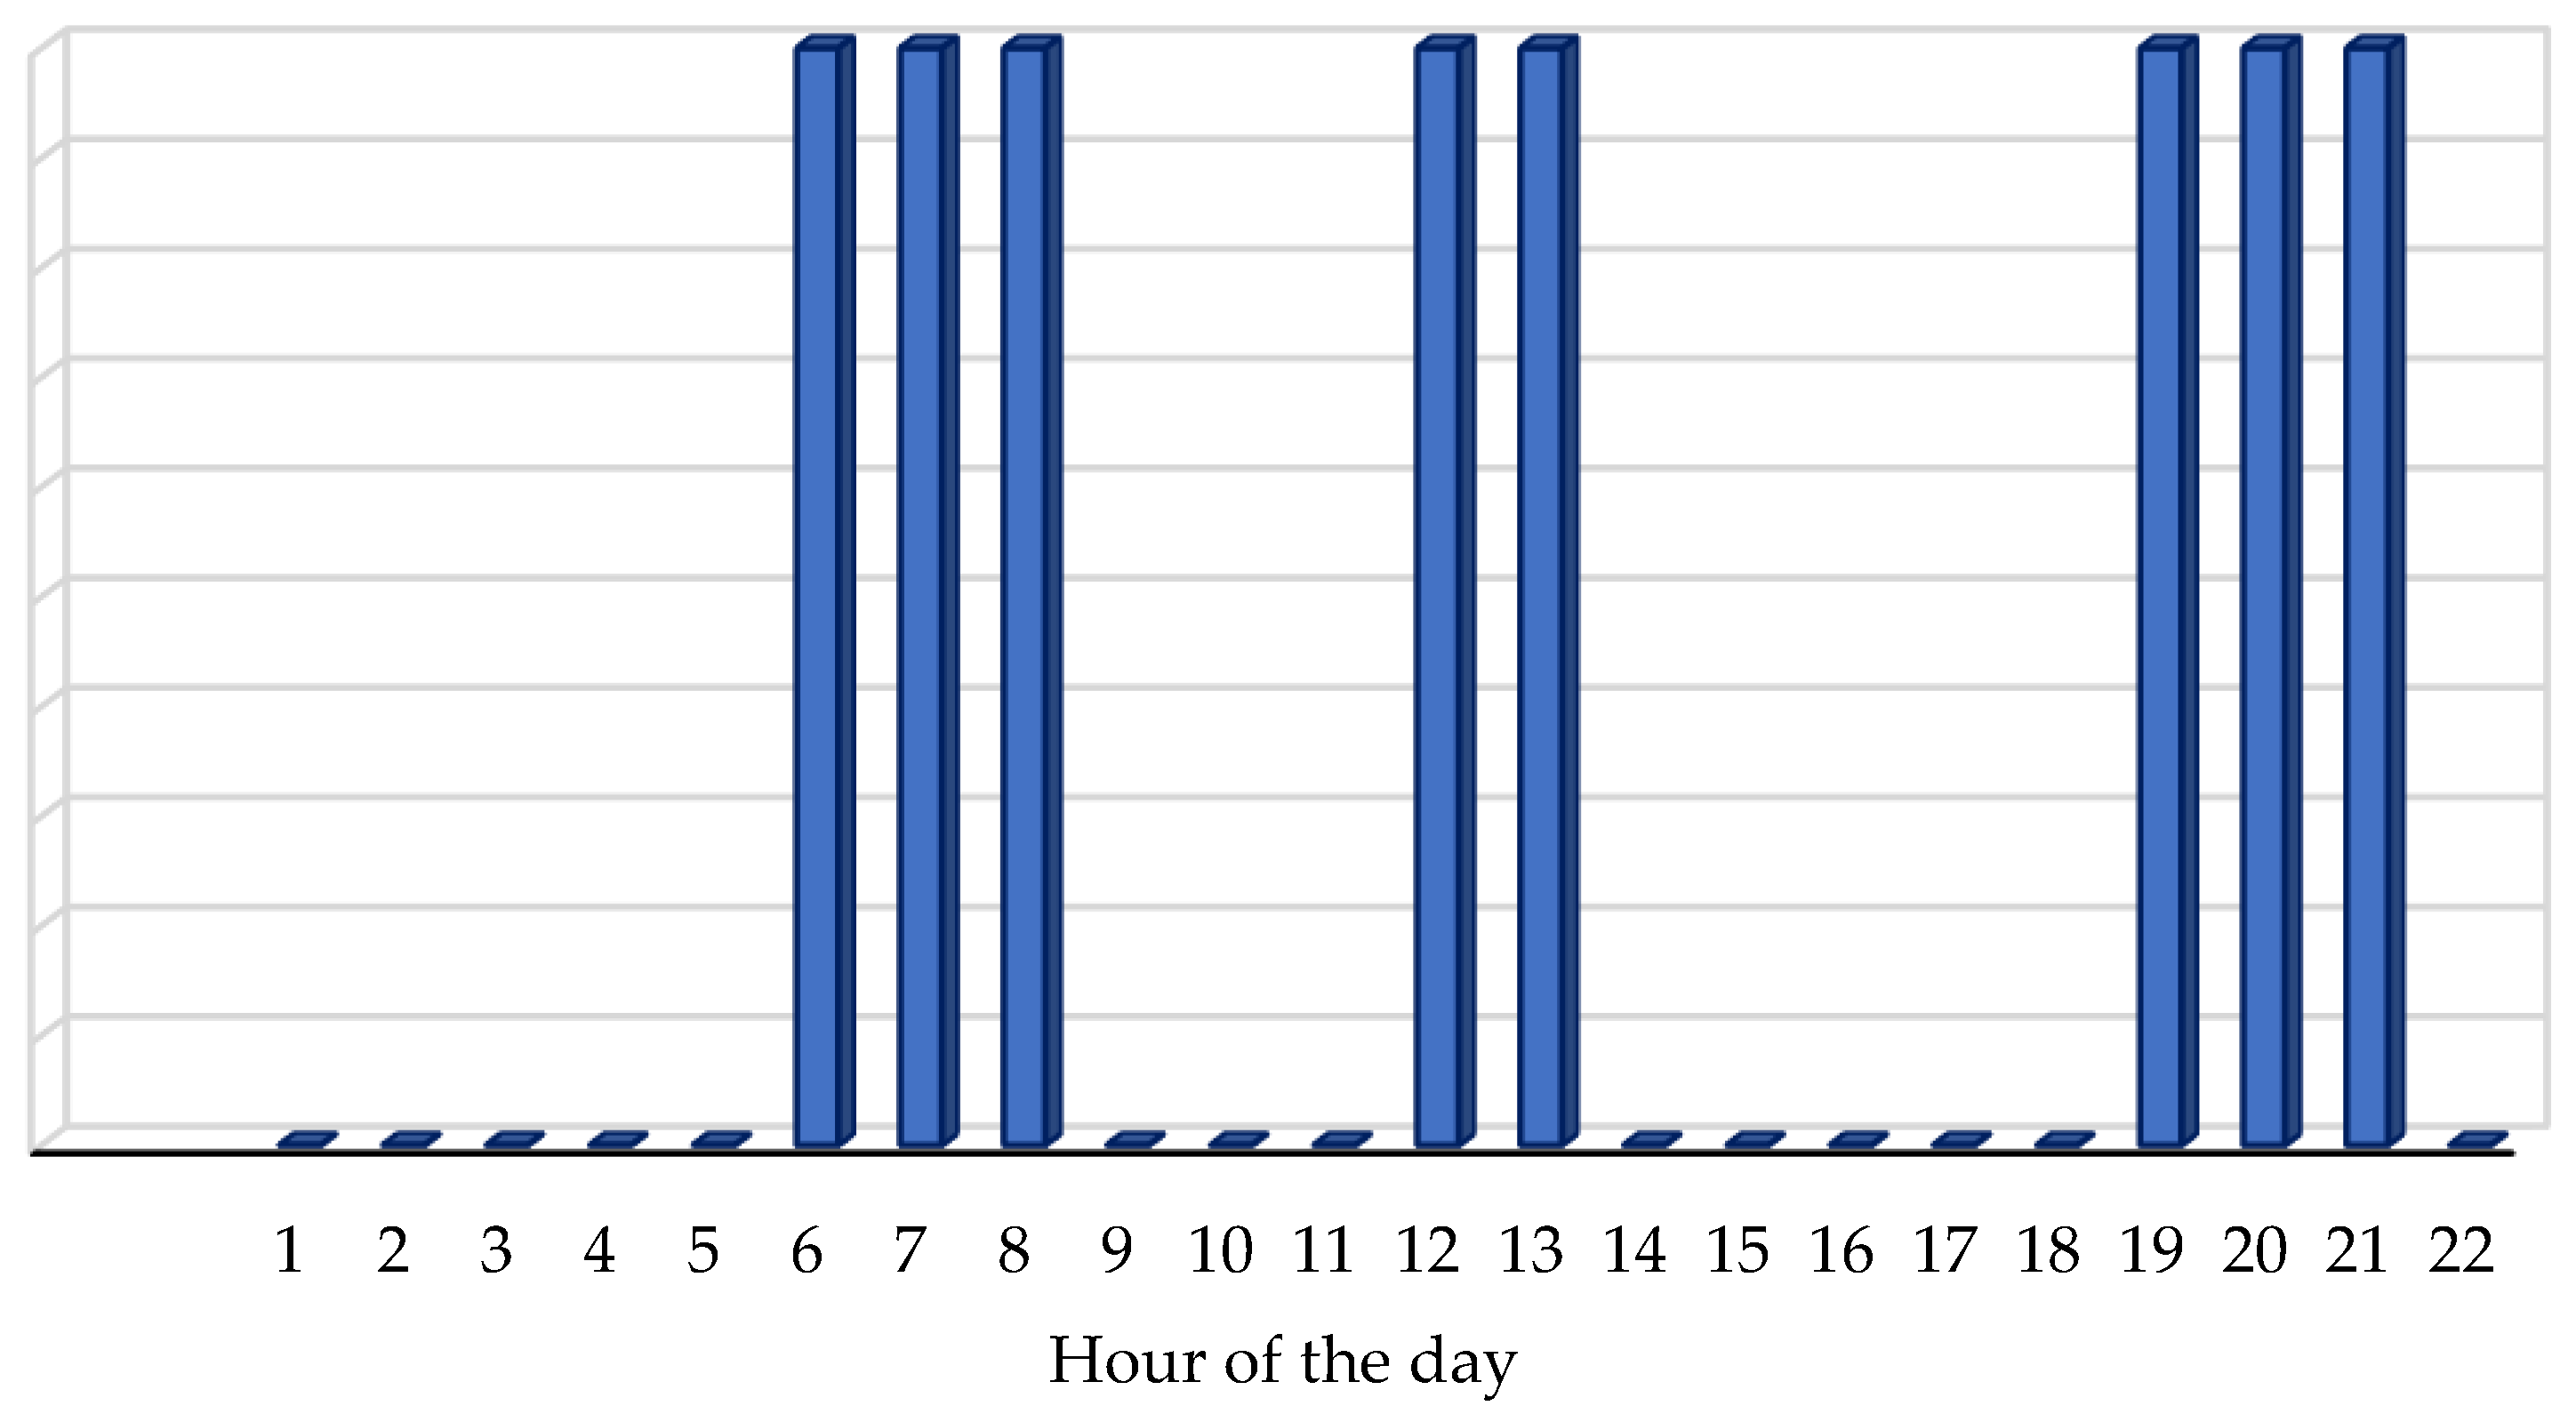
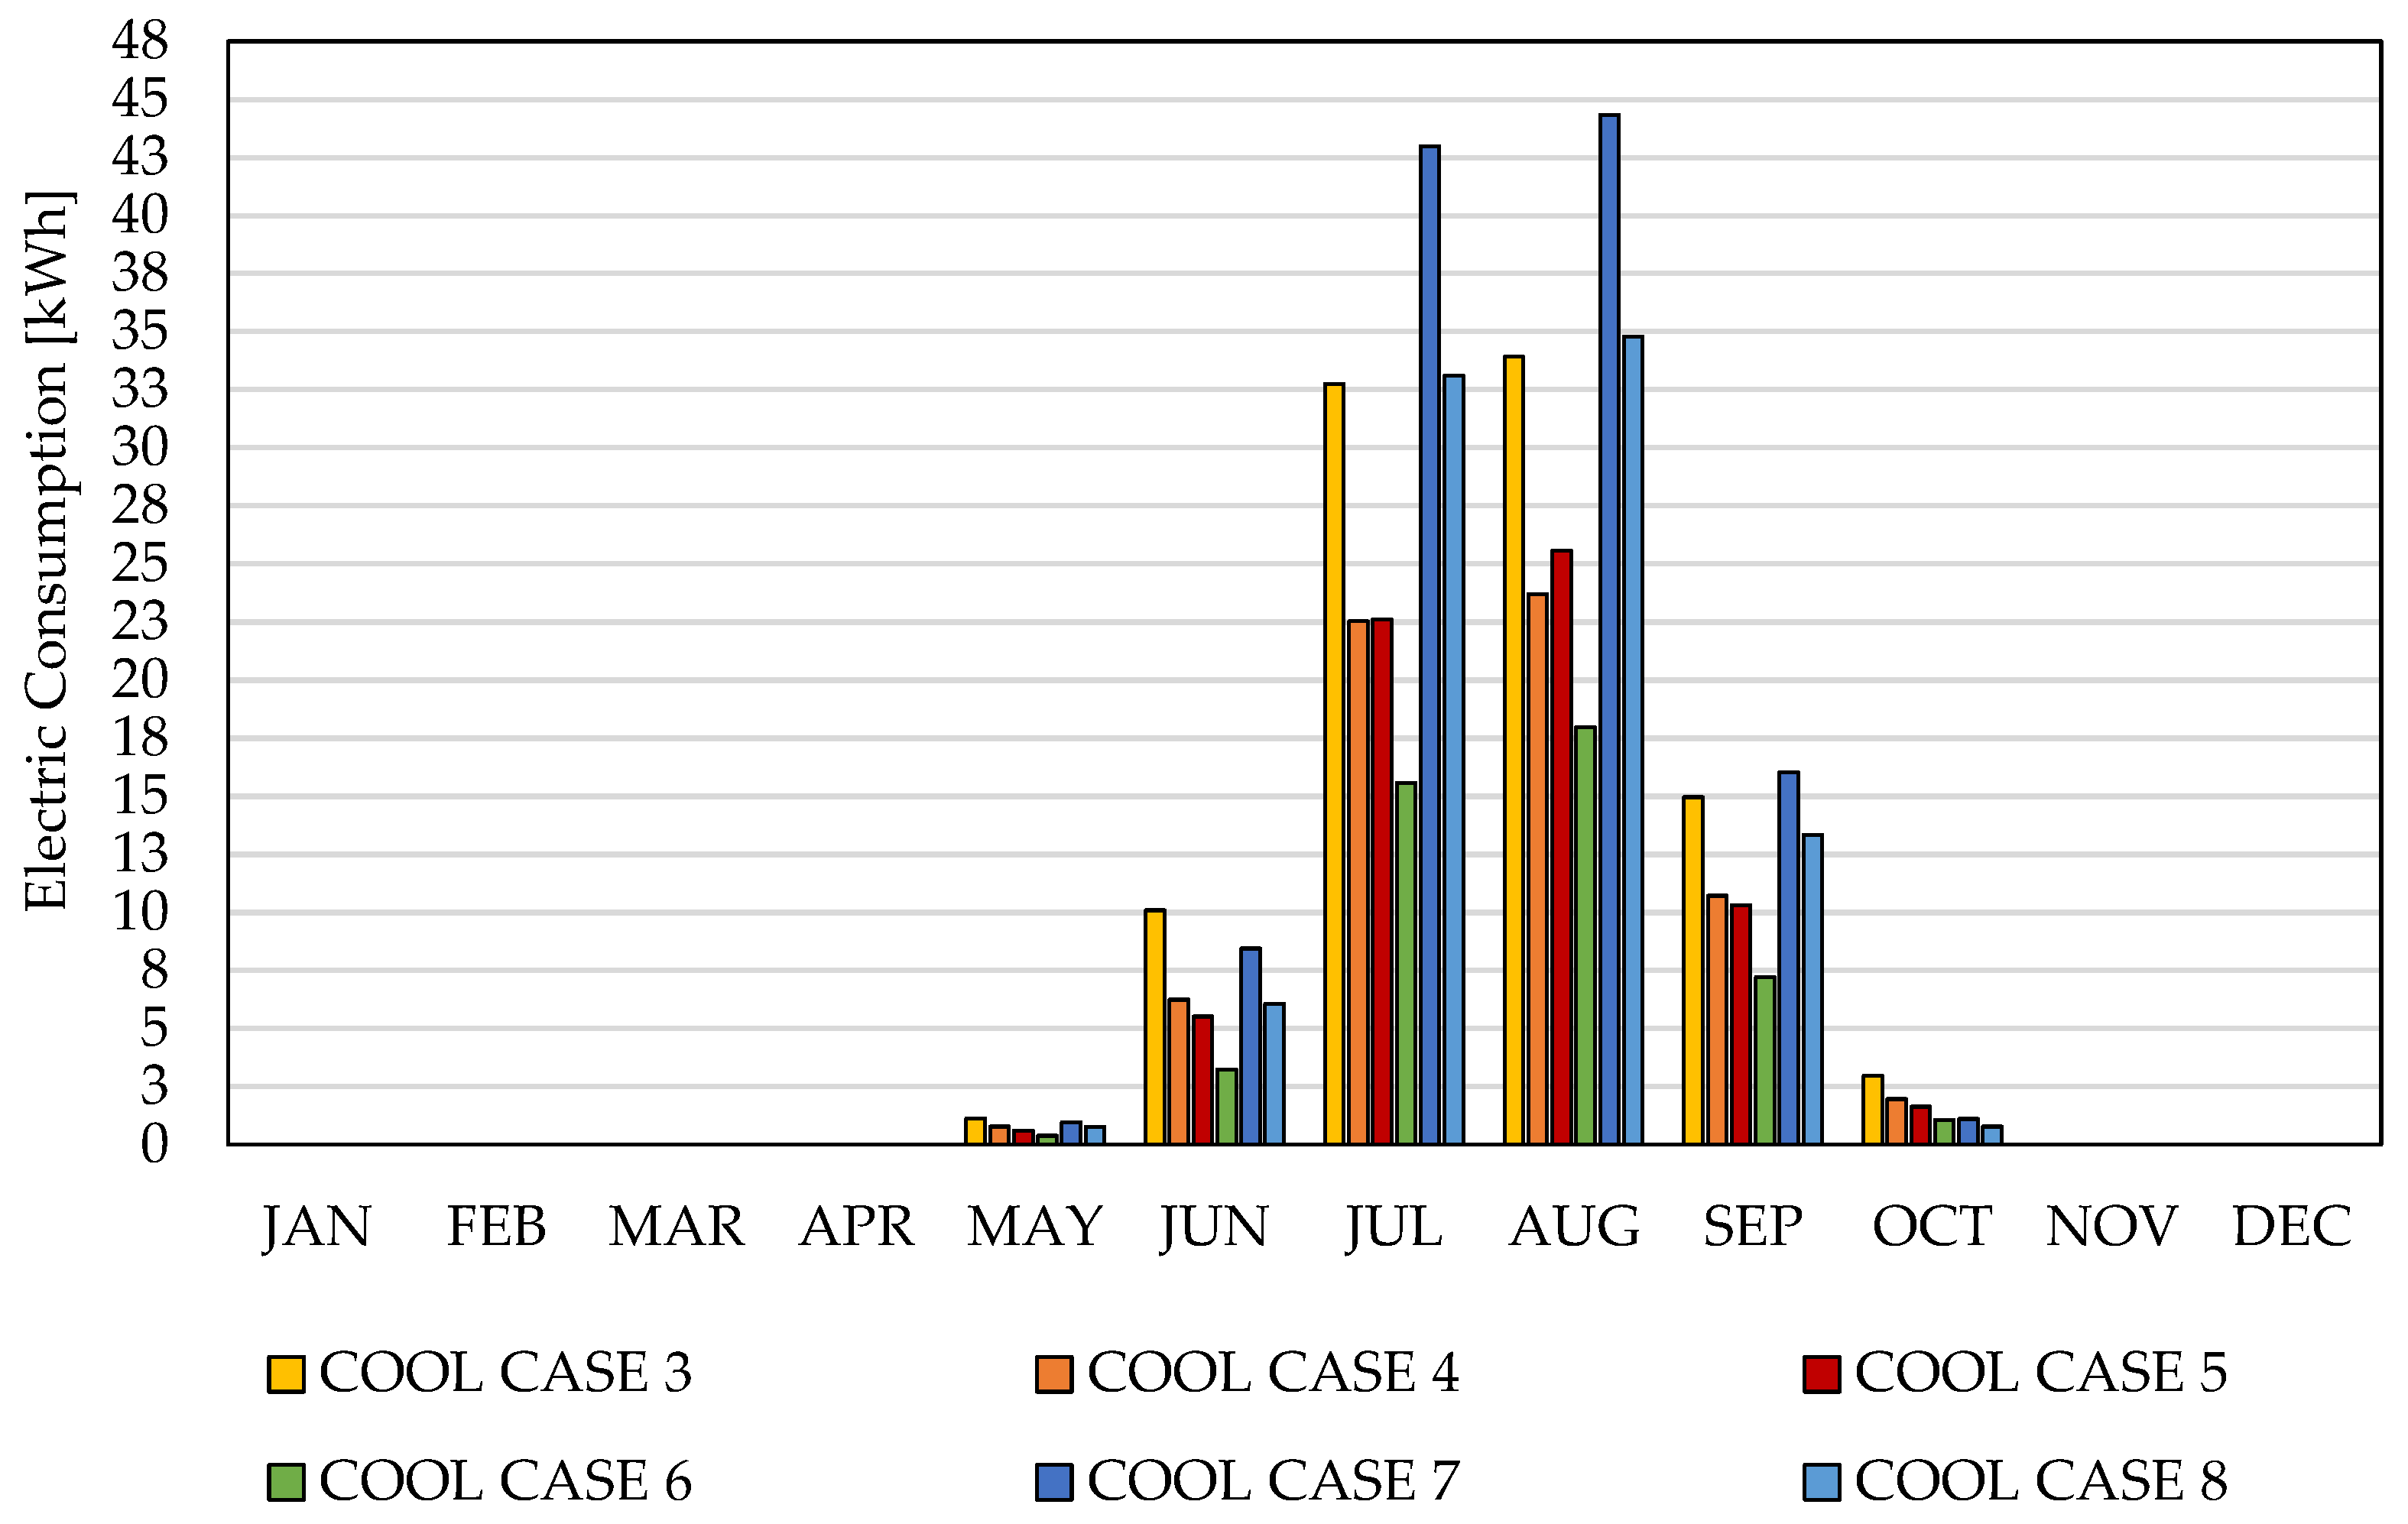
  • the electricity absorbed by the split system reduces with the scheduled operation without compromising the thermal comfort conditions excessively and, moreover, the intermittent functioning amplifies the PCM benefits due to better exploitation of the THU thermal inertia;
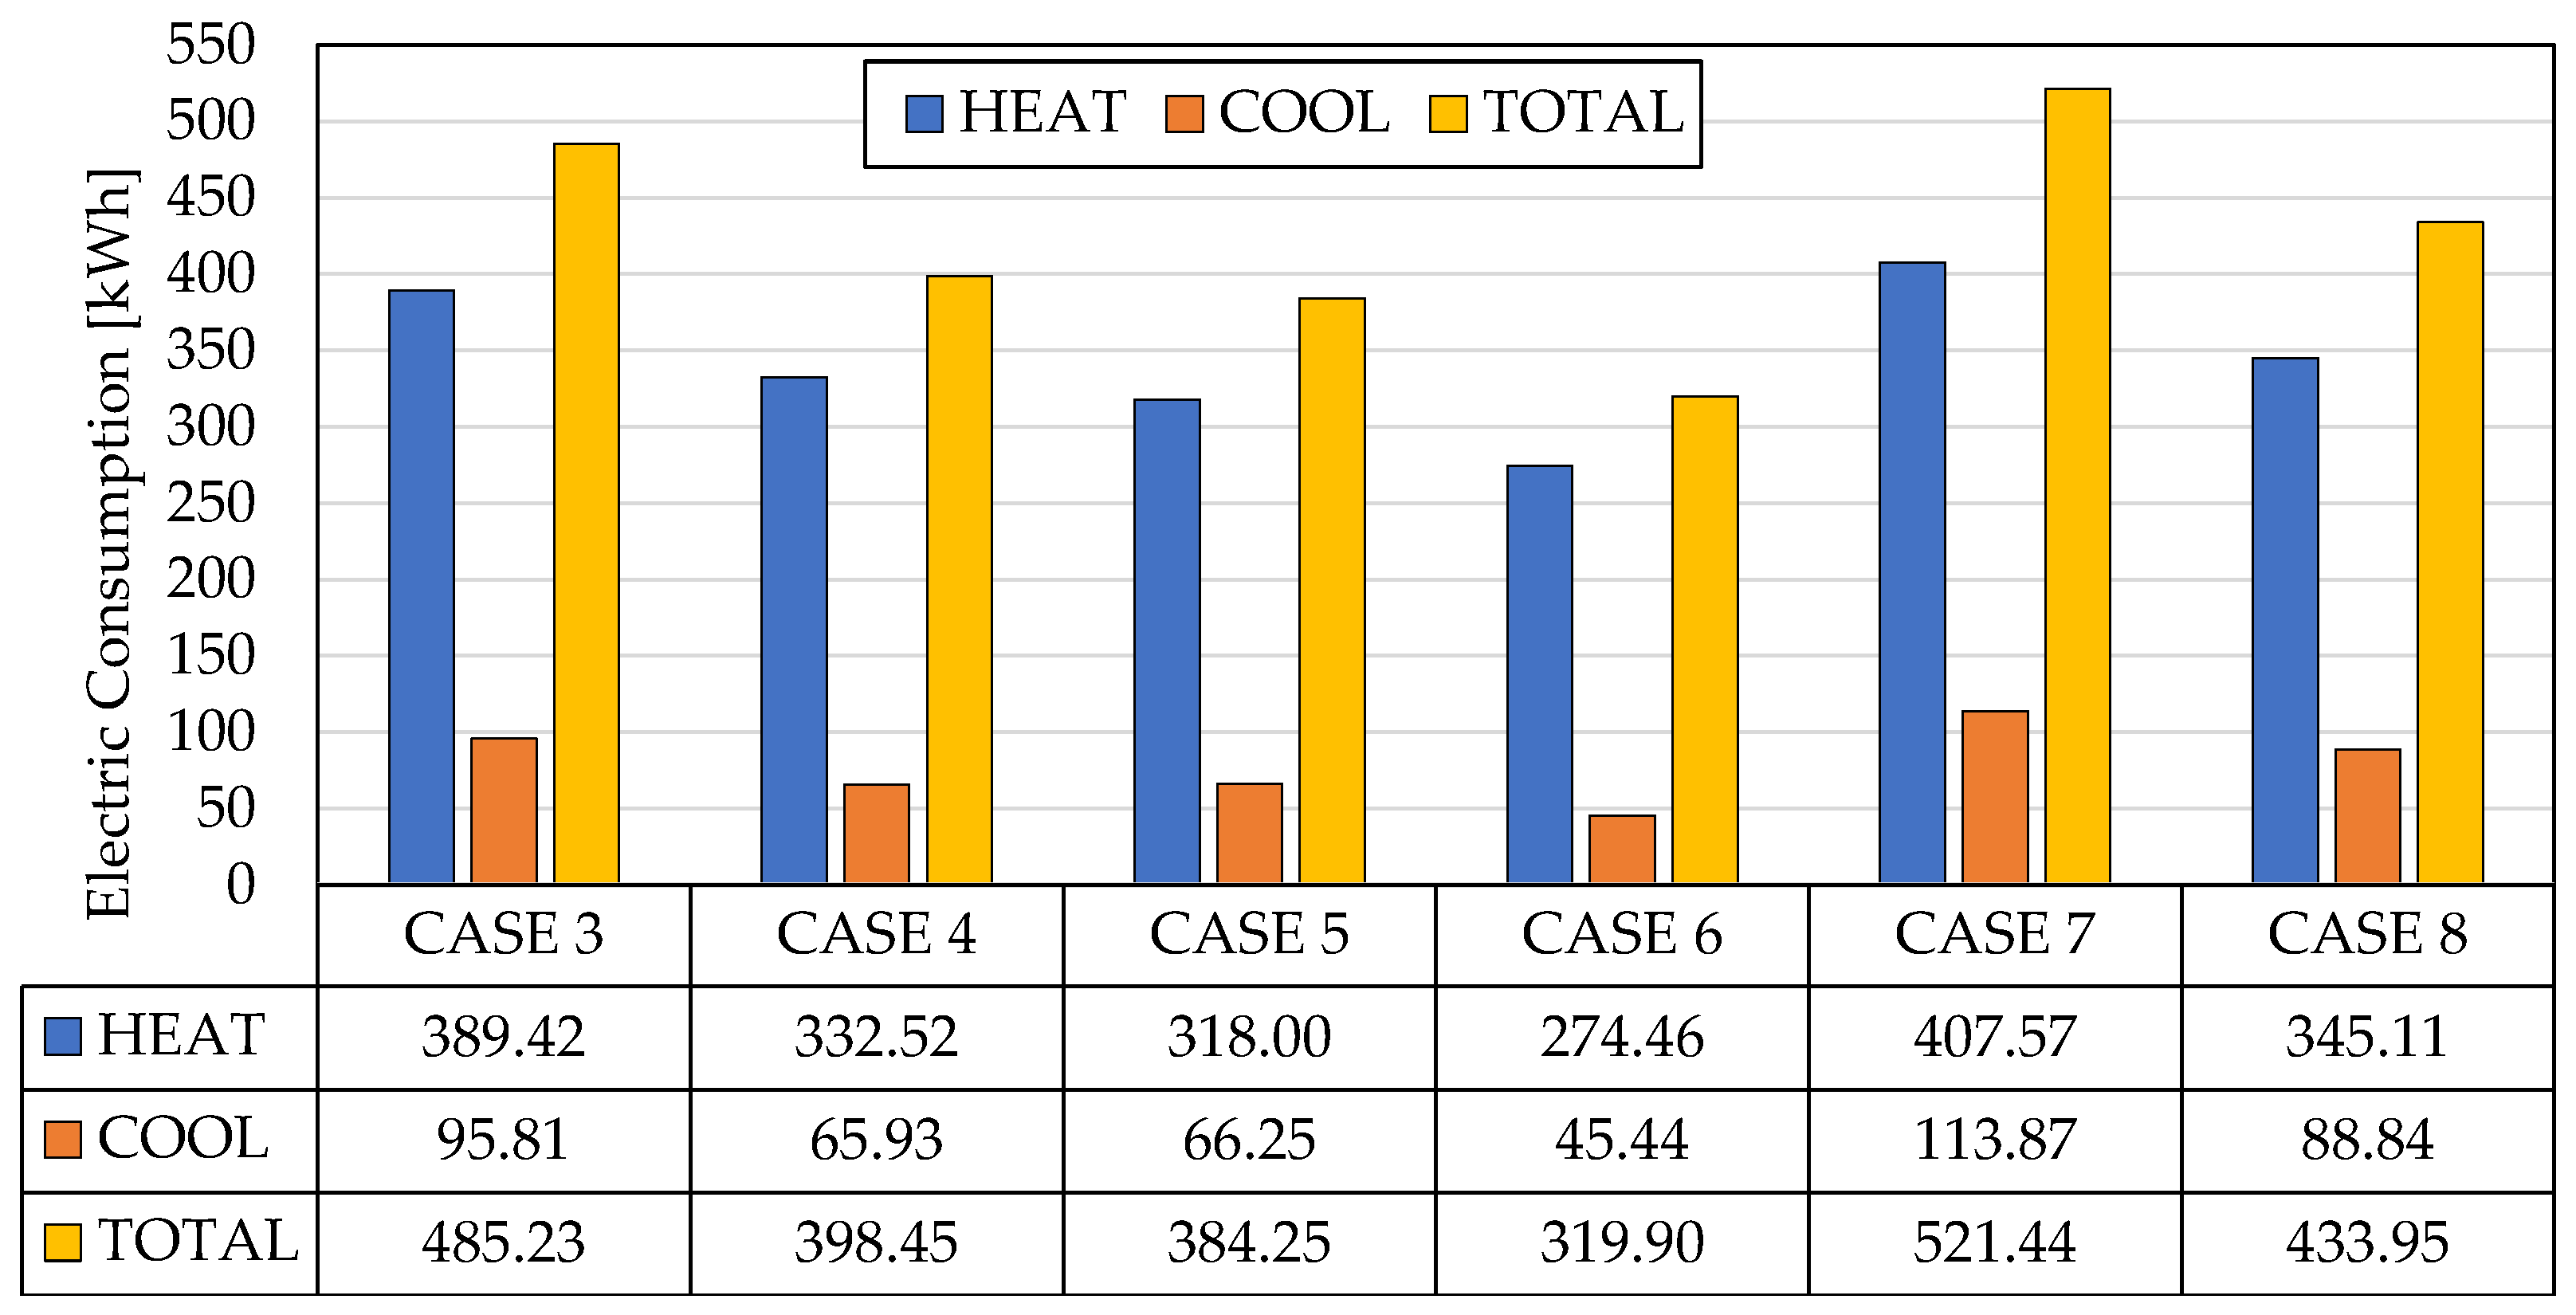
  • a monthly report on the electricity consumption among the considered cases has shown that a double layer of PCM23 reduces electric consumption, especially in summer, with savings ranging between 25% and 65%;
  • regarding a THU not equipped with PCM, a comparison of annual electricity consumption has highlighted that it is possible to achieve savings of about 7–8% when a single layer of PCM23 is adopted, and by approximately 26% by doubling the PCM23 quantity;
  • a double PCM23 layer, although it does not involve large variations in the hourly and monthly average internal air temperatures (there is a maximum variation of about 0.3 °C in the monthly average values), makes it possible to significantly reduce electricity consumption;
  • the use of a BIPV roof system combined with an electric storage system allows full satisfaction of the electricity consumption and leaves a certain safety margin to cover other electrical loads;
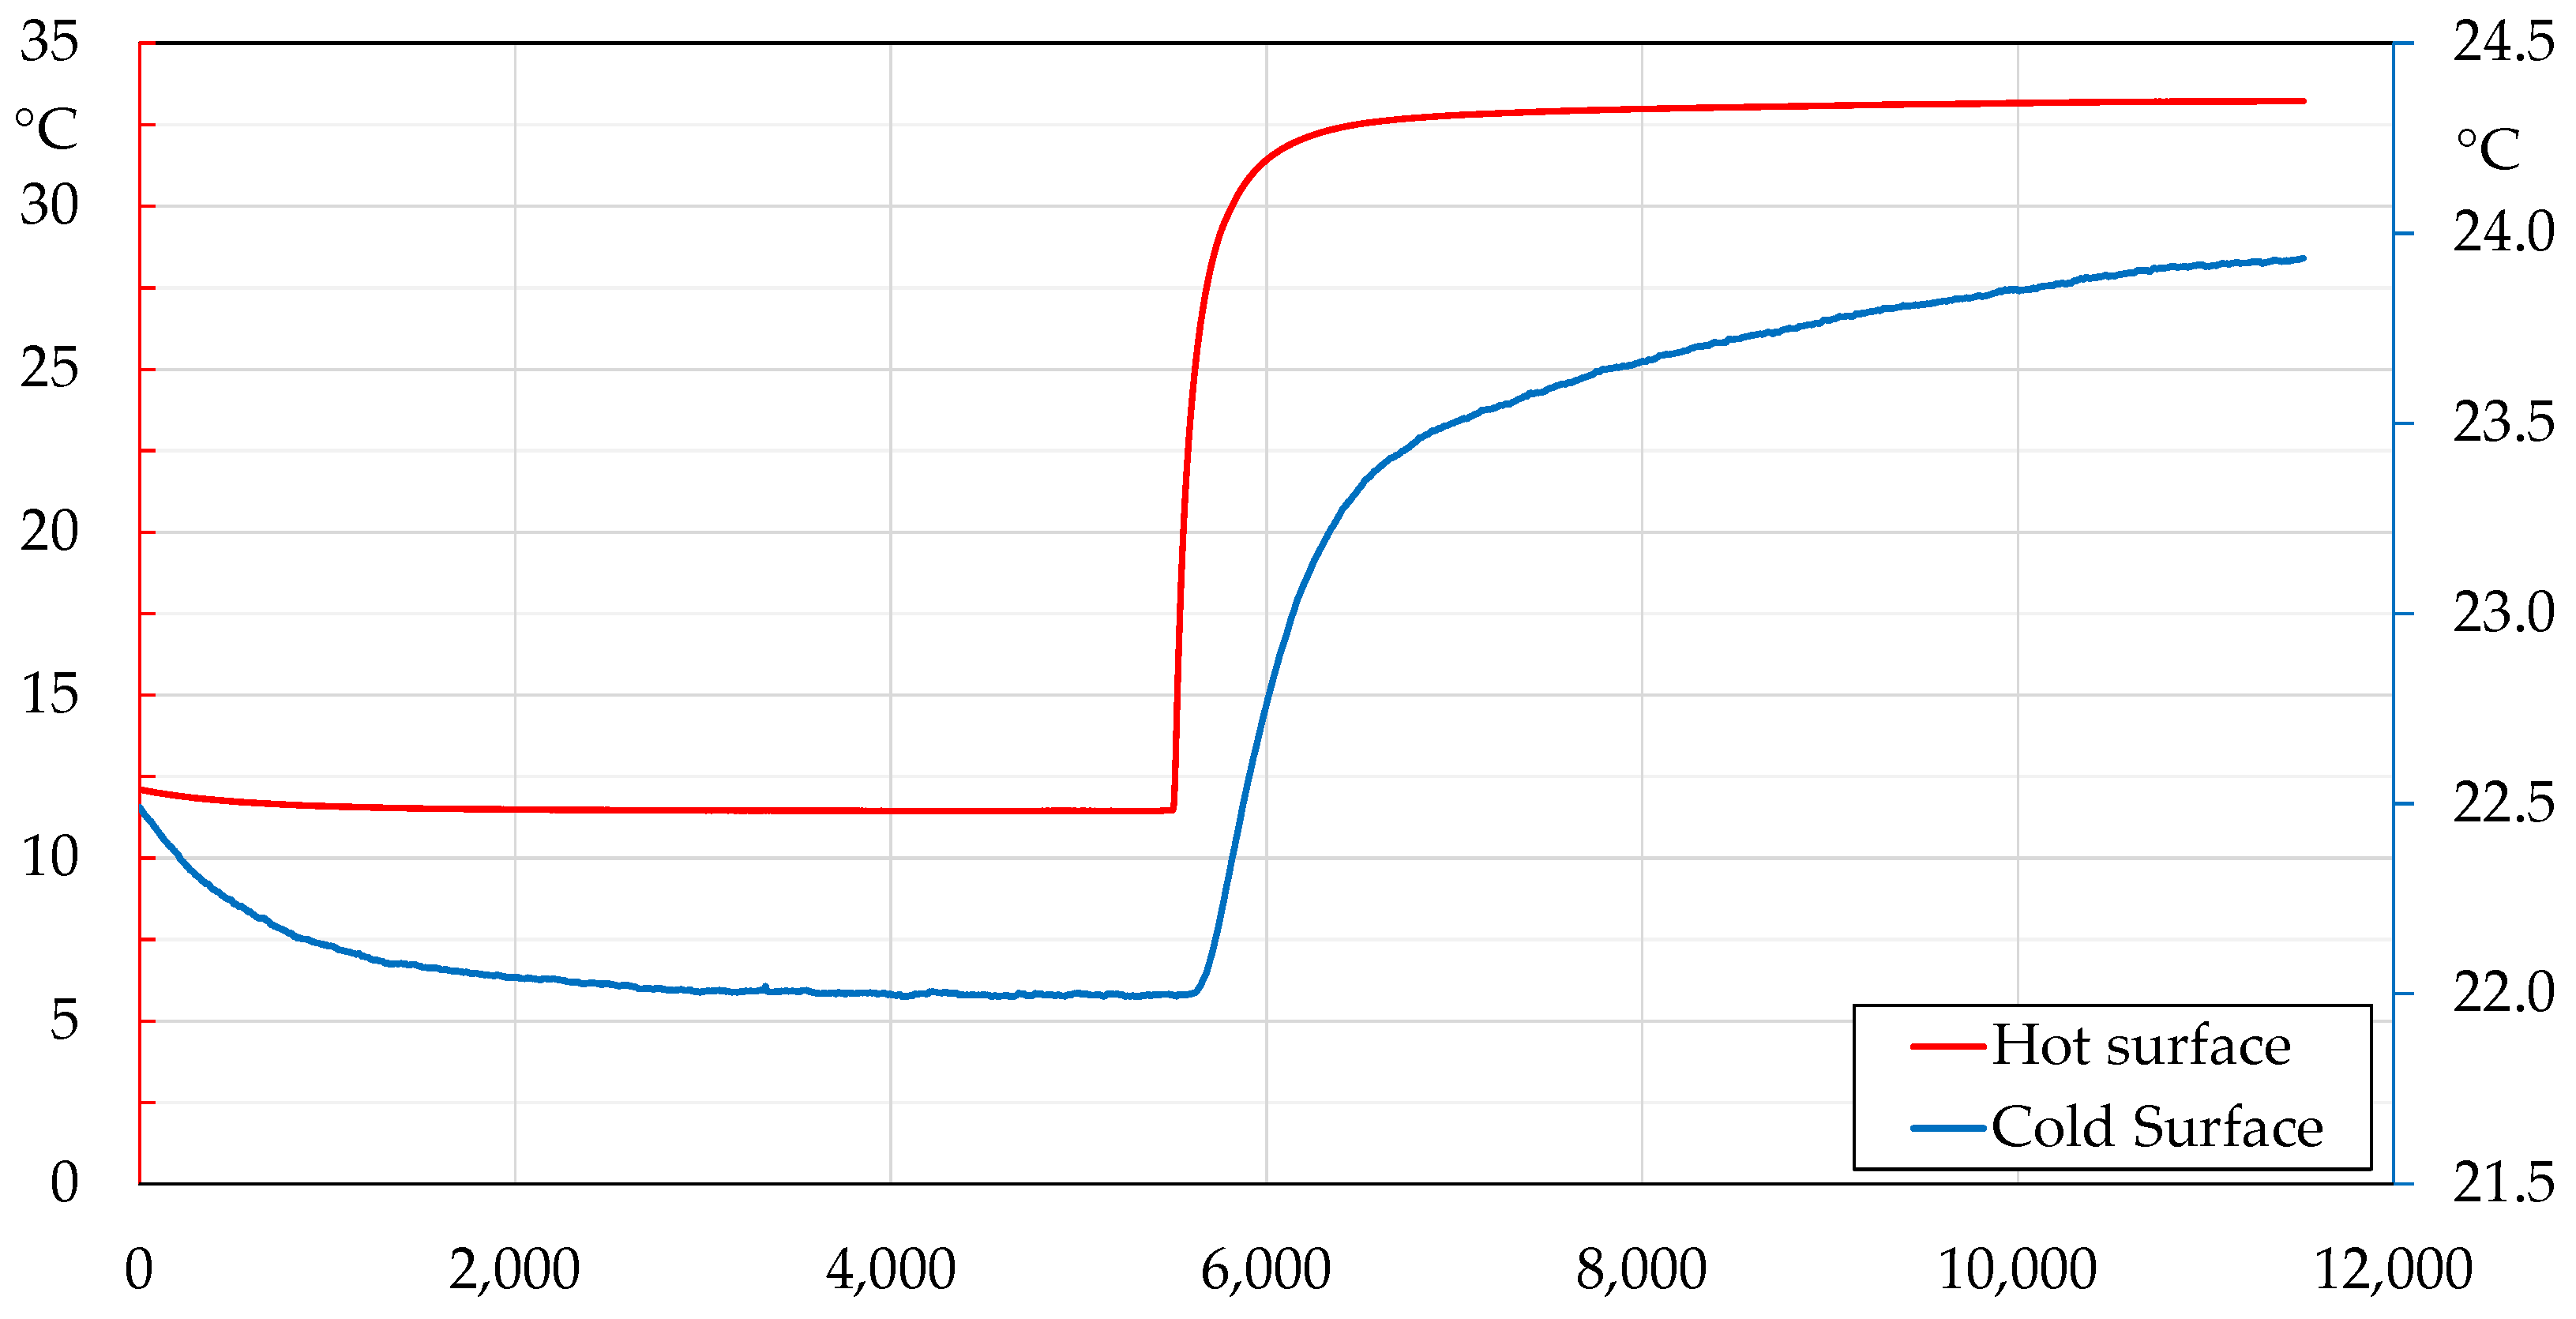
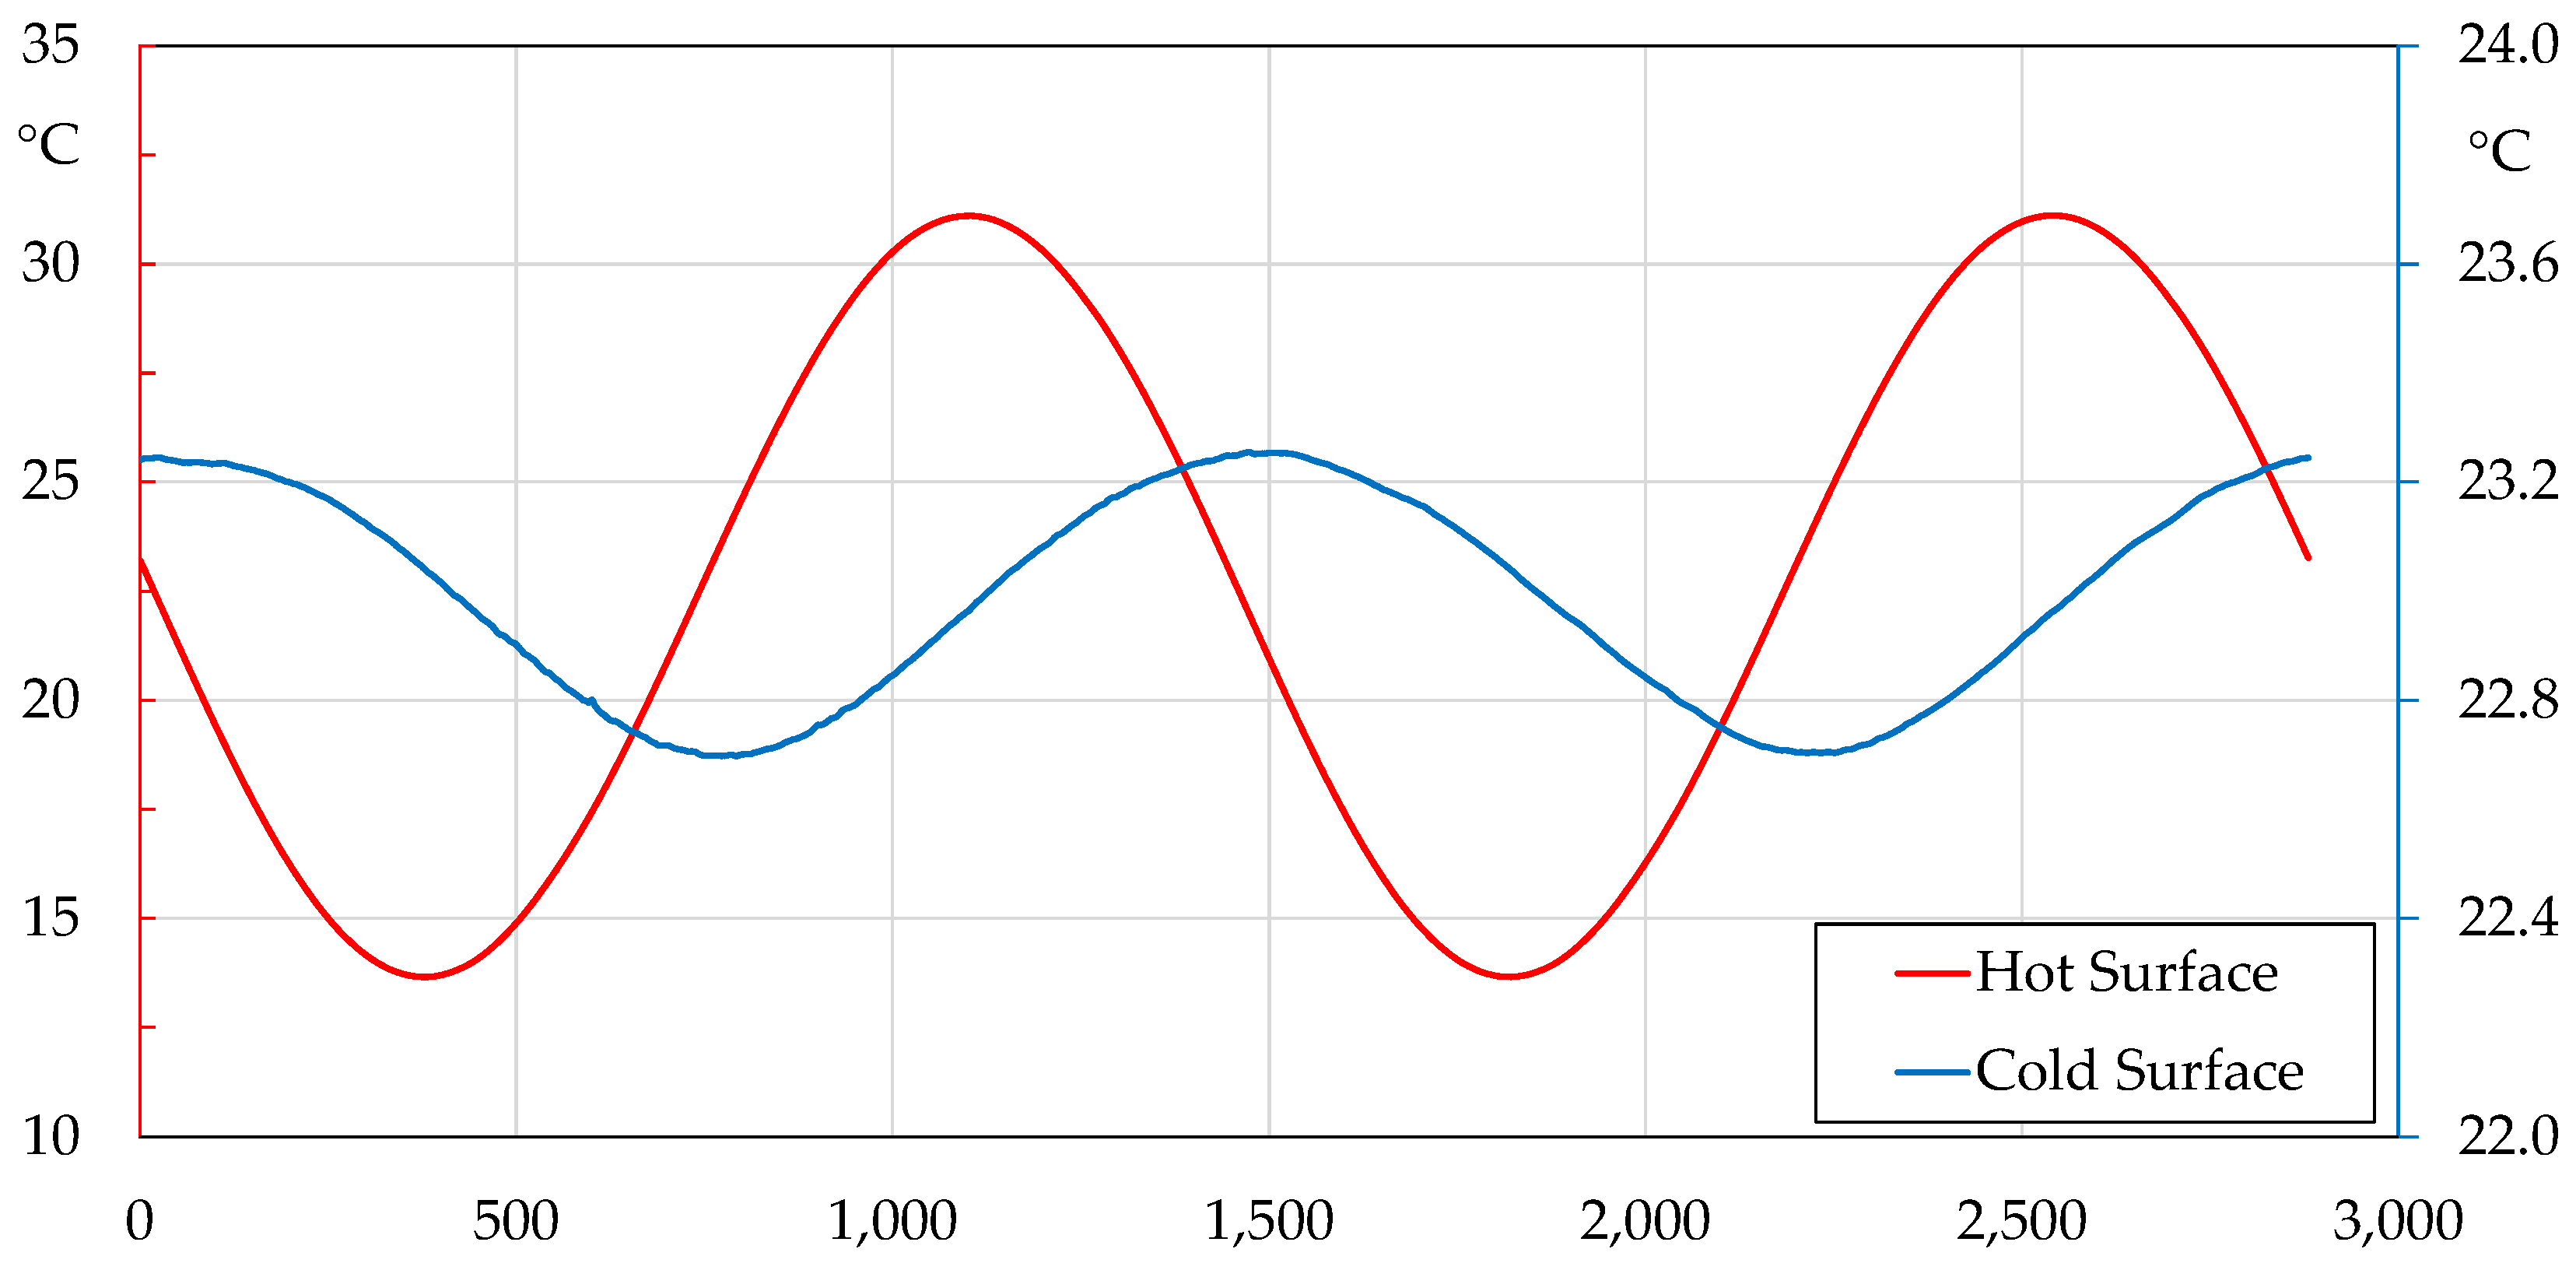
  • experimental tests on a SuberWall sample equipped with bio-PCM23 on the inner side carried out in a climatic chamber confirmed the beneficial effects of the material transition phase. By applying a temperature difference of 25 °C on the external hot side instantaneously, in 100 h the internal surface temperature did not reach a stabilized temperature trend. With a sinusoidal solicitation having an amplitude of 12.5 °C and an average value of 22.5 °C, the time shift was 6.7 h, the attenuation factor was 0.309 and the periodic thermal transmittance was 0.093 W/m2K. The latter value respects the current regulation constraint of, in new buildings, a value lower than the threshold of 0.10 W/m2K. Despite the PCM’s employment, the time shift is 6.7 h, confirming that a THU without PCM will be affected by sure and sudden indoor temperature oscillations.
This research has highlighted that lightweight solutions are preferred for the implementation of THUs, however, in warm climates, serious overheating issues could be incurred during summer. The employment of a suitable PCM with proper melting temperature, location in the building envelope and quantity allows for compensating for many issues related to building fabric with limited thermal mass. A future research path is the monitoring of an experimental set-up, that currently is in the assembling phase, to collect thermal fluxes and temperatures, and a detailed economic analysis targeted to identify the most profitable THU configuration taking into account initial and operative costs.

Author Contributions

Conceptualization, R.B.; data curation, R.B., P.B., A.R.; investigation, R.B., P.B., A.R.; methodology, F.B. and N.A.; software, P.B and A.R.; supervision, F.B. and N.A.; review and editing, R.B. and A.R.; writing—original draft, R.B. and A.R. All authors have read and agreed to the published version of the manuscript.

Funding

The research was funded by the project Proof of Concept 01_00052 included in the MIUR-PNR 2015–2020.

Informed Consent Statement

Not applicable.

Data Availability Statement

Not applicable.

Conflicts of Interest

The authors declare no conflict of interest.

References

  1. Algieri, A.; Morrone, P.; Perrone, D.; Bova, S.; Castiglione, T. Analysis of multi-source energy system for small-scale domestic applications. Integration of biodiesel, solar and wind energy. Energy Rep. 2020, 6, 652–659. [Google Scholar] [CrossRef]
  2. Ayarkwa, J.; Joe Opoku, D.G.; Antwi-Afari, P.; Man Li, R.Y. Sustainable building processes’ challenges and strategies: The relative important index approach. Clean. Eng. Technol. 2022, 7, 100455. [Google Scholar] [CrossRef]
  3. IEA. IEA Tracking Buildings 2020; IEA: Paris, France, 2020. [Google Scholar]
  4. Ochab, P.; Kokoszka, W.; Kogut, J.; Skrzypczak, I.; Szyszka, J.; Starakiewicz, A. Passive Residential Houses with the Accumulation Properties of Ground as a Heat Storage Medium. In Proceedings of the IOP Conference Series: Earth and Environmental Science, Shanghai, China, 19–22 October 2017. [Google Scholar]
  5. Chayaamor-Heil, N.; Hannachi-Belkadi, N. Towards a platform of investigative tools for biomimicry as a new approach for energy-efficient building design. Buildings 2017, 7, 19. [Google Scholar] [CrossRef] [Green Version]
  6. Telichenko, V.; Benuzh, A.; Eames, G.; Orenburova, E.; Shushunova, N. Development of Green Standards for Construction in Russia. Procedia Eng. 2016, 153, 726–730. [Google Scholar] [CrossRef] [Green Version]
  7. Bruno, R.; Arcuri, N.; Carpino, C. Study of innovative solutions of the building envelope for passive houses in Mediterranean areas. Energy Procedia 2017, 140, 80–92. [Google Scholar] [CrossRef]
  8. Bruno, R.; Arcuri, N.; Carpino, C. The passive house in Mediterranean area: Parametric analysis and dynamic simulation of the thermal behavior of an innovative prototype. Energy Procedia 2015, 82, 533–539. [Google Scholar] [CrossRef] [Green Version]
  9. Eurostat: Migration Data Portal; EAS Office. Annual Report on 2021 European Migrant Fluxes; 2021; ISBN 9789294650535. Available online: https://ec.europa.eu/eurostat/statistics-explained/index.php?title=Migration_and_migrant_population_statistics (accessed on 19 March 2022).
  10. Commission, E. Potential Ukrainian Refugee Crisis: European Parliamentary Question. Available online: https://www.europarl.europa.eu/doceo/document/E-9-2022-000368_EN.pdf (accessed on 19 March 2022).
  11. Fekete, A.; Bross, L.; Krause, S.; Neisser, F.; Tzavella, K. Bridging gaps in minimum humanitarian standards and shelter planning by critical infrastructures. Sustainability 2021, 13, 849. [Google Scholar] [CrossRef]
  12. Available online: https://www.sustanzeb.org/ (accessed on 19 March 2022).
  13. Barreca, F.; Arcuri, N.; Cardinali, G.D.; Di Fazio, S. A bio-based render for insulating agglomerated cork panels. Coatings 2021, 11, 1478. [Google Scholar] [CrossRef]
  14. Bruno, R.; Bevilacqua, P.; Arcuri, N. Assessing cooling energy demands with the EN ISO 52016-1 quasi-steady approach in the Mediterranean area. J. Build. Eng. 2019, 24, 100740. [Google Scholar] [CrossRef]
  15. Marino, C.; Nucara, A.; Panzera, M.F.; Pietrafesa, M. Towards the nearly zero and the plus energy building: Primary energy balances and economic evaluations. Therm. Sci. Eng. Prog. 2019, 13, 100400. [Google Scholar] [CrossRef]
  16. Čekon, M.; Plášek, J.; Slávik, R.; Fečer, T.; Juráś, P. An Experimental and Numerical Model of a Solar Facade Prototype with Transparent Insulation and Selective Absorber. In Proceedings of the SimBuild, Building Performance Analysis Conference, Chicago, IL, USA, 26–28 September 2018. [Google Scholar]
  17. Carpino, C.; Bruno, R.; Bevilacqua, P.; Arcuri, N. Are ICFs Suitable Building Envelope Solutions for Mediterranean Climatic Conditions? A Critical Analysis Concerning Thermal Properties and Annual Energy Performances. In Proceedings of the Building Simulation 2019: 16th Conference of IBPSA, Rome, Italy, 2–4 September 2020; Volume 16, pp. 480–487. [Google Scholar]
  18. Detommaso, M.; Evola, G.; Gagliano, A.; Marletta, L.; Nocera, F. Thermal performance of innovative building envelope systems in mediterranean climate. Build. Simul. Appl. 2017, 77–85. Available online: https://www.google.com.hk/url?sa=t&rct=j&q=&esrc=s&source=web&cd=&cad=rja&uact=8&ved=2ahUKEwiy2t3O1bb3AhXrgv0HHUTcCLUQFnoECA4QAQ&url=http%3A%2F%2Fwww.ibpsa.org%2Fproceedings%2FBSA2017%2F9788860461360_10.pdf&usg=AOvVaw0okhvCVz-47kbtvGy53qju (accessed on 19 March 2022).
  19. Barreca, F.; Cardinali, G.D.; Fichera, C.R.; Praticò, P. Utilization of cork residues for high performance walls in green buildings. Agric. Eng. Int. CIGR J. 2018, 20, 47–55. [Google Scholar]
  20. Faraj, K.; Khaled, M.; Faraj, J.; Hachem, F.; Castelain, C. A Summary Review on Experimental Studies for PCM Building Applications: Towards Advanced Modular Prototype. Energies 2022, 15, 1459. [Google Scholar] [CrossRef]
  21. Dash, S.P.; Pati, D.J.; Mohamed, Z.S.; Ramesh, S. To study the material feasibility and propose design prototype for temporary housing structures for emergency relief. Mater. Today Proc. 2021. [Google Scholar] [CrossRef]
  22. Seike, T.; Isobe, T.; Hosaka, Y.; Kim, Y.; Watanabe, S.; Shimura, M. Design and supply system for emergency temporary housing by various construction methods from the perspective of environmental impact assessment: The case for the Great East Japan earthquake. Energy Build. 2019, 203, 109425. [Google Scholar] [CrossRef]
  23. Seike, T.; Kim, Y.; Hosaka, Y.; Ida, S.; Masuda, T. Intraregional reuse of emergency temporary housing in Japan. Sustain. Cities Soc. 2018, 42, 650–662. [Google Scholar] [CrossRef]
  24. Hosseini, S.M.A.; Farahzadi, L.; Pons, O. Assessing the sustainability index of different post-disaster temporary housing unit configuration types. J. Build. Eng. 2021, 42, 102806. [Google Scholar] [CrossRef]
  25. Asfour, O.S. Learning from the past: Temporary housing criteria in conflict areas with reference to thermal comfort. Int. J. Disaster Risk Reduct. 2019, 38, 101206. [Google Scholar] [CrossRef]
  26. Hosseini, S.M.A.; Yazdani, R.; Fuente, A. de la Multi-objective interior design optimization method based on sustainability concepts for post-disaster temporary housing units. Build. Environ. 2020, 173, 106742. [Google Scholar] [CrossRef]
  27. Amin Hosseini, S.M.; De La Fuente, A.; Pons, O. Multi-criteria decision-making method for assessing the sustainability of post-disaster temporary housing units technologies: A case study in Bam, 2003. Sustain. Cities Soc. 2016, 20, 38–51. [Google Scholar] [CrossRef]
  28. D’Orazio, M.; Maracchini, G. An experimental investigation on the indoor hygrothermal environment of a reinforced-EPS based temporary housing solution. Energy Build. 2019, 204, 109500. [Google Scholar] [CrossRef]
  29. Cork in the Building Sector: New Possible Scenarios in Sardinia. Available online: https://www.teknoring.com/news/materiali-da-costruzione/sughero-espanso-caratteristiche-e-utilizzi/ (accessed on 19 March 2022).
  30. Novais, R.M.; Carvalheiras, J.; Senff, L.; Lacasta, A.M.; Cantalapiedra, I.R.; Giro-Paloma, J.; Seabra, M.P.; Labrincha, J.A. Multifunctional cork—Alkali-activated fly ash composites: A sustainable material to enhance buildings’ energy and acoustic performance. Energy Build. 2020, 210, 109739. [Google Scholar] [CrossRef] [Green Version]
  31. Merabti, S.; Kenai, S.; Belarbi, R.; Khatib, J. Thermo-mechanical and physical properties of waste granular cork composite with slag cement. Constr. Build. Mater. 2021, 272, 121923. [Google Scholar] [CrossRef]
  32. Chanut, J.; Wang, Y.; Dal Cin, I.; Ferret, E.; Gougeon, R.D.; Bellat, J.P.; Karbowiak, T. Surface properties of cork: Is cork a hydrophobic material? J. Colloid Interface Sci. 2022, 608, 416–423. [Google Scholar] [CrossRef] [PubMed]
  33. Cork in Buildings: Properties. Available online: https://www.teknoring.com/news/materiali-da-costruzione/sughero-espanso-caratteristiche-e-utilizzi/ (accessed on 19 March 2022).
  34. Barreca, F. Demountable Building Module Consisting of a Structure Modular Bearing and Cladding in Modular Multilayer Panels in Agglomerated Cork 20196. Available online: https://www.knowledge-share.eu/en/patent/removable-building-module-consisting-of-a-modular-supporting-structure/ (accessed on 19 March 2022).
  35. Evola, G.; Marletta, L. The Solar Response Factor to calculate the cooling load induced by solar gains. Appl. Energy 2015, 160, 431–441. [Google Scholar] [CrossRef]
  36. Italian interministerial decree 26th June 2015: Application of calculation methods for energy performance and definition of minimum building requirements. Off. Gazzette Ital. Repub. 2015, 1–8. Available online: https://www.mise.gov.it/images/stories/normativa/DM_requisiti_minimi.pdf (accessed on 19 March 2022).
  37. Peel, M.C.; Finlayson, B.L.; McMahon, T.A. Updated world map of the Köppen-Geiger climate classification. Hydrol. Earth Syst. Sci. 2007, 11, 1633–1644. [Google Scholar] [CrossRef] [Green Version]
  38. UNI 10349-3; Heating and Cooling of Buildings—Climatic Data Part 3—Accumulated Temperature Differences (Degree-Days) and other Indices. Italian Unification Institution: Roman, Italy, 2016.
  39. Wang, X.; Li, W.; Luo, Z.; Wang, K.; Shah, S.P. A critical review on phase change materials (PCM) for sustainable and energy efficient building: Design, characteristic, performance and application. Energy Build. 2022, 260, 111923. [Google Scholar] [CrossRef]
  40. Boussaba, L.; Lefebvre, G.; Makhlouf, S.; Grados, A.; Royon, L. Investigation and properties of a novel composite bio-PCM to reduce summer energy consumptions in buildings of hot and dry climates. Sol. Energy 2021, 214, 119–130. [Google Scholar] [CrossRef]
  41. DesignBuilder Software Ltd. User Manual of the Software; Version 6; Design Builder: Trieste, Italy, 2018. [Google Scholar]
  42. UNI/TS 11300–1; Building Energy Performance—Part 1: Evaluation of the Energy Need for Space Heating and Cooling. 2014; (In Italian). Available online: https://global.ihs.com/doc_detail.cfm?document_name=UNI%2FTS%2011300%2D1&item_s_key=00648079 (accessed on 19 March 2022).
  43. CEN EN 12831-1:2017; Energy Performance of Buildings—Method for Calculation of the Design Heat Load—Part 1: Space Heating Load. Comite Europeen de Normalisation: Brussels, Belgium, 2017.
  44. Italian Republic. Italian Decree 412/93 on Regulations for the Design, Installation, Operation and Maintenance of the Heating Systems of the Buildings for the Purpose of Containing Energy Consumption. 1993. Available online: https://www.gazzettaufficiale.it/eli/id/1993/10/14/093G0451/sg (accessed on 19 March 2022).
  45. Bać, A.; Nemś, M.; Nemś, A.; Kasperski, J. Sustainable integration of a solar heating system into a single-family house in the climate of Central Europe—A case study. Sustainability 2019, 11, 4167. [Google Scholar] [CrossRef] [Green Version]
  46. Malara, A.; Marino, C.; Nucara, A.; Pietrafesa, M.; Scopelliti, F.; Streva, G. Energetic and economic analysis of shading effects on PV panels energy production. Int. J. Heat Technol. 2016, 34, 465–472. [Google Scholar] [CrossRef]
  47. Bevilacqua, P.; Perrella, S.; Cirone, D.; Bruno, R.; Arcuri, N. Efficiency improvement of photovoltaic modules via back surface cooling. Energies 2021, 14, 895. [Google Scholar] [CrossRef]
  48. Bruno, R.; Bevilacqua, P.; Cuconati, G.; Arcuri, N. An innovative compact facility for the measurement of the thermal properties of building materials: First experimental results. Appl. Therm. Eng. 2018, 143, 947–954. [Google Scholar] [CrossRef]
  49. EN ISO 13786; Thermal Performance of Building Components—Dynamic Thermal Characteristics—Calculation Methods. European Committee for Standardisation: Brussels, Belgium, 2018. Available online: https://www.en-standard.eu/iso-13786-thermal-performance-of-building-components-dynamic-thermal-characteristics-calculation-methods/ (accessed on 19 March 2022).
Figure 1. The stratigraphy of the SuberWall panel (a). Front view of the module (b). Front view of the module without the covering cork layer (c). Disassembled materials (d).
Energies 15 03243 g001
Figure 2. Modular element of the proposed THU: support frame (a). Assembled module “M” (b). Junction section (c).
Energies 15 03243 g002
Figure 3. Plan layout of the basic Sustanzeb module (a). A 3D view of the basic Sustanzeb module (b).
Energies 15 03243 g003
Figure 4. Floor stratigraphy in the basic THU configuration (1: OSB; 2: cork).
Energies 15 03243 g004
Figure 5. Configuration of the SuberWall panel with a single PCM layer in the air gap on the inner side (a) and with two PCM layers (b).
Energies 15 03243 g005
Figure 6. Front and rear views of the reference Sustanzeb model implemented in EnergyPlus.
Energies 15 03243 g006
Figure 7. Flow chart explaining the steps followed in the cases considered in this investigation.
Energies 15 03243 g007
Figure 8. Hourly average and the monthly average indoor air temperature in the THU without PCM (CASE 1).
Energies 15 03243 g008
Figure 9. Hourly average and the monthly average of the indoor air temperature (CASE 2) with PCM23.
Energies 15 03243 g009
Figure 10. Comparison of the incoming thermal energy through the SuberWall panel between CASE 1 and CASE 2 with PCM23.
Energies 15 03243 g010
Figure 11. Comparison of the exiting thermal energy through the SuberWall panel between CASE 1 and CASE 2 with PCM23.
Energies 15 03243 g011
Figure 12. Hourly thermal requirements for heating (red) and cooling (blue) for CASE 1.
Energies 15 03243 g012
Figure 13. Hourly thermal requirements for heating (red) and cooling (blue) for CASE 2.
Energies 15 03243 g013
Figure 14. Split system operation schedule used for CASE 4, 6 and 8.
Energies 15 03243 g014
Figure 15. Comparison of average hourly and monthly average indoor air temperatures in the THU among CASES 2, 3 and 4.
Energies 15 03243 g015
Figure 16. Comparison of average hourly and monthly average indoor air temperatures in the THU between CASE 4 and CASE 6.
Energies 15 03243 g016
Figure 17. Monthly electricity consumption for different cases in heating mode.
Energies 15 03243 g017
Figure 18. Monthly electricity consumption for the different cases in cooling mode.
Energies 15 03243 g018
Figure 19. Annual electricity consumption of the split system among the considered cases.
Energies 15 03243 g019
Figure 20. Front and rear view of the EnergyPlus model of the Sustanzeb unit equipped with BIPV.
Energies 15 03243 g020
Figure 21. Hourly electric energy production and electric split demand.
Energies 15 03243 g021
Figure 22. Hourly accumulated electric energy and electricity supplied to the grid.
Energies 15 03243 g022
Figure 23. Details of the installation of the PCM sheet inside the SuberWall panel sample (a) and the probes used for the monitoring of the main thermal characteristics (b) by a climatic chamber.
Energies 15 03243 g023
Figure 24. Trends of the sample surface temperatures detected in the climatic chamber by subjecting the external side to a temperature difference of 25 °C, applied instantaneously.
Energies 15 03243 g024
Figure 25. Trends of the sample surface temperatures detected in the climatic chamber by subjecting the external side to a sinusoidal forcing with an average value of 22.5 °C and amplitude of 12.5 °C.
Energies 15 03243 g025
Table 1. Physical characteristics of commercial cork for building applications [33].
ProprietyValueUnity
Density100–220[kg/m3]
Thermal conductivity0.04[W/(m·K)]
Specific heat capacity1700–2100[J/(kg·K)]
Resistance to vapor diffusionClassic cork 2–8[kg/m2sPa]
Cork panel 5–10
Long-term use limits temperature110–120[°C]
Compressive strength100–200[kPa]
Flexural strength140–200[kPa]
Fire reactionMaterial class—B2
Table 2. Thermo-physical and optical properties of the materials used for the SuberWall panel [34].
MaterialThermal Conductivity [W/(m·K)]Heat Specific Capacity [J/(kg·K)]Density [kg/m3]Thermal Resistance [W/(m2·K)]EmissivitySolar AbsorbanceVisible Absorbance
Cork (external)0.0522491.9145.851.1540.940.30.3
Air/1004.51.2250.1800.90.70.7
OSB0.1527005500.134 0.60.60.6
Air/1004.51.2250.1800.90.70.7
Cork (internal)0.0522491.9145.851.1540.940.30.3
Table 3. Thermo-physical and optical properties of the materials used for assembling the floor.
MaterialThermal Conductivity [W/(m·K)]Heat Specific Capacity [J/(kg·K)]Density [kg/m3]Emissivity [-]Solar Absorbance [-]Visible Absorbance [-]
Flooring wood blocks0.1412006500.90.780.78
Cork0.0522491.9145.850.940.30.3
OSB0.1527005500.60.60.6
Table 4. Thermal transmittances, normal solar factor and threshold values for the various envelope structures.
StructureU [W/(m2·K)]SF
SuberWall for vertical walls0.336 (0.430)-
SuberWall for ceiling0.336 (0.350)
Floor module0.341 (0.440)-
Window module1.966 (3.000)0.687 (0.350)
Door2.084 (3.000)-
Table 5. Thermo-physical properties of different typologies of the same bio-PCM.
Thermal Conductivity [W/(m·K)]
Melting Point [°C]Specific Heat [kJ/(kg·K)]Latent Heat [J/g]SolidLiquidWeight [kg/m2]
PCM18183.142000.541.095.38
PCM21213.142000.541.095.38
PCM23233.142000.541.095.38
PCM25253.142000.541.095.38
PCM29293.142000.541.095.38
Table 6. Annual hours and correspondent percentage value in which the indoor air temperature is in the range of 20–26 °C in free-floating conditions by varying the PCM melting temperature.
PCM18PCM21PCM23PCM25PCM29CASE 1
Annual Hours 235729533171245318672290
Annual Percentage 27%34%36%28%21%26%
Table 7. Annual hours and percentage of annual hours in which the indoor air temperature is in the range of 20–26 °C in free-floating conditions, as a function of the PCM melting temperature.
PCM18PCM21PCM23PCM25PCM29CASE 1MaxMin
January0.0%0.0%0.0%0.0%0.0%0.0%//
February3.0%1.5%2.8%2.8%1.5%1.2%PCM18CASE 1
March8.6%7.3%10.1%10.1%6.9%7.8%PCM23PCM29
April23.9%17.5%23.8%23.6%15.1%16.4%PCM18PCM29
May62.5%84.0%81.3%79.7%72.3%71.2%PCM21CASE 1
June79.0%88.2%66.5%48.3%68.1%67.2%PCM21PCM23
July10.1%23.1%25.5%10.3%0.4%10.3%PCM23PCM29
August2.0%2.0%4.3%3.1%0.0%3.0%PCM23PCM29
September40.4%43.9%40.1%33.5%10.3%41.3%PCM21PCM25
October62.6%75.5%81.0%71.5%50.9%62.4%PCM23PCM29
November27.9%54.4%90.6%51.8%29.6%31.9%PCM23PCM29
December2.6%6.2%7.5%0.3%0.0%0.3%PCM23PCM29
Table 8. Percentage differences in electricity consumption between different cases in heating mode (HEAT), cooling mode (COOL) and annual demand.
HEATCOOLTotal
CASE 3–CASE 7−4.5%−15.9%−6.9%
CASE 5–CASE 7−22.0%−41.8%−26.3%
CASE 4–CASE 8−3.6%−25.8%−8.2%
CASE 6–CASE 8−20.5%−48.9%−26.3%
Table 9. Technical characteristics of the PV module and the storage system.
PV ModuleStorage
Module typeMonocrystallineEffective energy [kWh]13.5
Number of cells120Effective max power [kW]7
Cell typeHeterojunction (HJT)Inlet/outlet efficiency [%]90
Module dimensions [cm]1.767 × 0.7041 × 0.035Dimensions1.15 × 0.755 × 0.155
Weight [kg]19.7 kgWeight125
Rated power [Wp]380
Reference efficiency [%]20.7
Table 10. The monthly mean charge state of the electric storage system.
Mean Charge
Gen92.9%
Feb94.9%
Mar95.6%
Apr98.4%
May99.9%
Jun100.0%
Jul99.9%
Aug99.8%
Sep100.0%
Oct99.9%
Nov99.5%
Dec94.8%
Publisher’s Note: MDPI stays neutral with regard to jurisdictional claims in published maps and institutional affiliations.

