Article

Shedding Light on the Factors That Influence Residential Demand Response in Japan

1
Graduate Program in Sustainability Science–Global Leadership Initiative, Graduate School of Frontier Sciences, The University of Tokyo, 5-1-5 Kashiwanoha, Kashiwa City 277-8563, Japan
2
Faculty of Civil and Environmental Engineering, Waseda University, 60-106, 3-4-1 Okubo, Shinjuku-ku, Tokyo 169-8555, Japan
*
Author to whom correspondence should be addressed.
Energies 2021, 14(10), 2795; https://doi.org/10.3390/en14102795
Submission received: 1 April 2021 / Revised: 9 May 2021 / Accepted: 10 May 2021 / Published: 13 May 2021

Abstract

:
Residential demand response empowers the role of electricity consumers by allowing them to change their patterns of consumption, which can help balance the energy grid. Although such type of management is envisaged to play an increasingly important role in the integration of renewables into the grid, the factors that influence household engagement in these initiatives have not been fully explored in Japan. This study examines the influence of interpersonal, intrapersonal, and socio-demographic characteristics of households in Yokohama on their willingness to participate in demand response programs. Time of use, real time pricing, critical peak pricing, and direct load control were considered as potential candidates for adoption. In addition, the authors explored the willingness of households to receive non-electricity related information in their in-home displays and participate in a philanthropy-based peer-to-peer energy platform. Primary data were collected though a questionnaire survey and supplemented by key informant interviews. The findings indicate that household income, ownership of electric vehicles, socio-environmental awareness, perceived sense of comfort, control, and complexity, as well as philanthropic inclinations, all constitute drivers that influence demand flexibility. Finally, policy recommendations that could potentially help introduce residential demand response programs to a wider section of the public are also proposed.

1. Introduction

Electric grid systems are most efficient and reliable when supply and demand are balanced, which is typically achieved through the expansion of generation sources, the use of reserves and the capacity of transmission and distribution networks [1]. However, continuing to rely on such techniques alone represents an unsustainable and challenging pathway, as the electrification of heating and transport is projected to significantly increase in the course of the 21st century, greatly increasing peak electricity demand [2]. In the context of Japan, peak electricity demand periods (typically during daytime in summer) are infrequent and constitute 10 to 15% of the total generation costs, even though much of the installed capacity to meet them is under-utilized throughout the year [3]. Peak demand often stresses the power network, reducing its reliability, and relies predominantly on peak power plants that exacerbate greenhouse gas (GHG) emissions. Moreover, electricity costs increased substantially following the introduction of additional fossil fuel taxation, leading to an increase in the percentage of people living beneath the energy poverty line (defined as households spending more than 10% of their income on electricity) [4]. National estimates indicate that energy poverty disproportionately affects lower-income households (particularly those comprised of a single-parent with dependent child and elderly) and at present over 15% of Japanese households can be characterized as “energy-poor” [4].
Demand response (DR), which is referred to in literature as a “carbon-neutral” resource [5], facilitates the balancing of demand and supply [6] by inducing energy curtailment or consumption through demand shifting [7]. This is typically achieved through monetary incentives (which take the form of varying tariff pricing or rebates) that motivate consumers to increase or decrease their demand during predesignated events or conditions, such as when there is an excess of renewable generation due to favorable weather conditions. Although DR is not a new concept, it has recently attracted substantial policy attention, as studies have reinforced the notion that it can play a key role in decarbonizing energy systems [8] and minimizing superfluous infrastructure development [9]. More importantly (for the context of the present study), it has been demonstrated that DR allows consumers to directly reduce their energy related expenditures and environmental footprint, while indirectly improving the cost-effectiveness of renewable energy sources [10]. This highlights the potential for DR to alleviate some of the financial burdens that decarbonization and denuclearization initiatives have placed on households.
While the mechanisms underlying DR in Japan have already been widely applied to large industrial and commercial consumers, residential DR has not yet been fully explored [11]. Although findings from pilot projects in Yokohama city, Toyota city or Kitakyushu city show that some residential users currently engage in some types of DR [12], it is yet unclear what factors influence their decision to participate in these initiatives [3]. In recent years, a growing body of research has sought to underpin the factors influencing residential DR. Indeed, a number of determinants have been identified, ranging from external sources (e.g., financial incentives [13], social norms [14], complexity of DR [15], weather [16]) to internal motivations (e.g., environmental awareness [17], perceived responsibility [18], tendency to procrastinate [19], price unresponsiveness [20]). However, as some studies highlight, the factors that drive users towards the adoption of specific DR programs have been fairly inconsistent as they vary substantially amongst studies, and even amongst different users in them [21,22]. Additionally, to date, studies examining residential DR have focused predominantly on the influence of the socio-demographic or financial profile of households on the adoption of (mainly) price-based DR programs, such as Time of Use [23,24]. As such, the aim of this study is to provide an insight into the factors that can drive residential electricity consumers towards both price and incentive based DR, a topic that has remained largely unexplored in the Japanese context [24]. Furthermore, this study also aims at identifying a set of unique factors that may increase the adoption of residential DR, focusing particularly but not exclusively on the philanthropic inclinations of individuals and their interest in receiving additional information in their in-home display. Primary data were collected through the distribution of a self-administered questionnaire and were later supplemented by key informant interviews to triangulate the findings and explore further nuances. Yokohama City was chosen as a case study as it constitutes the biggest smart grid project in Japan. Thus, the contributions of this research to the literature can be summarized as follows.
Firstly, the interpersonal, environmental, and socio-economic factors that drive the willingness of residential consumers to adopt DR programs (i.e., Time of Use, Real Time Pricing, Critical Peak Pricing, and Direct Load Control with and without financial incentive) are explored. Unlike previous studies that examined DR as a general concept (or only looked at prevalent programs such as Time of Use) [23,24], the present work will inspect the influence of such factors on each individual program, both price and incentive based. Therefore, this approach can potentially bridge the gap between the theoretical and the realizable levels of DR implementation [25], by scrutinizing the willingness of households to adopt specific DR programs.
Secondly, this research examines the feasibility of a new peer-to-peer philanthropy-based energy trading platform that was conceptualized by Iliopoulos et al. [26] which facilitates the coordination of electricity trading between consumers with different incomes. Scrutinizing the feasibility of this platform is important, as it can alleviate energy poverty in Japan and enhance the penetration of residential DR, especially amongst households that are not interested in financial incentives. To the authors’ knowledge, this study is the first to test the addition of philanthropical elements to DR schemes in Japan.
Thirdly, this research examines the willingness of households to receive electricity and non-electricity related information directly to their in-home display (IHD), a communication platform that facilitates the operation of DR programs. To the authors’ knowledge, no study has focused on evaluating the extent to which Japanese households are interested in receiving non-electricity related information (e.g., disaster warnings) on their IHDs.
The remainder of the paper is structured as follows. Section 2 introduces the socio-economic and environmental determinants of residential DR as well as the auxiliary information provided in IHDs. Section 3 describes the principles of operation of the philanthropy-based DR and the structure of the questionnaire survey examined in this study. Section 4 provides the findings of the questionnaire survey. Section 5 discusses the results, including what was found through the key informant interviews, and Section 6 concludes and presents the lessons learned.

2. Residential Demand Response

2.1. Contextual Background of Socio-Economic and Environmental Determinants of Residential DR

Traditionally, residential DR programs operate on a voluntary basis and are not enforced on users through government regulations. As such, analysts often construct consumer engagement models that attempt to predict the extent to which households will respond to price signals [27] or other stimuli that facilitate their acceptance of and engagement with DR. However, although it is often the case that consumer participation in such initiatives does not follow the expectations or predictive models of analysts [28], a consensus has been reached around four major determinants of involvement.
Firstly, studies indicate that the socio-demographic characteristics of the occupants of a house (e.g., gender, age, educational background) can be considered as useful indicators for predicting their participation in DR programs, with some studies highlighting income as the most influential factor [29,30]. However, other studies maintain that the evidence for this is inconsistent and that investigating “socio-technical” groups (i.e., households with more “smart” appliances) might provide better results [31].
Secondly, findings from previous studies show that interpersonal factors can substantially influence the interest and overall engagement of individuals in DR [32,33]. Interpersonal factors reflect the normative social influence that external agents (e.g., electricity providers) exert on individuals by setting what is normal and/or desirable (through explicit/implicit rules, guidelines, etc.) [34]. For instance, the reputation of electricity providers as transparent [35,36] and socio-environmentally proactive entities [37] has been highlighted as influential on how they may shape the degree to which households are interested in engaging in DR programs [38].
Thirdly, intrapersonal characteristics have also been highlighted as having a considerable impact on the engagement of users with DR [39]. In the context of electricity consumption/conservation, these characteristics relate to the values, attitudes, and beliefs of an individual [40]. For instance, these can reflect the sense of comfort, environmental attitudes and concerns of users [41,42] (even though the environmental benefits derived from DR may not be obvious to consumers [43]). Moreover, empirical evidence indicates that feelings of comfort can specifically alter demand patterns [44], whereas the notion that DR compromises the users’ daily routine(s) may act as a deterrence to their participation in energy conservation initiatives [45]. However, it should be noted that there is mixed evidence on how such factors influence the participation of consumers in incentive-based DR programs [46].
Fourthly, persuasive strategies and knowledge transferring have all been highlighted as important tools that shape consumers engagement with DR [47]. For instance, the provision of information regarding the amount of electricity households have conserved through DR, or how their actions compare with those of their neighbors, have been demonstrated to increase enthusiasm and participation in DR [48]. However, some authors maintain that it is imperative to disseminate such information in a simple form, as otherwise such strategies may backfire and ultimately increase the perceived complexity of DR [37].

2.2. Auxiliary Information Provided on In-Home Displays
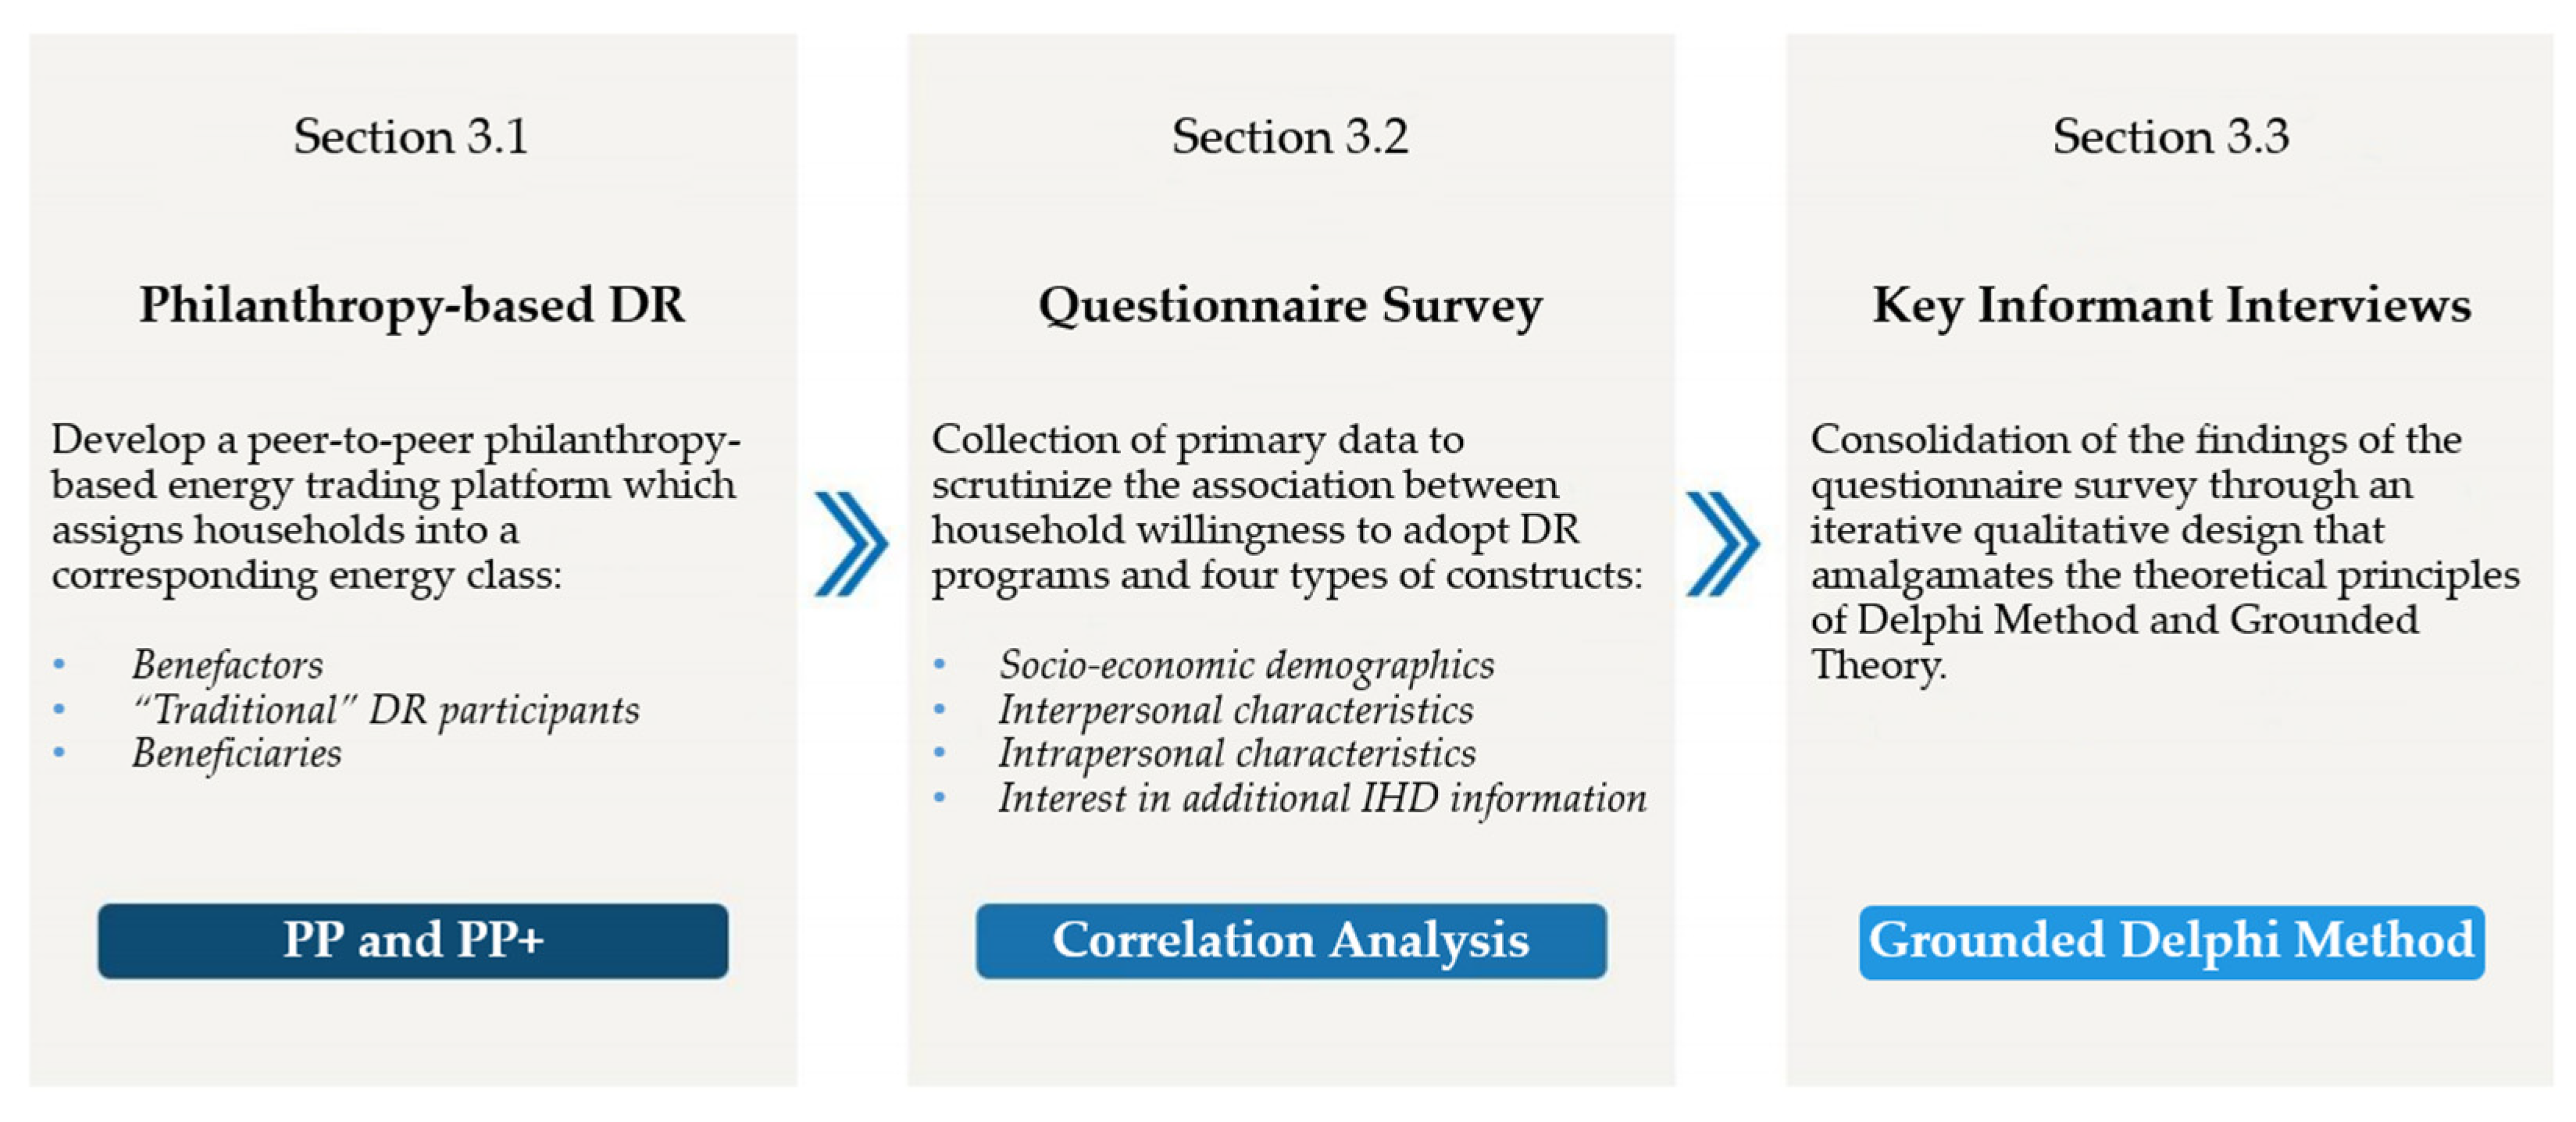
Advanced metering infrastructure and IHDs emerged to facilitate the interaction between households and their electricity suppliers and to generally encourage consumers to be more mindful of their electricity consumption patterns. Indeed, it has been demonstrated that IHDs can enhance the socio-environmental awareness of users [49] and help them make sense of the processes underlying demand side management [50]. In a similar manner, some studies maintain that the provision of feedback through IHDs could reduce residential peak demand [51], though others reported that only normative feedback would be capable of doing so reliably [52]. On the opposite side of the spectrum, some have highlighted that the effect of feedback on domestic reduction in energy use ranged from nil to substantial [53] especially in the case of digital feedback [54]. In addition, previous studies also noted that over time, consumers gradually pay less attention to their consumption patterns [55]. Consequently, a part of the energy savings achieved through DR might later be offset by a subsequent increase in energy consumption, a phenomenon known as rebound effect [56,57]. Given that communicating electricity prices and other information is an essential feature of IHDs, the third section of this study aims to identify additional types of information that can keep users engaged for longer periods of time and increase their awareness of the importance of DR. Moreover, IHDs were designed to only provide end-users with information pertaining to the energy consumption of their own household (e.g., daily consumption data). Alternatively, they could also enable individuals to remotely control their appliances (e.g., dimming lights) [58]. Though these can help consumers understand their current levels of energy consumption, providing information that could increase their sense of control or safety [59] could also be of great importance. For instance, progressive urbanization in Japan [60] has exacerbated the potential consequences of natural hazards [61]. The consequences of such events are considered preventable [62] and could be mitigated through the enhancement and better dissemination of emergency preparedness strategies [63]. Given that certain individuals might not have the means to seek information pertaining to emergency management (e.g., the location of an evacuation shelter) [64], this paper also examines the extent to which Japanese households are interested in obtaining such information from their IHD, and if this would influence their decision to adopt DR.

3. Research Design

The methodological approach taken to conduct this study was divided into three phases (see Figure 1). The first phase reflects the development of a philanthropy-based DR wherein each DR participant is assigned a corresponding energy class (see Section 3.1). The second phase examines the influence of four types of constructs on the willingness of households to participate in both traditional and proposed DR programs (see Section 3.2). Lastly, the findings acquired in phase two are consolidated through key informant interviews (see Section 3.3).

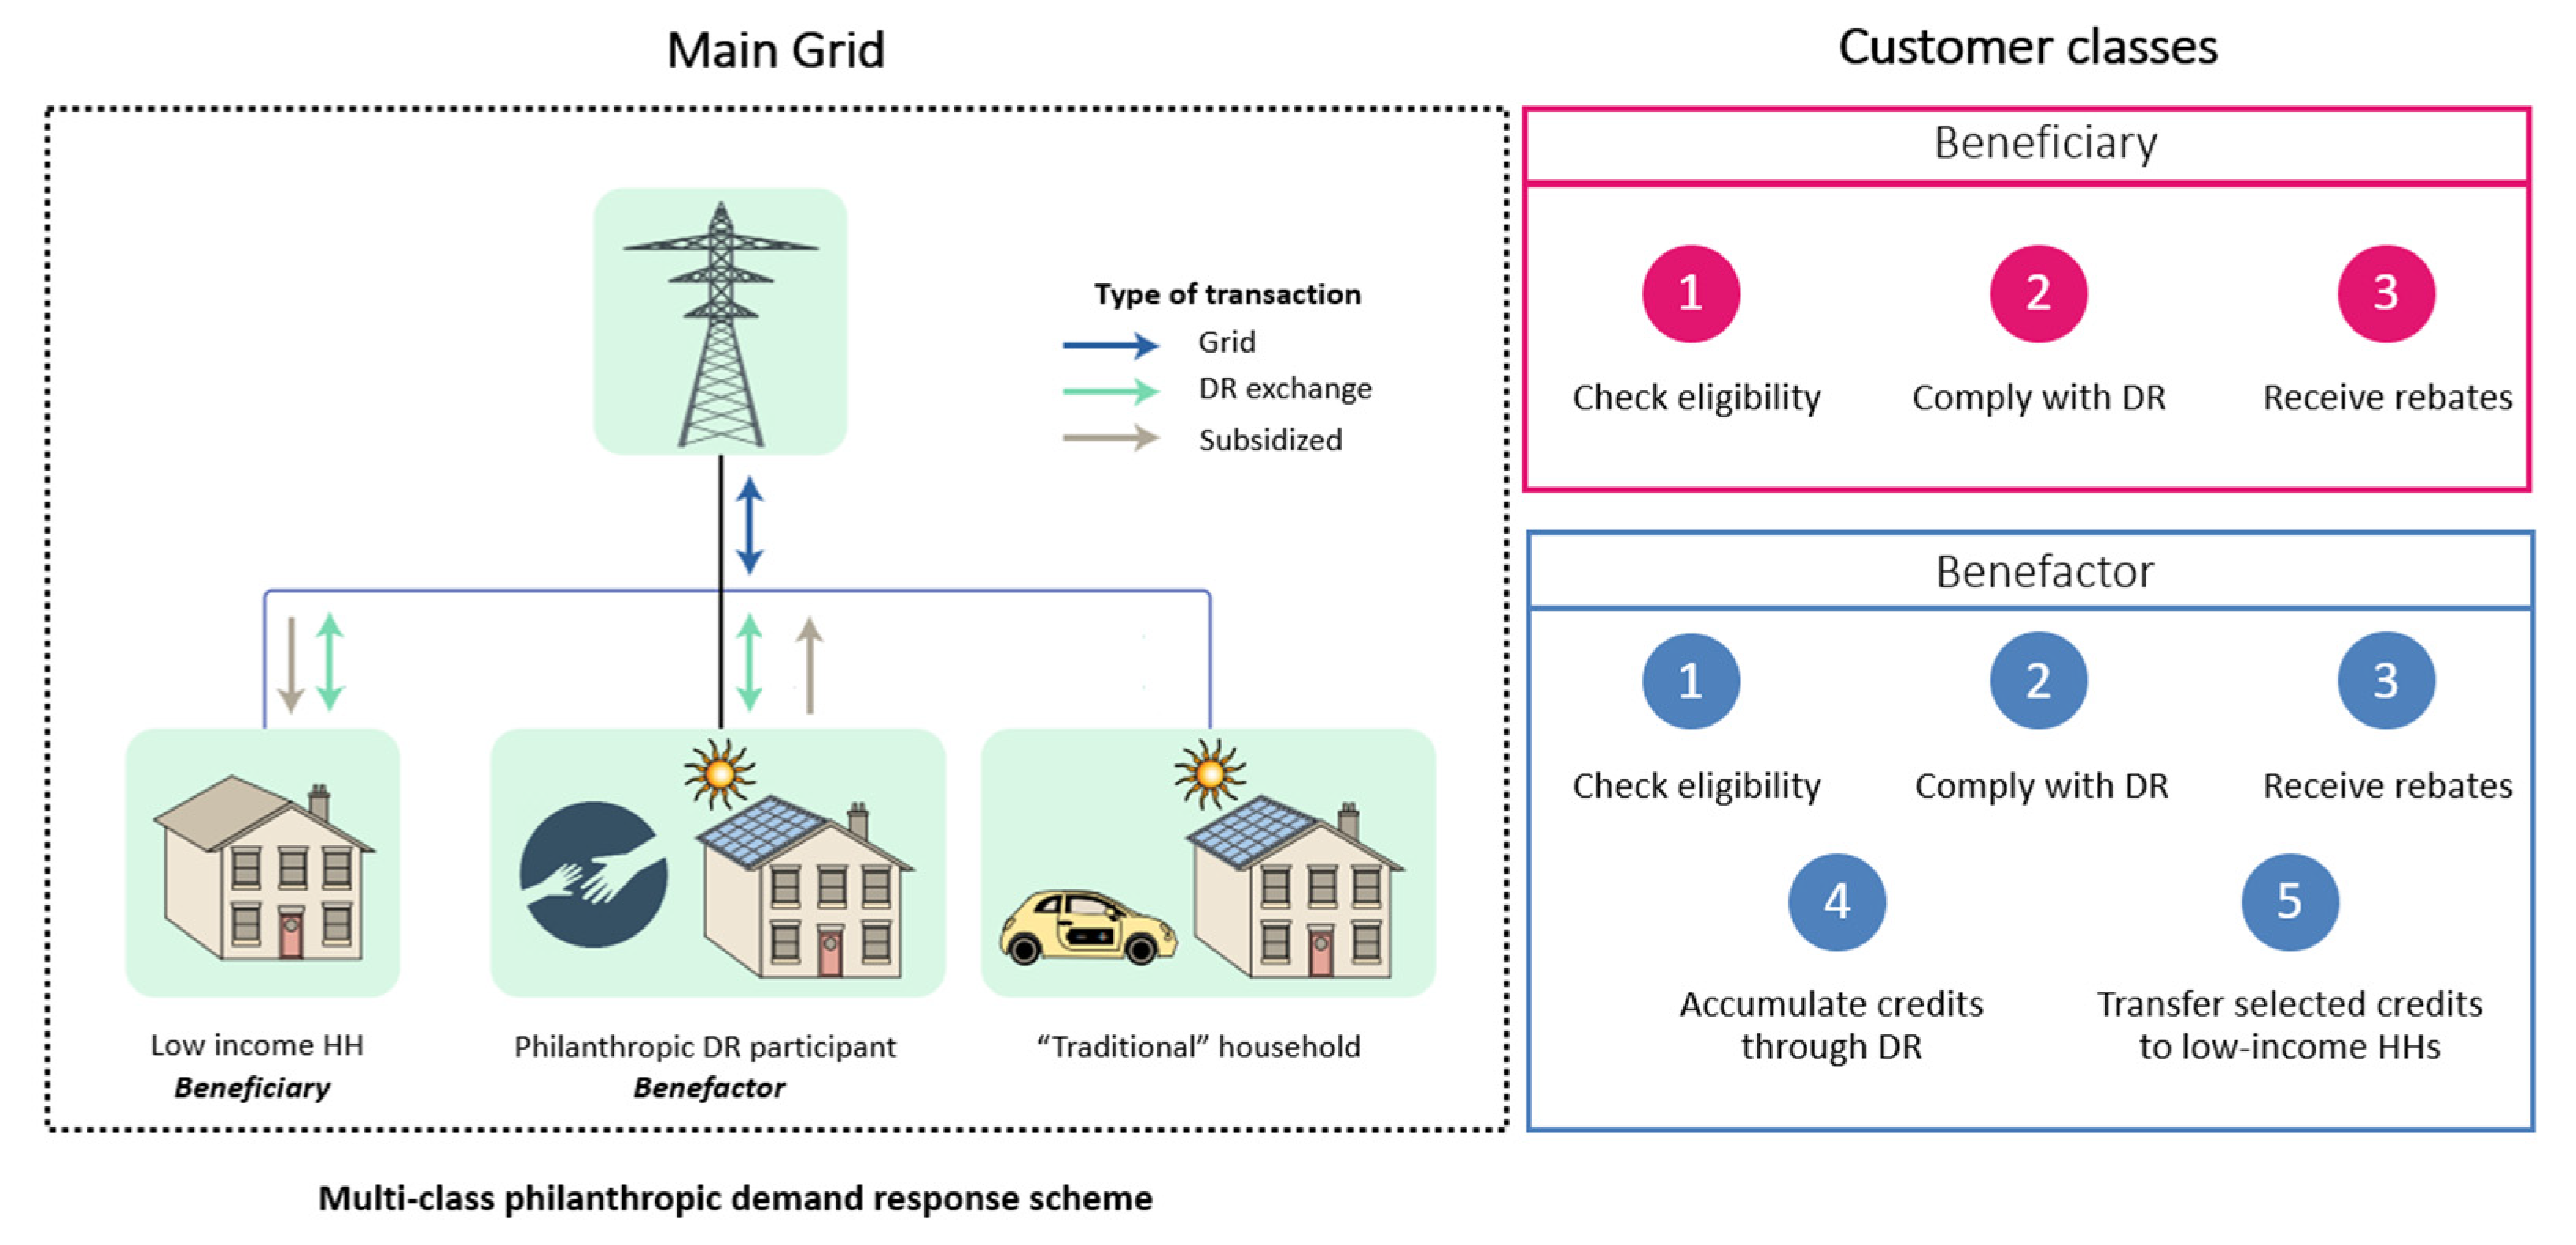
3.1. Principles of Operation of the Philanthropy-Based DR

One of the aims of the study, is to examine the interest of households in potentially participating in two altruistic, incentive-based philanthropic DR programs. These programs have the potential to reduce upstream electricity generation and increase the efficiency of the power network. At the same time, they could also reduce the GHG emissions associated with electricity supply and assist energy poor households to meet their electricity needs. Programs that allow the free flow of electricity between consumers are categorized as peer-to-peer energy platforms and, although many such programs have been proposed in the past, they have so far focused their attention exclusively on prosumers (i.e., electricity consumers that own distributed energy resources [39,65]). Existing peer-to-peer platforms can increase the adoption of DR amongst households and minimize the costs related to power losses and battery depreciation by facilitating the integration of microgrids. This is generally achieved by empowering consumers, though the general efficacy of such programs is limited by their profitability-centric orientation. In essence, existing peer-to-peer energy platforms are contingent on the non-optimal satisficing behavior of users (e.g., some users settle for the electricity price they have become accustomed to because it is “good enough”) [28]. In light of these limitations, the proposed programs could potentially motivate households to participate in DR as a mean of assisting others.
The proposed peer-to-peer energy platforms could be based on a set of automated customer-based trading coalitions that facilitate the synchronous analysis of user settings and preferences derived from a household’s IHD. To better understand and regulate the heterogeneous preferences of its participants, an energy class could be assigned to each household based on its particular characteristics and interests (see Figure 2). These energy classes could be divided as follows:
The first class would be comprised of the benefactors, which are residential electricity consumers who participate in at least one price or incentive-based DR program (e.g., Direct Load Control). Such households would be given the option to accumulate their monetary reward(s) as credits that can eventually be exchanged fully or partially for personal or altruistic purposes (i.e., for reducing a portion of their own electricity bill or of that of low-income households).
The second class would include households that desire the highest monetary return for their participation in DR programs and, as such, would choose to opt out of this regime. Though they would have no role in this scheme, they could at any point choose to become benefactors.
The third class would be comprised of the beneficiaries and is the only group that should undergo a thorough scrutiny and vetting prior to being allowed to join the scheme. The relevant authority should set the prerequisites and relevant parameters for defining which households are categorized as energy poor by examining the demographic characteristics of potential participants and prioritizing those most in need of assistance. It is also important to note that, in the context of this study, energy poverty is considered a distinct problem from income poverty [66], and is instead associated with fuel poverty (which describes the inability of households to meet their essential needs [67], particularly those related to in-door heating/cooling). Mother–child households, for instance, are an excellent example of potential Japanese beneficiaries, as in 2013 over 25% of such households were considered vulnerable to energy poverty [4].

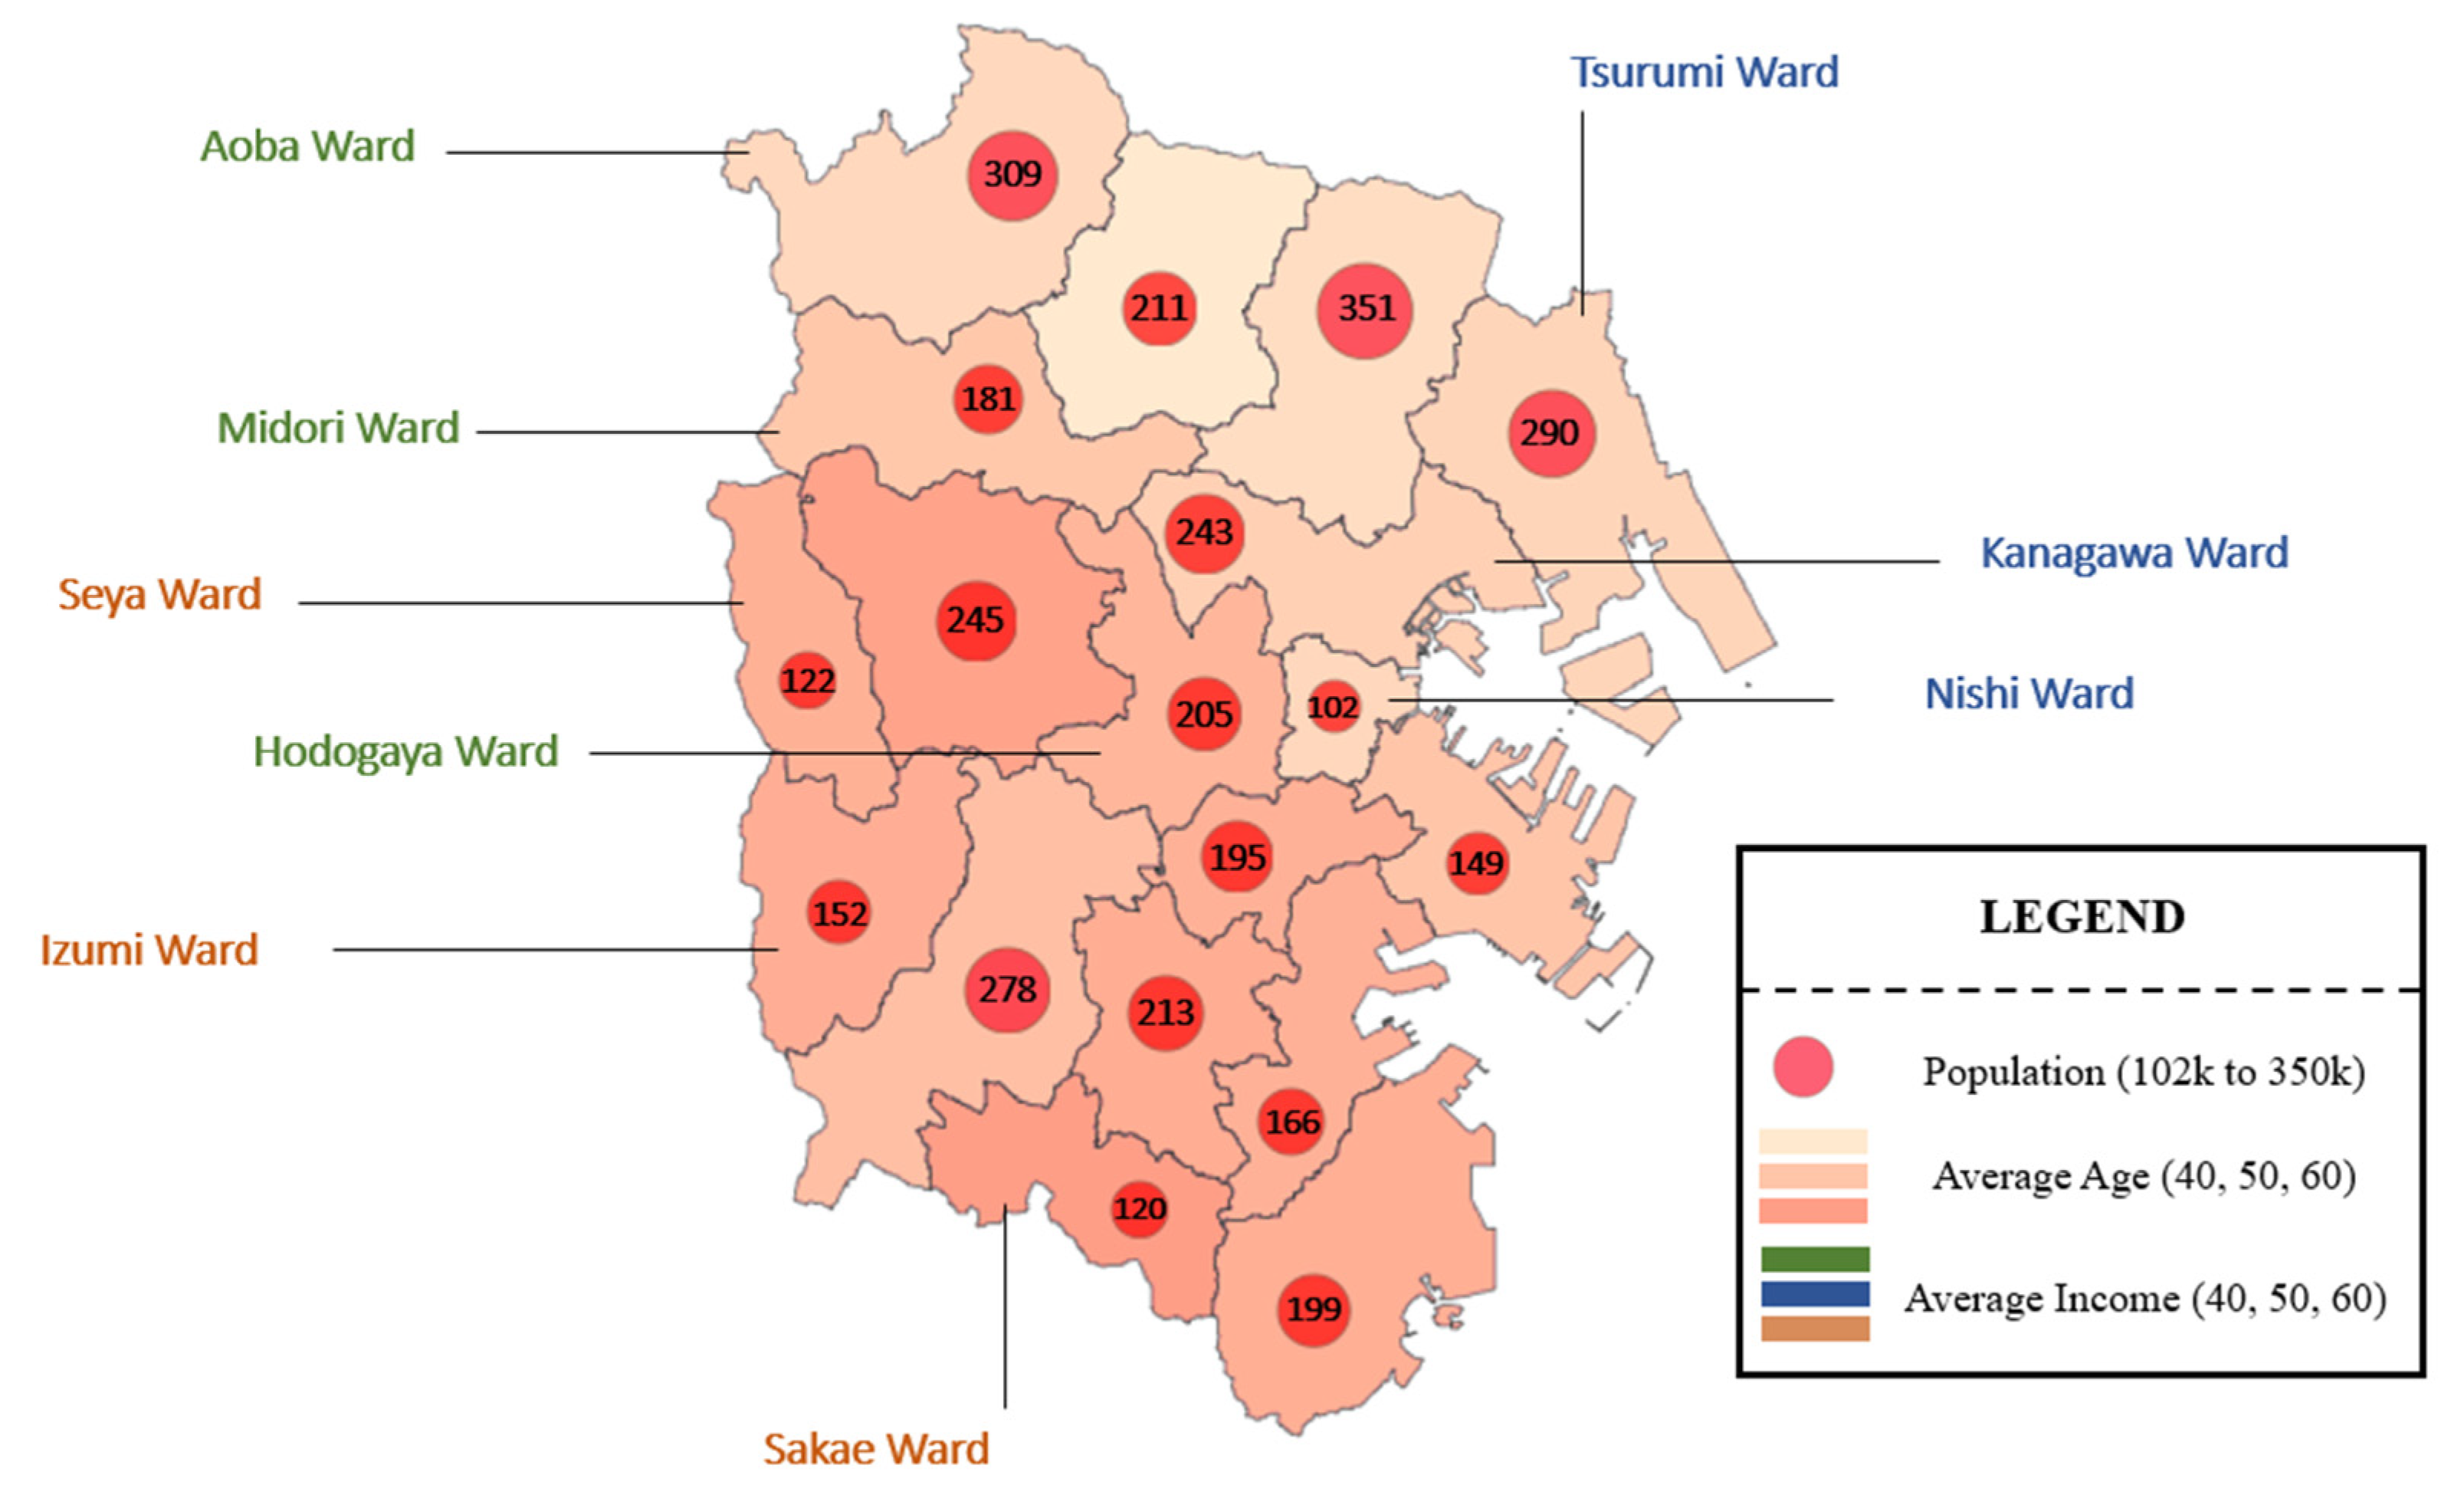
3.2. Questionnaire Survey Structure & Case Study

The target population of the questionnaire survey was determined to be urban residents living in detached houses in central Yokohama city and, based on publicly available figures, there were 599,901 private dwellings in the city that fit this description [68]. To ensure that the questionnaire captured the voices of individuals with heterogenous traits, the authors divided the wards of Yokohama according to the average demographic characteristics of their residents. The questionnaire was then distributed evenly in 9 out of the 18 wards, in households that were proportionally stratified in a geographical manner (see Figure 3). The questionnaire was written in Japanese and was delivered to the mailbox of each detached house, accompanied by a return envelope with a pre-paid stamp so that participants could return the questionnaire. The survey was conducted between 25 January and 31 March, 2020, and the response rate was 9.1%, or 91 questionnaires out of the 1000 that were initially delivered. The low response rate could perhaps be attributed to concerns pertaining to COVID-19, particularly since Japan’s first confirmed case was identified in close proximity to the targeted area a few days prior to the commencement of the project [69]. Nevertheless, the sample size acquired provides a confidence interval of 95% and a sampling error of 10.3%, which is deemed acceptable for the indicative nature of this study [70].
In the questionnaire, the respondents were invited to indicate the extent to which they were satisfied or interested in a particular construct [71]. A 10-point Likert scale was utilized as opposed to the commonly used 5-points scale, as increasing the number of points brings the quantification closer to an interval-scale continuous measurement [72,73]. Though there is significant debate about this in literature, the authors support the notion that, from a theoretical standpoint, a higher number of points allows the transmittance of a wider range of information, which in turn translates into the acquisition of more accurate and precise results [74].
Overall, the questionnaire was divided into 5 sections and utilized a hypothesis testing method to scrutinize the association between household willingness to adopt DR and five types of constructs (i.e., the constructs presented in Section 2.1, Section 2.2 and Section 3.1). The first two parts profiled respondents based on their demographic (including age, gender, and income), interpersonal and intrapersonal characteristics (i.e., opinion on the socio/environmental reputation of their energy provider, the extent of their environmental awareness and preferences and behavior as electricity consumers). The third part focused on understanding their perceived willingness to adopt price and incentive-based DR programs, focusing explicitly on time of use (TOU), real time pricing (RTP), critical peak pricing (CPP), direct load control with and without financial incentive (DLC+ and DLC, respectively), and finally on a philanthropic program with and without financial incentives (PP+ and PP, respectively). The financial incentives could potentially take the form of additional monetary benefits such tax deductions (calculated proportionally to the amount of electricity they had curtailed and/or donated during a set period). The fourth part was comprised of several constructs that assessed the factors that influence the decisions of consumers to participate in DR, including both traditional and philanthropy-based DR programs. Finally, the fifth part focused on highlighting some additional information that could be added to the in-home display units installed in each household. The questions included in this questionnaire are provided in Table A1 in the Appendix A.

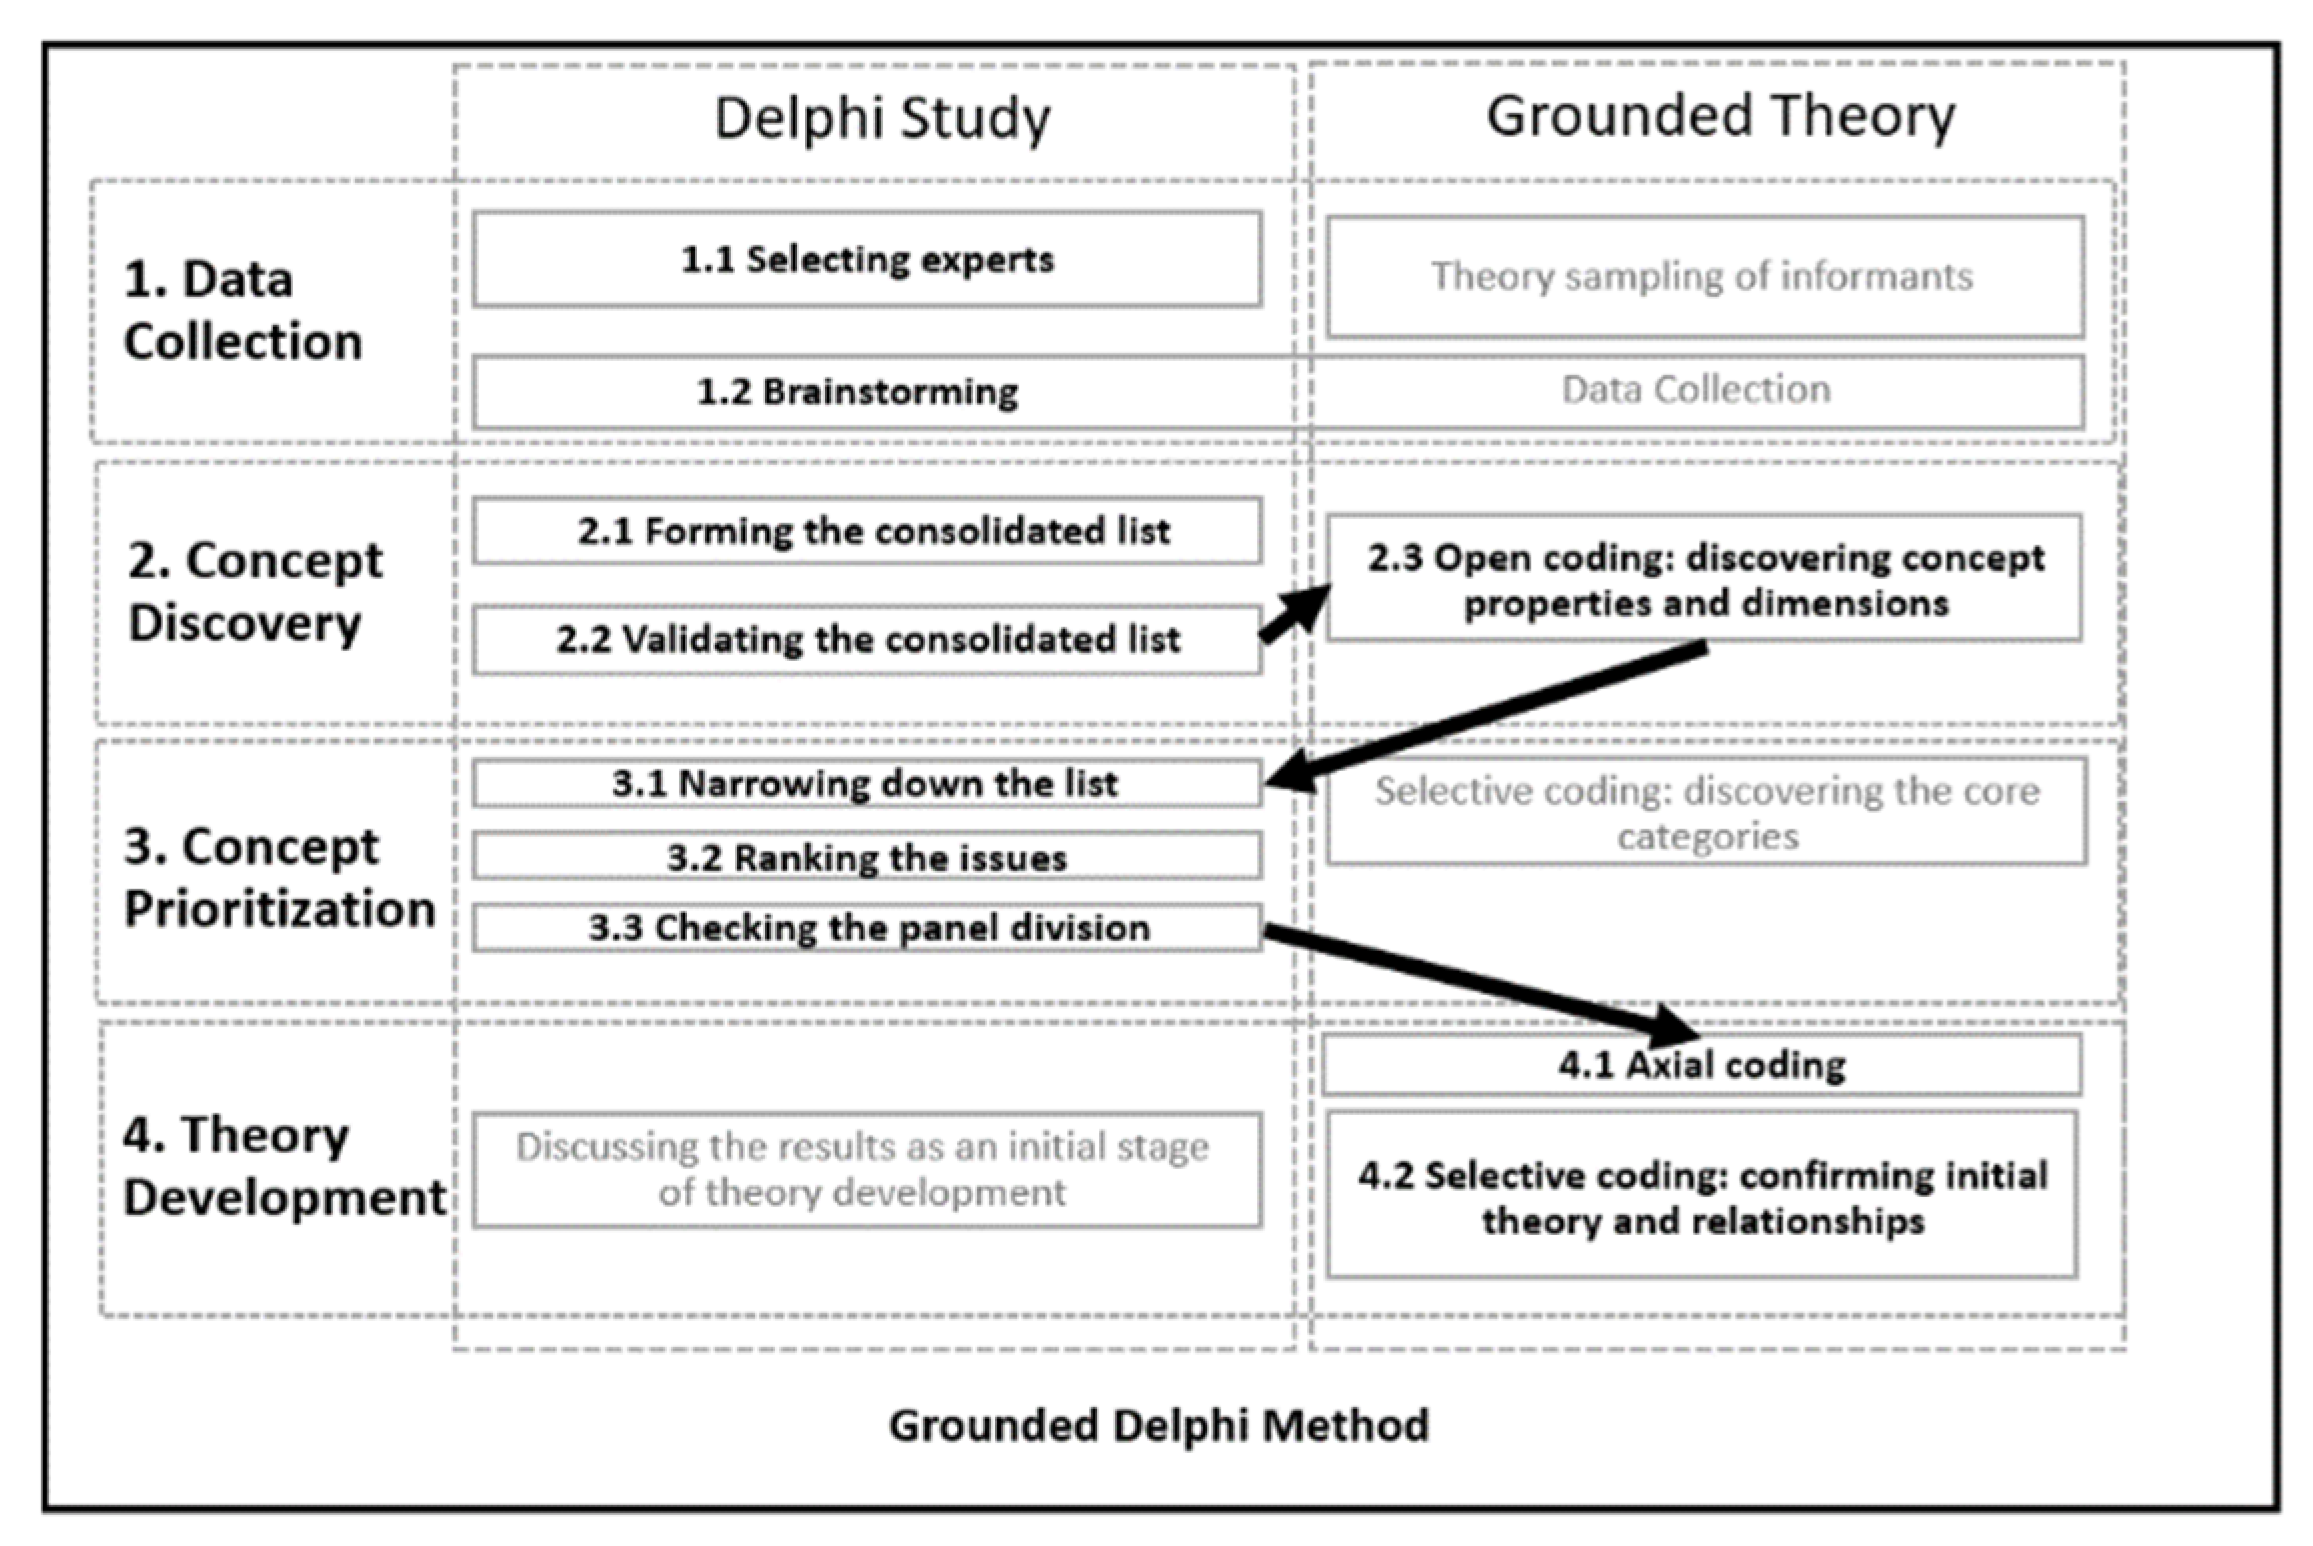
3.3. Key Informant Interviews

Considering the small sample size acquired in this study, an expert elicitation methodology was also conducted to further clarify the findings identified through the household questionnaire survey. This methodology employed an iterative qualitative design based on Grounded Delphi Method (GDM) which combines the theoretical principles of Delphi Method and Grounded Theory [75]. An overview of this methodological framework is provided in Figure 4 below.
The first phase of the GDM consisted of the identification and selection of qualified smart grid/DR experts. Initially, 60 experts working in the Kanto region spanning three sectors (academia, industry, government) were identified through a literature review. From these potential candidates, eight experts agreed to be interviewed (four academics, one government official, and three utility operators). The second phase involved a brainstorming process where the constructs presented in the household survey were categorized into a consolidated list of semi-structured interview questions. In the third phase, primary data were collected through digital interviews that took place between 6 April and 15 June, 2020. During these interviews, the participants were invited to share their perspective on the factors that influence households in Yokohama City to adopt DR. A sample of the questions that were used in these interviews (i.e., those formed in phase 2) is provided in Table A2 in the Appendix B. The fourth phase involved the content analysis of the responses derived from the previous phase. First, each interview transcript was separated into numerous individual remarks. Then, these remarks were grouped together into beliefs and similar utterances. Lastly, the grouped remarks were narrowed down into a series of idiosyncratic groups and subcategories. This process of concept discovery and prioritization was repeated six times until the newly built interlinked categories were clearly discernible. Data saturation was achieved on the eighth interview with the stopping criterion set at three consecutive interviews, as suggested by previous studies [76]. By following this method, the authors can confidently conclude that an appropriate sample size had been attained [76,77]

4. Results

4.1. General Household Characteristics

The sample acquired represented predominantly individuals that were 55 years old or older (67.4%), most of which were men (63.3%) (see Table 1). This would be considered typical of an aging population such as that of Japan, where the younger segment would tend to live in cheaper apartments (as opposed to detached houses). In terms of their educational background, though some had only attained a high school diploma or a professional certification (14.4% and 16.6%, respectively), the majority had acquired a bachelor’s degree (55.6%). Respondents were largely divided into two groups, those who were employed full time (44.9%) and those who had already retired (22.5%). The households surveyed were occupied predominantly by more than two people (45.1%), had an average annual income of between 9.000$ and 44.999$ (34.1%) or more (65.9%), and mentioned that the house in question was owned by its residents (87.9%). The majority lived in a house that is larger than 90 m2 (74.2%) and most did not have an IHD installed in their home (81.3%). Regarding their appliances, most houses did not own any “smart” devices (89.0%) that were capable of being connected to something else and/or the internet. The vast majority did not utilize an electric vehicle (73.6%) or have any photovoltaic systems (96.7%).

4.2. Descriptive Analysis

Table 2 shows the mean and standard deviation of the responses regarding the reputation of the electricity providers and the intrapersonal preferences and concerns of the questionnaire respondents. Overall, the results indicate that the reputation of the electricity providers is slightly below average in all categories (i.e., credibility and socioenvironmental proactiveness). Though this does not significantly impact the degree to which customers are dissatisfied with their services (4.87), many noted that they would prefer their energy provider to act in a more environmentally sustainable manner (8.01). The findings also indicate that participants would be willing to sacrifice some degree of comfort over the potential of saving money on electricity (“Comfort is very important to me—even if it means spending more money on electricity”, 3.42), and they generally follow the belief that conservation of electricity at the household level could help combat climate change (“Conserving electricity at home cannot alleviate climate change/environmental degradation”, 3.73).
Table 3 presents the willingness of participants to adopt the seven DR programs examined in this study, as well as the extent to which certain factors influence their rate of adoption. Given that most participants had no prior knowledge of what DR programs are, what benefits they provide and how they work in practice, a brief introduction about each program was provided in the questionnaire. The introduction contained information pertaining to a) the operational structure of each program (e.g., DLC allows power companies to cycle their customers’ electrical appliances on and off during peak periods) and b) the socio-environmental benefits underlying their adoption [78,79].
Amongst the 7 programs that were scrutinized, the participants positively leaned towards the adoption of DLC+ (7.12), PP+ (6.62) and TOU (6.57), while maintaining a neutral stance towards the rest of the programs. With respect to contemporary DR programs, the participants highlighted that they do not generally mind having their daily electricity consumption pattern altered (“We want to be left alone to use electricity when/how we want” statement obtained a low support, 3.18) and were generally undecided on whether they can truly save money through such initiatives (5.36). However, the idea of allowing their electricity provider to remotely control their devices (“We do not like the idea of the utility “talking” to/controlling our smart devices” was highly supported, 6.39), and their perceived notion that such programs are based on ulterior motives (6.66), could constitute barriers which negatively influence the rate to which they are willing to accept them. With respect to the philanthropically oriented DR programs, the findings show that although some participants believe that such schemes could help poverty-stricken households (5.71), their implementation could be hampered by parties looking to profiteer from their status as benefactors (6.20) or beneficiaries (7.23). Further, the respondents were asked to evaluate the extent to which they would be interested in having new information integrated into their (hypothetical) IHDs. The majority expressed interest for information that could enhance their emergency preparedness such as emergency audiovisual signals (8.25) or additional information regarding a recently experienced or expected natural hazard (7.50). Additionally, they expressed interest in receiving information regarding the amount of electricity/money they have saved through DR programs (7.17), and the primary energy sources which were used to generate their electricity (6.83).

4.3. Correlation Analysis

A bivariate correlation analysis was performed (see Table 4) to better understand the underlying relationship between the participants’ willingness to adopt DR programs and all other variables presented earlier. Firstly, the demographic information (e.g., gender, education), and household characteristics (e.g., home size) of the participants were examined. Household income and ownership of electric vehicles displayed statistically significant results with PP and CPP. These associations show that households with lower income lean towards the acceptance of philanthropy-based DR more than higher income households, and that ownership of electric vehicles drives people away from CPP, comparatively to those that own no such vehicles.
The next variables scrutinized were the intrapersonal characteristics (e.g., environmental awareness) of the respondents and their perception of the reputation of their utility operators. The findings show that those that prioritize indoor comfort have a higher DLC and DLC+ score than those that rank interior comfort as less important. Households that maintain that climate change can be partially alleviated through individual action display a higher PP score than those that think otherwise. Although the reputation of the utility operators did not display any statistically significant associations, households that wanted their utility operators to act in a more environmentally and philanthropically sustainable manner did display a strong correlation with PP, PP+.
Further, the variables associated with traditional DR programs are analyzed. Concerns regarding the fluctuating prices of electricity throughout a given day were negatively correlated with CPP and positively correlated with DLC. The notion that DR programs do not offer substantial benefits to counterbalance the effort needed to participate in such schemes was negatively associated with TOU, RTP, CPP, and DLC. In a similar manner, a negative, statistically significant association was found between those that do not want to be told when to use electricity, and TOU, RTP, CPP, and DLC+. A negative statistical correlation was also identified amongst households that perceived the automatic element of DLC programs as intrusive to their daily habits and DLC and DLC. On the opposite side of the spectrum, households that understand the benefits of DR and believe that they are generally easy to follow, had a more positive image of CPP and DLC as compared to those that did not. Similarly, a statistically significant relationship was identified between households that believe that can save money through DR, and CPP, DLC and DLC+.
With respect to the variables that influence the DR programs proposed in this study, a negative, statistically significant association was identified between households that support the notion that DR is “too troublesome”, and PP and PP+. Concerns regarding whether the money allocated from the benefactors would truly be directed towards the intended beneficiaries also negatively affected people’s opinion of PP. Conversely, households were more likely to support PP and PP+ if they supported the idea that philanthropy-oriented DR can help poverty-stricken households and that the implementation of such programs would be further facilitated through contributions made by private and/or public actors.
Regarding IHD related information, a correlation was identified between the interest of households in knowing the average electricity consumption of their community and CPP and DLC. Interest in knowing which sources were utilized to generate their electricity was also positively associated with CPP, DLC, and PP. Interpretive information about how much electricity these households have (theoretically) conserved through DR was found to have a positive correlation with CPP, DLC, and DLC+. Comparably, interpretative information about how much electricity they have helped other households consume through philanthropy-oriented DR positively influenced their opinion of PP and PP+. The interest in disaster-related information also appears to have a positive correlation with the DR programs examined in this study. More specifically, a statistically significant correlation was identified between households’ interest in obtaining information regarding a recently experienced natural disaster and DLC, DLC+, and PP+. In the same way, interest in having an emergency signal installed in their (theoretical) IHD was positively correlated with PP+.

4.4. Consolidation of Findings through Key Informant Interviews

To remedy some of the shortcomings associated with the small sample size acquired in this study, the authors discussed the results with key informants, in the form of semi-structures interviews. Through a cross-case analysis of the beliefs of the respondents, the authors were able to reaffirm the notion that the factors that drive Japanese households towards specific residential DR programs have not received much attention in literature. For instance, one respondent summarized this research gap as follows “In Japan, the government is mostly looking at reducing the demand of large industrial or commercial users, because doing so is easier and more viable than reducing the demand of 10 or 20 million households. So, when talking about residential energy conservation, most studies look into increasing household energy efficiency. Limited studies have focused on what influences Japanese households to participate in DR”. Most of the participants (6 out of 8) agreed that there is an academically vague and generally unrefined relationship between the demographic characteristics of individuals and their willingness to adopt DR, particularly in the Japanese context. Amongst all demographic characteristics, household income was noted as the most influential factor that could drive households towards DR, perhaps because it denotes the extent to which a household can reduce its energy expenditures (in proportion to the monthly income of that household). Further, a consensus was reached amongst participants that the level to which DR is easy to understand and can help households save money could drive them towards DR. One participant elaborated on the importance of this by indicating that “The majority of households in Japan do not understand how DR works and as such they quickly lose interest after a while. It is important to make DR as simple and easy to use as possible”. When asked to elaborate on what other factors might influence the decision of households to participate in DR, the interviewees unanimously underlined that DR being perceived as “intrusive” could act as a significant barrier. For instance, one respondent summarized the issue as follows “… residential DR in Japan is still at an exploratory stage, so people are not very familiar with the concept of demand management nor with the benefits that DR provides. So, when they are suddenly asked to shift their demand, they feel hesitant, or they do not want to do so, particularly when the monetary incentives provided are not adequate for their (perceived] loss (of comfort]”. Lastly, the respondents were also asked to express their opinion on the potential of the philanthropy-based program proposed in this study and the extra information provided by IHDs. Several respondents (5 out of 8) maintained that a philanthropy-based program could indeed help poverty-stricken households meet their needs for electricity, though they also shared their concerns regarding the political and regulatory feasibility of these programs. With respect to the information provided on the IHD of households, a consensus was reached in that emergency related information could serve as an additional measure to help disaster-preparedness. However, two respondents noted that, although the penetration of smart meters in Japan has increased significantly in the past couple of years, the vast majority of houses still do not own an IHD, so the applicability of this feature could be limited at present.

5. Discussion

5.1. Socio-Economic Demographics of Users

The majority of the variables associated with the demographic characteristics of participants, (e.g., age, gender, education, employment status) did not constitute significant predictors, contradicting the findings of other studies [26,80,81]. The reason for this could be that there is a lack of personal exposure to and understanding of DR initiatives that nullify the effect of personal user characteristics regarding their interest to participate in them. This is also reflected in the respondents’ relatively low affinity with new home technologies that is, as highlighted in the literature, aggravated by their age group (i.e., most of the respondents were 55 years old or older and such individuals are less likely to adopt innovative technological solutions than younger generations) [82,83]. The findings also show that households with lower average income are more inclined to altruistically participate in DR, perhaps due to a higher sense of empathy and understanding of the difficulties involved in making ends meet. Moreover, previous findings in literature highlight the importance of household characteristics (e.g., size of the household and type of thermostat) in the adoption of DR [73,74,75]. In contrast, the present study showed that such factors do not appear to influence the interest of Japanese households in DR programs. Amongst all household characteristics considered, only the ownership of electric vehicles was found to have a statistically significant relationship with the DR programs examined. This finding shows that the owners of electric vehicles are less open towards the adoption of CPP, perhaps due to the notion that this scheme might compromise their current level of comfort by forcing them to charge their vehicle(s) during off-peak hours. Given that the demand for electric vehicles is projected to increase at a rapid rate in Japan [79], securing the support and participation of electric vehicle owners is of great importance.

5.2. Intrapersonal Characteristics of Users

The results support the conclusions of previous studies that environmental awareness is an influential factor driving residential consumers towards DR [84]. However, in the present study the socio-environmental inclinations of consumers only influence the DR programs proposed, namely PP and PP+. More specifically, those that supported the notion that households can partially alleviate climate change through energy conservation also showed greater support for PP. Thus, providing potential DR users with interpretative, yet detailed information of how their decisions (individually or collectively) shape their community’s environmental footprint could stimulate their interest in extending the current scope of DR to include philanthropically oriented goals. By extension, this also suggests that households with altruistic aspirations may be attracted to DR, regardless of the financial compensations provided. Aside from their inherent concern for the environment, their interest in seeing their electricity supplier operate in a more environmentally friendly manner (e.g., through investing in a diversified energy portfolio) was also found to have a statistically significant relation with both PP and PP+. Similarly, a statistically significant relationship was identified between their interest in having their electricity supplier operate in a socially responsible manner (e.g., through the creation of jobs) and PP. These findings suggest that the role of electricity providers as trustworthy and socio-environmentally active agents will play an important role in engaging residential electricity consumers in philanthropy-oriented DR.

5.3. Perceived Levels of User Comfort and Complexity of DR

The results show CPP and DLC schemes are perceived by the respondents as programs that can potentially assist their efforts to reduce their electricity-related expenditures. With respect to price-based DR programs such as TOU, RTP, and CPP, the results indicate that respondents felt uncomfortable with hourly-based DR, perhaps due to having inflexible consumption patterns or the lack of knowledge on how to do reduce their consumption during critical times. CPP was highlighted as particularly difficult to understand, as its tariff system was perceived as fluctuant and arbitrary. Thus, additional emphasis needs to be placed on educating households about the underlying structure of fluctuating tariffs of price-based DR programs and the importance of separating DR into different categories (i.e., TOU vs. RTP). Further, the provision of additional information regarding what tangible benefits these programs provide (to individual electricity consumers and their community as a whole) could also help to attract the attention of consumers.
With respect to incentive-based DR programs, respondents seemed to appreciate that DLC allows them to passively participate in DR (i.e., without having to be constantly paying attention to fluctuating electricity prices). This perhaps also led to the notion that DLC as a program is straightforward. Nevertheless, this positive aspect is counterbalanced by the general dismissal of DLC and DLC+ due to concerns pertaining to the need of households to concede the right to utility operators to remotely control/communicate with their appliances. Other studies have found similar attitudes, and it has been suggested that consumers might fear that data sharing, which is an inherent feature of DLC schemes, could result in misuse or profiteering [85]. Others maintained that the negative stance against DLC programs could be linked to perceptions that some peak hour activities, particularly those that occur in a rhythmic manner, are non-negotiable (e.g., family dinners accompanied by the use of TV) [86,87]. From this perspective, DLC is perceived as an “intrusive” program that could cause inconvenience. Thus, additional emphasis needs to be placed by policy makers in promoting these incentive-based programs as flexible and trustworthy, working for and not against residential consumers.

5.4. Philanthropical Inclinations

The respondents supported the notion that the implementation of a philanthropy-based DR program can assist households that live in energy poverty. Therefore, the authors maintain that the proposed philanthropy-based DR can potentially increase energy curtailment and shifting amongst households with a high prosocial responsibility. Moreover, while the reputation of the electricity provider was deemed as an influential factor that can potentially drive households towards PP and PP+, concerns regarding the potential misuse of such programs by its beneficiaries can potentially act as inhibiting factors that prevent their adoption. These concerns highlight the need to establish a rigorous regime to evaluate the economic status of the potential beneficiaries of the programs prior to the commencement of this type of DR.

5.5. Information Provided in IHDs

The results show that respondents are predominantly interested in knowing about how much electricity they have conserved through DR and the sources that were utilized to generate their electricity. As such, the aforementioned information, together with the provision of the average electricity consumption of other households in their community, could be used to instigate an environmentally proactive consumer behavior, particularly through CPP and DLC. Those interested in PP and PP+ were also keen in measuring the outcome of their actions by examining how many households (and to what extent) they have helped through PP and PP+ schemes. Lastly, the integration of disaster preparedness warnings and information into IHDs was found to be generally agreeable by most of the respondents and had a noticeable effect in stimulating their interest in programs such as DLC and DLC+. Thus, such information have the potential to increase the adoption of DR by enhancing the value proposition of IHDs.

6. Conclusions

Price and incentive-based DR programs have the theoretical potential to shave peak demand by increasing the demand flexibility of the residential sector. However, achieving such targets is contingent on behavioral interventions and consumer engagement measures that drive household energy conservation forward and bridge the efficiency gap between the theoretical and realizable levels of DR. Thus, consumer behavior is a vital component that needs to be better understood to advance towards the establishment of a sustainable energy society.
To that end, the present study conducted a household questionnaire survey and key informant interviews to scrutinize the willingness of households to adopt price and incentive-based DR as well as the factors that could potentially increase their participation in such initiatives (see Table 5). Overall, the finding indicate that respondents were mostly interested in adopting DLC+, PP+ and TOU. The demographic characteristics of individuals (e.g., age, gender) as well their household characteristics (e.g., house size) did not appear to influence their willingness to adopt traditional DR, a finding that aligns well with the conclusions of previous studies conducted in Japan [11]. Further, the analysis showed that the ownership of electric vehicles negatively influences the decision of households to adopt CPP. Similarly, fluctuating prices, and the notion that DR is intrusive and does not provide adequate benefits could negatively influence the adoption of all traditional DR programs. In contrast, the findings indicated that the notion that DR programs are easy to use and help people save money could potentially increase the willingness of individuals to adopt CPP, DLC, and DLC+.
This body of work also introduced two new concepts to the field of demand side management. These include two philanthropy-based DR programs and the integration of additional information in the IHD of households. With respect to the adoption of philanthropy-based DR, the reputation of the utility operator, the notion that these programs could indeed help poverty-stricken households reduce their expenditures and the potential of other entities (e.g., government) contributing to this cause were all highlighted as positive contributors. In contrast, household income, the notion that these programs do not provide adequate personal benefits and concerns pertaining to the financial transparency of these programs were highlighted as factors that could negatively influence the adoption of PP and PP+. With respect to the provision of information on the IHD of households, the results show that most people are interested in knowing how much electricity they have conserved through DR and emergency-preparedness related information.
The findings of this study provide further evidence on which factors can drive energy conservation in households and can potentially contribute toward the cost-efficient implementation of DR in Japan. More specifically, the results reinforce findings by other authors that suggest that the demographic, interpersonal, and intrapersonal characteristics of individuals influence their willingness to participate in DR. Nevertheless, it is important to keep in mind that these factors have been known to have an inconsistent effect on individuals, particularly when applied to a different socio-cultural context [88]. Thus, moving forward, policy makers are advised to undertake a systematic analysis of the target population of a potential smart grid initiative to tailor promotional strategies by accounting for the socio-demographic and psychological profiles of households. For instance, a series of educational schemes could be created to increase the penetration of residential DR in Kanagawa (particularly amongst owners of electric vehicles). These initiatives can inform potential users as to how to maximize their potential profit (through a fluctuating price tariff) and reduce the level of disruption that these programs entail (e.g., by reminding them to charge their vehicles only during late-night hours when electricity is cheaper). Additionally, local electricity suppliers could also use IHDs as communication tools that facilitate the engagement of users in DR initiatives. For example, with respect to philanthropy-oriented programs, the provision of information regarding the extent to which poverty-stricken households are assisted through PP can reinforce the participation of those interested in these programs. Disaster-preparedness information could also be integrated in the IHD of households, increasing the willingness of households to adopt DR.
Finally, it is important to note that there are a few limitations associated with this study. The questionnaire survey acquired a small sample size (n < 100) and scrutinized the perception of urban residents exclusively. Additionally, due to the explorative nature of this study, only a descriptive analysis was performed. Thus, the findings may have limited generalizability, particularly in a rural context. This indicates that there is clearly a need to conduct more research on this topic. Future research could, for example, expand the scope of this study by (a) scrutinizing the factors that drive rural households towards DR, (b) quantifying the extent to which PP and PP+ can alleviate energy poverty and (c) delineating the exact information an emergency-preparedness IHD message should contain to increase household disaster resilience.

Author Contributions

Conceptualization, N.I., M.E., and M.O.; methodology, N.I., M.E., and M.O.; software, N.I.; validation, N.I.; formal analysis, N.I.; investigation, N.I.; resources, N.I., M.E., and M.O.; data curation, N.I.; writing—original draft preparation, N.I.; writing—review and editing, N.I., M.E., and M.O.; visualization, N.I.; supervision, M.E. and M.O.; project administration, M.E. and M.O.; funding acquisition, M.E. and M.O. All authors have read and agreed to the published version of the manuscript.

Funding

This research received no external funding.

Institutional Review Board Statement

The study was conducted according to the guidelines of the Declaration of Helsinki and approved by the Institutional Review Board of Association for the Promotion of Research Integrity (protocol code JS0000211772, date of approval 2019/05/17).

Data Availability Statement

The data utilized in this study contains delicate information, such as the demographic characteristics of its participants. Thus, concerns pertaining to data confidentiality inhibit the authors of this paper from making the dataset publicly available at this point. However, the authors would be happy to share this data with other academics, provided that such a request explicitly limits its use to academic purposes (as it was indicated in the questionnaire survey). This is to ensure the safekeeping of the respondents’ information (particularly so since as a part of the questionnaire, some of them highlighted their concerns that data regarding them could be misused).

Acknowledgments

The present work was performed as a part of activities of Research Institute of Sustainable Future Society, Waseda Research Institute for Science and Engineering, Waseda University, and the Graduate Program of Sustainability Science-Global Leadership Initiative, The University of Tokyo. Lastly, the authors would like to acknowledge the support of the Japanese Ministry of Education, Culture, Sports, Science and Technology (MEXT), without which this work would not have been possible.

Conflicts of Interest

The authors declare no conflict of interest.

Appendix A. Household Questionnaire Survey

Table A1. The (translated) list of questions included in the household questionnaire survey.
Questionnaire ItemsAvailable Choices
Demographics & Household Characteristics
Age18–34 years old35–54 years old55–64 years old65 or more
GenderMaleFemaleOther
EducationLess than high schoolHigh schoolProfessional certificationBachelor’s degree
Master’s degreeDoctorate degree
Work statusEmployed
full-time
Employed
part-time
UnemployedRetired
HomemakingStudentOther
Members per household12345 or more
Average annual household income (USD equivalent)Less than $8.999$9.000–$44.999$45.000–$89.999$90.000–$137.000
$138.000 or more
Resident statusOwnRent
Household size (sq. m.)Less than 19 m220–29 m230–49 m250–69 m270–89 m2
90–109 m2110–129 m2130–149 m2150 m2 or more
Type of in-home display (IHD)NoneManual IHDProgrammable IHDIHD with WIFISmart IHD (capable of “learning” household’s preferences)
Smart appliance(s)NoneOneTwo or more
Electric vehicle(s)NoneOneTwo or more
Photovoltaic systemsNoYes
Socio/environmental reputation electricity provider, and intrapersonal preferences of users
(the avalailable choices ranged from extremely disagree (0) to extremely agree (10))
Electricity provider is a credible source of information
Electricity provider is actively promoting programs to help its customers save money
Electricity provider is operating in an environmentally responsible manner
I am overall satisfied with my electricity provider
I believe that my electricity provider should be actively engaged in environmentally sustainable activities (e.g., through investments in renewables)
I believe that my electricity provider should be actively engaged in socially responsible activities (e.g., through philanthropic-oriented contributions)
Comfort is very important to me-even if it means spending more money on electricity
There isn’t much I can do to save money on electricity
I am generally concerned about the environment
Conserving electricity at home cannot alleviate climate change/environmental degradation
I am an early adopter of new home technologies
Willingness to adopt specific DR programs
(Following a short description of each program, the available choices ranged from not at all interested (0) to extremely interested (10))
Interest in Time of use (TOU)
Interest in Real time Pricing (RTP)
Interest in Critical Peak Pricing (CPP)
Interest in Direct Load Control (DLC)
Interest in Direct Load Control with an annual financial incentive (DLC+)
Interest in Philanthropic Program (PP)
Interest in Philanthropic Program with a financial incentive (PP+)
Concerns and/or opinions that users expressed with respect to the traditional DR programs
(The avilable choices ranged from extremely disagree (0) to extremely agree (10))
We do not want to worry about electricity price fluctuating throughout the day
We think these programs would cause us a lot of trouble and offer little benefits
We think that these programs’ true goal is not to help us save money
We want to be left alone to use electricity when/how we want
We are concerned that we would not be able to conserve electricity during “peak” hours
We think these programs are straightforward and easy to follow
We do not know how to reduce electricity during “peak” hours
We think we can save money with these type of programs
We do not like the idea of the utility “talking” to/controlling our smart devices
Concerns and/or opinions that users expressed with respect to the proposed DR programs
(The avilable choices ranged from extremely disagree (0) to extremely agree (10))
We think these programs would cause us a lot of trouble but offer little benefits
We think these programs can truly help poverty-stricken households
We think that the electric utility will not use the money as promised
We believe that some people will be able to take advantage of this program for their own benefit
We want the utility operators/government to participate in such programs as well (e.g., by matching the credits donated to poverty-stricken households)
Interest in the provision of additional IHD information
(The avilable choices ranged from not at all interested (0) to extremely interested (10))
Information regarding the average household electricity consumption of their community
Information regarding the sources where electricity comes from
Interpretive information about how much electricity I have conserved through DR programs
Interpretive information about how much electricity I have helped other households consume through PP and PP+
Information regarding an expected or recently experienced natural disaster in the area
Emergency audiovisual signal/alarm in case of an occurring natural disaster (e.g., earthquake)

Appendix B. Interview Questions

Table A2. A non-exhaustive sample of the semi-structured interview questions.
Interview Questions
Are household/demographic characteristics influential factors for residential DR?
What is the role of a given electricity provider in the adoption rate of residential DR?
Do households have a good understanding of DR and to what extent are they informed on how to shift/curtail their load?
Are households receptive to automation?
How easy is it for residential users to save money thorugh DR?
What are some reasons residential users might not want to participate in DR?
What kind of information is available on an average IHD?
Do you think DR can be used to alleviate energy poverty in Japan?

References

  1. Strbac, G. Demand side management: Benefits and challenges. Energy Policy 2008, 36, 4419–4426. [Google Scholar] [CrossRef]
  2. Kroposki, B. Integrating high levels of variable renewable energy into electric power systems. J. Mod. Power Syst. Clean Energy 2017, 5, 831–837. [Google Scholar] [CrossRef] [Green Version]
  3. Lee, H. The Lesson From Demand Response in Japan. People Int. J. Soc. Sci. 2017, 3, 26–38. [Google Scholar] [CrossRef] [Green Version]
  4. Okushima, S. Measuring energy poverty in Japan, 2004–2013. Energy Policy 2016, 98, 557–564. [Google Scholar] [CrossRef] [Green Version]
  5. Smith, A.M.; Brown, M.A. Demand response: A carbon-neutral resource? Energy 2015, 85, 10–22. [Google Scholar] [CrossRef] [Green Version]
  6. Aghaei, J.; Alizadeh, M.I. Demand response in smart electricity grids equipped with renewable energy sources: A review. Renew. Sustain. Energy Rev. 2013, 18, 64–72. [Google Scholar] [CrossRef]
  7. Gilbraith, N.; Powers, S.E. Residential demand response reduces air pollutant emissions on peak electricity demand days in New York City. Energy Policy 2013, 59, 459–469. [Google Scholar] [CrossRef]
  8. Grunewald, P.; Diakonova, M. Flexibility, dynamism and diversity in energy supply and demand: A critical review. Energy Res. Soc. Sci. 2018, 38, 58–66. [Google Scholar] [CrossRef]
  9. De Castro, L.; Dutra, J.; Figer, V. The economics of the smart grid. In Proceedings of the 2011 49th Annual Allerton Conference on Communication Control and Computing, Urbana, IL, USA, 28–30 September 2011; pp. 351–401. [Google Scholar] [CrossRef]
  10. Morstyn, T.; Farrell, N.; Darby, S.J.; McCulloch, M.D. Using peer-to-peer energy-trading platforms to incentivize prosumers to form federated power plants. Nat. Energy 2018, 3, 94–101. [Google Scholar] [CrossRef]
  11. Iliopoulos, N.; Esteban, M.; Kudo, S. Assessing the willingness of residential electricity consumers to adopt demand side management and distributed energy resources: A case study on the Japanese market. Energy Policy 2020, 137, 111169. [Google Scholar] [CrossRef]
  12. Morita, K.; Ishida, C.; Onishi, A.; Kawahara, S. Estimating changes in residential behavior and energy consumption due to the introduction of demand response systems. Proc. J. Jpn. Soc. Civ. Eng. Ser. G (Environ. Res.) 2015, 71, 357–368. [Google Scholar] [CrossRef] [Green Version]
  13. Rohman, A.; Kobayashi, H. The Possibility of Japanese Households’ Acceptance of Power Outages as an Incentive-Based Demand Response Program for Power System Maintenance. J. Rural Plan. Assoc. 2016, 35, 207–212. [Google Scholar] [CrossRef]
  14. Mi, L.; Nie, R.; Li, H.; Li, X. Empirical research of social norms affecting urban residents low carbon energy consumption behavior. Energy Proc. 2011, 5, 229–234. [Google Scholar] [CrossRef] [Green Version]
  15. Parrish, B.; Heptonstall, P.; Gross, R.; Sovacool, B.K. A systematic review of motivations, enablers and barriers for consumer engagement with residential demand response. Energy Policy 2020, 138, 111221. [Google Scholar] [CrossRef]
  16. Batalla-Bejerano, J.; Trujillo-Baute, E.; Villa-Arrieta, M. Smart meters and consumer behaviour: Insights from the empirical literature. Energy Policy 2020, 144, 111610. [Google Scholar] [CrossRef]
  17. Bamberg, S.; Möser, G. Twenty years after Hines, Hungerford, and Tomera: A new meta-analysis of psycho-social determinants of pro-environmental behaviour. J. Environ. Psychol. 2007, 27, 14–25. [Google Scholar] [CrossRef]
  18. Barr, S.; Gilg, A.W.; Ford, N. The household energy gap: Examining the divide between habitual- and purchase-related conservation behaviours. Energy Policy 2005, 33, 1425–1444. [Google Scholar] [CrossRef]
  19. Hafner, R.J.; Elmes, D.; Read, D. Promoting behavioural change to reduce thermal energy demand in households: A review. Renew. Sustain. Energy Rev. 2019, 102, 205–214. [Google Scholar] [CrossRef] [Green Version]
  20. Gyamfi, S.; Krumdieck, S.; Urmee, T. Residential peak electricity demand response—Highlights of some behavioural issues. Renew. Sustain. Energy Rev. 2013, 25, 71–77. [Google Scholar] [CrossRef] [Green Version]
  21. Parrish, B.; Gross, R.; Heptonstall, P. On demand: Can demand response live up to expectations in managing electricity systems? Energy Res. Soc. Sci. 2019, 51, 107–118. [Google Scholar] [CrossRef]
  22. EU Commision DG Energy. Impact Assessment Study on Downstream Flexibility, Price Flexibility, Demand Response & Smart Metering. July 2016. Available online: https://ec.europa.eu/energy/sites/ener/files/documents/demand_response_ia_study_final_report_12-08-2016.pdf (accessed on 8 July 2016).
  23. Karlin, B.; Zinger, J.F.; Ford, R. The Effects of Feedback on Energy Conservation: A Meta-Analysis. Am. Psychol. Assoc. 2015, 141, 1205–1227. [Google Scholar] [CrossRef]
  24. Schwartz, L.; Wei, M.; Morrow, W.; Deason, J.; Schiller, S.R.; Leventis, G.; Smith, S.; Leow, W.L.; Levin, T.; Plotkin, S.; et al. Electricity end Uses, Energy Efficiency, and Distributed Energy Resources Baseline; Energy Analysis and the Environmental Impacts Division Lawrence Berkeley National Laboratory: Berkeley, CA, USA, 2017; p. 77. [Google Scholar]
  25. Morris, P.; Vine, D.; Buys, L. Application of a bayesian network complex system model to asuccessful community electricity demand reduction program. Energy 2015, 84, 63–74. [Google Scholar] [CrossRef] [Green Version]
  26. Iliopoulos, N.; Onuki, M.; Esteban, M.; Nistor, I. Expert assessment of prioritized determinants for a smarter grid through the lens of residential demand response: The case study of Ontario, Canada (under review). Sustain. Sci. 2021. Available online: https://arxiv.org/pdf/1907.03470.pdf (accessed on 28 April 2020).
  27. Abi Ghanem, D.; Mander, S. Designing consumer engagement with the smart grids of the future: Bringing active demand technology to everyday life. Technol. Anal. Strateg. Manag. 2014, 26, 1163–1175. [Google Scholar] [CrossRef]
  28. Kim, J.; Shcherbakova, A. Common failures of demand response q. Energy 2011, 36, 873–880. [Google Scholar] [CrossRef]
  29. Bird, J. Developing the Smarter Grid: The Role of Domestic and Small and Medium Enterprise Customers; Elsevier: Amsterdam, The Netherlands, 2016. [Google Scholar] [CrossRef]
  30. Faruqui, A.; George, S. Quantifying customer response to dynamic pricing. Electr. J. 2005, 18, 53–63. [Google Scholar] [CrossRef]
  31. Carmichael, R.; Schofield, J.; Woolf, M.; Bilton, M.; Ozaki, R.; Strbac, G. Residential Consumer Attitudes to Time-Varying Pricing; Imperial College London: London, UK, 2014. [Google Scholar]
  32. Horne, C.; Kennedy, E.H. The power of social norms for reducing and shifting electricity use. Energy Policy 2017, 107, 43–52. [Google Scholar] [CrossRef] [Green Version]
  33. Wallis, H.; Nachreiner, M.; Matthies, E. Adolescents and electricity consumption; Investigating sociodemographic, economic, and behavioural influences on electricity consumption in households. Energy Policy 2016, 94, 224–234. [Google Scholar] [CrossRef]
  34. Cialdini, R. Influence: Science and Practice; Writers of the Round Table Press: Maine, TX, USA, 2003. [Google Scholar]
  35. Lopes, M.A.R.; Henggeler, C.; Janda, K.B.; Peixoto, P.; Martins, N. The potential of energy behaviours in a smart (er) grid: Policy implications from a Portuguese exploratory study. Energy Policy 2016, 90, 233–245. [Google Scholar] [CrossRef]
  36. Buchanan, K.; Banks, N.; Preston, I.; Russo, R. The British public’ s perception of the UK smart metering initiative: Threats and opportunities. Energy Policy 2016, 91, 87–97. [Google Scholar] [CrossRef] [Green Version]
  37. AECOM. Energy Demand Research Project: Final Analysis; AECOM: Los Angeles, CA, USA, 2011. [Google Scholar]
  38. Wiekens, C.; Van Grootel, M.; Steinmeijer, S. Experiences and behaviours of end-users in a smart grid: The influence of values, attitudes, trust and several types of demand side managemnet. In Proceedings of the BEHAVE2014—Behavior and Energy Efficiency Conference, Oxford, UK, 3–4 September 2014. [Google Scholar]
  39. Li, D.; Menassa, C.C.; Karatas, A. Energy Research & Social Science Energy use behaviors in buildings: Towards an integrated conceptual framework. Energy Res. Soc. Sci. 2017, 23, 97–112. [Google Scholar] [CrossRef] [Green Version]
  40. Abrahamse, W.; Steg, L. Factors Related to Household Energy Use and Intention to Reduce It: The Role of Psychological and Socio-Demographic Variables. Hum. Ecol Rev. 2011, 18, 30–40. [Google Scholar]
  41. Bradley, P.; Coke, A.; Leach, M. Financial incentive approaches for reducing peak electricity demand, experience from pilot trials with a UK energy provider. Energy Policy 2016, 98, 108–120. [Google Scholar] [CrossRef] [Green Version]
  42. Western Power Distribution. SoLa Bristol SDRC 9.8 Final Report; Western Power Distribution: Bristol, UK, 2016. [Google Scholar]
  43. Hall, N.L.; Jeanneret, T.D.; Rai, A. Cost-reflective electricity pricing: Consumer preferences and perceptions. Energy Policy 2016, 95, 62–72. [Google Scholar] [CrossRef]
  44. Fell, M.J.; Shipworth, D.; Huebner, G.M.; Elwell, C.A. Public acceptability of domestic demand-side response in Great Britain: The role of automation and direct load control. Energy Res. Soc. Sci. 2015. [Google Scholar] [CrossRef] [Green Version]
  45. Buryk, S.; Mead, D.; Mourato, S.; Torriti, J. Investigating preferences for dynamic electricity tariffs: The effect of environmental and system bene fi t disclosure. Energy Policy 2020, 80, 190–195. [Google Scholar] [CrossRef] [Green Version]
  46. Allcott, H. Rethinking real-time electricity pricing. Resour. Energy Econ. 2011, 33, 820–842. [Google Scholar] [CrossRef] [Green Version]
  47. Ek, K.; Patrik, S. The devil is in the details: Household electricity saving behavior and the role of information. Energy Policy 2010, 38, 1578–1587. [Google Scholar] [CrossRef]
  48. Engels, J.; Guldentops, D. Quantifying the Flexibility of Residential Electricity Demand in 2050 Through Price Elasticities: A Bottom-up Approach. In Proceedings of the IEEE PowerTech Conference, Eindhoven, The Netherlands, 29–2 July 2015. [Google Scholar]
  49. Wood, G.; Day, R.; Creamer, E.; van der Horst, D.; Hussain, A.; Liu, S.; Shukla, A.; Iweka, O.; Gaterell, M.; Petridis, P.; et al. Sensors, sense-making and sensitivities: UK household experiences with a feedback display on energy consumption and indoor environmental conditions. Energy Res. Soc. Sci. 2018, 55, 93–105. [Google Scholar] [CrossRef]
  50. Di Cosmo, V.; O’Hora, D. Nudging electricity consumption using TOU pricing and feedback: Evidence from Irish households. J. Econ. Psychol. 2017, 61, 1–14. [Google Scholar] [CrossRef] [Green Version]
  51. Schultz, P.W.; Estrada, M.; Schmitt, J.; Sokoloski, R.; Silva-Send, N. Using in-home displays to provide smart meter feedback about household electricity consumption: A randomized control trial comparing kilowatts, cost, and social norms. Energy 2015, 90, 351–358. [Google Scholar] [CrossRef] [Green Version]
  52. Ben-Haim, Y. Feedback for energy conservation: An info-gap approach. Energy 2021, 223, 119957. [Google Scholar] [CrossRef]
  53. Chatzigeorgiou, I.M.; Andreou, G.T. A systematic review on feedback research for residential energy behavior change through mobile and web interfaces. Renew. Sustain. Energy Rev. 2021, 135, 110187. [Google Scholar] [CrossRef]
  54. Department of Energy and Climate Change. Smart Meters: Research into Public Attitudes; Department of Energy and Climate Change: London, UK, 2012. [Google Scholar]
  55. U.S. Department of Energy. Advanced Metering Infrastructure and Customer Systems—Results from the Smart Grid Investment Grand Program; U.S. Department of Energy: Germantown, MD, USA, 2016.
  56. Han, Y.; Shi, J.; Yang, Y.; Wang, Y. Direct rebound effect for electricity consumption of urban residents in China based on the spatial spillover effect. Energies 2019, 12, 2069. [Google Scholar] [CrossRef] [Green Version]
  57. Manzoor, D.; Aghababaei, M.; Haqiqi, I. Rebound Effects of Electricity Efficiency Improvements in Iran: A CGE Approach. Q. Energy Econ. Rev. 2011, 8, 1–23. [Google Scholar]
  58. Nilsson, A.; Wester, M.; Lazarevic, D.; Brandt, N. Smart homes, home energy management systems and real-time feedback: Lessons for changing energy consumption behavior from a Swedish field study. Energy Build. 2018, 179, 15–25. [Google Scholar] [CrossRef]
  59. Nilsson, A. Personal and social factors that influence pro-environmental concern and behaviour: A review. Int. J. Psychol. 2016. [Google Scholar] [CrossRef]
  60. Yamada, H.; Uosaki, K. National Report of Japan. In Proceedings of the Third United Nations Conference on Housing and Sustainable Urban Development, Quito, Ecuador, 17–20 October 2016; pp. 1–15. Available online: http://habitat3.org/wp-content/uploads/Habitat-III-National-Report-Japan-final.pdf (accessed on 20 January 2020).
  61. Gu, D. Exposure and Vulnerability to Natural Disasters for World’s Cities; Technical Paper No. 4; United Nations Department of Economic and Social Affairs: New York, NY, USA, 2019; pp. 1–43. Available online: https://www.un.org/en/development/desa/population/publications/pdf/technical/TP2019-4.pdf (accessed on 20 January 2020).
  62. Falkiner, L. Impact Analysis of the Canadian Red Cross Expect the Unexpected Program; Institute for Catastrophic Loss Reduction: Toronto, ON, USA, 2003. [Google Scholar]
  63. Diekman, S.T.; Kearney, S.P.; Neil, M.E.O.; Mack, K.A. Qualitative Study of Homeowners’ Emergency Preparedness: Experiences, Perceptions, and Practices. Prehosp. Dis. Med. 2014. [Google Scholar] [CrossRef] [PubMed] [Green Version]
  64. Yotsui, M.; Campbell, C.; Honma, T. Collective action by older people in natural disasters: The Great East Japan Earthquake. Ageing Soc. 2016, 36, 1052–1082. [Google Scholar] [CrossRef] [Green Version]
  65. Ullah, M.H.; Park, J.D. Peer-to-peer energy arbitrage in prosumer-based smart residential distribution system. In Proceedings of the 2019 IEEE Energy Conversion Congress and Exposition, ECCE, Baltimore, MD, USA, 29 September–3 October 2019; pp. 508–514. [Google Scholar] [CrossRef]
  66. Phimister, E.; Vera-Toscano, E.; Roberts, D. The dynamics of energy poverty: Evidence from Spain. Econ. Energy Environ. Policy 2015, 4, 153–166. [Google Scholar] [CrossRef] [Green Version]
  67. Boardman, B. Fixing Fuel Poverty: Challenges and Solutions; Routledge: London, UK, 2010. [Google Scholar]
  68. Japan Posting Cooperation. Kanagawa Prefecture World Band Number (Excel). 2009. Available online: http://www.pos-kanto.jp/kanagawa/index.html (accessed on 22 February 2020).
  69. Schnirring, L. Japan Has 1st Novel Coronavirus Case, China Reports Another Death. CIDRAP. 2020. Available online: https://www.cidrap.umn.edu/news-perspective/2020/01/japan-has-1st-novel-coronavirus-case-china-reports-another-death (accessed on 2 March 2020).
  70. Smithson, M. Confidence Intervals. In International Encyclopedia of Statistical Science; Springer: Berlin, Germany, 2011. [Google Scholar] [CrossRef]
  71. Likert, R. A technique for the measurement of attitudes. Arch. Psychol. 1932, 22, 1–55. [Google Scholar]
  72. Hodge, D.R.; Gillespie, D. Phrase completions: An alternative to Likert scales. Soc. Work Res. 2003, 27, 45–55. [Google Scholar] [CrossRef]
  73. Leung, S.O. A comparison of psychometric properties and normality in 4-, 5-, 6-, and 11-point likert scales. J. Soc. Serv. Res. 2011, 37, 412–421. [Google Scholar] [CrossRef]
  74. Alwin, D.F. Feeling thermometers versus 7-point scales: Which are better? Sociol. Methods Res. 1997, 25, 318–340. [Google Scholar] [CrossRef] [Green Version]
  75. Päivärinta, T.; Pekkola, S.; Moe, C. Grounding Theory from Delphi Studies. In Proceedings of the ICIS 2011, Shanghai, China, 4–7 December 2011; pp. 1–14. [Google Scholar]
  76. Francis, J.J.; Johnston, M.; Robertson, C.; Glidewell, L.; Entwistle, V.; Eccles, M.P.; Grimshaw, J.M. What is an adequate sample size? Operationalising data saturation for theory-based interview studies. Psychol. Health 2010, 25, 1229–1245. [Google Scholar] [CrossRef] [PubMed] [Green Version]
  77. Guest, G.; Bunce, A.; Johnson, L. How Many Interviews Are Enough?: An Experiment with Data Saturation and Variability. Field Methods 2006, 18, 59–82. [Google Scholar] [CrossRef]
  78. Hamidi, V.; Li, F.; Robinson, F. Demand response in the UK’s domestic sector. Electr. Power Syst. Res. 2009, 79, 1722–1726. [Google Scholar] [CrossRef] [Green Version]
  79. Okada, T.; Tamaki, T.; Managi, S. Effect of environmental awareness on purchase intention and satisfaction pertaining to electric vehicles in Japan. Transp. Res. Part D 2019, 67, 503–513. [Google Scholar] [CrossRef]
  80. Druckman, A.Ã.; Jackson, T. Household energy consumption in the UK: A highly geographically and socio-economically disaggregated model. Energy Policy 2008, 36, 3177–3192. [Google Scholar] [CrossRef] [Green Version]
  81. Santin, O.G.; Itard, L.; Visscher, H. The effect of occupancy and building characteristics on energy use for space and water heating in Dutch residential stock. Energy Build. 2009, 41, 1223–1232. [Google Scholar] [CrossRef]
  82. Rogers, E.M. Diffusion of Innovations; Free Press: New York, NY, USA, 2003. [Google Scholar]
  83. Hanson, V. Influencing technology adoption by older adults. Interact. Comput. 2010, 22, 502–509. [Google Scholar] [CrossRef]
  84. Stoll, P.; Brandt, N.; Nordström, L. Including dynamic CO2 intensity with deemand response. Energy Policy 2013, 65, 490–500. [Google Scholar] [CrossRef]
  85. Miorandi, D.; Sicari, S.; De Pellegrini, F.; Chlamtac, I. Ad Hoc Networks Internet of things: Vision, applications and research challenges. Ad Hoc Netw. 2012, 10, 1497–1516. [Google Scholar] [CrossRef] [Green Version]
  86. Labeeuw, D.R.W.; Beusen, B.; Claessens, S.; Deconinck, G.; Vanthournout, K. Demand response flexibility and flexibility potential of residential smart appliances: Experiences from large pilot test in Belgium. Appl. Energy 2015, 155, 79–90. [Google Scholar] [CrossRef]
  87. Powells, G.; Bulkeley, H.; Bell, S.; Judson, E. Geoforum Peak electricity demand and the flexibility of everyday life. Geoforum 2014, 55, 43–52. [Google Scholar] [CrossRef] [Green Version]
  88. Schultz, P.W. Strategies for promoting proenvironmental behavior: Lots of tools but few instructions. Eur. Psychol. 2014, 19, 107–117. [Google Scholar] [CrossRef]
Figure 1. An overview of the methodological framework adopted in this study.
Energies 14 02795 g001
Figure 2. An overview of a multi-class philanthropic DR, adapted from [10].
Energies 14 02795 g002
Figure 3. Map of Yokohama Smart City, showing the names of the wards where the questionnaire survey was distributed (the map was created by the authors using ArcGIS).
Energies 14 02795 g003
Figure 4. An overview of Grounded Delphi Method adapted from Päivärinta et al. [75].
Energies 14 02795 g004
Table 1. Basic information describing the survey respondents.
ContentsItemsSurvey Results
NProportion
Respondent’s Demographic Information
Age18–34 years old55.6%
35–54 years old2427%
55–64 years old2427%
65 or more3640.4%
GenderMale5763.3%
Female3336.7%
Other--
EducationLess than high school11.1%
High school1314.4%
Professional certification1516.6%
Bachelor’s degree5055.6%
Master’s degree55.6%
Doctorate degree66.7%
Work statusEmployed full-time4044.9%
Employed part-time89.0%
Not currently employed89.0%
Retired2022.5%
Homemaking1011.2%
Student--
Other33.4%
Members per household11314.3%
23639.6%
31920.9%
42022.0%
5 or more22.2%
Average annual household income (USD equivalent)Less than $8999
$9000–$44,9992834.1%
$45,000–$89,9992530.5%
$90,000–$137,0001822%
$138,000 or more1113.4%
Resident statusOwn8087.9%
Rent1112.1%
Respondent’s Household Information
Household size (sq. m.)Less than 19 m2
20–29 m211.1%
30–49 m233.4%
50–69 m21314.6%
70–89 m266.7%
90–109 m22528.1%
110–129 m21516.9%
130–149 m21415.7%
150 m2 or more1213.5%
Type of in-home display (IHD)None7481.3%
Manual IHD1314.3%
Programmable IHD11.1%
IHD with WIFI22.2%
Smart IHD (capable of “learning” a household’s preferences)11.1%
Smart appliance(s)None8189.0%
One1011.0%
Two or more
Electric vehicle(s)None6773.6%
One1516.5%
Two or more99.9%
Photovoltaic systemsNo8896.7%
Yes33.3%
Table 2. Overview of consumers opinion on the socio/environmental reputation of their energy provider, and their intrapersonal preferences as energy consumers.
ContentsNMeanStd. Deviation
Opinion on Electricity Provider
Electricity provider is a credible source of information844.152.35
Electricity provider is actively promoting programs to help its customers save money854.182.52
Electricity provider is operating in an environmentally responsible manner844.272.52
I am overall satisfied with my electricity provider874.871.97
Intrapersonal information
I believe that my electricity provider should be actively engaged in environmentally sustainable activities (e.g., through investments in renewables)868.012.43
I believe that my electricity provider should be actively engaged in socially responsible activities (e.g., through philanthropic-oriented contributions)866.102.70
Comfort is very important to me-even if it means spending more money on electricity853.422.02
There isn’t much I can do to save money on electricity853.922.11
I am generally concerned about the environment868.961.90
Conserving electricity at home cannot alleviate climate change/environmental degradation833.732.00
I am an early adopter of new home technologies843.462.01
Note: A 10 point-Likert scale was used for identifying whether this study’s respondents disagreed (0-point) or agreed (10-point) with the above statements.
Table 3. Descriptive analysis of the 27 variables examined in this study.
ContentsNMeanStd. Deviation
Variables pertaining to DR programs
Contemporary DR programs
Time of use (TOU)886.572.98
Real time pricing (RTP)896.312.87
Critical peak pricing (CPP)905.323.06
Direct load control (DLC)905.383.11
Direct load control with an annual financial incentive (DLC+)907.122.77
Proposed philanthropical demand response program
Philanthropic program (PP)905.482.91
Philanthropic program with a financial incentive (PP+)906.622.87
Variables with potential influence on the DR programs examined
Contemporary DR programs
We do not want to worry about electricity price fluctuating throughout the day854.372.70
We think these programs would cause us a lot of trouble and offer little benefits865.402.83
We think that these programs’ true goal is not to help us save money866.662.65
We want to be left alone to use electricity when/how we want853.181.91
We are concerned that we would not be able to conserve electricity during “peak” hours835.282.89
We think these programs are straightforward and easy to follow844.662.44
We do not know how to reduce electricity during “peak” hours865.562.57
We think we can save money with these type of programs845.362.47
We do not like the idea of the utility “talking” to/controlling our smart devices846.392.67
Proposed philanthropical DR programs
We think these programs would cause us a lot of trouble but offer little benefits855.272.41
We think these programs can truly help poverty-stricken households855.712.57
We think that the electric utility will not use the money as promised846.202.70
We believe that some people will be able to take advantage of this program for their own benefit867.232.27
We want the utility operators/government to participate in such programs as well (e.g., by matching the credits donated to poverty-stricken households)836.242.54
Interest to receive additional information on the IHD unit
Information regarding the average household electricity consumption of their community835.322.81
Information regarding the sources where electricity comes from836.832.62
Interpretive information about how much electricity I have conserved through DR programs857.172.74
Interpretive information about how much electricity I have helped other households consume through PP and PP+835.592.92
Information regarding an expected or recently experienced natural disaster in the area837.502.63
Emergency audiovisual signal/alarm in case of an occurring natural disaster (e.g., earthquake)848.252.24
Note: Likert-scale ranged from not at all interested (0-point) to extremely interested (10-point) for examining respondents’ interest in DR whereas for the potential factors influencing DR it ranged from extremely disagree (0-point) to extremely agree (10-point).
Table 4. Correlation coefficients amongst variables.
ContentsTOURTPCPPDLCDLC+PPPP+
Household characteristics
Income−0.239 *
Ownership of electric vehicle(s)−0.274 *
Intrapersonal information
Comfort is very important to me-even if it means spending more money on electricity0.298 *0.315 *
Conserving electricity at home cannot alleviate climate change/environmental degradation−0.234 *
I believe that my electricity provider should be actively engaged in environmentally sustainable activities (e.g., through investment in renewables)0.355 **0.316 *
I believe that my electricity provider should be actively engaged in socially responsible activities (e.g., through philanthropic-oriented contributions)0.556 **
Variables for traditional DR programs
We do not want to worry about electricity price fluctuating throughout the day−0.257 *0.260 *N/AN/A
We think these programs would cause us a lot of trouble and offer little benefits−0.219 *−0.326 *−0.320 *−0.301 *N/AN/A
We want to be left alone to use electricity when/how we want−0.285 *−0.229 *−0.280 *−0.350 **N/AN/A
We think these programs are straight forward and easy to follow0.312 *0.343 ** N/AN/A
We think we can save money with these type of programs0.475 **0.343 **0.323 *N/AN/A
We do not like the idea of the utility “talking” to/controlling our smart devices−0.436 **−0.336 *N/AN/A
Variables for proposed DR programs
We think these programs would cause us a lot of trouble but offer little personal benefitsN/AN/AN/AN/AN/A−0.436 **−0.367 **
We think these programs can truly help poverty-stricken householdsN/AN/AN/AN/AN/A0.573 **0.563 **
We think that the electric utility will not use the money as promisedN/AN/AN/AN/AN/A−0.305 *
We want the utility operators/government to participate in such programs as well (e.g., by partially matching the credits donated to poverty-stricken households)N/AN/AN/AN/AN/A0.502 **0.503 **
Variables for IHD information
Information regarding the average household electricity consumption of their community0.233 *0.297 *
Information regarding the sources where electricity comes from0.256 *0.240 *0.318 **
Interpretive information about how much electricity I have conserved through DR programs0.228 *0.218*0.270*
Interpretive information about how much electricity I have helped other households consume through PP and PP+N/AN/AN/AN/AN/A0.405 **0.486 **
Information regarding expected or recently experienced natural disaster in the area0.391 **0.315 *0.328 *
Emergency audiovisual signal/alarm in case of an occurring natural disaster (e.g., earthquake)0.358 **
Note 1: Time of use (TOU), real time pricing (RTP), critical peak pricing (CPP), direct load control (DLC), direct load control with annual financial incentive (DLC+), philanthropic program (PP), philanthropic program with financial incentive (PP+). Note 2: One asterisk (*) symbolizes a statistically significant relationship at p < 0.05 while two asterisks (**) symbolize a statistically significant relationship at p < 0.01.
Table 5. Factors that could potentially influence the adoption of specific residential DR programs.
FactorsDR Programs
TraditionalProposed
TOURTPCPPDLCDLC+PPPP+
Household income
Ownership of electric vehicles
Comfort prioritization +
Fluctuating electricity prices
Inadequate benefits
DR is easy to use ++
DR could help us save money +++
Philanthropic inclinations ++
Prioritized household interest in DR3476152
Note 1: The sign (+) indicates a positive influence whereas the sign (−) indicates a negative influence.
Publisher’s Note: MDPI stays neutral with regard to jurisdictional claims in published maps and institutional affiliations.

