Abstract
Time-of-use (TOU) electricity tariffs are a demand side measure to ease balancing of demand and supply to cope with a rising share of renewables in a country’s electricity mix. In general, consumers require compensation for accepting these tariffs. This study analyzes how attitudes drive consumers’ willingness to choose a TOU tariff in Germany. To identify attitudinal profiles, I use an exploratory factor analysis on items capturing positive and negative attitudes towards TOU tariffs, climate change awareness, and belief in energy saving measures. I use these factors as predictors in an ordered logit specification to estimate consumers’ stated willingness to choose a TOU tariff. Three factors are significant: positive and negative attitudes towards TOU tariffs, and climate change awareness. These findings highlight that decision makers who aim at balancing demand and supply through the use of TOU tariffs should focus on informing consumers about the positive impacts of these tariffs on climate change mitigation, grid stability, and possible energy savings.
1. Introduction
Two major issues in electricity markets are the volatility in renewable energy generation and peak demand. Both force network operators to costly redispatch in order to avoid outages when electricity demand and supply are unbalanced [1]. This holds true as long as storage technologies are not mature. Electricity tariffs with prices that reflect excess demand or supply, such as time-of-use tariffs (TOU), dynamic pricing (including real-time pricing) or critical peak time pricing, are prominent demand side measures to balance demand and supply. Given the current energy policy goals of a rising share of renewables in the electricity mix, acceptance of such measures is crucial.
In the USA, India, and 17 European countries (including Germany) time differentiated electricity tariffs were available in 2019 [2]. Several member states of the European Union (and Norway and UK) already offer real-time tariffs or other dynamic tariffs (Austria, Denmark, Estonia, Finland, Latvia, the Netherlands, Norway, Spain, Sweden, and UK), or critical peak pricing (Denmark, France, Latvia, and Slovenia); while 13 countries offered static TOU tariffs [3]. These member states already implemented the EU Directive 2019/944 [4] which states that consumers should financially benefit from demand response, e.g., real-time pricing. Germany has enacted this Directive into law in July 2021 by adding paragraph 41a to the Energiewirtschaftsgesetz [5]. However, until 2025 only large utility companies (more than 100,000 customers) have to offer at least one dynamic tariff to German end consumers, i.e., these tariffs need not necessarily be offered to private consumers [5].
Although electricity markets globally move fast forward towards real-time pricing, TOU tariffs are neither common nor widely adopted by German consumers. According to the Federal Network Agency’s most recent energy monitoring report [6], only two providers offered electricity tariffs reflecting day-ahead prices in 2019. One reason is that only around 1000 smart meters had been rolled-out in private households by 2019. Furthermore, usually only conservative day/night-time TOU tariffs are available, targeted at households with electric heating. Besides this, Germany is particularly interesting as policies are in place to expand the share of renewables in the gross electricity consumption from 45.4% in 2020 [7] to 65% in 2030 [8]. Thus, potential savings in CO2-emissions by increasing acceptance of TOU tariffs, or even real-time pricing, are promising [9], since more frequent redispatch could be avoided. A choice experiment [9] conducted nearly one year after the survey in which this paper is based on, revealed that about 70% of respondents would at least consider to choose TOU tariffs that are tied to electricity demand and supply, in Germany. Even though significant preference heterogeneity was found in this study, it was not possible to explain what drives observed heterogeneity.
Hence, this work analysis to what extent attitudes drive heterogeneity in preferences for TOU tariffs. The novelty is that, instead of including just a single behavioral aspect, 25 statements measuring attitudes towards TOU tariffs, climate change, and energy saving measures reduced to four factors are used to estimate respondents’ preferences for TOU tariffs. Hereby, preference is measured by respondents’ agreement with the statement about whether they would rather purchase a TOU tariff than their current tariff. Since the underlying survey was conducted in Germany, where these tariffs are still uncommon, this study is restricted to TOU tariffs with electricity prices tied to electricity demand and supply to decrease respondents’ cognitive burden.
The paper is structured as follows. Section 2 provides a brief overview on previous studies discussing the role of selected attitudes in preferences for TOU tariffs and presents their relevance in a broader energy context. Section 3 describes the underlying behavioral theories and how they were acknowledged in the survey. Furthermore, it presents the econometric approach and the data set. Section 4 comprises the results of a factor analysis on respondents’ attitudes, an estimation of respondents’ willingness to choose a TOU tariff using the identified factors as explanatory variables, and insight into the predictive power of the final model. Section 5 discusses these results while Section 6 concludes and highlights implications for decision makers and further research.
2. Literature Review
Common methods used to measure acceptance for TOU tariffs are choice experiments such as the stated preference method (e.g., [9]) and field experiments such as the revealed preference method (e.g., [10]). Choice experiments usually provide an explicit hypothetical willingness to accept depending on tariffs’ attributes, while field experiments aim at observing households’ actual behavior. Main finding of both branches is that preference heterogeneity exists but cannot fully be explained by common socio-demographic characteristics (e.g., [11]). In recent research mostly one distinct behavioral aspect (e.g., risk aversion, e.g., [12]) has been added to explain heterogeneity in preferences.
These studies agree that we observe heterogeneous preferences towards consumers’ acceptance of TOU tariffs (see [9] for a recent overview). As stated above, some studies identified single behavioral drivers of this heterogeneity. For example, Schlereth et al. [12] found in their choice experiment that consumers who are more risk-averse tend to prefer time-invariant pricing. Nicolson et al. [13] found the same for loss-averse consumers in a field experiment. In their choice experiment, Buryk et al. [14] discovered that consumers who had been informed about environmental and system benefits of TOU and dynamic tariffs had an almost 10% lower willingness to accept (WTA) than non-informed respondents. Furthermore, males exhibit a larger WTA while those who consider it rather easy to adapt their behavior exhibit a lower WTA. Discussing with focus groups, Hall et al. [15] found evidence that consumers’ awareness of environmental benefits and their ability to shift their demand influence their willingness to choose a tariff with cost-reflective pricing. In contrast to Buryk et al. [14], however, they find that men are more in favor for TOU tariffs than women. In addition, Yang et al. [10] validated that knowledge about peak and off-peak pricing in respondents’ region increases acceptance of TOU tariffs using personal interviews. Summarized, these studies have identified attitudinal drivers of preferences but only focus on selected aspects and do not explicitly rely on complex behavioral theories, such as the theory of planned behavior (TPB, [16]) or value-belief norm (VBN, [17]).
In the broader literature on energy issues, i.e., electricity prices tied to electricity consumption (e.g., [18]), load-restrictions (e.g., [19,20]), green electricity (e.g., [21,22,23,24]) or energy technologies (e.g., [25,26]), attitudes were found to explain heterogeneity in preferences. Wang et al. [18], for example, hypothesized that consumers’ willingness to choose an electricity tariff with prices tied to electricity consumption is driven by elements of TPB, verified it by factor analysis, and estimated willingness to choose this tariff using an ordered logit. They found a significant impact of environmental/global warming awareness, energy saving behavior, social pressure, and electricity literacy on acceptance.
In their choice experiment, Gołębiowska et al. [19] analyzed the impact of norms on preferences for external control of electricity consumption. They measured personal, social, and descriptive social norms using four items, and found that descriptive norms had the largest impact on preferences while personal and social had only a weak effect. Most recently, Broberg et al. [20] showed in their split sample choice experiment that people were less likely to choose their current tariff over a tariff with load-restrictions if they were previously framed in such a way that these tariffs ease renewable energy transition.
Studies focusing on preferences for green electricity mainly rely on the TPB (e.g., [22,23,24]), or its predecessor reasoned action theory (e.g., [21]). Ozaki [24] additionally took Roger’s idea of innovation-diffusion adaption, and the VBN into account. Their results show that pro-environmental attitudes and environmental concerns increase willingness to pay (WTP) for green electricity [21,23] and willingness to adapt [24]. The same holds for knowledge [21,22,23,24], belief in positive consequences [21,22], social norms [23,24], and personal benefits [24]. For energy technologies results are similar. Makki and Mosly [25] performed a factor analysis on statements they collected by an extended literature research. They identified five factors describing preferences for green technologies including public awareness. Additionally, van Rijnsoever and Farla [26] found that, again, knowledge and environmental awareness—measured using the New Environmental Paradigm (NEP, [27]) scale—drives preferences.
Since former studies showed that TPB and VBN are feasible to explain preference heterogeneity in energy-related fields, it is reasonable to adapt these concepts on preferences for TOU tariffs as well. This study, therefore, fills this gap of a broader, behavioral theory-based analysis of the role of consumers’ underlying attitudes as drivers of their willingness to choose a TOU tariff.
3. Methodology and Data
3.1. Theoretical Background
To explore attitudes as drivers of preferences for TOU tariffs, two different but overlapping theories that explain pro-environmental behavior (see [28]) are mainly tested in terms of stated willingness to choose a TOU tariff: The TPB, [16] and the VBN [17]. The relevance of common factors is, in a first step, identified through an exploratory factor analysis on statements related to consumers’ expectations about the impact of TOU tariffs, their motivation to adapt their behavior, and their climate change awareness. Subsequently, these factors are used as explanatory variables in an ordered logit model to estimate consumers’ stated willingness to choose a TOU tariff.
These two theories were chosen since Steg and Vlek [28] identified three general approaches to explain pro-environmental behavior. The first approach is that consumers weight costs and benefits of their behavior. This is constituted by the TPB [16]. The second approach assumes that consumer behavior is driven by moral and norms, based, e.g., on the VBN that combines environmental awareness (usually measured using the NEP scale [27]), beliefs and norms [17]. The third approach explains actual buying decisions by affect. As my analysis relies on stated preferences for hypothetical TOU tariffs, this approach is not further considered. Furthermore, as highlighted in the literature review, especially TPB and VBN are promising to explain energy behavior. A combination of theories may also increase exploratory power, which has been shown by Liebe et al. [29] to be related to forest conservation. Following their suggestions, this study combines and adjusts elements of TPB and VBN to test their explanatory power for preferences for TOU tariffs.
According to the TPB [16] an individual’s attitude towards a behavior, subjective norms, and perceived behavior control drive intention to behave. Related to this paper, consumers would choose a TOU tariff if they exhibit a positive attitude towards TOU tariffs, purchasing a TOU tariff would match their subjective norms, and they have the possibility to choose a TOU tariff. To be more precise, respondents form their attitude towards TOU tariffs by evaluating expected positive and negative impacts of TOU tariffs. Subjective norms cover normative beliefs (how should personal surroundings behave and how do they want one to behave?) and a feeling of moral obligation to decrease emissions ensuring mitigation of climate change. Perceived behavioral control is the extent to which respondents believe they are able to adapt a TOU tariff and how easy or difficult they find it to adapt their behavior. This includes respondents’ ability to shift their electricity demand when electricity prices are high.
The VBN [17] combines value theory, norm-activation, and environmental awareness to explain pro-environmental behavior. According to this theory, values drive one’s ecological worldview. Biospheric and altruistic values increase environmentalism, whereas egoistic values decrease it. Depending on this ecological worldview, belief in consequences of a threat is formed. Awareness of consequences results in awareness of need and responsibility to reduce a threat, and in an evaluation of ability to reduce a threat. This awareness results in action, depending on personal norms. Instead of environmental awareness, this study uses climate change awareness, which is also driven by altruism [30]. Significant climate change awareness should, hence, increase a respondent’s awareness of need of actions to mitigate climate change. If a respondent is able to adapt her behavior and believes that TOU tariffs mitigate climate change she should be willing to choose a TOU tariff.
This study measures climate change awareness using a 7-item scale adopted from the NEP scale [27]. The idea is that attitudes towards TOU tariffs are rather driven by climate change awareness than environmental awareness, since these tariffs rather mitigate CO2-emissions and, therefore, provide only an indirect environmental benefit. The NEP scale itself was first developed by Dunlap and van Liere [27]. Initially, they used 12 items covering statements about the environment to measure environmental awareness. In 1990, this scale was revised to a 15-item scale [31] called the New Ecological Paradigm Scale. In empirical applications often shorter scales are used (e.g., Pierce et al. 1987).
Additionally, this study considers that instead of pure altruism, rather, a “warm glow” [32] on mitigating climate change might influence respondents’ willingness to choose a TOU tariff. This would be in line with Hartmann et al. [33] who found that warm glow has a stronger impact on pro-environmental behavior than just altruistic values. Nevertheless, altruistic values, i.e., taking actions to increase other peoples’ welfare without gaining benefits yourself, increases the propensity to experience a warm glow, i.e., emotionally benefiting from altruistic actions [32]. In the context of green electricity Menges et al. [34] showed that warm glow indeed increases willingness to pay for green electricity.
3.2. Econometric Approach
Stated attitudes are highly correlated. Therefore, estimated coefficients of a regression model would be biased because of multicollinearity. Using factors containing most information of these stated attitudes solves this issue. Hence, an exploratory factor analysis is performed to identify relevant factors.
Lawley and Maxwell [35] showed that a linear combination of factors can explain the n observed variables:
where is the observed value of the th individual on the th behavioral statement, is the th observation on the th unobserved common factor, and is the set of linear coefficients called the factor loadings. is the th variable’s unique factor. Here, is a four-dimensional ordinal variable, hence, the analysis is based on variables’ correlation matrix, i.e., a polychoric correlation matrix [36].
Factors were retained using principal factors, and subsequently rotated ensuring better interpretation. Since for each variable uniqueness is clearly non-zero, an oblique promax rotation was performed. Promax is a simple rotation method that increases high factor loadings while decreasing low factor loadings and allows for correlated factors [37] (Using other oblique rotation methods did not significantly change results). Based on estimated factor loadings, respondents’ individual factors are predicted.
To analyze if these retained factors explain stated willingness to choose a TOU tariff, an ordered logit model is estimated. An ordered logit is a generalization of logit [38] that allows for ordinal variables. It estimates the probability that an outcome for individual falls into category by estimating the probability that a linear function of observed variables is within a range of cutpoints:
where is the cutpoint of category of the willingness to choose a TOU tariff, is the th observation on the th explanatory variable, and is the set of coefficients. is th individual’s logistically distributed error term. The econometric analysis was performed using Stata 15.1 including the user-written add-on "polychoric" by Kolenikov and Angeles [39].
3.3. Survey Design
The analysis is based on an online survey on consumers’ preferences for TOU tariffs that was carried out in March and April 2016 in Germany (even though attitudes may have changed over the last five years, results of the factor analysis will be persistent and how these factors influence willingness to choose a TOU tariff is independent of individual attitudes). The final sample comprises 990 panelists of an external panel provider (Consumerfieldwork GmbH) who incentivize their members by paying them less than 3€ per completed survey. This panel provider drew a random sample of their panel members and invited them via email to answer the survey. Quota sampling was conducted to ensure sample’s representativeness for Germany in terms of age groups and gender. Northern Germany (Northern Germany consists of the following federal states: Schleswig-Holstein, Hamburg, Lower Saxony, Bremen, and Mecklenburg-Western-Pomerania) is oversampled (50% instead of 18%) since it is disproportionately affected by the expansion of renewable energies. One shortcoming of this oversample is that the small sample size did not allow for the addition of other quotas, such as those related to housing characteristics. Respondents were at least 18 years old.
The survey (see Appendix B) included four parts: (1) screen-out questions; (2) electricity consumption related questions; (3) attitudinal questions; and (4) additional sociodemographic questions. The first part comprised questions about age, gender, and state of residence to enable a representative sample. The second part involved general questions about household’s electricity consumption, their electric appliances affecting electricity consumption (e.g., electric heating, and private microgeneration), and their current electricity tariff.
Before the attitudinal questions in part three, respondents were given information on TOU tariffs (see Appendix B; question 11). These were described as a measure to balance electricity demand and supply; i.e., a tariff with a high electricity price when demand exceeds supply and vice versa. Additionally, it was mentioned that—at least in Germany—redispatch is a costly and CO2-intensive measure to handle excess demand. Furthermore, respondents were reminded that they could actually lower their electricity bill if they shifted their electricity demand. Initially, respondents were randomly assigned to two treatments that differed by the reasoning of TOU tariffs. TOU tariffs were described as a measure to decrease electricity demand either during peak demand or when renewable energy supply is low. Since these treatments have no effect on the results of this analysis (insignificance of the treatment variable), they are treated as one sample.
Part three focused on behavioral aspects and respondents’ stated willingness to choose a TOU tariff as described in the previous paragraph (see Section 4.1 for summary statistics). At first, respondents provided information on their current electricity tariffs and drivers for their decision-making. Subsequently, respondents revealed their values, attitudes, and subjective norms based on the TPB and the VBN with regard to TOU tariffs (i.e., their climate change awareness; their evaluation of electricity saving measures; their perception of TOU tariff’s impacts; and their motivation to choose a TOU tariff; see Appendix B, questions 16–19). Each statement was measured using a four-item response scale. On these 25 statements in questions 16 to 19, the exploratory factor analysis was performed; subsequently an ordered logit was used to estimate respondents stated willingness to choose a TOU tariff (first item of question 19) using the identified factors as explanatory variable. The third part concluded with a self-assessment of respondents’ willingness to take risk using a 10-item Likert scale ranging from “absolutely not willing to take risk” to “absolutely willing to take risk” (see Appendix B, question 20). The final section contained general sociodemographic questions, such as net household income, educational attainment, and employment status.
4. Results
4.1. Descriptive Sample Statistics
Table 1 provides an overview of the sample. Note, that it is representative regarding age and gender for the target population. As usual for online surveys, respondents with a higher education level (12 to 13 years of schooling) are overrepresented. Median income, employment status and household size are similar to the target population.

Table 1.
Sociodemographic characteristics.
Turning to respondents’ current electricity tariffs (Table 2), about 20.5% have a tariff that consists of 100% renewable electricity. Only about 9% already have a TOU tariff. In Germany, these tariffs are currently designed to incur low prices at night and higher prices otherwise. This indicates that there is a high potential for shifting electricity demand in Germany. Note that, market shares of electricity tariffs are not available for Germany. However, stakeholders agree that shares of TOU tariffs, smart home tariffs and special tariffs for heat pump/night storage heating are very low. Furthermore, the market share in electricity sales of 100% renewable energy tariffs amounted to 23.1% in 2016 [40]. Assuming that average electricity consumption is independent of electricity tariff characteristics, the share of 100% renewable tariffs in this sample seems reasonable.
Table 2.
Characteristics of current electricity tariff.
Table 3, Table 4, Table 5 and Table 6 provide information on respondents’ attitudes later used for the exploratory factor analysis. Table 3 summarizes motivational aspects, i.e., subjective norms (TPB), values (VBN) and perceived behavior control (TPB). Note that the first item stated willingness to choose a TOU tariff is the dependent variable in the regression analysis. On average, respondents would rather not choose a TOU tariff instead of their current tariff. This could be related to the fact that they are unsure whether they can adjust their electricity consumption. Surprisingly, respondents disagree that their social environment would support their decision in favor of a TOU tariff. However, on average, respondents expect others to behave in an environmentally friendly way and care about others (last statement).
Table 3.
Statements measuring motivation and social norms.
Table 4.
Perceived Impacts of TOU tariffs with prices related to electricity demand and supply.
Table 5.
Feasibility of electricity saving measures.
Table 6.
Climate change awareness.
To capture awareness of the need for and consequences of TOU tariffs (VBN), as well as more general attitudes towards them (TPB), respondents were asked to rate their expectations regarding the potential impact of TOU tariffs (Table 4). Respondents on average do not clearly agree or disagree with these statements. This might relate to their inexperience with TOU tariffs. Nevertheless, respondents clearly expect increasing monthly electricity costs and increasing electricity providers’ profits by TOU tariffs.
In terms of perception of the feasibility of electricity-saving measures, Table 5 provides first insights into respondents’ attitudes towards TOU tariffs (related to TPB). On average respondents are not sure if TOU tariffs will save any electricity at all. This is understandable since the main objective of TOU tariffs is to shift electricity demand, and not to lower it. However, respondents do not believe that an increase in average electricity prices would reduce electricity demand. This may indicate that respondents are not willing to reduce their electricity consumption in general.
Table 6 summarizes respondents’ climate change awareness. Note that on average, climate change is perceived as a real, serious and human-made problem. Respondents, on average, rather disagree with the statements that climate change can be handled without limiting our lifestyles and that media exaggerates climate change.
Compared to the results of the European Social Survey on attitudes towards climate change [42] in 2016–2017 respondents are somewhat less sure that climate changes (91.3% compared to 95.4%; and agree less that humans are responsible for this change (88.5% compared to 94.8%). The latter difference in particular may result from differences in the statements that should be evaluated. While the European Social Survey asks if “climate change [is] at least partially caused by humans”, this weakening is not present in the statement in this survey. It is even more difficult to compare the statement that “climate change impacts will be bad” (77.4% agree) with “climate change is a serious problem” (90.1% at least agree). Note that a problem might be evaluated as serious without having bad impacts.
4.2. Empirical Analysis
4.2.1. Results of the Factor Analysis
The exploratory factor analysis using the 25 attitudinal statements introduced in Table 3, Table 4, Table 5 and Table 6 results in four factors that exhibit an eigenvalue larger than one (see Appendix A., Table A1 for detailed results). They explain 99% of the variation in the items based on the Kaiser Criteria [43]. The fifth factor does not provide much additional information; hence, this factor and the following are excluded from further analyses. The overall Kaiser–Meyer–Olkin criteria of sampling adequacy [44] is meritorious (0.8753).
Table 7 presents the rotated factor loadings larger than 0.3, and items’ uniqueness, i.e., how much of each item’s variance is not explained by factors. Note that each item only belongs to a single factor. Some items have a uniqueness larger than 0.6 or even 0.8 (expecting electricity shortage) indicating that these items are less well explained by the factors. Since this study does not aim to find the best factor but a feasible predictor, these items remain in the present analysis.
Table 7.
Rotated factors.
The first factor named Positive Attitude towards TOU Tariffs comprises positive statements on TOU tariffs. It relates to the main elements of the TPB and parts of the VBN, such as awareness of consequences and need. Attitude in the sense of TPB includes its feasibility as an electricity saving measure as well as its positive effects. Additionally, Positive Attitude includes respondents’ subjective norms, their perceived behavioral control, and their sense of ‘warm glow’. Its counterpart, Negative Attitude towards TOU Tariffs, measures respondents’ expectations of negative impacts and their belief that they are already doing enough to save energy. The factor Climate Change Awareness includes the items of the climate change awareness scale plus altruism; hence, it captures values in the sense of the VBN. The last factor measures respondents’ Belief in Energy Saving Measures in general.
Using all factor loadings (including those below 0.3) factors are predicted for each respondent. Factor means are standardized to zero. Standard deviation ranges from 0.81 (Negative Attitude) to 0.90 (Positive Attitude). T-tests on differences in factor means suggest that females exhibit a significantly more Positive Attitude (5%-level) and less Negative Attitude towards TOU Tariffs (1%-level). Furthermore, they are more Climate Change Aware (1%-level) and have a stronger Belief in Energy Saving Measures (1%-level). Moreover, I found regional differences. Respondents living in northern Germany exhibit a more Positive (5%-level) and less Negative Attitude towards TOU Tariffs (5%-level) as well as a higher Climate Change Awareness (5%-level) compared to respondents from other parts of Germany. One possible explanation could be that a lot of renewable energy is generated in northern Germany. Further t-tests show that respondents with a 100% renewables tariff are more Climate Change Aware (5%-level). Income does not play a significant role in attitude formation.
4.2.2. Results of the Regression Analysis
This aimed to analyze if behavioral attitudes, i.e., the identified factors, explain if respondents are more willing to choose a TOU tariff than their current tariff (Table 8). Note that factors’ coefficients relate to effects that deviate from mean attitudes.
Table 8.
Ordered Logit models to predict willingness to choose a TOU tariff.
The first model (Model 1) includes only the above factors as explanatory variables. A more Positive than average Attitude towards TOU Tariffs has a large positive significant effect on willingness to choose a TOU tariff and explains most of the variation; Negative Attitude has a small negative significant effect. Climate Change Awareness and Belief in Energy Saving Measures have no significant effect in this model. However, using principal factors in a factor analysis allows for correlated factors. Indeed, Climate Change Awareness and Belief in Energy Saving Measures are significantly (1%-level) correlated (Spearman’s rho = 0.4758). Therefore, Model 2 excludes Belief in Energy Saving Measures, and Model 3 excludes Climate Change Awareness to check if their effects overlap. In Model 2 the effect of Climate Change Awareness is small and negative, and significant only at the 10%-level. This indicates that respondents who are more climate change conscious are more likely to believe that energy should be saved in general, rather than just shifting demand.
Model 4 extends Model 2 such that it includes additional covariates, which are not correlated with any factor. Respondents who consider themselves as less willing to take risks have a higher willingness to choose a TOU tariff. Furthermore, respondents who are already planning to change their electricity tariff are more likely to be in favor of TOU tariffs. The effect of age is inverted U-shaped; middle-aged respondents are more likely to choose a TOU tariff. Furthermore, a larger household size also has a positive effect. A possible explanation could be that daily routine of larger households is more structured and is easier to adjust.
To evaluate the predictive power of Model 4, its results are used to predict the margins of respondents’ willingness to choose a TOU tariff. Figure 1 illustrates the distribution of the observed values against the predicted margins. Overall, Model 4 predicts the distribution well. On the individual level the prediction corresponds to the actual willingness to choose a TOU tariff in only 60% of cases but the deviation is greater than one category in only 3.5% of cases.
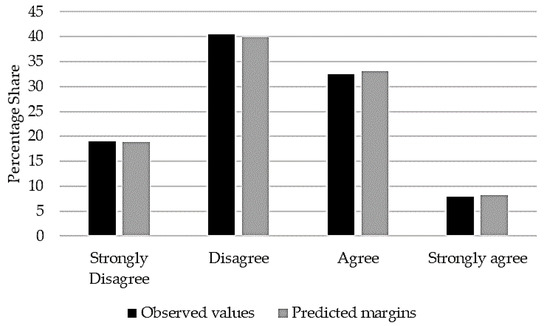
Figure 1.
Willingness to choose a TOU tariff. Sample size: 990.
5. Discussion
This study investigates the influence of behavioral attitudes on consumers’ willingness to choose TOU tariffs. An exploratory factor analysis identifies four factors that load on those attitudes. A first factor measures respondents’ Positive Attitude towards TOU Tariffs related to the TPB and VBN and warm glow. Its counterpart comprises respondents’ Negative Attitude towards TOU Tariffs based on their perceived negative impacts. A third factor measures Climate Change Awareness based on a scale dealing with statements about climate change adopted from the NEP-scale and altruism. A fourth factor covers general Belief in Energy Saving Measures. Remarkably, women tend to have a more Positive and less Negative Attitude towards TOU Tariffs and are more Climate Change Aware. The same holds for respondents living in Northern Germany who are more experienced with renewable energy facilities.
An ensuing ordered logit estimation using these factors to explain stated willingness to choose TOU tariffs identifies three significant factors: Positive and Negative Attitude towards TOU Tariffs as well as Climate Change Awareness. While a more Positive and less Negative Attitude towards TOU Tariffs unsurprisingly increases the probability that respondents choose a TOU tariff, a higher Climate Change Awareness slightly decreases that probability. For the latter, one possible explanation could be that more climate-conscious respondents prefer a general reduction in energy consumption rather than just a shift in demand. This issue has also been reported by focus groups discussing cost-reflective electricity tariffs in Australia [15]. Furthermore, Hall et al. [15] found that women are less in favor of TOU tariffs, which may be due to women being more climate change aware. However, the effect of Climate Change Awareness is small and only significant at the 10%-level. In addition, I find that women have a more Positive and less Negative Attitude towards TOU Tariffs. This indicates that these differences in attitudes could explain lower WTA values of women for TOU tariffs as estimated in choice experiments by, for example, Buryk et al. [14]. Nonetheless, it appears that the gender effect is more indirectly driven by differences in attitudes.
Adding additional covariates to the model results in further insights of drivers for respondents’ willingness to purchase a TOU tariff. Respondents are more likely to choose these tariffs if they are more willing to take risk. This is in line with the results of the choice experiment by Schlereth et al. [12] who find that German consumers who are risk-averse prefer time invariant pricing. Furthermore, I observed that respondents who have experience with TOU or smart home tariffs are more likely to adopt TOU tariffs. Also, respondents who plan to change their tariff are more likely to be in favor of TOU tariffs. Not surprisingly, middle-aged respondents are more in favor of TOU tariffs, while older and younger ones are more critical. This finding is similar to Yang et al. [10] where elderly Chinese people were less likely to state they are willing to choose a TOU tariff. However, they assumed a linear relationship of age instead of a U-shaped one. It is noteworthy that larger households favor TOU tariffs. This finding already surprised Nicolson et al. [13] since they expected that households with children would exhibit a lower willingness to switch to a TOU tariff. However, I think that larger households might be better organized than smaller ones, making it easier for them to adjust. For example, large households can shift their laundry from one day to the next, while single households have less laundry overall, so their ability to shift laundry is lower.
Preferences for TOU tariffs might additionally differ by total electricity consumption, housing characteristics or the life-cycle of a household. Although electricity consumption was queried (Appendix B, question 8), a majority of the values did not pass a plausibility test. Therefore, it was not possible to take this variable into account. Housing characteristics were only included to a small extend in the questionnaire, i.e., if a household has electric heating, and if their house has a solar panel/photovoltaic (Appendix B, questions 4 to 6). These variables were insignificant, thus, excluded from further analysis. One reason might be that households with electric heating are more likely to already have a smart home or TOU tariff (31% instead of 14%). The life-cycle of a household has been approximated by respondents’ employment status (Appendix B, question 26). However, this variable has not been proven as feasible in this analysis. This might due to the fact that respondents were already queried to state their perceived possibility to adapt their electricity consumption (Appendix B, question 19). Thus, this life-cycle effect has already been captured by this statement that is captured in the factor Positive Attitude towards TOU tariffs.
It is interesting to note that income is an insignificant factor. Electricity is a basic need and consumption is rather independent of income. Since quality does not differ significantly, it is primarily prices per kWh and, as this study suggests, intrinsic motivation, that drive consumer decisions. Decision makers who want to promote TOU tariffs could benefit from these findings by highlighting positive impacts of TOU tariffs and addressing preconceptions about TOU tariffs and their benefits to utility companies. Buryk et al. [14] showed that information about system and environmental benefits of TOU tariffs reduce compensation required for acceptance of TOU tariffs. However, decision makers should be aware that this moral suasion does not necessarily lead to significant habit formation. In a field experiment, Ito et al. [45] demonstrated that financial incentives are more persistent. They observed that consumers who were nudged by moral suasion to shift their electricity demand to off-peak hours showed less persistent behavior change than consumers who were nudged by financial incentives.
6. Conclusions
This study shows that TPB and VBN explain a significant share of preference heterogeneity for TOU tariffs. While attitudes towards these tariffs (respectively awareness of consequences, need, and responsibility) and warm glow clearly influence preferences; climate change awareness including altruism have no distinct effect. Even though these attitudes might vary over time (e.g., recent flood events in Germany might increase climate change awareness) and countries, I expect their influence to remain persistent in size. Furthermore, the results of the factor analysis should not change when respondents’ attitudes change, because the individual factors are determined based on the correlations between the statements. However, this survey has to be repeated for Germany, and similar analysis has to be undertaken for other countries in order to test this hypothesis.
Excluding some of these attitudes or a measure for risk behavior of respondents would probably lead to systematic biases in future analyses. For example, this study shows that gender effects, which are inconclusive over studies, might result from differences in attitudes. This might due to the fact that women have a more Positive and less Negative Attitude towards TOU Tariffs, that increases willingness to choose a TOU tariff, while they exhibit a higher Climate Change Awareness that rather decreases this willingness. Since these results are limited to TOU tariffs, future research should test if the identified factors, and therefore attitudes, influence preferences for dynamic electricity tariffs on a similar level.
An important limitation constitutes that this study has not tested to what extend financial incentives influence consumers’ willingness to choose a TOU tariff. Respondents where only informed that, if they adapt their electricity consumption to a TOU tariff properly (see Appendix B, question 11), they would be able to decrease their electricity bill. Further research should, therefore, take the attitudinal statements presented in this survey into account when estimating willingness to accept TOU tariffs.
Since attitudes significantly influence preferences for TOU tariffs, policy makers should clearly communicate environmental and potential financial benefits to consumers, and at the same time eliminate prejudges. Nevertheless, in the case of Germany, unavailability of TOU and dynamic tariffs remains the core issue. The latest amendment of the Energiewirtschaftsgetz [5] that forces utility companies to offer at least one TOU tariff or even dynamic tariff to end consumers will not necessarily increase supply to private households. A major obstacle is that smart meter roll-out in Germany (i.e., installation of a digital meter plus a communication device, which is necessary to enable dynamic tariffs) is only mandatory for end consumers exceeding an electricity consumption of 6000 kWh per year (e.g., households with a heat pump or an electric vehicle) or prosumers with an installed capacity of at least 7 kW [46]. All other households will only receive digital meters. German policy makers should, therefore, think over their strategy of smart-meter roll-out if they want to increase adoption of modern TOU tariffs or dynamic tariffs since, even though, policy makers would succeed in increasing positive attitudes towards TOU tariffs, households would need to actively demand these additional communication devices. This issue further hinders households from choosing a TOU tariff.
Funding
This research received no external funding.
Institutional Review Board Statement
An ethical review of this study was waived because it was conducted via an external panel provider (Consumerfieldwork GmbH) who both reviewed the questionnaire and ensured the anonymity and data protection of the participants. Participation was voluntary and could be terminated at any time. Participants could skip individual questions and were not exposed to psychological or physical risks at any time.
Informed Consent Statement
Informed consent was obtained from all subjects involved in the study.
Data Availability Statement
The data used in this study include sensitive respondent information. Respondents have been assured that their individual data will be kept confidential and will be explicitly available only to academics. I am happy to share these data with other researchers, provided that such a request is explicitly limited to academic purposes.
Acknowledgments
I acknowledge financial support by the Deutsche Forschungsgesellschaft (DFG) within the funding program "Open Access Publizieren". I want to thank colleagues, the academic editors, and two anonymous reviewers for their valuable comments. Furthermore, I want to thank my research assistant for her valuable assistance. Last but not least, I acknowledge the Gesellschaft für Energie und Klimaschutz Schleswig-Holstein GmbH (EKSH, Association for Energy and Climate Protection Schleswig-Holstein), Kiel, Germany, who provided welcome financial support to me by a Ph.D. scholarship (Projekt Nr. 14/12-2) during 2013 and 2016. The EKSH is a non-profit-making limited liability company funded by the Federal State of Schleswig-Holstein, HanseWerk AG and a company set up by the universities in the region, namely University of Flensburg, Flensburg UAS, Kiel University, Kiel UAS, Lübeck University, Lübeck UAS and West Coast UAS, Germany.
Conflicts of Interest
The author declares no conflict of interest. The funders had no role in the design of the study; in the collection, analyses, or interpretation of data; in the writing of the manuscript, or in the decision to publish the results.
Appendix A
Table A1.
Results unrotated factor analysis.
Table A1.
Results unrotated factor analysis.
| Factor | Eigenvalue | Difference | Proportion | Cumulative |
|---|---|---|---|---|
| Factor 1: Climate Change Awareness | 6.3799 | 3.4904 | 0.5317 | 0.5317 |
| Factor 2: Positive Attitude towards TOU Tariffs | 2.8895 | 1.4132 | 0.2408 | 0.7726 |
| Factor 3: Belief in Energy Saving Measures | 1.4763 | 0.3434 | 0.1230 | 0.8956 |
| Factor 4: Negative Attitude towards TOU Tariffs | 1.1329 | 0.5870 | 0.0944 | 0.9900 |
| Factor 5 | 2.92 (0.72) |
Note: Sample size = 990; Method: principle factors on items’ polychoric correlation matrix.
Appendix B
Translated Questionnaire (Original in German)
- Please indicate your gender:
- Female
- Male
- How old are you?
- Which state do you live in?
- Baden-Württemberg
- Bavaria
- Berlin
- Brandenburg
- Hamburg
- Hessen
- Mecklenburg-Western-Pomerania
- Lower Saxony
- North Rhine-Westphalia
- Rhineland-Palatine
- Saarland
- Saxony
- Saxony-Anhalt
- Schleswig-Holstein
- Thuringia
- I do not live in Germany
- Do you use one or several of following electricity using appliances to heat water? (Multiple answers allowed)
- Boiler
- Instantaneous water heater
- Electricity is not used to heat water
- Do you heat with electricity?
- Exclusively/Mostly
- Sometimes (e.g., heating fan during winter)
- Never
- Don’t know
- Is there a photovoltaic/solar system installed on the house where you live in?
- Yes
- No
- Don’t know
- How do you estimate the electricity consumption of your household compared to other households? Please, consider households of the same size.
- Much lower
- Lower
- Similar
- Higher
- Much higher
- Please, estimate how much electricity your household consumed during last year? You can either state your monthly or yearly electricity consumption.
- Monthly:
- Yearly:
- Don’t know
- Electricity tariffs may have different characteristics. Which of the following characteristics does your current electricity tariff have? (Multiple answers allowed; Options: yes, no, don’t know)
- 100% electricity from renewable energies
- Electricity price dependent of time of day and day of the week
- Special tariff for heat pump or night storage heating
- Regional origin of electricity from renewable energy is known
- Smart home tariff
- Which of the following reasons influences your decision for your electricity tariff? (Multiple answers allowed; Options: yes, no, don’t know)
- Comprehensibility of tariff description
- Share of renewable energy
- Origin of electricity (e.g., regional)
- Electricity price per kilowatt-hour
- Other reasons, namely:
- Information on TOU tariffs
- Treatment 1:
- Please read the following text carefully:
- There is currently a lot of discussion in Germany about the future of electricity supply. Among other things, electricity consumption is to be reduced at times of day when it is particularly high; for example, in the morning after many people have got up. The high electricity consumption at these times must be compensated by electricity from additional gas and coal-fired power plants. These power plants are otherwise not needed, causing correspondingly high costs and CO2-emissions.
- For this reason, consideration is being given to adjusting the electricity price during periods of high electricity consumption (i.e., 6 to 10 am and 4 to 8 pm). In these times, the price of electricity would be higher than it is today, otherwise lower. If you were to adjust your electricity consumption accordingly, you could actually pay less overall than you do now.
- Treatment 2:
- Please read the following text carefully:
- There is currently a lot of discussion in Germany about the future of electricity supply. Among other things, electricity consumption is to be reduced during times when little electricity is available from renewable sources; for example, when wind conditions are poor. If electricity consumption is not reduced during these times, it must be offset by electricity from additional gas and coal-fired power plants. These power plants are otherwise not needed, causing correspondingly high costs and CO2 emissions.
- For this reason, consideration is being given to adjusting the price of electricity to the availability of electricity from renewable sources. If the availability is low (you will be informed in time by your electricity provider), the electricity price will be higher than at present, and if the availability is high, it will be lower. If you were to adjust your electricity consumption accordingly, you could pay less overall than you do now.
- Has your household ever changed its electricity tariff?
- Yes
- No
- Don’t know
- Does your household plan to change its electricity tariff during the next 6 months?
- Yes
- Maybe
- No
- Don’t know
- Who in your household is in charge for decisions in electricity supply (e.g., provider, tariff etc.)?
- Just me
- Me together with others
- Others but me
- Don’t know
- [Only treatment 1]How often do you use electricity during 6 to 10am and 4 to 8pm?
- Rarely
- Sometimes
- Often
- Very often
- Don’t know
- To what extend do you agree with the following statements? (Options: I fully agree; I rather agree; I rather disagree; I fully disagree)
- Climate change is a serious problem
- My personal actions influence climate change
- Humans are responsible for climate change
- There will be a solution to climate change without limiting our lifestyle
- Scientific predictions regarding climate change are trustworthy
- I am sure that climate change is happening
- Media exaggerates climate change
- Private households face different options to save electricity. To what extend do you think following options are feasible to decrease electricity consumption? (Options: unfeasible; rather unfeasible; rather feasible; feasible)
- Purchasing an electricity tariff, which electricity price is very high while electricity consumption is high / energy supply from renewables is low and very low otherwise
- Switching off electrical appliances instead of using stand-by
- Increasing average electricity prices
- Switching off lights when leaving a room
- Buying electrical appliances with low electricity consumption
- Replacing old light bulbs or halogen bulbs by electricity saving alternatives
- Other, namely:
- To what extend do you agree with following statements about an electricity tariff with higher electricity prices while electricity consumption is high/energy supply from renewables is low and very low otherwise? (Options: I fully agree; I rather agree; I rather disagree; I disagree) Such an electricity tariff…
- …ensures that power outages will continue to be rare in Germany
- …mitigates CO2-emissions
- …increases monthly electricity costs
- …increases electricity providers’ profits
- …will lead to electricity shortages during certain times
- …decreases electricity consumption
- To what extend do you agree with following statements about an electricity tariff with higher electricity prices while electricity consumption is high/energy supply from renewables is low and very low otherwise? (Options: I fully agree; I rather agree; I rather disagree; I disagree)
- I would like to choose such an electricity tariff rather than my current electricity tariff.
- I am doing enough already to save energy; thus, I do not additionally need to choose such an electricity tariff
- My social environment would like it if I would choose such an electricity tariff
- I expect other people around me to behave in an environmentally friendly way
- For me, it would be easy to limit my electricity consumption in case I am at home during 6 to 10am and 4 to 8pm/if there little electricity from renewables is available.
- Purchasing such an electricity tariff gives me a warm glow to contribute to climate protection
- I do not want others to suffer from the impacts of climate change
- How willing are you to take risks? (10 Options from 1 “absolutely not willing to take risks” to 10 “absolutely willing to take risks”)
- How many people belong to your household (including yourself)?
- How much is your personal monthly net income, today?Please name your monthly net income, i.e., excluding taxes and social insurance. Please, add regular payments such as pensions, housing allowances, child benefits, BAföG (student benefit), alimony etc.
- Below 1000 €
- 1000 € to under 2000 €
- 2000 € to under 2500 €
- 3000 € to under 3500 €
- 3500 € to under 4000 €
- 4000 € to under 5000 €
- 5000 € to under 7500 €
- 7500 € to under 10,000 €
- 10,000 € or more
- Prefer not to answer
- How much is your household’s monthly net income, today?
- Please name your household’s monthly net income, i.e., excluding taxes and social insurance. Please, add regular payments such as pensions, housing allowances, child benefits, BAföG (student benefit), alimony etc.
- Below 1000 €
- 1000 € to under 2000 €
- 2000 € to under 2500 €
- 3000 € to under 3500 €
- 3500 € to under 4000 €
- 4000 € to under 5000 €
- 5000 € to under 7500 €
- 7500 € to under 10,000 €
- 10,000 € or more
- Prefer not to answer
- What is your highest school degree?
- Still in school
- Volks-/Hauptschulabschluss or comparable degree after eight/ninth grade
- Realschulabschluss/Qualified Hauptschulabschluss or comparable degree after tenth grade
- Fachhochschulreife/fachgebundene Hochschulreife/Fachabitur (i.e., graduation after 12th grade allowing access to Fachhochschulen (Universities of applied science))
- General Hochschulreife/Abitur or comparable degree that allows unlimited access to universities
- No degree
- Prefer not to answer
- What is your current occupation?
- Full-time job (min. 35 h/week)
- Part-time job (15 to 35 h/week)
- Free-lancer
- Housewife/man/child care
- Retired
- Currently unemployed/retraining
- Student/in education
- Prefer not to answer
- Do you think that individual people may influence future decisions on electricity supply by participating in scientific studies?
- Not at all
- Rather not
- Rather yes
- In any case
References
- Vahlenkamp, T.; Ritzenhofen, I.; Gersema, G.; Weber, M. Energiewende-Index in Deutschland 2020—Wie Deutschland seine Vorreiterrolle verteidigen kann. Energ. Tagesfr. 2016, 66, 23–27. [Google Scholar]
- IRENA, International Renewable Energy Agency. Time-of-Use Tariffs: Innovation Landscape Brief; International Renewable Energy Agency (IRENA): Abu Dhabi, United Arab Emirates, 2019. [Google Scholar]
- ACER; CEER. Annual Report on the Results of Monitoring the Internal Electricity and Natural Gas Markets in 2019: Energy Retail and Consumer Protection Volume; European Union Agency for the Cooperation of Energy Regulators (ACER): Ljubljana, Slovenia; Council of European Energy Regulators (CEER): Brussels, Belgium, 2020. [Google Scholar]
- The European Parliament and of the Council of the European Union. Directive (EU) 2019/944 of the European Parliament and of the Council of June 2019 on Common Rules for the Internal Market for Electricity and Amending Directive 2012/27/EU: 2019/944. Official J. Eur. Union 2019, L 158, 125–199. [Google Scholar]
- Deutscher Bundestag. Gesetz über Die Elektrizitäts- und Gasversorgung (Energiewirtschaftsgesetz—EnWG): EnWG; Bundesgesetzblatt Teil I: Bonn, Germany, 2021; Volume 47, pp. 3028–3078. [Google Scholar]
- Bundesnetzagentur; Bundeskartellamt. Monitoringbericht Energie 2020; Bundesnetzagentur; Bundeskartellamt: Bonn, Germany, 2021. [Google Scholar]
- Umweltbundesamt. Erneuerbare Energien in Deutschland: Daten zur Entwicklung im Jahr 2020; Umweltbundesamt: Dessau-Roßlau, Germany, 2021; Available online: https://www.umweltbundesamt.de/sites/default/files/medien/5750/publikationen/2021_hgp_erneuerbareenergien_deutsch_bf.pdf (accessed on 1 April 2021).
- Federal Ministry for the Environment, Nature Conservation and Nuclear Safety (BMU). Climate Action in Figures: Facts, Trends and Incentives for German Climate Policy, 2020 ed.; Federal Ministry for the Environment, Nature Conservation and Nuclear Safety (BMU): Berlin, Germany, 2020. Available online: https://www.bmu.de/fileadmin/Daten_BMU/Pools/Broschueren/klimaschutz_zahlen_2020_en_bf.pdf (accessed on 1 April 2021).
- Sundt, S.; Rehdanz, K.; Meyerhoff, J. Consumers’ Willingness to Accept Time-of-Use Tariffs for Shifting Electricity Demand. Energies 2020, 13, 1895. [Google Scholar] [CrossRef]
- Yang, Y.; Wang, M.; Liu, Y.; Zhang, L. Peak-off-peak load shifting: Are public willing to accept the peak and off-peak time of use electricity price? J. Clean. Prod. 2018, 199, 1066–1071. [Google Scholar] [CrossRef]
- Broberg, T.; Persson, L. Is our everyday comfort for sale? Preferences for demand management on the electricity market. Energy Econ. 2016, 54, 24–32. [Google Scholar] [CrossRef] [Green Version]
- Schlereth, C.; Skiera, B.; Schulz, F. Why do consumers prefer static instead of dynamic pricing plans? An empirical study for a better understanding of the low preferences for time-variant pricing plans. Eur. J. Oper. Res. 2018, 269, 1165–1179. [Google Scholar] [CrossRef]
- Nicolson, M.; Huebner, G.; Shipworth, D. Are consumers willing to switch to smart time of use electricity tariffs? The importance of loss-aversion and electric vehicle ownership. Energy Res. Soc. Sci. 2017, 23, 82–96. [Google Scholar] [CrossRef]
- Buryk, S.; Mead, D.; Mourato, S.; Torriti, J. Investigating preferences for dynamic electricity tariffs: The effect of environmental and system benefit disclosure. Energy Policy 2015, 80, 190–195. [Google Scholar] [CrossRef] [Green Version]
- Hall, N.L.; Jeanneret, T.D.; Rai, A. Cost-reflective electricity pricing: Consumer preferences and perceptions. Energy Policy 2016, 95, 62–72. [Google Scholar] [CrossRef]
- Ajzen, I. The theory of planned behavior. Organ. Behav. Hum. Decis. Process. 1991, 50, 179–211. [Google Scholar] [CrossRef]
- Stern, P.C. New Environmental Theories: Toward a Coherent Theory of Environmentally Significant Behavior. J. Soc. Issues 2000, 56, 407–424. [Google Scholar] [CrossRef]
- Wang, Z.; Zhang, B.; Zhang, Y. Determinants of public acceptance of tiered electricity price reform in China: Evidence from four urban cities. Appl. Energy 2012, 91, 235–244. [Google Scholar] [CrossRef]
- Gołębiowska, B.; Bartczak, A.; Czajkowski, M. Energy Demand Management and Social Norms. Energies 2020, 13, 3779. [Google Scholar] [CrossRef]
- Broberg, T.; Daniel, A.M.; Persson, L. Household preferences for load restrictions: Is there an effect of pro-environmental framing? Energy Econ. 2021, 97, 105188. [Google Scholar] [CrossRef]
- Bang, H.-K.; Ellinger, A.E.; Hadjimarcou, J.; Traichal, P.A. Consumer concern, knowledge, belief, and attitude toward renewable energy: An application of the reasoned action theory. Psychol. Mark. 2000, 17, 449–468. [Google Scholar] [CrossRef]
- Hansla, A.; Gamble, A.; Juliusson, A.; Gärling, T. Psychological determinants of attitude towards and willingness to pay for green electricity. Energy Policy 2008, 36, 768–774. [Google Scholar] [CrossRef]
- Kowalska-Pyzalska, A. An Empirical Analysis of Green Electricity Adoption Among Residential Consumers in Poland. Sustainability 2018, 10, 2281. [Google Scholar] [CrossRef] [Green Version]
- Ozaki, R. Adopting sustainable innovation: What makes consumers sign up to green electricity? Bus. Strat. Env. 2011, 20, 1–17. [Google Scholar] [CrossRef]
- Makki, A.A.; Mosly, I. Factors Affecting Public Willingness to Adopt Renewable Energy Technologies: An Exploratory Analysis. Sustainability 2020, 12, 845. [Google Scholar] [CrossRef] [Green Version]
- Van Rijnsoever, F.J.; Farla, J.C.M. Identifying and explaining public preferences for the attributes of energy technologies. Renew. Sustain. Energy Rev. 2014, 31, 71–82. [Google Scholar] [CrossRef] [Green Version]
- Dunlap, R.E.; van Liere, K.D. The “New Environmental Paradigm”. J. Environ. Educ. 1978, 9, 10–19. [Google Scholar] [CrossRef]
- Steg, L.; Vlek, C. Encouraging pro-environmental behaviour: An integrative review and research agenda. J. Environ. Psychol. 2009, 29, 309–317. [Google Scholar] [CrossRef]
- Liebe, U.; Preisendörfer, P.; Meyerhoff, J. To Pay or Not to Pay: Competing Theories to Explain Individuals’ Willingness to Pay for Public Environmental Goods. Environ. Behav. 2009, 43, 106–130. [Google Scholar] [CrossRef] [Green Version]
- Corner, A.; Markowitz, E.; Pidgeon, N. Public engagement with climate change: The role of human values. WIREs Clim. Chang. 2014, 5, 411–422. [Google Scholar] [CrossRef]
- Dunlap, R.E.; van Liere, K.D.; Mertig, A.G.; Jones, R.E. New Trends in Measuring Environmental Attitudes: Measuring Endorsement of the New Ecological Paradigm: A Revised NEP Scale. J. Soc. Isssues 2000, 56, 425–442. [Google Scholar] [CrossRef]
- Andreoni, J. Impure Altruism and Donations to Public Goods: A Theory of Warm-Glow Giving. Econ. J. 1990, 100, 464. [Google Scholar] [CrossRef] [Green Version]
- Hartmann, P.; Eisend, M.; Apaolaza, V.; D'Souza, C. Warm glow vs. altruistic values: How important is intrinsic emotional reward in proenvironmental behavior? J. Environ. Psychol. 2017, 52, 43–55. [Google Scholar] [CrossRef]
- Menges, R.; Schroeder, C.; Traub, S. Altruism, Warm Glow and the Willingness-to-Donate for Green Electricity: An Artefactual Field Experiment. Environ. Resour. Econ. 2005, 31, 431–458. [Google Scholar] [CrossRef]
- Lawley, D.N.; Maxwell, A.E. Factor Analysis as a Statistical Method. Statistician 1962, 12, 209. [Google Scholar] [CrossRef]
- Olsson, U. On The Robustness Of Factor Analysis Against Crude Classification Of The Observations. Multivar. Behav. Res. 1979, 14, 485–500. [Google Scholar] [CrossRef]
- Hendrickson, A.E.; White, P.O. PROMAX: A QUICK METHOD FOR ROTATION TO OBLIQUE SIMPLE STRUCTURE. British J. Stat. Psychol. 1964, 17, 65–70. [Google Scholar] [CrossRef]
- McCullagh, P. Regression Models for Ordinal Data. J. R. Stat. Soc. Ser. B (Methodol.) 1980, 42, 109–142. [Google Scholar] [CrossRef]
- Kolenikov, S.; Angeles, G. The Use of Discrete Data in PCA: Theories, Simulations, and Applications to Socioeconomic Indices. Chapel Hill Carol. Popul. Cent. Univ. N. C. 2004, 20, 1–59. [Google Scholar]
- Bundesnetzagentur; Bundeskartellamt. Monitoring Report 2016; Bundesnetzagentur; Bundeskartellamt: Bonn, Germany, 2016. [Google Scholar]
- Statistisches Bundesamt (Destatis). Genesis-Online: 12411-0004, 12411–0011, 12411-0013, 12411–0040, 12411-0102, 12411–0105. Data license by-2-0. 2021. Available online: https://www-genesis.destatis.de/genesis/online (accessed on 29 January 2021).
- Poortinga, W.; Fisher, S.; Böhm, G.; Steg, L.; Whitmarsh, L.; Ogunbode, C. European Attitudes to Climate Change and Energy: Topline Results from Round 8 of the European Social Survey. ESS Topline Results Ser. 2018, 9, 3–17. Available online: https://www.europeansocialsurvey.org/docs/findings/ESS8_toplines_issue_9_climatechange.pdf (accessed on 20 August 2021).
- Kaiser, H.F. The Application of Electronic Computers to Factor Analysis. Educ. Psychol. Meas. 1960, 20, 141–151. [Google Scholar] [CrossRef]
- Kaiser, H.F. An index of factorial simplicity. Psychometrika 1974, 39, 31–36. [Google Scholar] [CrossRef]
- Ito, K.; Ida, T.; Tanaka, M. Moral Suasion and Economic Incentives: Field Experimental Evidence from Energy Demand. Am. Econ. J. Econ. Policy 2018, 10, 240–267. [Google Scholar] [CrossRef] [Green Version]
- Deutscher Bundestag. Gesetz zur Digitalisierung der Energiewende; Bundesgesetzblatt Teil I: Bonn, Germany, 2016; Volume 43, pp. 2034–2064. [Google Scholar]

Publisher’s Note: MDPI stays neutral with regard to jurisdictional claims in published maps and institutional affiliations. |
© 2021 by the author. Licensee MDPI, Basel, Switzerland. This article is an open access article distributed under the terms and conditions of the Creative Commons Attribution (CC BY) license (https://creativecommons.org/licenses/by/4.0/).