Abstract
A microgrid’s self-consumption rate reflects its ability to retain its own energy and decrease its reliance on the synchronous grid. This paper investigates the empirical case of a microgrid equipped with photovoltaic (PV) panels and identifies challenges in engaging the microgrid’s users to increase their self-consumption. Accordingly, we explored both the physical and social dimensions of the microgrid. The former involved mapping the electricity consumption and production through an exploratory data analysis, and evaluating the associated price signals, while the latter involved the use of design interventions to explore users’ perceptions of the system. We highlight the problem of price signal impedance, the need for cost reflective pricing and the challenge in designing and extending internal price models in settings with various actors. We address the limitations of price signals, alongside alternative unidimensional signals, and emphasize the need for an integrated approach to a user engagement strategy as well as the challenges that this approach entails. Our results shed light on the complexity of energy communities such as microgrids, and why their implementation can introduce multidimensional challenges that demand cross-disciplinary approaches.
1. Introduction
Efforts in climate change mitigation are being hindered by a formidable set of challenges. Within the electricity sector, reducing carbon dioxide emissions hinges on the ability of electricity grids to handle increasing amounts of intermittent energy. This needs to be achieved while maintaining a high standard of reliability, improving the grid’s overall resilience and curbing social costs. These factors, alongside calls to democratize and decentralize the electricity system, have rendered microgrids highly relevant to the energy transition. In recent years, microgrids have increasingly been implemented in urban locations, in contrast to their historical use in remote settings serving small populations [1]. Lauded as a way to reduce emissions, empower communities and decentralize the power grid, microgrids are one form of an energy community [2] that offers a range of theoretical advantages [3,4]. Yet, as this paper aims to demonstrate, it is in their practical implementation that unanticipated challenges become more apparent.
A defining feature of any microgrid is the ability to produce its own energy. With photovoltaic (PV) panels or other forms of distributed electricity generation, a microgrid is intended to function autonomously (to some degree), with little to no reliance on the external grid [5]. One critical parameter by which microgrids can therefore be assessed is their self-consumption rate, which is the share of produced energy that is consumed inside a given microgrid:
where SC is the self-consumption rate of a given energy community, C is the amount of energy from the PV panels that is consumed (kWh) during a given time period, and P is the amount of energy produced by the PV panels (kWh) during a given time period.
SC = C/P,
This parameter is made more important by the problem of intermittency associated with the renewable energy sources often used in microgrid settings. Variable renewable energy sources such as wind and solar fluctuate in their supply, and if a microgrid can neither match that supply with its demand nor store the excess electricity, it will be forced to export that electricity to the external grid. Conversely, if there is no available power from its own energy sources and the microgrid’s demand exceeds its supply, it will then be forced to import electricity. The implication of this dynamic is that a microgrid could display a superficially high productive capacity while exporting most of its own electricity and re-importing it later, making its users no less reliant on the synchronous grid than they were prior to connection. Accordingly, the self-consumption rate serves as a performance measure that allows one to assess a microgrid’s ability to retain its own energy and maximizing this self-consumption rate is a goal that is therefore implicit in most microgrid settings.
The problem of self-consumption is fundamentally about a mismatch between the timing of supply and demand. The supply side lever is one that is decidedly rigid, due to the intermittent availability of power from renewable sources. One countermeasure is to store generated electricity that is not used. While storage technologies are currently undergoing a period of rapid development, they remain too expensive for wide-scale adoption. The second lever, and the focus of this paper, is the demand side measure of using behavior to shift electricity usage away from periods of excess demand towards periods of excess production and vice versa. Microgrids are not passive networks of electrical currents but are dynamic systems that are as responsive to the elements that power them as they are to the actors who use them. From an economic perspective, electricity is a commodity that is traded, bought and sold, but an everyday user may perceive it is an unintuitive, intangible good that must be used immediately and cannot be stored [6]. Consequently, users are not intrinsically reflective of the implications of their consumption patterns and will not reflexively alter these patterns. Changing consumption patterns and employing behavioral change as a means to shift the timing of electricity usage therefore requires the engagement of users. This paper attempts to illustrate that this is a feat of considerable difficulty, and that its resolution is central to the future of microgrids and the energy transition at large.
Engaging electricity users and motivating them to reflect and act on the timing of their consumption requires substantial change in how electricity is conveyed and communicated. In the context of electricity use, the predominant medium through which information is conveyed to and from users is the electricity market—through prices [7,8,9,10]. Reshaping the architecture of the market is therefore one way to manipulate the signals being sent to users [11]. Using price-based energy sharing models that alter the distribution of prices and incentives within a microgrid could generate benefits to the community as a whole [12,13]. In some cases, a centralized planner can be eliminated and prosumers could “trade” energy within the microgrid under a blockchain-based market [14]. While most studies on microgrids have been based on models and simulations, studies looking at empirical cases of more general demand response programs have indicated that the price of electricity can play a role in helping manage demand [15,16,17], but the extent of this role remains highly contested [18,19]. The short-sighted view of users as purely financially-driven and economically rational consumers can therefore result in an overreliance on the price of electricity as a policy instrument and limit the effect of demand response programs [20]. One meta-analysis demonstrated that financial incentives may even lead to an increase in energy usage, a result that has previously been described as the “licensing effect”, where users find out that their expenditures and potential savings are so modest that they then felt “entitled to benefits from energy use because they are paying for it” [21]. Such findings, alongside an absence of any consensus regarding whether and to what extent financial incentives are effective, suggest that any policy that targets user engagement should avoid an exclusive dependence on price signals.
Demand response programs and the flexibility of household electricity consumption have been studied from a range of perspectives. Previous demand response studies have for example investigated the relation between flexibility and gender [22,23], households with children [24,25], flexibility capital [26], social practices [27], temporality of everyday life [28], user typology [29] and non-self-selected prosumers [30]. A systematic review of consumer engagement among households for demand responsibility can be found in [31]. One way of communicating the need for flexibility is the use of electricity feedback, which has been shown to play an equal or more important role than pricing strategies [32,33,34]. Feedback in the form of energy visualizations, through digital platforms for example, has been suggested as a tool that could enable households to take greater responsibility in the energy infrastructure by engaging in self-consumption or trading with energy [35]. As is the case with pricing, however, feedback also has its limitations. A growing body of literature questions the idea that making energy usage visible to households will trigger behavior change and affect consumption [36]. Studies have shown that the simple installation of smart meters and the provision of detailed feedback might not be sufficient to trigger consumer engagement [37] as the technology fails to account for the more complex cultural and social contexts that influence energy use [38]. As new technologies are introduced, new domestic practices will also emerge, making it difficult to impose fixed forms of communication on dynamic social contexts [39].
Moving away from the view of users as recipients of prices and feedback, and instead viewing them as participants of the energy system might allow for new material forms of energy citizenship to emerge within households [40], and consequently, new forms of engagement. The term energy citizenship has developed from the historical perspective of people as passive energy users or customers, to a more active perspective where people are encouraged by policies to be more active, for example through price signals [40]. Exploring potential new forms of energy citizenship alongside the possibility to empower prosumers and households can shed light on the role they can play as active participants, democratically engaged in the sustainable energy transition [40]. Inviting users to reflect upon and shape these roles co-creatively is one possible path to enabling a shared understanding of needs, challenges and everyday life activities; one possibility is the use of design probes as a method [41].
Another concept that frames people as participants is that of energy communities. An energy community could be interconnected on a broad scale or be more geographically concentrated, initiated by either community inhabitants or a local authority and motivated by the pursuit of self-sufficiency, CO2 neutrality or reduced costs [42,43,44]. The constellation of actors in an energy community and their motivations for participating (or not) in these arrangements vary. Variables such as home-ownership and energy bills have been identified as key factors that influence citizens’ willingness to participate in community energy systems [45,46]. It should, however, not be assumed that all users want to be a part of an active energy community, and even fewer can be expected to be interested in controlling such a system [47]. It is therefore prudent to account for the variations of users and consider the provision of a variety of energy citizenship roles that cater to the diversity of skills, preferences and interests among participants. We apply the term “user” to broadly describe any actor or stakeholder (residential, commercial or otherwise) that is (or would be) part of an energy community. We adopt the phrase “user heterogeneity” to encompass variations within and between these different types of users.
We explore the topics examined above in an empirical setting which consists of a small DC microgrid equipped with photovoltaic (PV) panels. Composed of four newly built residential buildings with 16 rental apartments ranging from 66 m2 to 95 m2, the microgrid is also set to expand and include a set of municipal actors: an elderly home with 58 apartments, an assisted living facility (ALF) with six apartments, a 950 m2 preschool and a caretakers’ office. The caretakers’ office and two of the residential buildings are the only buildings without PV panels on the roof. The housing agency behind the decision to establish the microgrid owns the buildings set to be connected. According to the housing agency, most of the buildings are built according to the passive housing criteria with features such as thick walls for more energy efficiency. A total of six buildings are already equipped with PV panels, and almost all have been exporting electricity to the synchronous grid in varying amounts. It is a combination of these circumstances that allow us to describe the microgrid’s users as “passive prosumers”. They are prosumers because they are part of an entity that produces and consumes energy, but passive because they were not part of the decision to become a prosumer. Through connecting these buildings, the housing agency’s vision was to first maximize self-consumption and then potentially install more PV panels in an effort to become entirely self-sufficient. While the microgrid was equipped with battery storage, it was limited to a capacity of 21.7 kWh, far short of what was necessary to eliminate electricity exports.
Given the context and specific circumstances, we set out to study practical and economic aspects such as the self-consumption rate and current cost distribution along with price signals, as well as user-centered aspects on how the microgrid was communicated, experienced and understood. We believe that previous research has targeted various strands of the topics discussed above, but that there is a lack of research on empirical settings that consolidate the above topics and shed light on the interplay of the various difficulties and challenges in their realization. We aim to offset this deficit with an empirical multidisciplinary study of an operational microgrid that can serve as an illustrative case and a reference point for future studies. Accordingly, our purpose with this paper is to identify practical challenges in engaging microgrid users to increase self-consumption, and so our contribution to the current literature is a summary of the various considerations that must be weighed and the possible complications that may emerge, in the institution and management of a microgrid.
The paper is structured as follows. Section 2 describes the methods used for analyzing the electricity consumption, production and its associated costs, as well as using design interventions to explore users’ understanding and perceptions of the microgrid. Section 3 describes the results found with these methods. Section 4 discusses the results and summarizes our learnings as input for future research.
2. Materials and Methods
This paper aims to analyze the setting’s electricity consumption and production, study the distribution of costs among microgrid members, and explore users’ understanding and perceptions of the microgrid. In order to identify the challenges to increasing self-consumption, it was necessary to study both the physical and social dimensions of the microgrid. Physically, our aim was to quantify the electricity being produced and consumed inside the microgrid and examine the distribution of costs alongside their associated price signals through a cost distribution analysis. To study the social aspects of the microgrid in relation to electricity consumption and production, we aimed to explore how these “passive prosumers” perceived and interacted with the system.
2.1. Electricity Consumption and Production
An exploratory data analysis was carried out, quantifying the consumption and production of electricity in each of the buildings. Hourly consumption and production data spanning a period of January 2018 to March 2019 were collected for each building and used to calculate rates of self-sufficiency (how much of the electricity used in a building came from the PV panels) and self-consumption. These data were also aggregated and used to generate mean hourly consumption profiles for each building, averaging the electricity consumption of each given hour in a day over the duration of the entire year of 2018. This allowed for the identification of peaks and troughs (negative peaks, or minima) in demand. While the data was complete for the municipal buildings, around 30% of the data for residential buildings was missing and was either imputed or filled in using data from 2019. The details concerning this modification, as well as any other adjustments to the data, can be found in Appendix A. These analyses were run on the existing arrangement where municipal buildings were treated separately and the four residential buildings were treated as one unit, since they form the present microgrid.
2.2. Cost Distribution
Given the emphasis placed on price signals in the field of demand side management (DSM), and their common adoption as a tool in shifting user behavior (as discussed in the literature review above), this section outlines an approach used to illustrate the detriment of fixed and static pricing schemes, as the one currently in place in the residential buildings. By evaluating the costs paid by residents under this fixed pricing scheme and comparing these costs to what would have been paid under a more dynamic, cost-reflective pricing scheme, one can verify and illustrate how price signals are impeded from reaching their end users. Additionally, we attempt to quantify the cross-subsidies that take place among the residential users, and the extent to which the real costs incurred by each user are masked by the current pricing scheme.
This evaluation was not applicable for the municipal buildings, as their electricity bills were paid for externally by the municipality. This is an important point that will be taken up in the discussion. Apartments in the residential buildings were charged a flat volumetric fee of EUR 0.125 /kWh, meaning that the costs incurred by an apartment were only a function of the monthly volume (kWh) of energy they consume, irrespective of time. Using hourly data on a set of apartments from the buildings (data was missing from one of the apartments, see Appendix A), the residents’ monthly and annual costs were calculated. A simulation was subsequently run, demonstrating how a different price model would influence the distribution of costs. For clarity, this was not a sophisticated time series forecasting model that tried to predict changes in the level of demand given different price schemes. Instead, it was a basic but revealing simulation that took demand as a constant, using the same hourly values for 2018, and only focused on how the distribution of costs between units charged under different pricing schemes given this fixed level of demand.
The housing agency pays a monthly bill on behalf of the apartments and recuperates its cost through the volumetric fee charged to the tenants. The bill paid by the housing agency contains a fixed component as well as a real-time component that varies by the hour (typically, users pay two electricity bills in Sweden with one going to the retailer covering the cost of electricity procurement delivery, and the second going to the distribution system operator (DSO) for maintaining the local grid and distributing the electricity to a user’s home. In this case, the housing agency pays both of these bills on behalf of each user and then charges them a single cost that covers both). This fluctuating cost is converted into a volumetric rate paid by all tenants, irrespective of their time of use, implying cross-subsidies that flow from some tenants (those who use electricity during less expensive hours) to others (those who use electricity during more expensive hours). By simulating what would have retroactively occurred under a more cost-reflective pricing scheme, the model discussed below is used to shed light on these cross-subsidies. Based on a variant of real-time pricing (RTP), the model was designed to transmit the real-time costs incurred by the housing agency to the tenants and is given by the following equation:
where Ch is the cost incurred by a given tenant during a given hour (EUR), Rh is the rate paid by the housing agency to the electricity providers for a given hour (EUR/kWh), Cf is the consumption factor, the proportion of electricity imported from the grid, and Eh is the energy used by a given tenant during a given hour (kWh).
Ch = RhCfEh,
The model deviates from a “pure” RTP scheme in a few important aspects. The hourly rate paid by the housing agency, the first term in Equation (2), is a term that combines the real-time (hourly) spot price paid to a retailer, as well as the fixed fee paid to the distribution system operator (DSO) (the DSO fixed-fee component was slightly modified, see Appendix B for details). The second term is a consumption factor that ranges from 0–1 and represents the proportion of electricity being imported from the synchronous grid at a particular hour (a consumption factor of 0 means all electricity is coming from the PV panels, and therefore free. A consumption factor of 1 means that all electricity is coming from the external grid). This modification stems from the housing agency’s intention to provide solar electricity to tenants free of charge, as an incentive to increase self-consumption. The final term is the hourly consumption of a given user. The annual costs were re-calculated on an hourly basis according to this model. They were then compared to the baseline case of the flat volumetric fee to reveal how price signals are being blocked and the extent to which cross-subsidization is taking place. It should be emphasized that this is a revenue neutral price model, meaning that it is strictly an “internal” redistribution of costs between the apartments, and does not concern the “external” pricing structure that the housing agency is subject to. In other words, summing up the total costs under the existing and alternative price models yields the same total value.
2.3. Design Interventions for Gathering Qualitative Findings
The issue of user engagement in energy systems has practical, economic and social dimensions. To address this question, an integrated and cross-disciplinary approach is needed. Self-consumption, while being a technical parameter that is dependent on electricity flows, is essentially an effect of electricity use stemming from people’s everyday behavior. Energy usage cannot simply be explained by payments and kilowatts, which is why more in-depth qualitative methods are needed. As users should also be democratically involved in small-scale energy communities, our aims were to explore (1) tenants’ drivers and barriers to flexibility, (2) how a microgrid system could be communicated, and (3) what engagement and being active means for actors and tenants. These questions were explored through a humble designing approach which acknowledges uncertainty in design and has respect for different perspectives at the core [48]. This approach was used to shape two design interventions with the aim of gathering insights from users in the microgrid. Design intervention [49] is a form of inquiry through which reflections are prompted about the issue in discursive contexts rather than to arrive at closure. It uses basic design methods such as sketching and prototyping to create playful, experimental and open-ended frames for exploring a given topic in a new light. In our case, we used probes and playful triggers as material manifestations of the design interventions. Design probes are usually designed for a particular context or question and offer creative means for participants to interact and form a response in a co-creative and empathic way [41]. Playful triggers have the purpose of providing “information about both space and people within a specific context—information that could complement and deepen data gathered via traditional means” [50].
2.3.1. The Microgrid Toolbox
We aimed to explore how the functioning of the microgrid system was experienced and what being flexible meant for the users. For that purpose, we needed to explore what the tenants and other actors in the neighborhood thought of the microgrid and how they currently interacted with it. We conducted this by creating a design intervention called “the microgrid toolbox” (see Figure 1) to probe dialogue concerning the energy flows in the microgrid, flexibility, sharing the PV electricity and identity aspects.
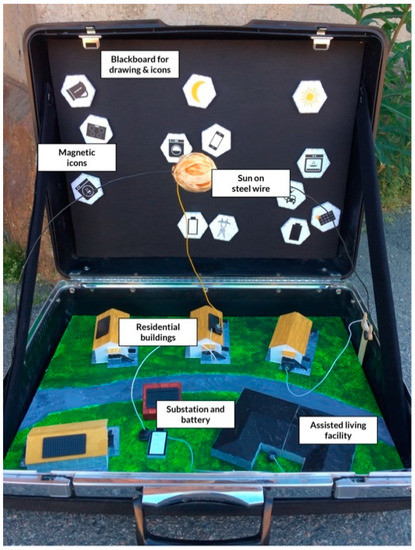
Figure 1.
The microgrid toolbox.
The microgrid toolbox consists of a suitcase that when opened, shows a miniature model of the four tenant buildings along with panels, the substation containing the battery as well as the assisted living facility (ALF). A wire with the sun can be moved across the suitcase (east to west) and different parts of the microgrid such as the sun, the solar panels, the buildings, the battery and the external grid can be connected to each other through short wires with magnets. Furthermore, a black board in the other half of the suitcase can be used to write on with chalk as well as to place magnets with icons representing appliances, elements of the microgrid, and times of the day.
The suitcase was brought to the official inauguration of the microgrid held roughly 6 months after tenants moved in. It was used for discussion with visitors who were interested in the project. We also used it around times when the tenants arrived home to have short, non-intrusive dialogues with them. During the same visit, dialogues were held with people who were either managers or highly active in everyday tasks from the municipal actors. We chose a casual format for these dialogues (unstructured interviews, with topics for conversation as a guideline, rather than a structured interview), in order to let the dialogues be guided by the actors, on their own conditions. We considered such a format to be most relevant, as we wanted to let the actors describe whether and how they related to the microgrid, without too much guidance. The topics for conversation of these interviews were: the uses of the buildings, whether and in what way there is awareness of the PV panels, whether their energy performance is important for their public image, whether they have access to their electricity bill, the potential interest in receiving energy feedback from people in the building, what electricity demanding activities take place on an average day and when they think that they consume most electricity.
During the first visit, we met with a unit manager focusing on the physical environment from the preschool (male) and the manager of the elderly home (female). During a later visit to the area, researchers also held similar dialogues with a staff member working at the ALF (female) and caretakers at the caretakers’ office (two males). The dialogues with municipal staff were recorded, transcribed and embedded into the qualitative data analysis. The notes and transcripts from the dialogues, encounters and the inauguration were gathered and iteratively categorized into themes.
2.3.2. The Microgrid Board Game
When the housing agency announced that the existing microgrid with the residential buildings would be expanded to also include the municipal facilities in the neighborhood, the research team decided to also involve these additional passive prosumers in the research process, by including them in a second design intervention: The microgrid board game (more thoroughly explained in Appendix C). An important insight from our initial visit with the microgrid toolbox was that very few tenants were aware of the microgrid’s existence. We therefore needed to rethink how to start a dialogue around the microgrid, given that most actors were oblivious to its existence. To involve all actors in the extended microgrid and gather their input on their role as participants in a microgrid, their electricity use and their consumption profiles, we decided to conduct a meeting similar to a focus group where representatives from all actors would be present. In order to be able to discuss aspects of the microgrid such as production, consumption, sharing, importing and exporting electricity, we designed a collaborative board game (see Figure 2 and Figure 3). The purpose of designing the board game was to inform the actors about their production and consumption profiles, allow them to reflect on their electricity demanding activities as well as collaboratively explore how they could address the imbalance of electricity consumption and production through shifting or exchanging electricity with others in the microgrid. The goal with the game was to collaboratively import as little electricity as possible, especially during critical hours such as the morning and late afternoon (when there is a strain on the synchronous grid). The board game did not have a “winner” as it was intended to be seen as a conversation tool and something that the participants would collaboratively work on. Since the elderly home had a very high electricity consumption compared to the others, their real consumption was scaled down by a factor of five in the game version in order to make the game playable (they still had the highest consumption).
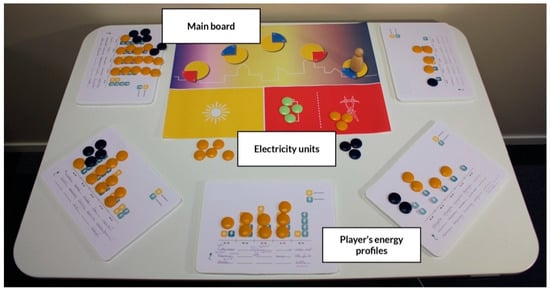
Figure 2.
A photo of the components of the microgrid board game.
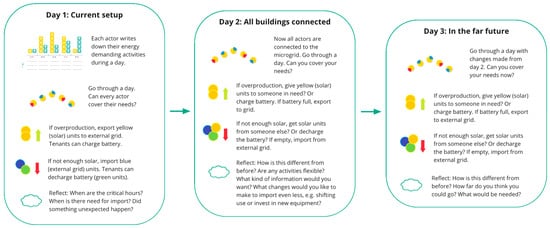
Figure 3.
The setup of the microgrid board game.
The game was played so that the first round would correspond to the current setup (only tenants in microgrid, a lot of imports and exports), the second to how this setup would change when the grid is expanded to include the municipal actors (more electricity units can be shared) and the third to how it could look in the far future (for example, can money be saved to invest in more panels?). In the first round, participants would obtain access to their average daily profile, then write down what electricity-demanding activities that were taking place during a regular day (06–21 in 3-h intervals). In order to cover their electricity needs, they would need to obtain the electricity from either the solar panels (yellow), the battery (green) or the grid (dark blue) in the shape of electricity units. If their own production could not cover the consumption, the only solution was to import electricity from the grid. Similarly, if they produced more than they consumed, their only option was to export their solar units to the external grid. Only tenants could benefit from having access to the battery and therefore “storing” electricity in the shape of battery units until they were needed. In the second round, electricity could be shared or traded between actors because of the extended microgrid. Actors could then adopt a more holistic perspective and experience how their overproduction could be used by someone else in the microgrid and similarly how they could be given others’ solar units when needed. As a consequence, a lot more solar units would remain within the microgrid and stay on their consumption profiles compared to the first round when a significant amount was exported. At the end of each round, participants would reflect on and discuss what the critical hours were, if there is still electricity being exported, what room there is for “moving” activities (and what effect it would have) and ideas for any solutions. The third round would be played with suggestions for improvements implemented, such as a larger battery or more PV panels to discuss how far the participants think they could go (see Figure 3).
To test the board game and gain input from the different actors on how they see their role in the microgrid system, we invited three tenants, representatives from the caretakers, the preschool, the assisted living facility and the elderly home. Unfortunately, all participants but one declined or cancelled their participation close to the event. We tested the game with the manager from the elderly home and with researchers as representatives for the other actors, where the manager reported gaining valuable insights around their everyday electricity activities. There is always a challenge of engaging and recruiting everyday users to be involved in research studies. However, this might be even more difficult in this context for two reasons. First, tenants in rental apartments can have another level of engagement with their housing than home-owners [46]. Secondly, the microgrid in this context had not been communicated to tenants and users (see the results in Section 3 below).
3. Results
This section begins by outlining certain properties of the microgrid’s consumption and production profiles and presenting current self-consumption rates. This is followed by an evaluation of the cost distribution between apartments in the residential buildings, with the municipal actors omitted due to the fact that their bills are currently covered by the municipality. This cost distribution is compared to a more cost-reflective price model that is used to illustrate the complications that result from a crude volumetric tariff. The next section then addresses the qualitative aspects of our findings, with a summary of the themes that were revealed through the design interventions and as a result of the unstructured interviews that were held. The diversity of the selected sections serves to provide a multifaceted understanding of how different sets of independent challenges can intersect in a single empirical setting. For clarity, however, these distinct sections are presented separately below.
3.1. Electricity Consumption and Production
The residential buildings, the elderly home, the assisted living facility (ALF) and the pre-school were all equipped with PV panels. The different capacities of each building’s PV system meant that there were different rates of self-sufficiency between the buildings, shown below in Figure 4, with the residential buildings reaching the highest levels during the summer months and the elderly home having the lowest levels, despite having the largest PV system:
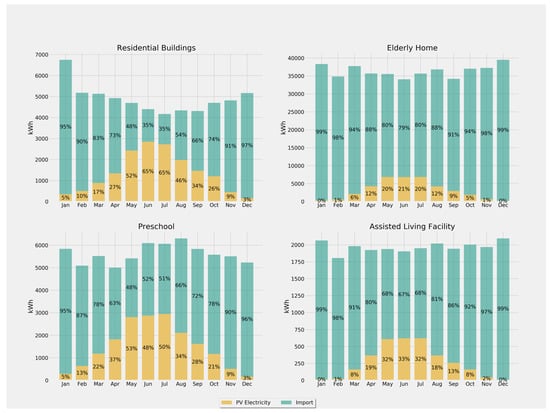
Figure 4.
Monthly breakdown of energy produced from photovoltaic (PV) system into self-consumed energy (green) and energy exported to the synchronous grid (orange).
Both the ALF and the elderly home had a self-consumption rate of 100% due to a stark disparity between their consumption rates and the dimensions of their PV system (considered further below). The residential buildings and the pre-school on the other hand, had self-consumption rates that would drop to around 60% during the summer months which suggests a considerable amount of electricity exported to the synchronous grid over the course of a year (see Figure 5). This was taking place despite the residential buildings sharing electricity through a microgrid, which means that their self-consumption rates would likely be lower if they were disconnected and independent.
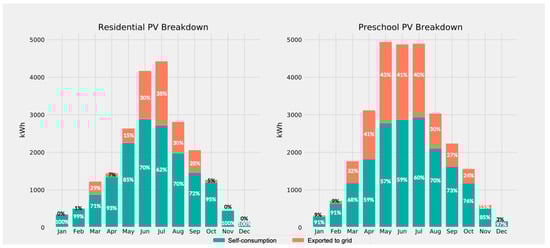
Figure 5.
Monthly breakdown of electricity produced from PV system into self-consumed electricity (green) and electricity exported to the synchronous grid (orange).
Using the aggregated data to generate energy consumption profiles reveals that different buildings had different peaks and troughs (see Figure 6). The optimal consumption profile of a microgrid is highly dependent on the empirical setting. In the case of a PV powered microgrid, it would be advantageous to have a consumption profile that “mirrors” that of a PV production profile, a parabola with a maximum at noon which would maximize self-consumption. In some settings, where capacity shortages could be an issue and a microgrid could be subject to some form of peak pricing, one must also weigh in the magnitude of the peaks in the consumption profile. A sharp consumption peak at noon poses no issue so long as there is PV power, but if insolation were to be substantially reduced (either random weather events, or more predictably, in the winter) the microgrid would then have to import electricity from the grid at high power. If subject to peak or capacity pricing, this could increase the costs incurred, in which case it could be advantageous to reduce the magnitude of the consumption peak, or “flatten the curve”, at the expense of the self-consumption rate. A microgrid that combines different buildings with different consumption profiles should lead to a “balanced” consumption profile that averages the consumption profiles of its constituent parts. This was not the case in our empirical setting, where the elderly home’s consumption was much higher than all the other buildings combined as shown in Figure 6 and Figure 7.
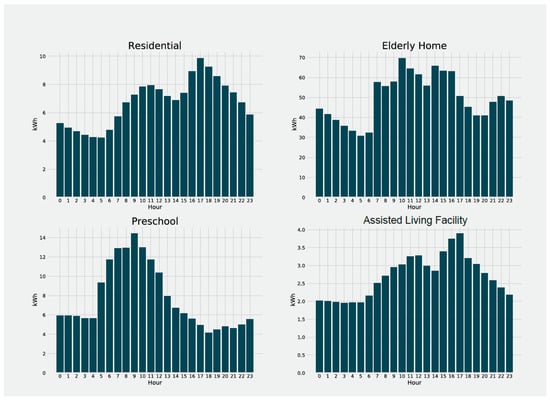
Figure 6.
Different consumption profiles for the different sets of buildings, made by taking the mean of hourly data aggregated over the entire year.
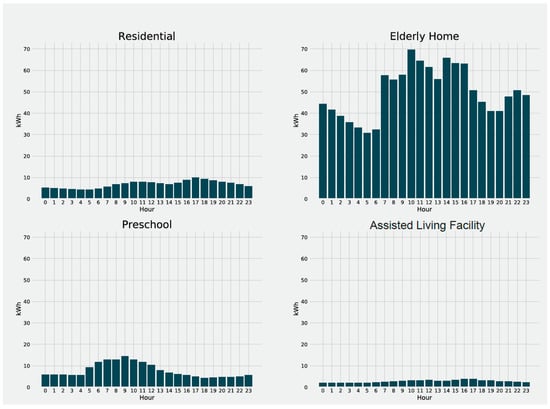
Figure 7.
Consumption profiles of the different figures scaled to the same y-axis, showing the disparity between the consumption of the elderly home and that of the other buildings.
The magnitude of this difference has two consequences. First, combining these sets of buildings into a microgrid would generate a collective profile that largely resembles that of the elderly home. The extreme difference between the consumption levels of the elderly home and those of the remaining buildings ensures that the elderly home’s profile would “dominate” the others in a microgrid. Secondly, combining the buildings into a microgrid would automatically yield a self-consumption rate of 100%, strictly a consequence of the overall consumption of buildings far outweighing their levels of PV production. This maximized self-consumption rate is not reflective of some policy success, but of the fact that merging all buildings into a microgrid sharply tips the balance of consumption and production towards the former and results in a PV system that is severely under-dimensioned. While the self-consumption rate would reach 100%, self-sufficiency rates would have dropped from levels as high as 65% and 50% for the residential buildings and the pre-school (Figure 4), to a meagre 35% for the combined microgrid as a whole. Motivating users to maximize their self-consumption rates remains a relevant question, as the problem would simply re-emerge when PV capacity is scaled up, and so the rest of the results, while useful for general cases, will still be valuable in preemptively addressing the self-consumption problem in this empirical case.
3.2. Cost Distribution
Pivoting from the distribution of loads to the distribution of costs, we reiterate that under the current pricing scheme, tenants pay a flat fee of 0.125 EUR/kWh. This arrangement masks all the variability to which the housing agency itself is exposed to. This includes both seasonal and intra-day variability.
The variations illustrated in Figure 8 embody price signals that “communicate” conditions of supply and demand, with winter seasons being relatively more expensive than summer seasons, and peak hours being relatively more expensive than trough hours. These signals could serve as financial incentives (or disincentives) on the timing of electricity use. When the housing agency pays a dynamic cost that reflects market conditions but then charges the actual electricity users a flat volumetric rate, it is blocking the transmission of these price signals, eliminating any incentive to reflect on the timing of electricity use. This impedance of price signals is one consequence of a volumetric fee. A second consequence is the cross-subsidization of some tenants by others. Under a volumetric fee, the distribution of costs between apartments is solely a reflection of the distribution of the different volumes of electricity consumption. It is not a reflection of the costs that each apartment subjects the housing agency (and thus the community at large) to. The cost incurred by the community is not only dependent on the amount of electricity consumed, but also the timing at which this electricity was consumed. Ignoring this reality blocks price signals and imposes a cost on some users on behalf of others.
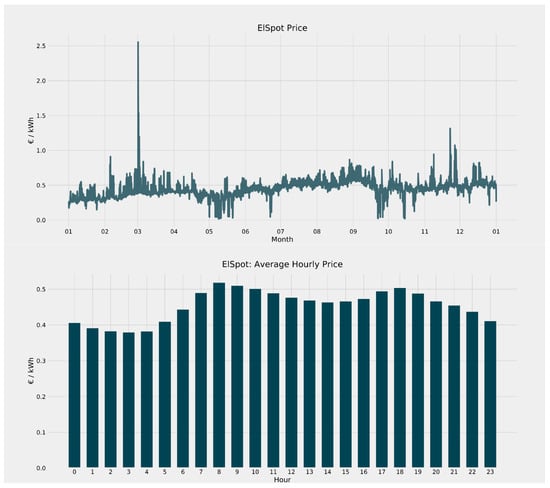
Figure 8.
The annual variability of the spot market price (top) and the average aggregated hourly values (bottom) showing intra-day variability. Prices shown in EUR, and data shown for the year of 2018.
The price model described in the preceding section recalculates the total costs for each apartment subject to the condition that each unit pays for the hourly cost incurred by the housing agency, not the volumetric rate. Adding up these hourly costs over the course of the entire year and dividing by the annual electricity usage reveals the “real” average hourly rate that each apartment actually “owed”, as shown below in Figure 9.
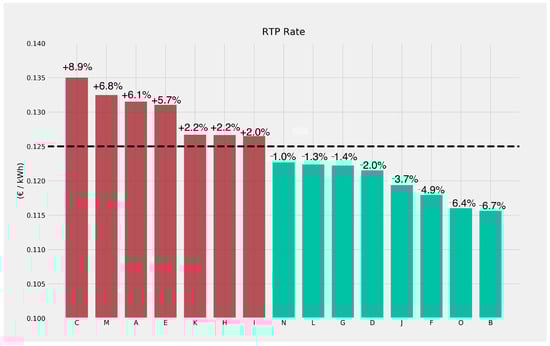
Figure 9.
Average hourly cost incurred by an apartment compared to the average hourly rate they actually paid. The dashed black line shows the flat rate of 0.125 EUR/kWh paid by tenants under the existing pricing scheme. Each bar shows the average annual cost incurred by a user, when the share of PV electricity and the real-time market price is factored in, as in the proposed price model. Red bars represent users who incurred more costs than they actually paid for and would have paid more under the proposed price model. Green bars represent users who incurred less costs than they actually paid for and would have paid less under the proposed price model. The percentage above each bar shows the percentage change on the annual bill of a given apartment under the proposed price model. Apartment units were anonymized and randomly assigned letters.
Apartments that have rates higher than the 0.125 EUR/kWh are those that use relatively more electricity during pricier hours and/or make less use of the PV electricity generated by the microgrid (which is provided free of charge under this model). These users are effectively being subsidized by those with rates less than 0.125 EUR/kWh, who use relatively less electricity during pricier hours and/or make more use of the generated PV electricity. The price model essentially redistributes costs from the former to the latter, resulting in a more cost-reflective allocation.
A second and perhaps equally important channel of redistribution occurs across seasons. The microgrid’s collective electricity consumption is more expensive during the winter than during the summer, firstly due to the reduction in insolation and sunshine duration (which means reduced PV), but also because the market price of electricity tends to be higher during the winter. This seasonal difference is masked when users pay a flat rate, and the proposed price model accounts for this difference, as can be seen below in Figure 10.
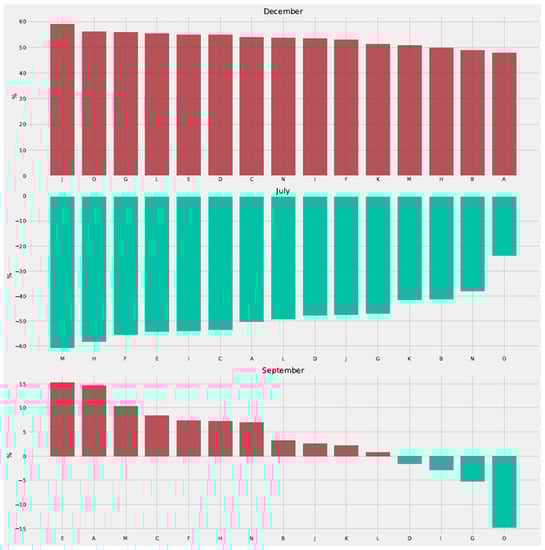
Figure 10.
Percent differences in the monthly bills of the apartments under the proposed pricing model shown for three different months. December and July were selected to contrast the seasonal extremes, and September was selected as an intermediary case. Note that the graphs are organized in descending order and the x-axis therefore differs in each month.
While the redistribution discussed above centered on cross-subsidies moving from one group of users (those who incur relatively higher costs) to another (those who incur relatively less costs), the graph above indicates that there is also a temporal transfer that moves from all users during the summer months back to themselves during the winter months. Under a flat rate, all users are under-paying during the expensive winter months and over-paying during the cheaper summer months. The flat rate had likely been selected so that these differences average out over the span of the year. This represents a very clear block to price signals, as users currently receive no indication of this seasonal price differential.
3.3. Themes Uncovered through Design Interventions and Dialogues
This section describes the qualitative themes uncovered during our design interventions (showing the microgrid toolbox to tenants) and unstructured interviews with the preschool, the elderly home, the assisted living facility and the caretakers’ office.
3.3.1. Awareness Contrast
From our explorations and non-structured interviews, we discovered that the people in the neighborhood were generally aware that they live and work in passive buildings. Tenants we spoke to mentioned the fact that passive buildings are unique and one tenant reported that they feel a certain pride in living in a passive building. The preschool was also highly aware, mostly because they experienced issues with the heat in the summertime. The preschool representative also reported that the combination of a passive preschool with solar panels is unique in the municipality. Tenants were also aware that there were solar panels, with one tenant even pointing out that the solar panels covered a larger area of the roof in reality than in the researchers reconstructed model of the neighborhood in the Microgrid Toolbox.
In contrast, no one that we talked to knew about the microgrid and that electricity that isn’t used in one tenant building can be used in the neighbor’s building without passing through the synchronous grid. The housing agency reported that they had not specifically informed tenants about the fact that they were to live in a microgrid when they were moving in, and the moving-in brochure only mentions that a battery exists so that the solar power can be used at a later time. When talking to the municipal actors, there were different notions concerning the energy infrastructure. Some did not even know that they had solar panels on the roof (elderly home) nor that they were to be incorporated into a microgrid while others seemed to think that it was possible to store electricity from the solar panels in their workplace (preschool):
“I mean, that this is a passive building and that you’re not supposed to open windows in order to save energy, everybody knows that. But that there would be a connection to [buildings] next door here, I’m not sure actually. And storage possibilities, whatever that means and so on, I don’t think is something people know” (Preschool).
This reveals a spectrum of awareness ranging from knowing that one lives in a passive building (almost everyone knows) to knowing that one’s building has solar panels (most are aware) to knowing that one’s building is or will be connected to others through a microgrid with battery storage (almost no one was aware). This is probably related to both visibility and communication as generally, people know that they live or work in a passive building because of the thick walls, and almost everyone has seen the solar panels on the roof. The microgrid, however, remains hidden and not communicated which might explain why no one was aware of its existence.
3.3.2. Conceptions around Energy Use and Consumption Patterns
A second theme from the qualitative data was the conception and understanding of energy usage along with its timing. The preschool representative reported several challenges relating to energy use, for example, that they might need to keep the ventilation running during nights in the summer to reach a cool enough temperature during the day. He then pointed out the contradiction in solving the heating problem through more electricity usage. There were different conceptions among the actors on when their electricity consumption peak occurs, but both the preschool and the elderly home thought their peak would coincide with their cooking times. The director of the elderly home reported that they use a lot of electricity and probably are the biggest electricity consumer in the neighborhood, partly due to running a lot of laundry machines during the day. She also reported how the daily schedule at the elderly home needs to be adapted to the elderly’s needs and daily conditions. One of the tenants of the apartment buildings mentioned that she turns on the dishwasher in the evening because she was informed that it was the best time to do so. The ALF reported that their tenants have quite a strict schedule when it comes to eating dinner, washing and so on. The representative also hesitated when asked whether someone living there would even be remotely interested in an energy saving intervention, as they usually are very focused on their personal interests. Similar reasoning took place in the elderly home, and since people living in these assisted facilities need support in everyday domestic activities such as cooking and washing, it might prove to be more difficult to engage them in energy interventions to increase self-consumption. It was also questioned during the inauguration by the visitors whether appliances should be running unsupervised due to safety risks.
The caretakers of the housing agency had a clear image of when and how electricity was being used, as this was tightly connected to their working hours during the day. As caretakers, however, they are not just working in a building that would be part of the microgrid, but also with maintenance of the apartment buildings. They also expressed skepticism at the idea that self-consumption could be increased through users changing routines:
“I think this challenge that you said, that is not unsolvable technically... But it is just like you say, if it is anything that is difficult to implement then it is how people [behave]... I mean we eat lunch at 12 and we eat dinner at 5–6 so it might be difficult to shift those routines, then one probably does not think it is that interesting anymore to live and pay rent to [the housing company] if you have to eat lunch at 2“ (Caretaker 2).
This was, however, the only instance when someone reflected on the details of how behavioral change would be necessary for increasing self-consumption. The caretakers also discussed how the different actors relate to each other in terms of electricity consumption, exemplified by when different actors have lunch.
3.3.3. On Different Types of Energy Feedback
None of the actors, except for the tenants, reported receiving any feedback on their electricity consumption through something like an electricity bill. In all the municipality-owned facilities, the bills go to another department within the municipality that manages the buildings, and not to the facilities themselves. Among the tenants we spoke to, some had seen that there was a display on the substation building (where the batteries and technical equipment is located) showing the amount of kWhs produced by the PV panels, while others had not. Since no tenant knew that they lived in a microgrid, it was difficult to talk about what type of feedback they would be interested in. One tenant was interested in learning about the amount of produced electricity, especially during the summertime. Another tenant reported that it would be interesting to know the environmental benefits of living in an apartment such as theirs compared to an ordinary apartment. The preschool also wished for more environmental information to help build their image. In contrast, when asking the elderly home about incentives, the manager reported that environmental messages probably would impress the grandchildren more than the elderly themselves.
Lastly, the housing agency had made it clear during our conversations, that it was their ambition to instill a sense of community and pride for the tenants living there. How this would be closely integrated with the tenants and what type of engagement could be encouraged remains unanswered. Similarly, the elderly home expressed a wish for opening up their building for the local community by hosting exhibitions or activities for example, so that people naturally would feel a connection to their facility.
4. Discussion
In this section we consider the implications of the previous results and attempt to draw attention to a set of issues which we deem highly relevant to the topic of energy communities. We set out to explore user engagement as a means to increasing self-consumption and sequentially present the main challenges that were identified. We begin with elaborating on the problem of price signal impedance and the flaws of flat rate pricing. We then consider obstacles to the extension of an internal price model to various actors in a microgrid. We examine the limits of price signals and financial incentives that emerge when dealing with user heterogeneity and highlight the importance of a user engagement strategy that employs an integrated approach to user engagement. Finally, we outline how this integrated approach requires one to consider how to instill a basic level of awareness in an energy community, how to frame the electricity flows of a system and the impact of a user’s behavior on this system, and how to align incentives for behavioral change through fostering a sense of community.
4.1. Price Signal Impedance
A fundamental component of any approach to engagement is the transmission of information. If users are to be engaged concerning their electricity consumption, they could benefit from information on their current habits and “signals” that convey the effect of a behavioral change. These signals could take a variety of forms, but we begin with considering prices, and how they could be used as signals in microgrids or other similar settings. There is no consensus on whether price signals would be acted on as “pure” financial incentives. Regardless, they could still play an informative role in communicating conditions of supply, demand and self-consumption. Pricing schemes that take dynamic prices and convert them to fixed or volumetric rates, such as the case in our empirical setting, obstruct any signal from reaching the end user. These include intraday signals between “peak hours” and hours that have high low spot prices or high PV production, but they also include sizable seasonal signals, with winter months being substantially more expensive than summer months. Additionally, they result in a regressive cross-subsidy from some users to others. Those who use electricity from the synchronous grid at cheaper times and/or use more PV electricity are effectively subsidizing the consumption of those who use electricity from the synchronous grid at more expensive times and/or less PV electricity. A more cost-reflective price model, such as the one suggested in the sections above, would allow the transmission of these price signals. As mentioned, even if the price model does not incite a strong demand response through a financial incentive, it could still bolster an engagement strategy that emphasizes the importance of the timing of one’s electricity consumption. At the very least, a more cost-reflective price model would create a more equitable distribution of costs between the apartments, where users pay according to both the amount of electricity they use and the timing at which they choose to use it.
4.2. Extending the Price Model to Other Actors
In the empirical context that was the subject of this paper, the price signal was strictly applicable to the residential buildings. The municipal buildings could not be included primarily because the costs of their electricity consumption were handled outside the jurisdiction of the housing agency, and so whether they could formally or legally be subject to an internally managed price model was ambiguous. This is an issue that may surface in a more general form within energy communities and raises important questions regarding their internal management. Even if all parties were to agree to the adoption of a price model, there is currently no formalized legal framework for internally repricing electricity inside a microgrid composed of different actors. Despite the housing agency owning these buildings, the costs incurred and paid by the municipal actors were handled between the municipality, the DSO and retailer, outside the administrative authority of the housing agency. While it is conceivable that a commercial actor could informally agree to an internal price model with other actors, public actors are subject to a more rigid set of rules and regulations which may limit the extent of their participation in an energy community [2]. The need for legal frameworks that enable energy communities and support renewable expansions has been identified and discussed, but the extent of their autonomy and their ability to carry out policies such as the internal redistribution of costs requires further development and evaluation.
4.3. The Limits of Price Signals
Suppose a legal framework that incorporates the different actors exists, and that all have agreed to an internal price model that sends signals and provides economic incentives. An arguably more important impedance to these signals is the gap that exists between those responsible for the cost of electricity and those who use it. The price model proposed applied to a set of apartments that were occupied by users who paid for their electricity consumption, a situation where a financial incentive is clear, and a price signal is transmitted. If one were to instead consider an alternative rental situation, where tenants pay rent to owners, then including the cost of electricity in the rent would block any price signal and remove any incentive for a tenant to shift the timing of their consumption. This issue is even more pronounced in the case of the municipal buildings. In settings such as preschools and elderly homes, the employees who are the end users of electricity are not financially responsible for the costs of this usage and have limited flexibility on deciding when to use it due to fixed schedules and rigid routines. Even if the buildings were subjected to an alternative price model, the employees using the electricity would only be made aware of any change through a direct and targeted intervention from the higher levels of management responsible for these administrative functions. This is not an issue exclusive to microgrids and energy communities but is a mismatch of incentives that may exist in stand-alone buildings today. In the case where public actors such as the municipal buildings do adopt alternative price models and attempt to shift the electricity consumption of their employees, they cannot exclusively depend on a price signal, for the simple reason that their employees would still not be financially accountable for their consumption. Engaging a heterogenous set of users, that includes both tenants who pay for their electricity and employees who are solely users, alongside a more general set of public and perhaps commercial actors, requires the consideration of other forms of signals and incentives, and a broader, more flexible engagement strategy.
4.4. Extending the Engagement Strategy
When designing an engagement strategy that includes alternative, non-financial components, an “environmental signal” is one reasonable candidate given the grander context of the role renewable electricity plays in the energy transition. Indeed, some of the actors spoken with expressed an interest in receiving information regarding the environmental impact of the microgrid. An “environmental signal”, usually quantified as the amount of CO2 offset or conserved by carrying out a specific action, could appeal to certain types of users and create an incentive for those who would not be motivated by cost reductions. Like the price signal, it is not clear whether an environmental signal could induce a demand response on its own accord, but it could complement the price signal and play an important motivational role in the engagement strategy. This possibility was complicated by the outcomes of a life-cycle assessment (LCA) study performed on the microgrid [51]. The study concluded that electricity from the synchronous grid emits less CO2 than that from the microgrid. Despite the microgrid using PV electricity from solar panels, its carbon footprint was higher than that of the mainly nuclear electricity (which has lower CO2 emissions) that came from the synchronous grid. This is an important limitation, and points to the difficulty of offering an environmental incentive when an environmental signal cannot be condensed into the simple message of off-setting a certain amount of CO2. This applies in any setting where a given country has a large share of renewable or nuclear electricity in the synchronous grid. Other approaches could involve the use of alternate forms of information and feedback, though the type of information, the sentiments to appeal to and the format through which to convey this feedback are difficult specifications to select given the heterogeneity of the microgrid’s users. The limitations of price-based and environmental feedback have been discussed, but other channels include normative or feedback on historical use, which has sometimes been employed in residential settings but could possibly be adapted to non-residential users as well. It is worth reiterating that the microgrid’s users range from private tenants and elderly home occupants, to caretakers, cooks and teachers. It is difficult to envisage how an indiscriminate engagement strategy based on a unidimensional signal of any sort could be applied to the microgrid while resonating with all its various constituents. Appealing to a collective sense of community however, perhaps a common denominator for all users, could be a central feature of a multifaceted engagement strategy, and resolve some of the mentioned difficulties.
4.5. User Engagement
Instilling a sense of community and shaping a collective identity introduces a further set of challenges in how users are introduced to and perceive their role within an energy community. Addressing these challenges is critical in order for people to adopt the role of energy citizens and become more democratically involved. We will here describe these challenges and exemplify them using experiences from the design interventions.
First, we report that in our empirical case, the existence, function and advantages of a microgrid have not been communicated to its users. Even in the most basic strategies for engaging users, information should be distributed about what a microgrid is, why it was built and why people should care about it. The lack of any communication explains why no one in the microgrid knew of its inception or existence, and we argue that this basic awareness is a fundamental preliminary step to engaging the microgrid’s users.
Secondly, it was observed that since people did not know about the microgrid’s existence, they were unaware of the basic electricity flows in the system and unable to form their own understanding of it. Technical representations of electricity systems such as wiring diagrams are not easy to understand for its everyday users (as illustrated by the system’s wiring diagram in Figure 11). The microgrid toolbox and the microgrid board game fulfilled their function as discussion and learning tools for the project to shape an understanding of system technicalities and electricity flows in a more user-friendly way. For designers, whose knowledge on electrical inverters and DC grids is very limited, the microgrid toolbox also functioned as a translator between our mental model of the system and its proper functions. Similarly, the board game allowed the researchers and participants to discuss what room there is for flexibility and when and how sharing electricity with others could work. It might be valuable to further address these human values and explore how sharing electricity with other users and facilities is perceived and whether users can ascribe any personal meaning to living in a microgrid. These human value and mental model aspects are important to explore, as they can explain a lot about why users act the way they do in relation to technologies and energy practices [52]. We encourage future research to further explore what tools for enabling co-creative dialogue in small-scale energy communities could look like, and also encourage cross-disciplinary research teams to use these tools for bridging perspectives.
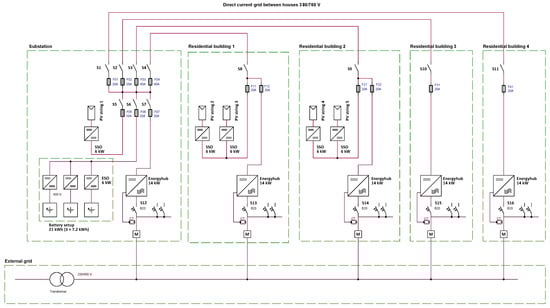
Figure 11.
Wiring diagram of the microgrid provided by the system developer.
Our third challenge concerns a user’s awareness of their electricity consumption practices and how this relates to other participants’ practices. As seen from the qualitative findings, users’ knowledge of energy intensive appliances were varied. One way of translating this could be through their consumption profile, i.e., how much they produce and consume, as we tried to illustrate through their average daily consumption and production in the board game. Although this needs to be tailored to the users’ knowledge and interest in the system, it can provide a brief understanding of what their consumption pattern looks like during an average day. Different user roles can also be expected to have different levels of energy awareness, literacy and motivations [29] which still is only one part of everyday life that has an impact on energy practices. Feedback can also be given on a more frequent basis, through digital applications or in-home displays. However, careful consideration is needed, since simply providing energy feedback or other smart metering technologies is argued to be insufficient to stimulate user engagement [36,37] and this might be particularly complicated with rental apartments [46]. It may be valuable for users to also get a feeling for how others’ profiles look like in relation to their own in order to encourage reflections on what their energy practices look like from a more holistic perspective.
Fourth, if participants in an energy community are expected to alter their practices or shift their energy usage, users need to be able to co-create their incentives for doing so. If the incentive is further outlined to include some kind of goal for the entire community (e.g., percentage of self-consumption rate), this needs to both be democratically agreed upon by all users and to be realistically achievable. As exemplified by the focus group with the board game, it may be very valuable to have a dialogue and create an understanding of each other’s incentives and possibilities, fostering a sense of community. The collective factor of taking part in a joint effort deserves further attention as simply being part of a community may function as a motivating factor [42].
Lastly, we highlight the importance of working closely with users around expectations and responsibilities and allowing more diverse forms of participation in this type of small-scale yet diverse energy communities. Future studies could study how participatory methods where users are involved and empowered in the development through new forms of energy citizenship can be related to a sense of community as wished for by some of the public actors and the housing agency. Furthermore, we recommend future research and similar interventions to adopt a mindset of engagement and dialogue, acknowledge people as energy citizens and allow for participation in the community on more democratic foundations.
5. Conclusions
5.1. Summary
Microgrids are complex structures that combine a variety of actors with equally various backgrounds. A central feature of any microgrid is the ability to produce and harness its own energy, developing a degree of energy independence. Producing electricity that is ejected into the synchronous grid only to be purchased back later undermines this independence. Self-consumption is therefore a sensible metric to consider when evaluating the performance of a microgrid. Aside from expensive and technical solutions such as energy storage, behavioral change is one clear lever for increasing self-consumption rates, and it relies on engaging users. Engaging users demands an understanding of the signals and incentives that could be used for communication, differences between them and their respective interests, as well as their subjective interpretations and understanding, as constituents of an energy community. This range of issues has usually been addressed separately in the previous literature. Through collectively studying these topics, we hoped to place them in a broader context and shed light on the challenges that arise not just from each, but from their intersection as a whole.
In this paper, we investigated an empirical case of a DC microgrid equipped with PV panels. We sought to identify challenges in engaging the microgrid’s users and motivating them to increase the self-consumption of PV electricity. To do so, we employed different quantitative and qualitative approaches that allowed us to explore the physical and social dimensions of the microgrid. We conclude that flat volumetric tariffs impede intraday and seasonal price signals from reaching end users and create a regressive redistribution of costs. We emphasize the need for dynamic, cost-reflective price models but recognize the lack of a formal framework for extending these models to various types of actors and stakeholders within a common energy community. We describe the limits on price signals and financial incentives in settings with a heterogenous set of actors, and highlight the need for a broader approach that incorporates a wider set of motivators while appealing to a collective, community-based identity. We finally address the challenge of conceiving an integrated approach to user engagement, and the significance of centering it around awareness, an understanding of electricity flows and the impact of behavior, the co-creation of incentives and the importance of using participatory methods to stimulate dialogue throughout the process.
5.2. Policy Recommendations
We firstly recommend the removal of any and all obstructions to price signals in both residential and non-residential settings. Even in the absence of renewable energy sources, and aside the goal of incentivizing an increase in self-consumption, the real-time price of electricity is a signal that reflects the market conditions of supply and demand. When these prices are not transmitted to their end users through scenarios such as “averaging out” total costs into a flat rate, or including electricity in rents, whether to private tenants or non-residential actors, these signals are blocked and unfair cross-subsidies between different users take place. Energy communities should then be encouraged to design and adopt internal price models (among other tools) that suit their collective goals (such as increasing self-consumption). We therefore recommend the formulation of supportive legislative frameworks that strengthen the autonomy of energy communities and their ability to locally govern. We then recommend that increased attention be given to the problem of user heterogeneity in energy communities, and to avoid an overreliance on prices and financial incentives as a demand side management panacea. Policy and research should target and investigate the potential of broader multifaceted approaches that incorporate various tools in engagement strategies that may appeal to a diversity of users with various motivators and barriers.
5.3. Methodological Considerations & Future Work
Each of the approaches used in the methods above could have been improved through more elaborate and detailed designs. Specifically, from the quantitative side, a pilot study on the implementation of the alternative price model, and a statistical evaluation of its effect would have undoubtedly benefited the study in its identification and description of practical challenges. The reason this was not carried out was the reluctance of the housing agency to carry out a full-fledged intervention. Given that the price model would be “internal”, the housing agency would be responsible for the practical implementation of this new model, including the calculation of costs, the re-design of invoices and the communication of the need and benefit to the tenants. This required a degree of commitment and organization that was not within the capacity of the housing agency at the given time. The reliance of the cost distribution analysis on a single year of data limited our ability to draw general conclusions regarding the distribution of costs. The analysis itself was, as mentioned, rather crude and amounted to a “what-if” scenario under a more cost-reflective price model. We deemed this sufficient to express our concerns with the impedance of price signals and the cross-subsidization of electricity costs, but a more sophisticated time-series model could allow one to forecast how different pricing schemes could influence load patterns and demand levels. Additionally, it would be very interesting to explore the effects of a different price model and assess how consumption patterns change, perhaps a task for future research.
There were several methodological constraints on our qualitative data gathering. For the engagement aspect, more interviews and dialogues could have been held with participants to, for example, discuss their thoughts on living in a microgrid, how they view their electricity consumption or what they experience from having PV panels. Unfortunately, no additional dialogues were held due to limited interest from tenants. The microgrid toolbox was designed with a more informed user in mind, resulting in a difficult situation when trying to invite tenants for participation with it. Similarly, the board game was only tested with one actor which means that we cannot really conclude whether it filled its purpose. However, the approach of using a board game to explain and stimulate discussions around a microgrid with its users is novel and we therefore deem it relevant to explain and illustrate here and invite future research to explore its potential.
Author Contributions
Conceptualization, F.E.G., S.N., L.R. and C.B.; data curation, F.E.G.; formal analysis, F.E.G. and S.N.; funding acquisition, C.B.; investigation, F.E.G., S.N., L.R. and C.B.; methodology, F.E.G., S.N., L.R. and C.B.; project administration, C.B.; supervision, L.R. and C.B.; validation, F.E.G., S.N., L.R. and C.B.; visualization, F.E.G. and S.N.; writing—original draft, F.E.G. and S.N.; writing—review and editing, F.E.G., S.N., L.R. and C.B. All authors have read and agreed to the published version of the manuscript.
Funding
This work was financed by the Swedish Energy Agency for call “Research and innovation programme SamspEL” under project grant “On Off or midway between in apartment blocks (44362-1)”.
Institutional Review Board Statement
Not applicable.
Informed Consent Statement
All interviewees gave their verbal consent to for recording and participating in the study.
Data Availability Statement
The data presented in this study are available on request from the corresponding author. The data are not publicly available due to possible identification of individuals.
Conflicts of Interest
The authors declare no conflict of interest. The funder had no role in the design of the study; in the collection, analyses, or interpretation of data; in the writing of the manuscript; or in the decision to publish the results.
Appendix A
Data Issues and Adjustments
The consumption data of the municipal buildings for the year 2018 was intact. The residential buildings were missing the months of January, February and March 2018, but we were provided with the hourly data for January, February and March 2019 instead. Additionally, data for the month of April were missing for two of the four residential buildings. Given that the nature of the investigation was exploratory, and that we intended on investigating a full year of data, it was first decided to treat from January–March 2019 “as if” they were from the year 2018 (through manually changing the year for those specific months) and then to impute data for the two buildings missing the month of April, using the months prior and after. This was carried out for two reasons; the first was so that we could create an annual consumption profile that was chronologically labelled according to the months of the year (instead of having charts that start at April and end in March). But more importantly, data from the municipal buildings were from the year 2018, and so labelling these months as 2018 instead of 2019 allowed us to merge these data together to create a crude simulation of the microgrid annual energy performance.
While we understand that these adjustments would not be acceptable in any causal, experimental or analytical context, we stand by them firstly due to the aforementioned explorative nature of the paper, but secondly because they ultimately have no substantial effect on the results outlined and the conclusions drawn. The only graphs affected by this result are Figure 4 and Figure 5, which could have been oriented such that the same bars are shown starting from April and ending in March. Regardless, the main result is the share of exported energy during the summer months, which is entirely unaffected.
The data discussed above were taken from the DSO and represented data for the entire buildings, consisting of the apartments but also public and common spaces. The residential buildings included 16 apartments. A separate dataset obtained from the housing agency contained the hourly consumption data for 15 of these 16 apartments, with one missing. These data were not used for the evaluation of the total consumption and self-consumption (as it omitted consumption in public and common spaces), but were used for the investigation of the cost distribution. The missing apartment was dropped, and did not affect the analysis, since the analysis compared the costs for each apartment under two different scenarios, and is not influenced by the total number of apartments.
Appendix B
Price Model Clarification
The “hourly rate paid by the housing agency”, seen in Equation (2), is actually composed of two components. The first is a “retailer” component that is paid to electricity retailers for the purchase and transmission of electricity. The second is a “DSO” component (short for distribution system operator) and goes towards the distribution of electricity by the DSO in the local grid. In our empirical case, the retailer component was the dynamic cost that fluctuated in accordance with the hourly spot price. The DSO component was actually a fixed monthly fee and did not fluctuate. This was to do with the particular DSO of the local grid in our empirical setting. Other DSOs can employ dynamic pricing and even power-tariffs. In any case, a fully “reflective” price model would have passed on the retailer component as a dynamic hourly price, and the DSO component as a fixed cost that does not fluctuate by the hour. Instead, the price model we used “absorbed” this DSO component and converted it into a dynamic price. The reason being that these price models were not just simulations used to explore the distribution of costs but were actually being developed as tools to strengthen the incentive for users to recognize and respond to the timing of their electricity usage. The decision to turn the fixed DSO component into a dynamic price was carried out in order to amplify and strengthen a time-varying price signal.
Before delving into how this was carried out, it is important to reiterate that these price models are revenue neutral. The monthly costs paid by the housing agency to the retailer and the DSO are taken as fixed, and no matter how costs are re-distributed among users, they necessarily must sum up to the same monthly total that was actually paid for by the housing agency. Maintaining revenue neutrality while strengthening the time-varying price signal was carried out as follows. The fixed hourly component, which does not vary in time, was dropped from the hourly cost charged to users in the price model. This introduces a deficit which is counteracted by the insertion of a multiplicative factor, f, that inflated the hourly spot price by a certain margin, above its actual value, so that when the costs were summed up at the end of each month and over the span of the year, the total costs incurred by the housing agency remains the same. To reiterate, the model outlined in the Method Section 2 made use of an “hourly rate”, Rh, which was paid by the housing agency to the electricity providers.
But this hourly rate could be more elaborately unpacked into the following:
where Sh is the hourly spot price paid to the retailer by the housing agency (EUR/kWh), and f is the scaling factor iteratively calculated to ensure revenue neutrality, value of 3.7 was used.
Rh = f × Sh,
The scaling factor, f, was calculated iteratively, by starting with a value of 1, calculating the total cost paid by all the apartments in the sample and comparing it to what was originally paid. It was then gradually increased until a break-even point of around 3.7, where the total costs of the price model (over the year) were equal to those of the original volumetric scheme. So, in summary, instead of the hourly cost being composed of a dynamic real-time component and a flat, fixed component, it only consisted of the real-time component, and was multiplied by a value of 3.7 to make up for the deficit created by the omission of the fixed component. The costs did not exactly even out at the end of each month—there were slight surpluses and deficits—but the selected factor ensured they balanced out at the end of the year to yield the same total cost. This was carried out for no other reason than to increase the variance in price, amplify the price signal and try to emphasize differences in different hours of use.
This digression was omitted from the body of the research paper because we do not believe it affects the resulting conclusions in any way. The price model was an active policy being developed and proposed for use in the microgrid, but as mentioned, was only used here to illustrate certain features of the cost distributions for the purposes of this paper. Even if the hourly cost did not absorb the DSO component and left it as a fixed fee, the impedance of price signals and the existence of cross-subsidies would still be apparent, albeit in a weaker form. We include it here for full transparency in the goal and design of the price model.
Appendix C. Explanation of the Microgrid Board Game
The board game consisted of a main board showing the time slots during a day (06–21 in 3-h intervals) along with room for energy units for battery, PV panels or synchronous grid. Each player also had their load profile in front of them, showing how much energy they produced and consumed for each 3-h time interval. Below the profiles, there was space for writing down what energy demanding activities they have ongoing during the time intervals. The game also had a wooden piece in the shape of a person that was moved along the main board’s 3-h intervals during each game round. Also, wooden pieces in different colors were used to symbolize different types of energy that were either generated by the PV panels (yellow), stored in the battery (green) or imported from the synchronous grid (dark blue). A scoreboard in the shape of a small blackboard can also be used to help keep track of the amount of energy used, imported and exported throughout the game rounds.
The goal of the game was to import as little electricity as possible, especially during the hours of 06–09 and 15–18 when there is a strain on the synchronous grid. The board game did not have a “winner” in a traditional sense as it should rather be seen as a conversation tool. The players would start by filling in their activities on their load profiles for each time slot, to reflect upon what activities and appliances are turned on during the day.
The game was played through three game rounds or “days” on the main board. In the first round, the players would act out how the current system and setup works. This would mean that for each time interval, if they were not producing enough electricity through their own PV panels according to their personal load profile, they would need to import the electricity missing to cover for their consumption and hence be given dark blue units. Similarly, if they were producing more energy than they were consuming, the energy would need to be exported to the synchronous grid for all players except tenants that could use the battery. Exporting would be carried out by placing their solar units at the icon for synchronous grid on the main board. This would be repeated for all players during all time slots. At the end of the first day, the players would reflect upon when the critical hours are, when there is a need for import and if there were any unexpected events.
During the second day, the game would be played in the imagined near future when the microgrid is extended to also include the municipal actors. The day would be played through again but with the change that electricity currently not used could be given to another player in need. The players would then reflect on what type of compensation or information they would like to receive in relation to the exchange of electricity. Players would also be encouraged to reflect on how this differs from the day before, if there still are critical hours when importing energy is needed or if there is still electricity from the PV panels that is exported to the synchronous grid.
Before round three, players were encouraged to reflect around how flexible their practices and activities are in time, and if possible, what could motivate them to do these activities at another time? Players were also encouraged to reflect around what changes they would like to make in order to import even less electricity. For example, investing in more solar panels or a larger battery? Or something else? And if they were to move their activities in time, how much do they think that would affect their profile?
Round three is optional and might be replaced with general discussions. However, if players want to, it could be played but with the changes made that the players agreed upon after round two. Players are then encouraged to reflect upon how far they can go, if they can eliminate the need for import completely? And if so, what would be needed from them or in terms of equipment? Lastly, players reflect and discuss if there was something unexpected with the game, and how they think the sharing of electricity can be improved.
References
- Platt, G.; Berry, A.; Cornforth, D.J. What Role for Microgrids? Elsevier Inc.: Amsterdam, The Netherlands, 2012; ISBN 9780123864529. [Google Scholar]
- Caramizaru, A.; Uihlein, A. Energy Communities: An Overview of Energy and Social Innovation; Publications Office of the European Union: Luxembourg, 2020. [Google Scholar]
- Rieger, A.; Thummert, R.; Fridgen, G.; Kahlen, M.; Ketter, W. Estimating the benefits of cooperation in a residential microgrid: A data-driven approach. Appl. Energy 2016, 180, 130–141. [Google Scholar] [CrossRef]
- Balducci, P.; Mongird, K.; Wu, D.; Wang, D.; Fotedar, V.; Dahowski, R. An evaluation of the economic and resilience benefits of a microgrid in Northampton, Massachusetts. Energies 2020, 13, 4802. [Google Scholar] [CrossRef]
- Mahmoud, M.S. Preface. In Microgrid: Advanced Control Methods and Renewable Energy System Integration; Butterworth-Heinemann: Oxford, UK, 2017; pp. xiii–xvii. ISBN 9780081012628. [Google Scholar]
- Herrmann, M.R.; Brumby, D.P.; Oreszczyn, T. Watts your usage? A field study of householders’ literacy for residential electricity data. Energy Effic. 2018, 11, 1703–1719. [Google Scholar] [CrossRef]
- Klein, M.; Ziade, A.; de Vries, L. Aligning prosumers with the electricity wholesale market – The impact of time-varying price signals and fixed network charges on solar self-consumption. Energy Policy 2019, 134, 110901. [Google Scholar] [CrossRef]
- Buckley, P. Prices, information and nudges for residential electricity conservation: A meta-analysis. Ecol. Econ. 2020, 172, 106635. [Google Scholar] [CrossRef]
- Shin, J. Perception of Price When Price Information Is Costly: Evidence from Residential Electricity Demand. Rev. Econ. Stat. 1985, 67, 591–598. [Google Scholar] [CrossRef]
- Michelfelder, R.A.; Pilotte, E.A. Information in Electricity Forward Prices. J. Financ. Quant. Anal. 2020, 55, 2641–2664. [Google Scholar] [CrossRef]
- Parag, Y.; Sovacool, B.K. Electricity market design for the prosumer era. Nat. Energy 2016, 1. [Google Scholar] [CrossRef]
- Liu, N.; Yu, X.; Wang, C.; Li, C.; Ma, L.; Lei, J. Energy-Sharing Model with Price-Based Demand Response for Microgrids of Peer-to-Peer Prosumers. IEEE Trans. Power Syst. 2017, 32, 3569–3583. [Google Scholar] [CrossRef]
- Cornélusse, B.; Savelli, I.; Paoletti, S.; Giannitrapani, A.; Vicino, A. A community microgrid architecture with an internal local market. Appl. Energy 2019, 242, 547–560. [Google Scholar] [CrossRef]
- Mengelkamp, E.; Gärttner, J.; Rock, K.; Kessler, S.; Orsini, L.; Weinhardt, C. Designing microgrid energy markets: A case study: The Brooklyn Microgrid. Appl. Energy 2018, 210, 870–880. [Google Scholar] [CrossRef]
- Faruqui, A.; Sergici, S.; Warner, C. Arcturus 2.0: A meta-analysis of time-varying rates for electricity. Electron. J. 2017, 30, 64–72. [Google Scholar] [CrossRef]
- Srivastava, A.; Van Passel, S.; Laes, E. Assessing the success of electricity demand response programs: A meta-analysis. Energy Res. Soc. Sci. 2018, 40, 110–117. [Google Scholar] [CrossRef]
- Bartusch, C.; Wallin, F.; Odlare, M.; Vassileva, I.; Wester, L. Introducing a demand-based electricity distribution tariff in the residential sector: Demand response and customer perception. Energy Policy 2011, 39, 5008–5025. [Google Scholar] [CrossRef]
- Hobman, E.V.; Frederiks, E.R.; Stenner, K.; Meikle, S. Uptake and usage of cost-reflective electricity pricing: Insights from psychology and behavioural economics. Renew. Sustain. Energy Rev. 2016, 57, 455–467. [Google Scholar] [CrossRef]
- Buryk, S.; Mead, D.; Mourato, S.; Torriti, J. Investigating preferences for dynamic electricity tariffs: The effect of environmental and system benefit disclosure. Energy Policy 2015, 80, 190–195. [Google Scholar] [CrossRef]
- Kim, J.H.; Shcherbakova, A. Common failures of demand response. Energy 2011, 36, 873–880. [Google Scholar] [CrossRef]
- Delmas, M.A.; Fischlein, M.; Asensio, O.I. Information strategies and energy conservation behavior: A meta-analysis of experimental studies from 1975 to 2012. Energy Policy 2013, 61, 729–739. [Google Scholar] [CrossRef]
- Johnson, C. Is demand side response a woman’s work? Domestic labour and electricity shifting in low income homes in the United Kingdom. Energy Res. Soc. Sci. 2020, 68, 101558. [Google Scholar] [CrossRef]
- Tjørring, L.; Jensen, C.L.; Hansen, L.G.; Andersen, L.M. Increasing the flexibility of electricity consumption in private households: Does gender matter? Energy Policy 2018, 118, 9–18. [Google Scholar] [CrossRef]
- Nicholls, L.; Strengers, Y. Peak demand and the “family peak” period in Australia: Understanding practice (in)flexibility in households with children. Energy Res. Soc. Sci. 2015, 9, 116–124. [Google Scholar] [CrossRef]
- Nyborg, S. Pilot users and their families: Inventing flexible practices in the smart grid. Sci. Technol. Stud. 2015, 28, 54–80. [Google Scholar] [CrossRef]
- Fjellså, I.F.; Silvast, A.; Skjølsvold, T.M. Justice aspects of flexible household electricity consumption in future smart energy systems. Environ. Innov. Soc. Transit. 2021, 38, 98–109. [Google Scholar] [CrossRef]
- Smale, R.; van Vliet, B.; Spaargaren, G. When social practices meet smart grids: Flexibility, grid management, and domestic consumption in The Netherlands. Energy Res. Soc. Sci. 2017, 34, 132–140. [Google Scholar] [CrossRef]
- Friis, F.; Haunstrup Christensen, T. The challenge of time shifting energy demand practices: Insights from Denmark. Energy Res. Soc. Sci. 2016, 19. [Google Scholar] [CrossRef]
- Gaye, G.; Wallenborn, G. A typology of flexible users in a smart grid project. Proc. Eur. Counc. Energy Effic. Econ. Summer Study 2015, 2027–2038. [Google Scholar]
- Öhrlund, I.; Stikvoort, B.; Schultzberg, M.; Bartusch, C. Rising with the sun? Encouraging solar electricity self-consumption among apartment owners in Sweden. Energy Res. Soc. Sci. 2020, 64, 101424. [Google Scholar] [CrossRef]
- Parrish, B.; Heptonstall, P.; Gross, R.; Sovacool, B.K. A systematic review of motivations, enablers and barriers for consumer engagement with residential demand response. Energy Policy 2020, 138, 111221. [Google Scholar] [CrossRef]
- Darby, S.J. Smart technology in the home: Time for more clarity. Build. Res. Inf. 2018, 46, 140–147. [Google Scholar] [CrossRef]
- Neenan, B.; Robinson, J.; Boisvert, R.N. Residential Electricity Use Feedback: A Research Synthesis and Economic Framework; Electric Power Research Institute: Palo Alto, CA, USA, 2009. [Google Scholar]
- Serrenho, T.; Zangheri, P.; Bertoldi, P. Energy Feedback Systems: Evaluation of Meta-Studies on Energy Savings through Feedback; Publications Office of the European Union: Luxembourg, 2015; ISBN 978-92-79-59778-7. [Google Scholar]
- Smale, R.; Kloppenburg, S. Platforms in power: Householder perspectives on the social, environmental and economic challenges of energy platforms. Sustainability 2020, 12, 692. [Google Scholar] [CrossRef]
- Mela, H.; Peltomaa, J.; Salo, M.; Mäkinen, K.; Hildén, M. Framing smart meter feedback in relation to practice theory. Sustainability 2018, 10, 3553. [Google Scholar] [CrossRef]
- Gangale, F.; Mengolini, A.; Onyeji, I. Consumer engagement: An insight from smart grid projects in Europe. Energy Policy 2013, 60, 621–628. [Google Scholar] [CrossRef]
- Hargreaves, T.; Nye, M.; Burgess, J. Making energy visible: A qualitative field study of how householders interact with feedback from smart energy monitors. Energy Policy 2010, 38, 6111–6119. [Google Scholar] [CrossRef]
- Strengers, Y.; Pink, S.; Nicholls, L. Smart energy futures and social practice imaginaries: Forecasting scenarios for pet care in Australian homes. Energy Res. Soc. Sci. 2019, 48, 108–115. [Google Scholar] [CrossRef]
- Ryghaug, M.; Skjølsvold, T.M.; Heidenreich, S. Creating energy citizenship through material participation. Soc. Stud. Sci. 2018, 48, 283–303. [Google Scholar] [CrossRef] [PubMed]
- Wallace, J.; McCarthy, J.; Wright, P.C.; Olivier, P. Making design probes work. Conf. Hum. Factors Comput. Syst. Proc. 2013, 3441–3450. [Google Scholar] [CrossRef]
- Hansen, A.H.; Jensen, R.H.; Raptis, D.; Siksnys, L.; Pedersen, T.B.; Skov, M.B. Lumen: A Case Study of Designing for Sustainable Energy Communities through Ambient Feedback. In Proceedings of the 32nd Australian Conference on Human-Computer-Interaction, Sydney, Australia, 1–4 December 2020; Association for Computing Machinery: New York, NY, USA, 2020. [Google Scholar]
- Siksnys, L.; Pedersen, T.B.; Aftab, M.; Neupane, B. Flexibility modeling, management, and trading in bottom-up cellular energy systems. e-Energy 2019 Proc. 10th ACM Int. Conf. Futur. Energy Syst. 2019, 170–180. [Google Scholar] [CrossRef]
- Wilkins, D.J.; Chitchyan, R.; Levine, M. Peer-to-Peer Energy Markets: Understanding the Values of Collective and Community Trading. Conf. Hum. Factors Comput. Syst. Proc. 2020, 1–14. [Google Scholar] [CrossRef]
- Sardianou, E.; Genoudi, P. Which factors affect the willingness of consumers to adopt renewable energies? Renew. Energy 2013, 57, 1–4. [Google Scholar] [CrossRef]
- Šćepanović, S.; Warnier, M.; Nurminen, J.K. The role of context in residential energy interventions: A meta review. Renew. Sustain. Energy Rev. 2017, 77, 1146–1168. [Google Scholar] [CrossRef]
- Koirala, B.P.; Araghi, Y.; Kroesen, M.; Ghorbani, A.; Hakvoort, R.A.; Herder, P.M. Trust, awareness, and independence: Insights from a socio-psychological factor analysis of citizen knowledge and participation in community energy systems. Energy Res. Soc. Sci. 2018, 38, 33–40. [Google Scholar] [CrossRef]
- De Jong, A.; Önnevall, E.; Reitsma, L.; Wessmann, S. Challenging the role of design(ing) in the sustainability field-Towards a “humble” design approach. ACM Int. Conf. Proceeding Ser. 2016, 2–4. [Google Scholar]
- Halse, J.; Boffi, L. Design Interventions as a Form of Inquiry. Des. Anthropol. Futur. 2014, 89–103. [Google Scholar] [CrossRef]
- LOI, D. Reflective probes, primitive probes and playful triggers. Ethnogr. Prax. Ind. Conf. Proc. 2007, 2007, 232–245. [Google Scholar] [CrossRef]
- Papageorgiou, A.; Ashok, A.; Hashemi Farzad, T.; Sundberg, C. Climate change impact of integrating a solar microgrid system into the Swedish electricity grid. Appl. Energy 2020, 268, 114981. [Google Scholar] [CrossRef]
- Tuomela, S.; Iivari, N.; Svento, R. User values of smart home energy management system. In Proceedings of the 18th International Conference on Mobile and Ubiquitous Multimedia, Pisa, Italy, 27–29 November 2019; pp. 1–12. [Google Scholar]


Publisher’s Note: MDPI stays neutral with regard to jurisdictional claims in published maps and institutional affiliations. |
© 2021 by the authors. Licensee MDPI, Basel, Switzerland. This article is an open access article distributed under the terms and conditions of the Creative Commons Attribution (CC BY) license (http://creativecommons.org/licenses/by/4.0/).