1. Introduction
According to the International Energy Agency, in 2018, about half of the total end consumption of energy was related to residential and industrial heating. Of the total household energy consumption, space and water heating can take up to 80%, according to Eurostat data from 2016 [
1]. Increasing the share of renewables such as solar thermal energy in residential heating can be one of many steps towards achieving energy savings.
A recent comprehensive analysis of large-scale solar thermal systems in countries where the technology is utilised most (Denmark, China, Germany, and Austria) is presented in [
2]. One of the main findings is the importance of incentive policies provided by countries’ governments. Another significant success factor is the existence of infrastructure of large-scale heating systems. Denmark’s case is particularly interesting with respect to current research focused on solar thermal technology in Western Norway. All the countries mentioned above have more favourable solar heating conditions because of their geographic location and climate conditions. Denmark’s case is close enough for comparison with Norway, both in climate and population patterns. In Denmark, solar district heating (SDH) utilities play a crucial role in successfully implementing solar thermal systems. By 2018, there were 118 plants in operation with a total capacity of 970 MW, which comprises 63% worldwide capacity of large-scale solar thermal systems [
2]. Denmark’s success relies on several key factors, such as widespread SDH networks which connect to over 60% of Danish households, and efforts to reduce individual heating, such as the ban on installing oil- and gas-fired boilers. Government taxation policies lead to gas and other fossil fuels prices to be among highest in Europe, making solar thermal systems competitive at around 70–80 Euro/MWh. Although the SDH facilities in Denmark deliver 400–460 kWh
/m
2 [
3], which is a rather significant amount of solar heat in Scandinavia, the average efficiency of the solar collectors is at a low level of 40% [
3]. This is related to the fact that the facilities are equipped with outdated flat-plate collectors. As it follows from multiple studies on the subject, the nanofluids can boost the efficiency of the collectors when used there instead of the conventional coolants [
4,
5,
6]. Therefore, it is possible to modernize the existing SDH facilities.
Another factor is prices at SDH utility locations—they tend to be built close to small communities where prices are lower than large city centres. Since the 1990s, the Danish government has been rolling out various programs such as investment subsidies, premium tariffs to encourage SDH utilities operating on the energy market, and an “energy savings credits” market, similar to carbon emission trading system [
2].
Over 90% of Norway’s electricity is produced by hydropower facilities [
7], making hydroelectricity cheap and readily available for domestic heating purposes. An average household electricity price was 0.1 Euro/kWh
in 2021, including energy price, rent of network, and taxes. This might be the main reason why solar thermal heating has not attained a significant share of the market. However, the situation is about to change due to Norway’s increasing investment in offshore facilities and harbours, and explosive growth in electric vehicles, personal cars, and collective transport vehicles such as buses and ferries [
8]. At the same time, there are very few hydropower resources left to harvest. Using high-quality energy such as electricity to heat residential buildings becomes less cost-effective, thus solar heat may be a viable alternative.
Several Norwegian studies and simulations have been conducted using small-scale model passive houses. Hagos et al. [
9] assess the possibility of solar water heating in residential housing in inland Norway. Based on the meteorological data, a daily solar radiation average of 2.21 kWh/m
2 is observed for this location. These values should be close enough to Western Norway to allow direct comparison. Average summer temperatures are around 15–18 °C, and average winter temperatures are considerably cold, around −3 to −4 °C [
10]. The simulation assumed a household annual domestic hot water demand of 5 MWh. Two types of solar collectors were considered: tubular and flat plate glazed collectors. The results show that such collectors may supply 48% (glazed collectors) to 62% (vacuum tube collectors) of the domestic hot water demand. Vacuum tube collectors appear to be more suitable for Norway, with cold outdoor temperatures and cloudy weather.
Solar domestic hot water systems compete with photovoltaic (PV) systems and heat pumps for their share of the renewable energy market. According to the Norwegian Central Statistical Bureau [
7], heat pumps deliver 10.5 % of total district heating production in 2019. A comparison of the energy consumption in two passive houses in Oslo, one with a solar heating system and one with an air-water heat pump, is shown in [
11,
12]. These studies provide measurements of the total heating demand. Both houses have a heated floor area of 116 m
2 and a calculated space heating demand of 23 kWh/m
2 assuming an indoor temperature of 20 °C. Energy used for the production of domestic hot water equals 3480 kWh
/y. The solar collector used in the project has an area of 18.9 m
2. The coolant is pure water, the heat storage is a tank of 800 L, and there is also a 100 L pressurised vessel to hold domestic hot water. There is an additional 76 L boiler in both houses, switched on when the solar heat is insufficient. Since the solar thermal system is switched off during the winter months, a direct comparison between the two systems may only be made during the spring/summer months. The two houses and their orientations concerning the sun and shade were not identical, and also the consumption of hot water was different. Still, it was estimated that electricity consumption was 15% lower in the solar heated house, where solar energy provided around 2600 kWh/y. This comparison shows that solar thermal heating is competitive with heat pumps at the considered latitude and requires less additional energy. An important conclusion coming from [
11] is that the amount of solar heat produced in Norway is less than in the rest of Scandinavia. For example, in the article by Bernardo [
13] the solar collectors located in Lund (Sweden) delivered 307 kWh
/(m
2y) while the respective system in Norway [
11] produced 137 kWh
/(m
2y).
When it comes to competition with PV systems, the comparison gives less certain results. A simulation study [
14] compares performances of separate PV and solar thermal (T) systems to combined PV/T systems. Two types of solar collectors (glazed and unglazed) are used. The simulation model is a residential building with a 160 m
2 heated floor area and a total energy demand of 70.2 kWh/m
2, of which 20.9 kWh/m
2 and 23.8 kWh/m
2 goes to space heating and domestic hot water, respectively. The coolant of the solar thermal system was a water-glycol mixture. Results suggest that a high-efficiency PV is closest to achieving a zero-energy balance of the household; the “second best” was the PV/T system. The results show that the highest coverage of on-site energy generation (73%) is achieved by the system with high-efficiency PV panels.
Another recent simulation study [
15] is investigating two separate systems: a solar thermal (flat plate collector) and a PV system in Narvik, which is located in Northern Norway in subarctic conditions, which makes it a unique example. This study demonstrates that the solar systems meet the demands of space heating and domestic hot water consumption. At the given latitude, this is possible during approximately two summer months due to sun availability for most of the day. During the winter months of October through January, however, the production is zero. Nevertheless, the solar collectors and the PV plates produced around 14,300 kWh
and 18,600 kWh
a year, respectively. With current electricity prices and subsidies policies, the solar thermal system becomes profitable after 15 years. The initial investment cost is higher for the PV system, so the payback period is around 20 years.
From the overview above, we conclude that there is no field data to evaluate the potential viability of solar thermal technology in Norway. This article addresses the issue, presenting detailed year-long statistics of field operation for a solar collector facility located in Bergen, Western Norway. Due to its cloudy climate, this region is among the least insolated in Europe at the considered latitude. To our knowledge, in this study, we conduct the first systematic evaluation of the solar thermal technology in such climate conditions.
2. Methodology
The solar collector facility is located at the Western Norway University of Applied Sciences (Høgskulen på Vestlandet—HVL), Bergen, Norway. The facility is a part of the Solar Energy Lab launched in 2018 at campus Kronstad (60°22′04.2′′ N 5°21′03.3′′ E). The laboratory consists of the photovoltaic (PV) system with a total area of 9.9 m
2, 5 m
2 solar concentrator from Riza+ [
16], a vacuum tube solar collector facility, a greenhouse, a 16.2 m
2 custom-designed passive house with balanced ventilation, and a battery bank.
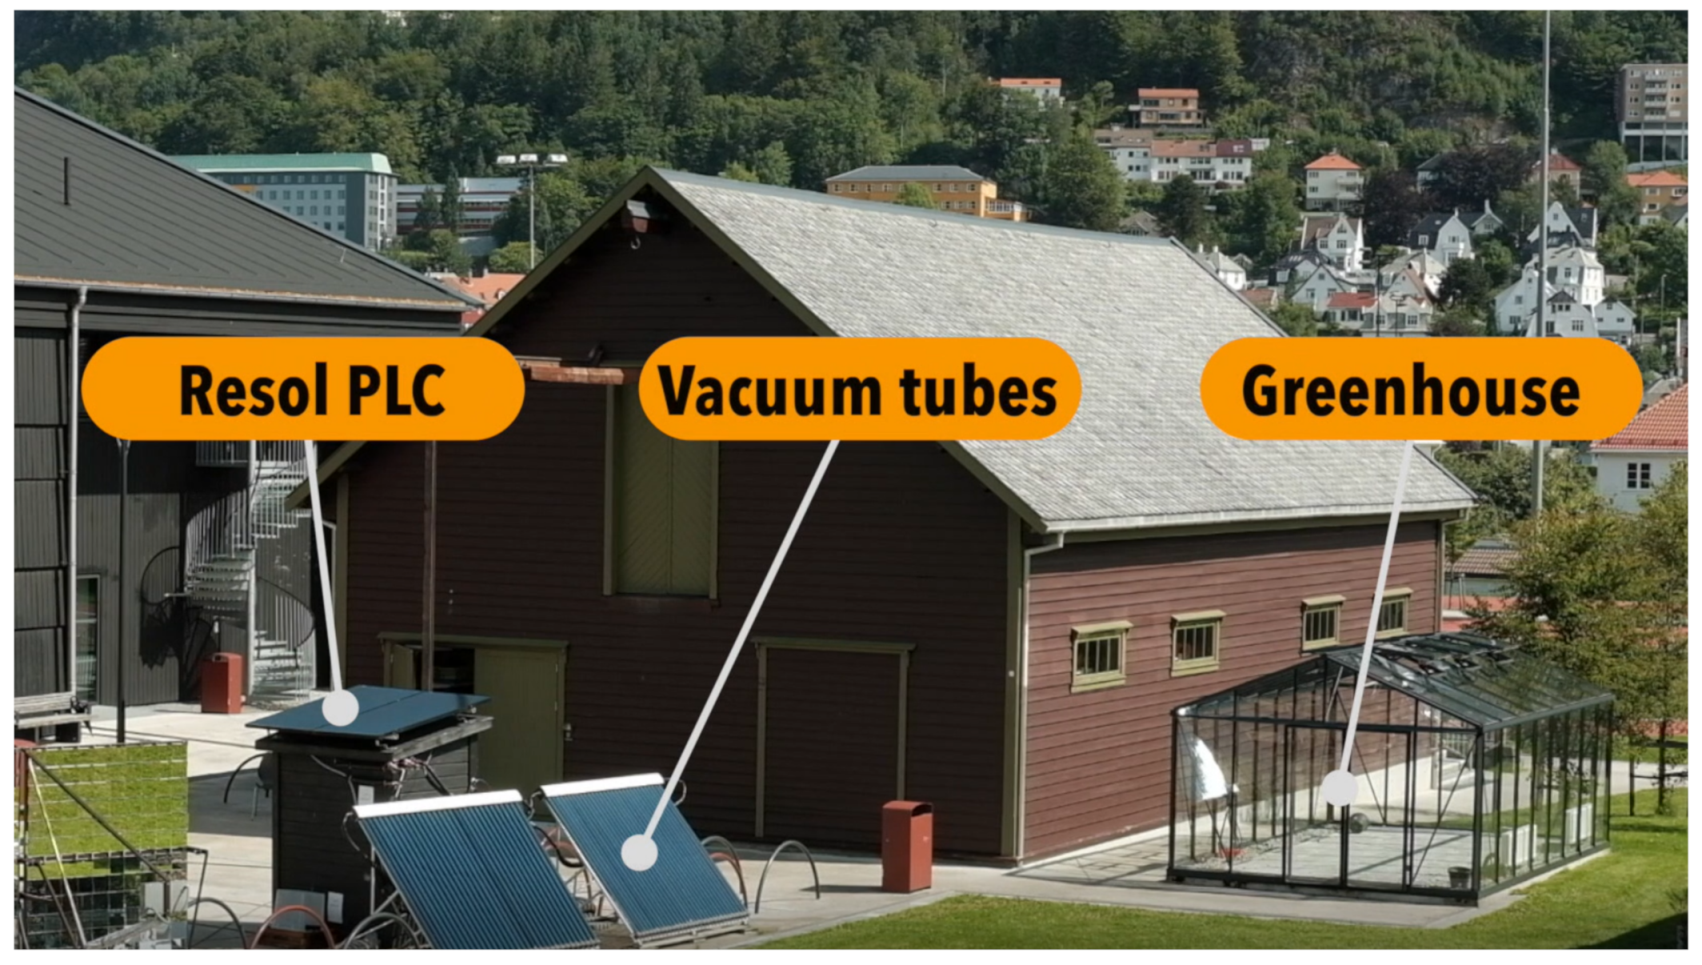
In the present study, we are focused on the thermal performance of the vacuum tube collector system, which is presented in
Figure 1. The solar collectors are coupled to a space heating system installed in the greenhouse.
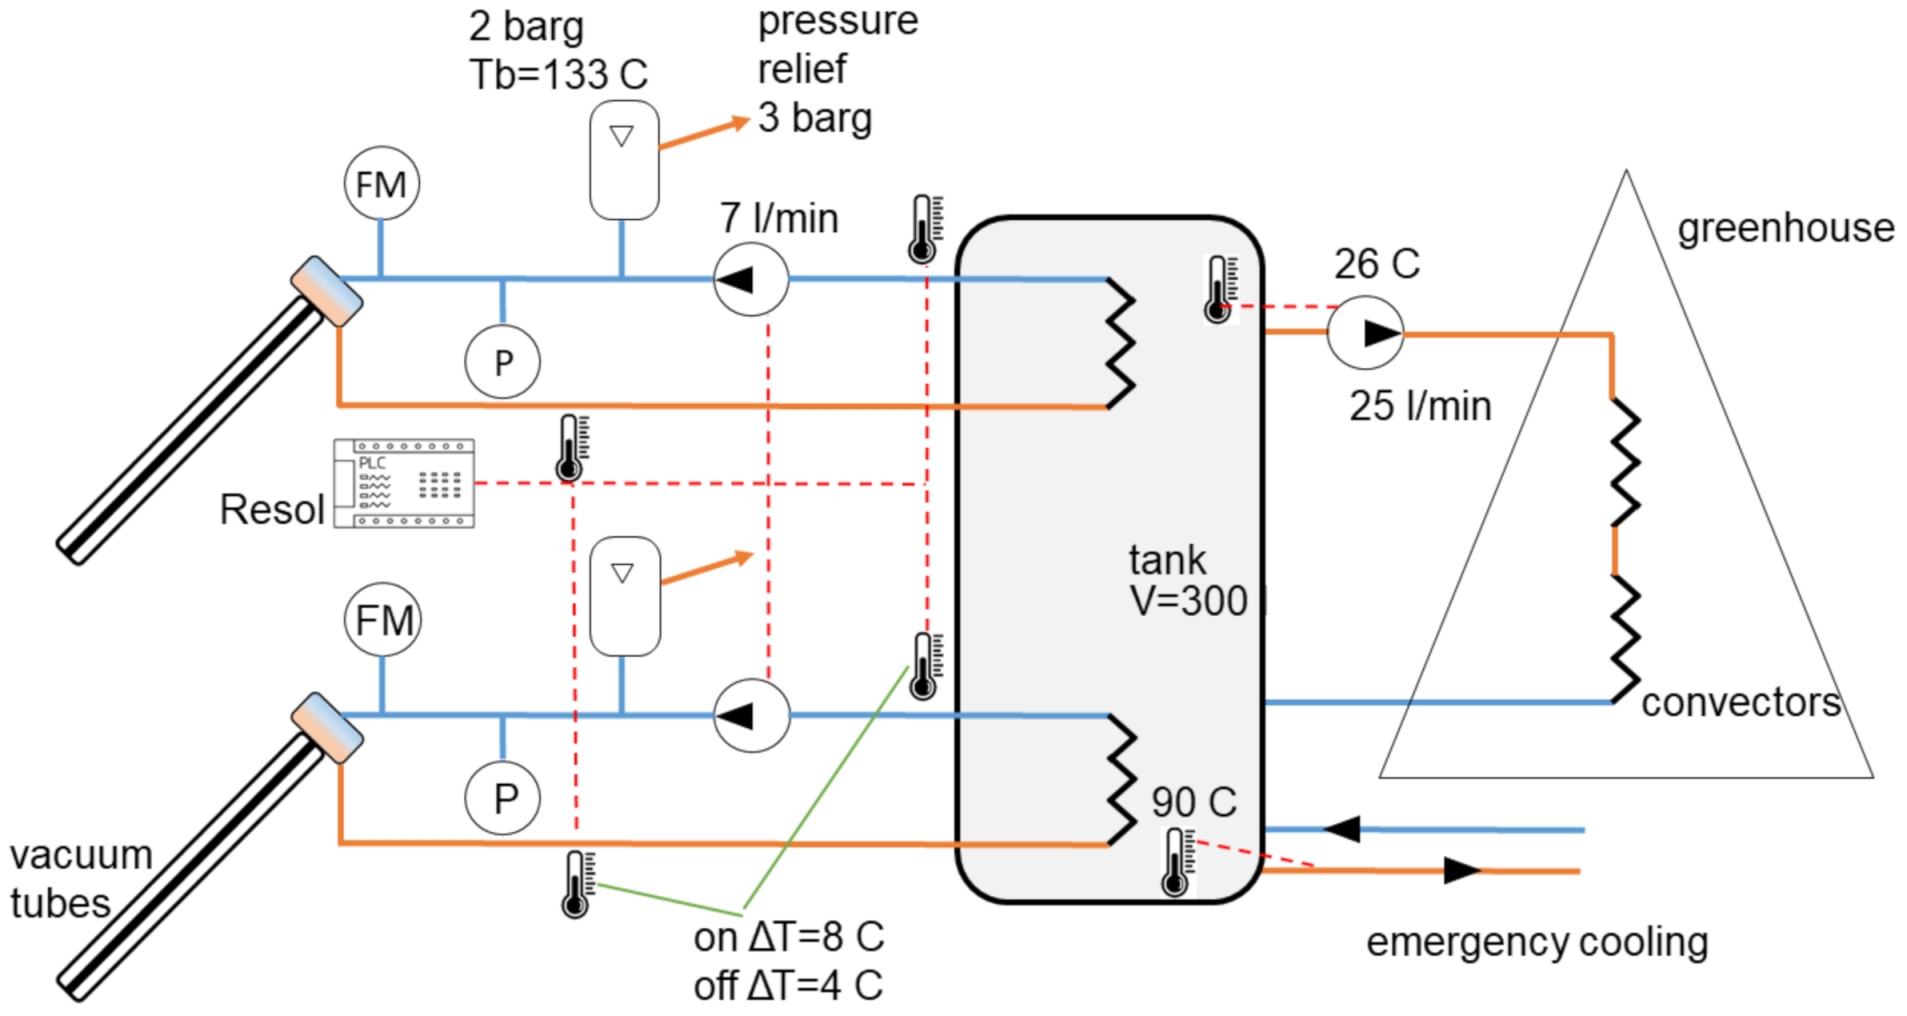
The hydraulic scheme of the vacuum tube facility is presented in
Figure 2. The solar collector system consists of two Suntask SCM30-58/1800-02 vacuum tube collectors. The effective collector’s area is 3.91 m
2. The collectors are mounted on the aluminium frames with 45° tilt angle. The frames are faced towards the south. The ballast of about 60 kg is placed to the frames’ base to prevent the collectors from sliding under the strong wind. The frames were capable of withstanding the wind speed of 26.5 m/s in February 2020 [
10].
The solar collectors deliver captured heat via two independent circulation loops. Each loop is equipped with an equivalent set of flow equipment. The loops consist of the screw pump Star-RS 15/6 from Wilo with a maximum head of 5.5 m and maximum flow rate of 4.6 m3/h, the flowmeter Resol V40-15 with the measurement interval 30–50 L/h, and temperature sensors FKP5,5 Pt1000 from Resol with the measurement interval −50−+180 °C. A propylene glycol-water mixture (1:2) is used in the flow loop as the coolant. The fluid is protected from freezing down to the temperature of −14 °C. Two expansion vessels are set in the flow loop to keep the system working pressure to 2 barg; the boiling point of the heat transfer fluid is above 130 °C.
A 300-L accumulator tank Sunex Fish S2 acts as a heat storage vessel. The tank is equipped with two identical heat exchangers. The tank contained the propylene glycol—water mixture (1:4) protected down to −8 °C. We note the heat exchangers were heated alike as they were mounted at different levels from the bottom (see
Figure 2). The coefficient of heat transfer due to natural convection in the tank was therefore different for the coils. The third pump Yonos PICO 25/1-4 from Wilo was used to deliver the fluid from the tank to the greenhouse that was heated by two thermal convectors. This pump delivers up to 4 m head, and the maximum flow is 2.7 m
3/h. The 5-m feed line from the tank to the greenhouse was thermally insulated by a 50-mm layer of polyethylene foam with thermal conductivity of 0.04 W/mK. The Sunex tank acts as the expansion vessel for the greenhouse line.
An automatic control unit SP226 from Resol starts and stops the solar loop pumps based on the temperature difference between the collector and the tank (
Figure 2). The start-up temperature difference was 8 °C, and the shut-down difference was 4 °C. The temperature settings differed from the default (5/10 °C) for SP 226 to enable prolonged thermal energy extraction in poor solar conditions. The temperature difference and the flow rate were recorded and stored by DL3 datalogger from Resol. The interval of data acquisition in the logger was set at 10 s. The logs of the raw collector data are available from the authors.
The pumps in the main collector loops were set at 7 L/min. The greenhouse-pump was set at 25 L/min. This pump was activated by a thermal switch at 26 °C. An additional safety system was arranged in the tank to prevent boiling there. The tank was pressurised by 4 barg from a communal cold-water network. The system starts when the tank’s temperature rises to 90 °C, and a temperature switch activates a solenoid valve, releasing the fluid to a drainage line and cooling the system. The safety switch had never been in operation during the considered statistical period.
The control and operation system consumed a maximum of 36 W in operation. The electrical supply came from the PV system of the laboratory. The tank, the pumps, the control station, and the logger were located at a thermally-insulated wooden cabin shown in
Figure 1 (under “Resol PLC”).
We computed the instantaneous thermal efficiency of the collector from the raw measurements of the flow in the collector loops
Q and the temperature difference
between the tank and the collector [
17]:
where
and
are the density and the specific heat of the coolant,
A is the frontal area of the collector,
is the albedo of the terrain at the site,
I is the incident solar heat flux,
,
are the altitude and the azimuth angles of the Sun. The data on solar radiation together with the ambient temperature was extracted by two meteorological stations from Bergensværet [
18] located close to the experimental site: Kronstad (60°22′31.4′′ N 5°20′52.9′′ E) and Nygård (60°23′22.5′′ N 5°19′48.1′′ E). The meteo-station of the University of Bergen [
19] (60°23′01.5′′ N 5°19′54.9′′ E). delivered information on the solar angles and the solar radiation. The data from the stations were averaged in space. We ensured correspondence between the data sampling timeline in the collectors and the meteorological data, interpolating them by splines in Matlab. The albedo of the terrain was determined experimentally using the radiometer LS 122 IR (1000–1700 nm, 0.1 W/m
2, ±10%) from Shenzhen Linshang Technology and the pyranometer SP Lite 2 (400–1100 nm., 1.3 W/m
2, ±5%) from Campbell Scientific. The albedo was determined as 7.4 ± 1.8%.
The steady-state efficiency for the Suntask collectors is computed according to standard [
20]:
where
is the reduced temperature difference between the collector and the ambient conditions,
= 0.735,
= 1.349 W/(m
K),
= 0.015 W/(m
K
) [
21].
3. Results and Discussion
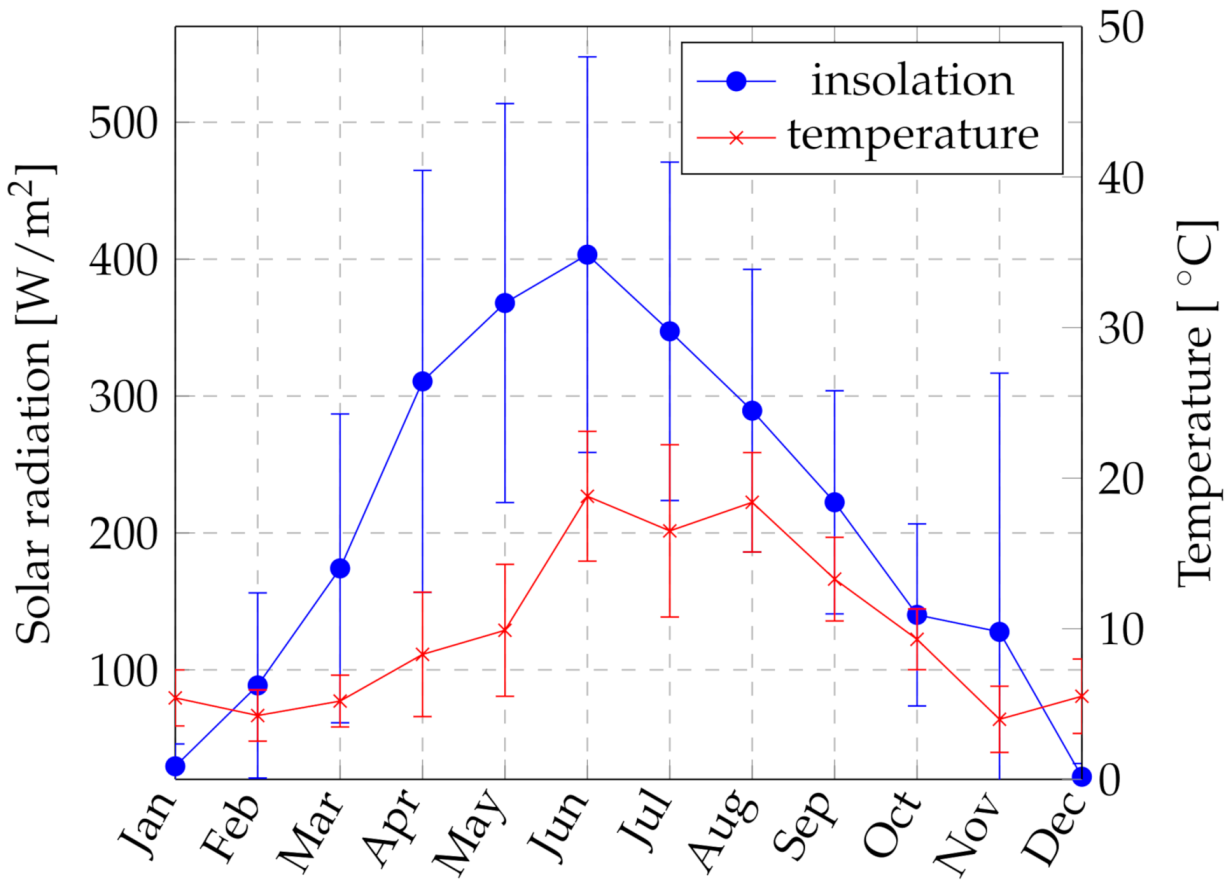
In general, the facility’s performance depends on two main factors: available insolation and ambient temperature. Those numbers are presented in
Figure 3 in terms of the month-average values. Also, the figure presents the statistical dispersion of data within the month. Reading the plot, we note the insolation was below 200 W/m
in January-March and October-December. The average temperature was below 10
C in this seasons meaning that that temperature difference
becomes around 70 °C for a minimum hot-water temperature set in Norway for thermal systems. The thermal loss from the collectors was at the top in autumn-winter. The dispersion of the weather data is observed in the midseason with the largest deviation of insolation of 148% in November. The insolation started to increase in April, being in the interval 300–400 W/m
and approaching the maximum in June 2020. The average ambient temperature altered between 10 °C and 20 °C. The ambient temperature was relatively stable in summer, while demonstrating a statistical dispersion of 25%.
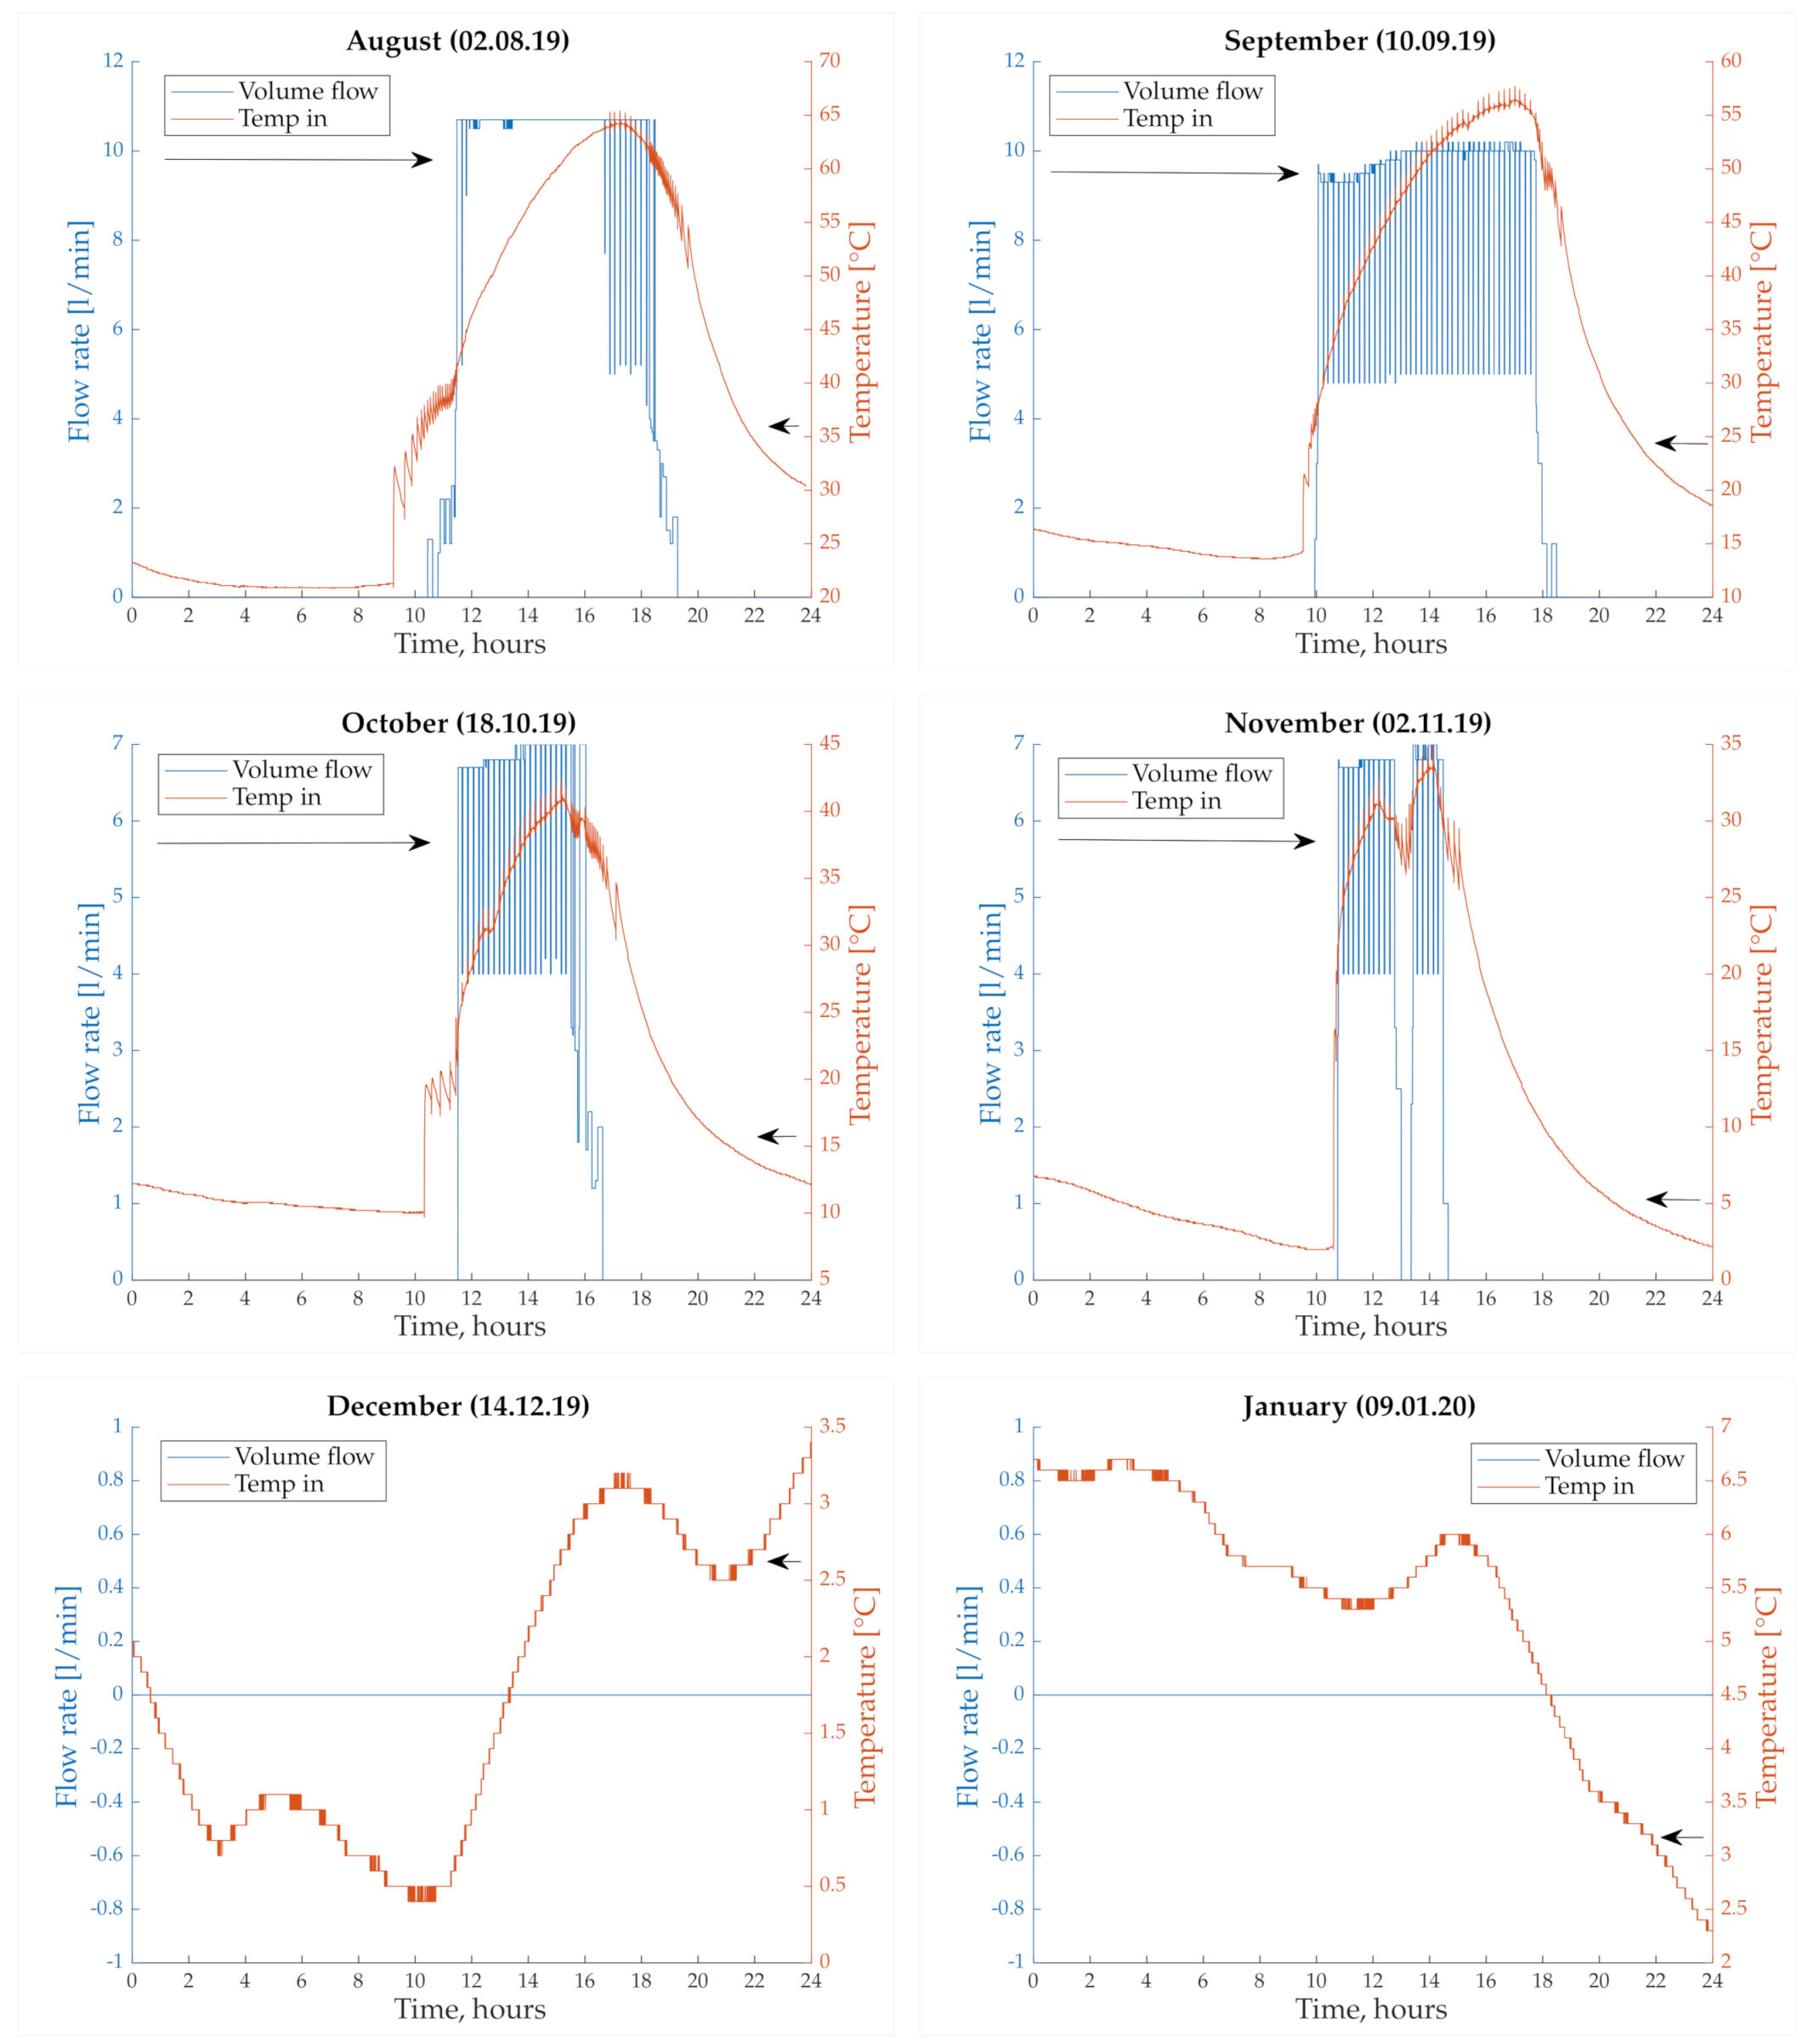
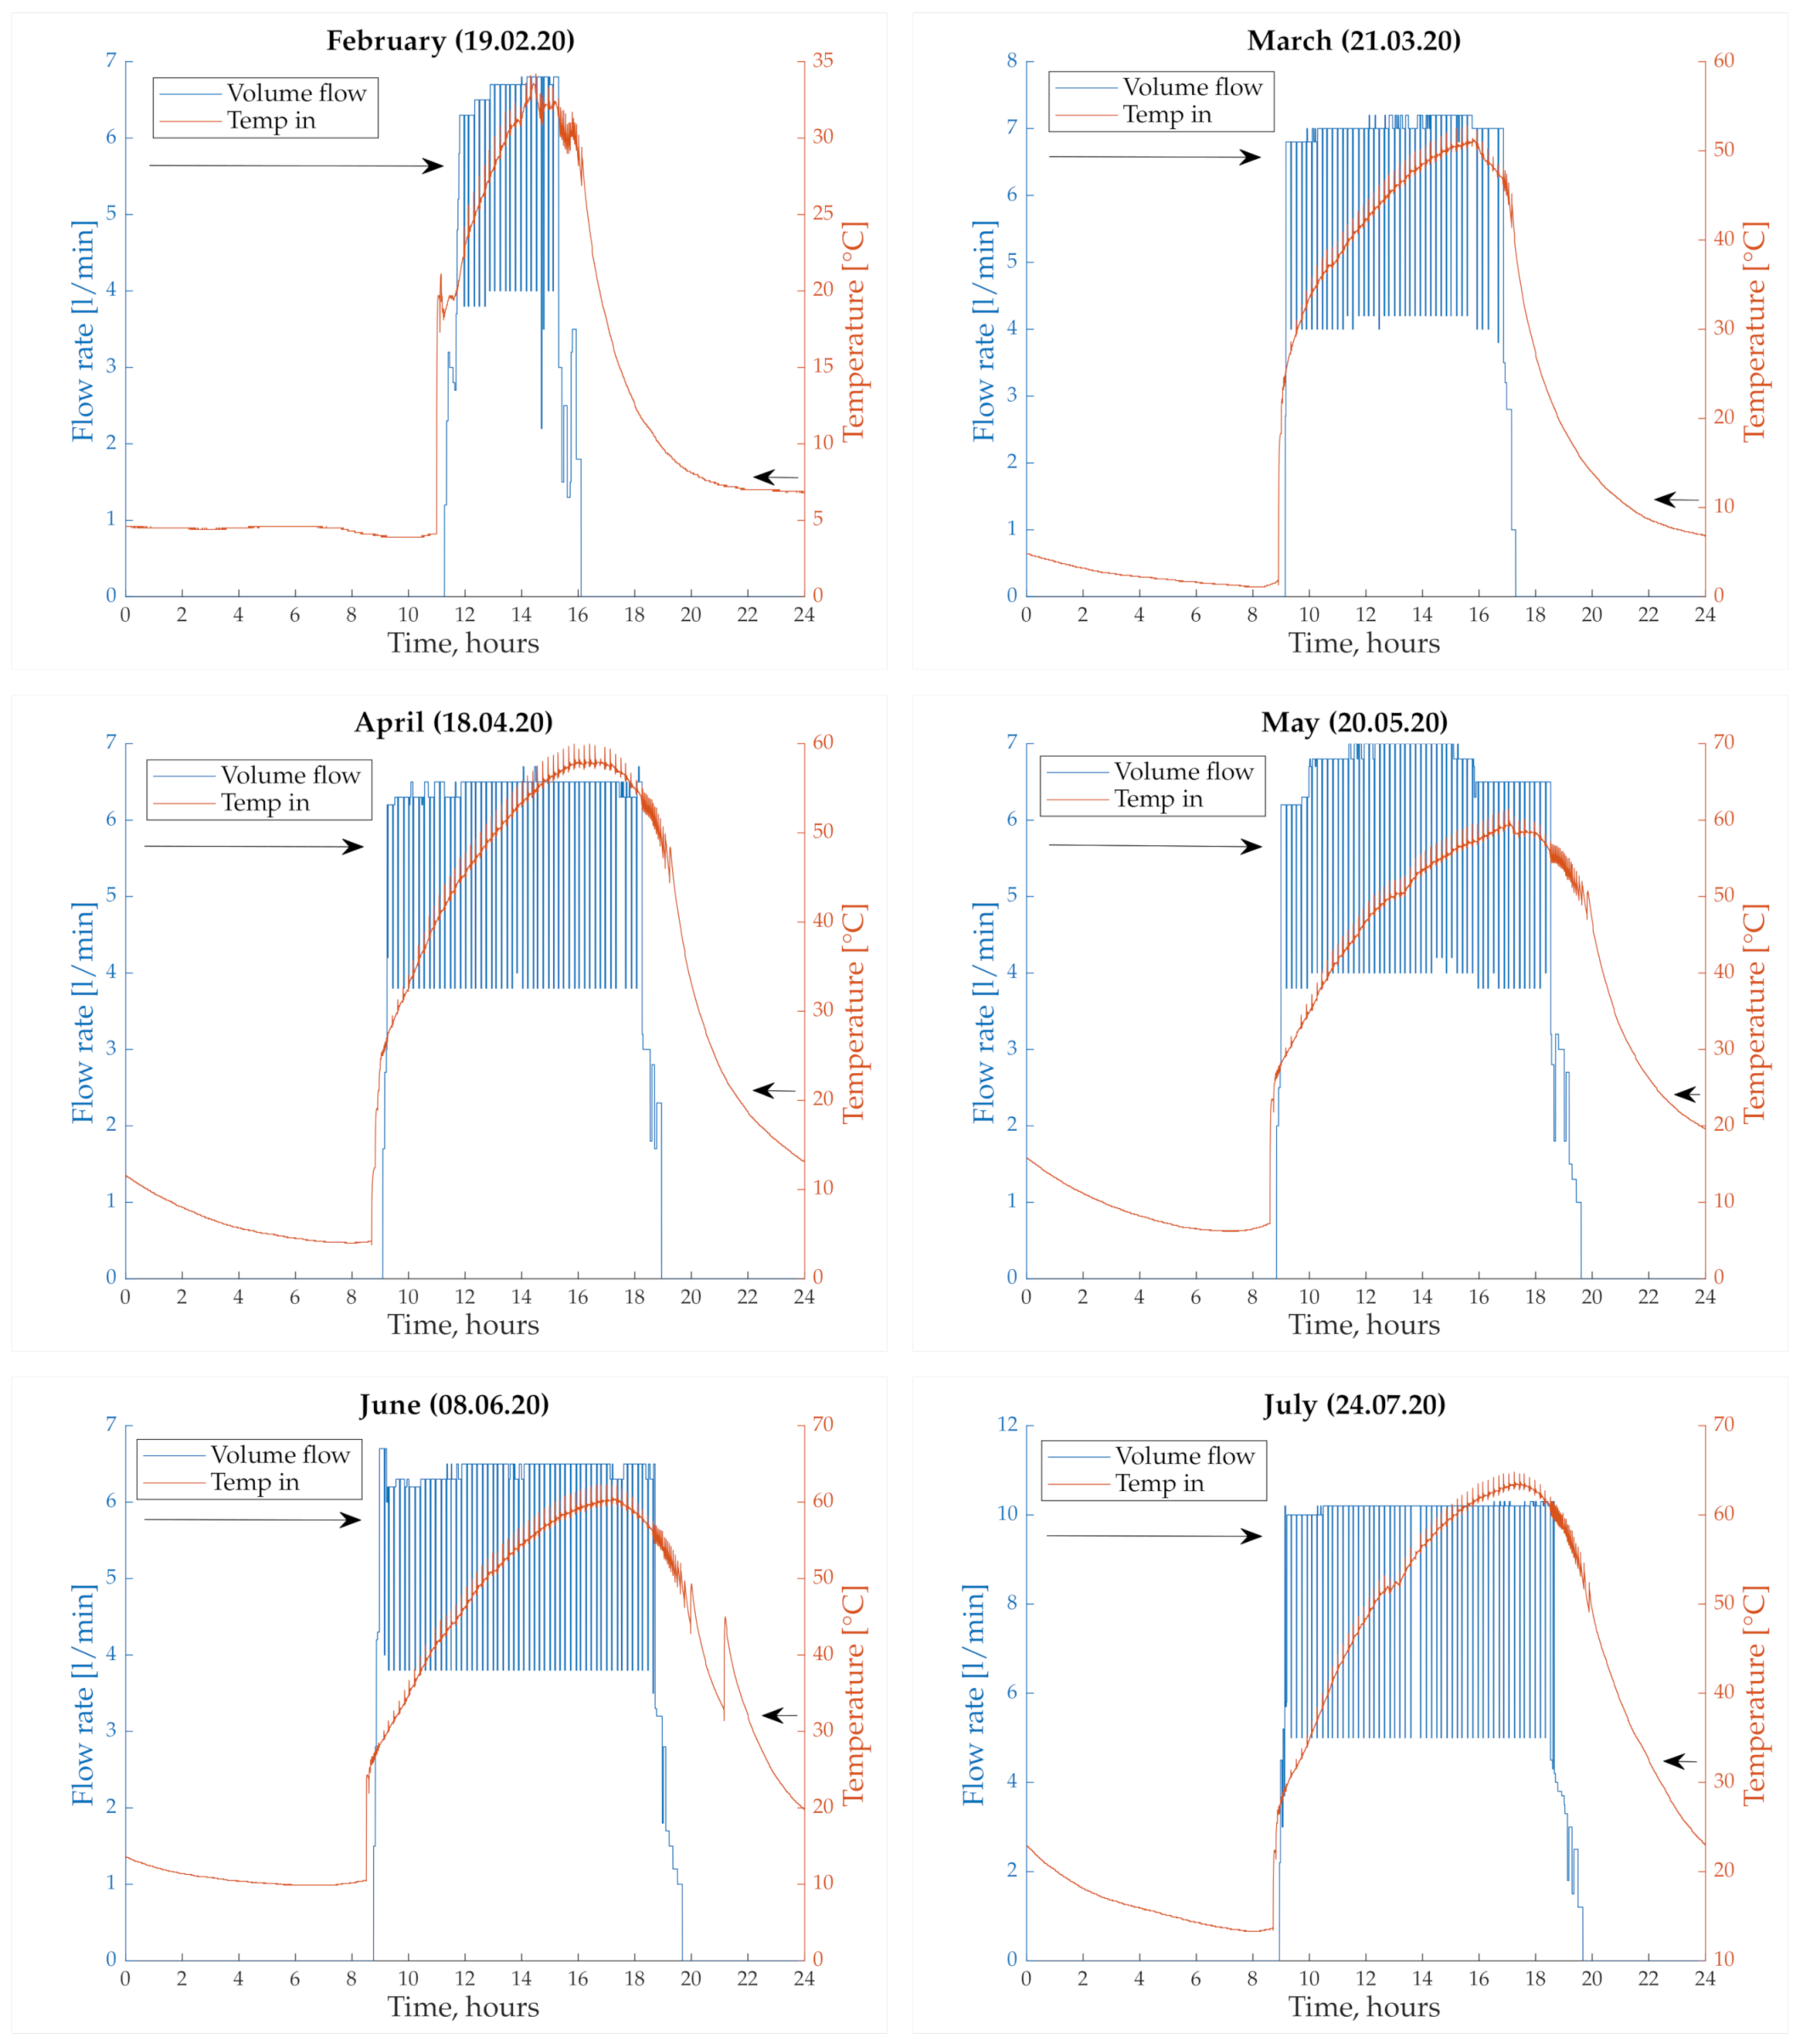
In
Figure 4 and
Figure 5 we present the raw collector logs for the selected days of each month. We note the tank was warm enough for the direct use of the hot water in March-October. During this period, the temperature was in the interval 40–60 °C. The tank’s temperature was in the desired interval between 3 and 6 h, depending on the month. The facility’s most stable operation took place in summer when the pumps were active for most of the day. There was not enough insolation to produce sufficient heat in winter, so the tank remained at the ambient temperature. However, there was a possibility for electrical heating with a supplementary solar heat in February when a limited amount of solar heat was collected, and the temperature rose to about 35 °C.
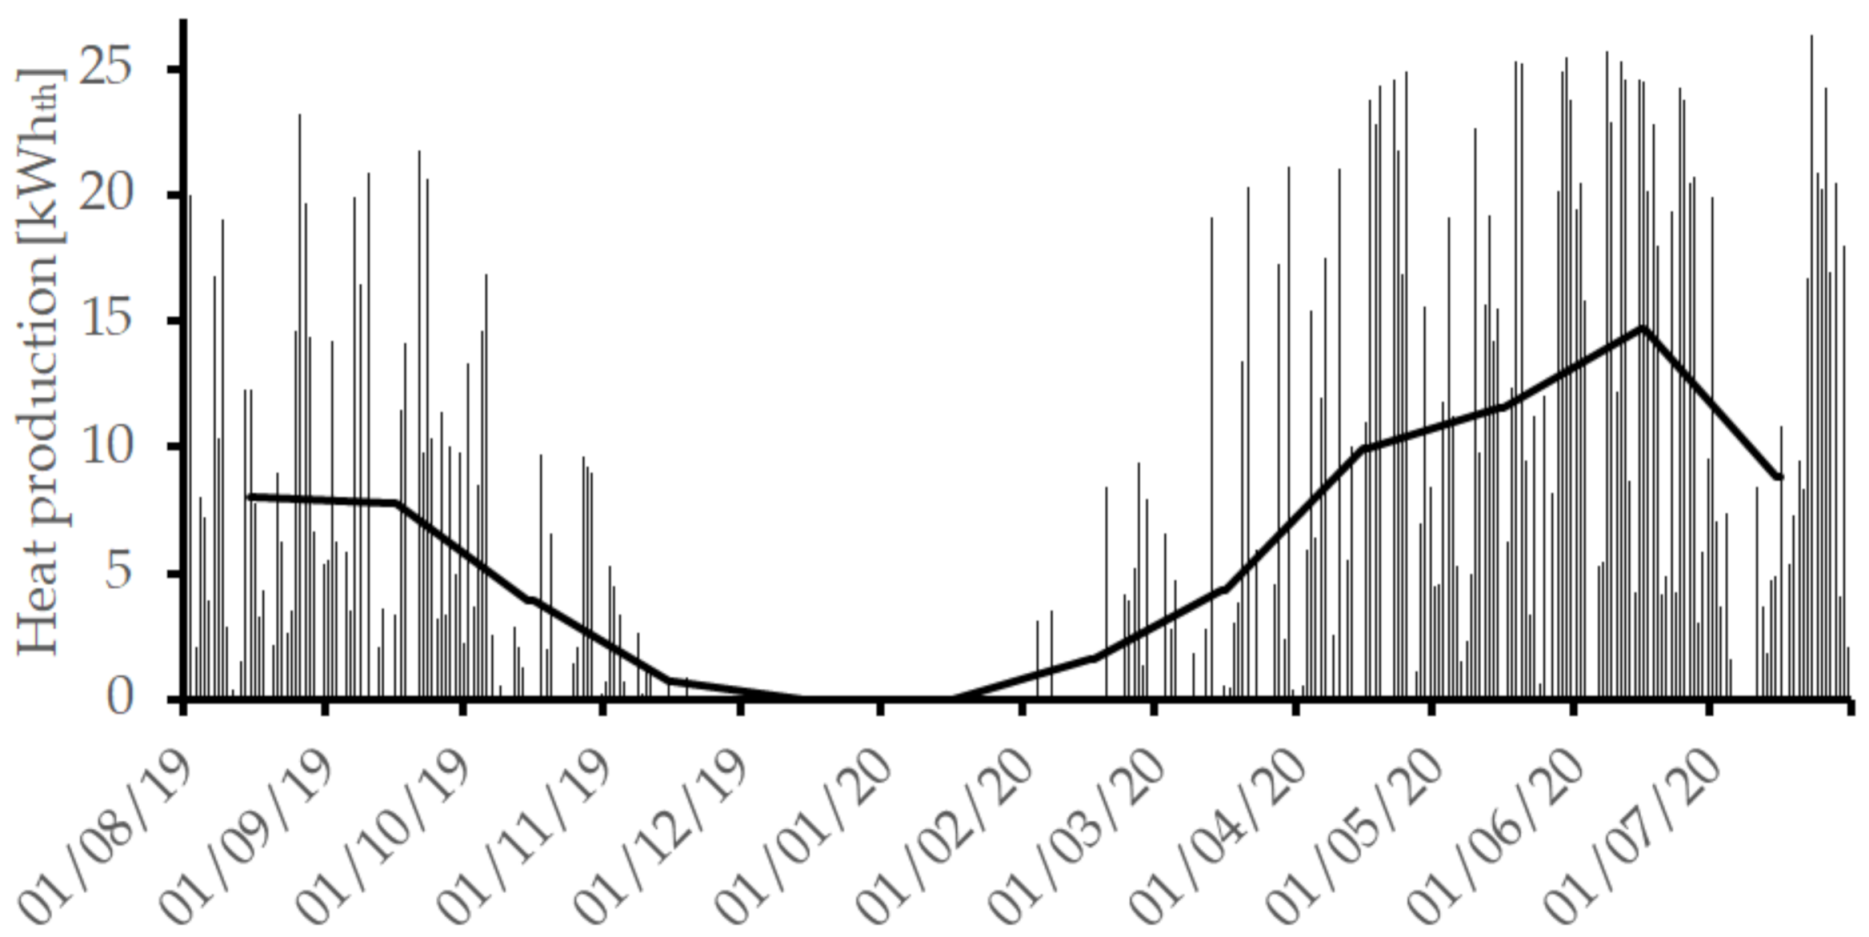
In terms of heat generation, the collectors generate most of the heat in summer. As can be seen in
Figure 6, which demonstrates daily average statistics for the entire year, the collected heat can go up to 25 kWh
. The daily production averaged over each month is presented in
Table 1. The average daily amount of heat is computed in the table as:
where
N is the number of days in a considered month and index
j denotes an instantaneous measurement taken from an array of
M points. The size of the array was determined for each day excluding the night measurements by temporal filtering of an acquired 24-h sample. The daytime was determined from the calendar. The thermophysical properties of the water-glycol solution were set dependent of
following Alvarez [
22]. The instantaneous measurements are available in the table format from the authors.
Using
Table 1, we demonstrate that the amount of heat produced by collectors in spring compares to the data for summer. Namely, the average amount of heat produced in April was higher than in July or August. In the table we also present the standard deviation of the data:
The standard deviation is comparable in the spring and the summer seasons. The maximum solar heat generation is observed in June. A sudden reduction in solar heating is observed in October. The amount of heat goes below 5 kWh, and solar production turns to zero in January. The generation is unstable, and the relative dispersion of data is above 100% for a period until April. The total annual heat generation was 2200 kWh.
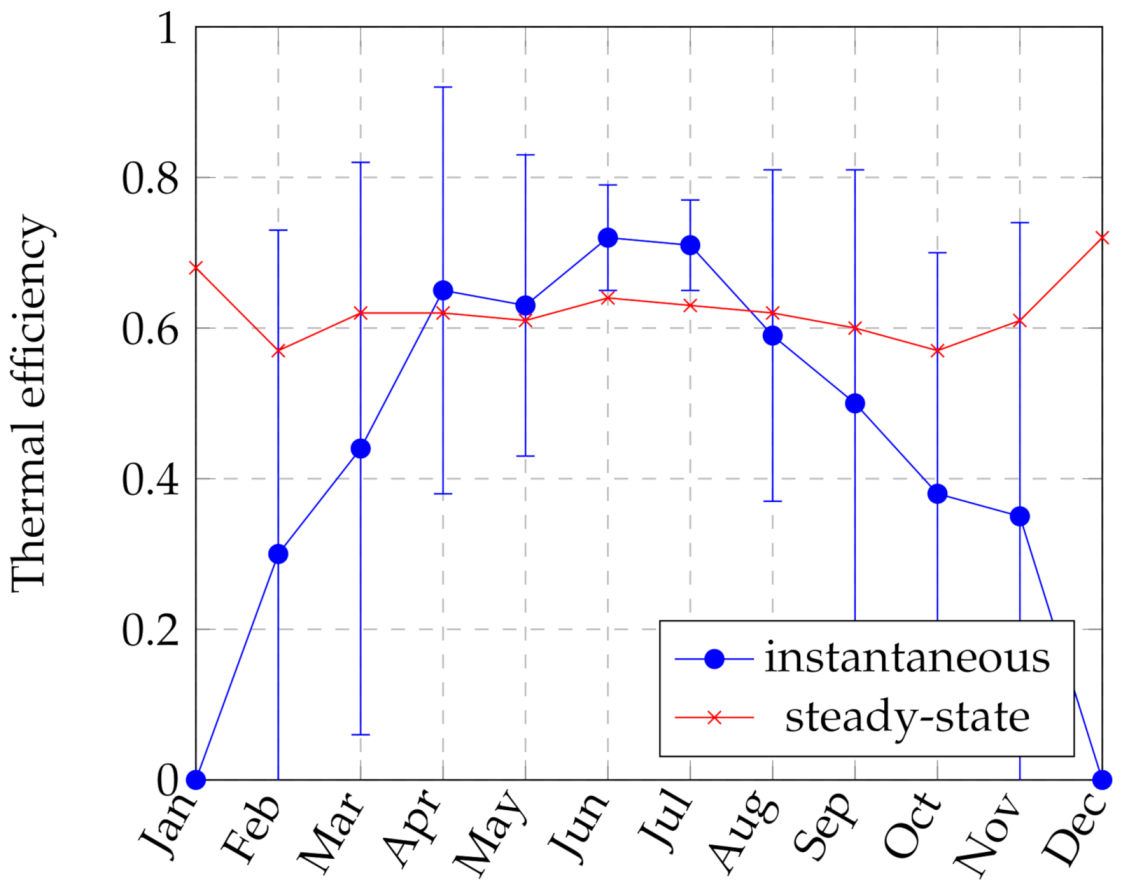
The instantaneous thermal efficiency of the vacuum tubes was measured as 71–72% in June-July (see
Figure 7). Due to the increased insolation in summer, and due to the reflection from the ground and the respective irradiation of the tubes’ bottom side, this value was about 10% over the steady-state efficiency. The year-average instantaneous thermal efficiency of the rig was lower than the steady-state efficiency reported for the vacuum tubes. The maximum difference between the efficiencies was observed in winter when the collectors were at the ambient temperature, and, respectively,
= 0. The difference is also seen in the midseason, where the steady-state efficiency becomes 20% higher than the actual efficiency. Therefore, due to weather conditions’ continuous oscillations, the collectors deliver less heat than we calculate for the day-average values of insolation and ambient temperature. This fact must be accounted for when designing solar collector facilities in Scandinavia.
It is interesting to evaluate how the collected heat can contribute to a household’s overall thermal balance. Downscaling the statistical data from Good et al. [
14], we calculate day-average heating demand of a standard house in Norway to be 19.6 kWh, with 10.4 kWh
needed for the domestic hot water production. Based on these numbers, we conclude that the vacuum tube facility does not deliver enough heat to cover all household needs in winter. However, it is possible to cover the domestic hot water in April-June and prolong this period to September using up to 2.6 kWh
auxiliary electrical heating. In May-June the collectors produce up to 4.3 kWh
over the heat that is required for sustainable hot water production. In the present field study, the excessive heat contributes to overheating the greenhouse, so the temperature could rise above 50 °C.
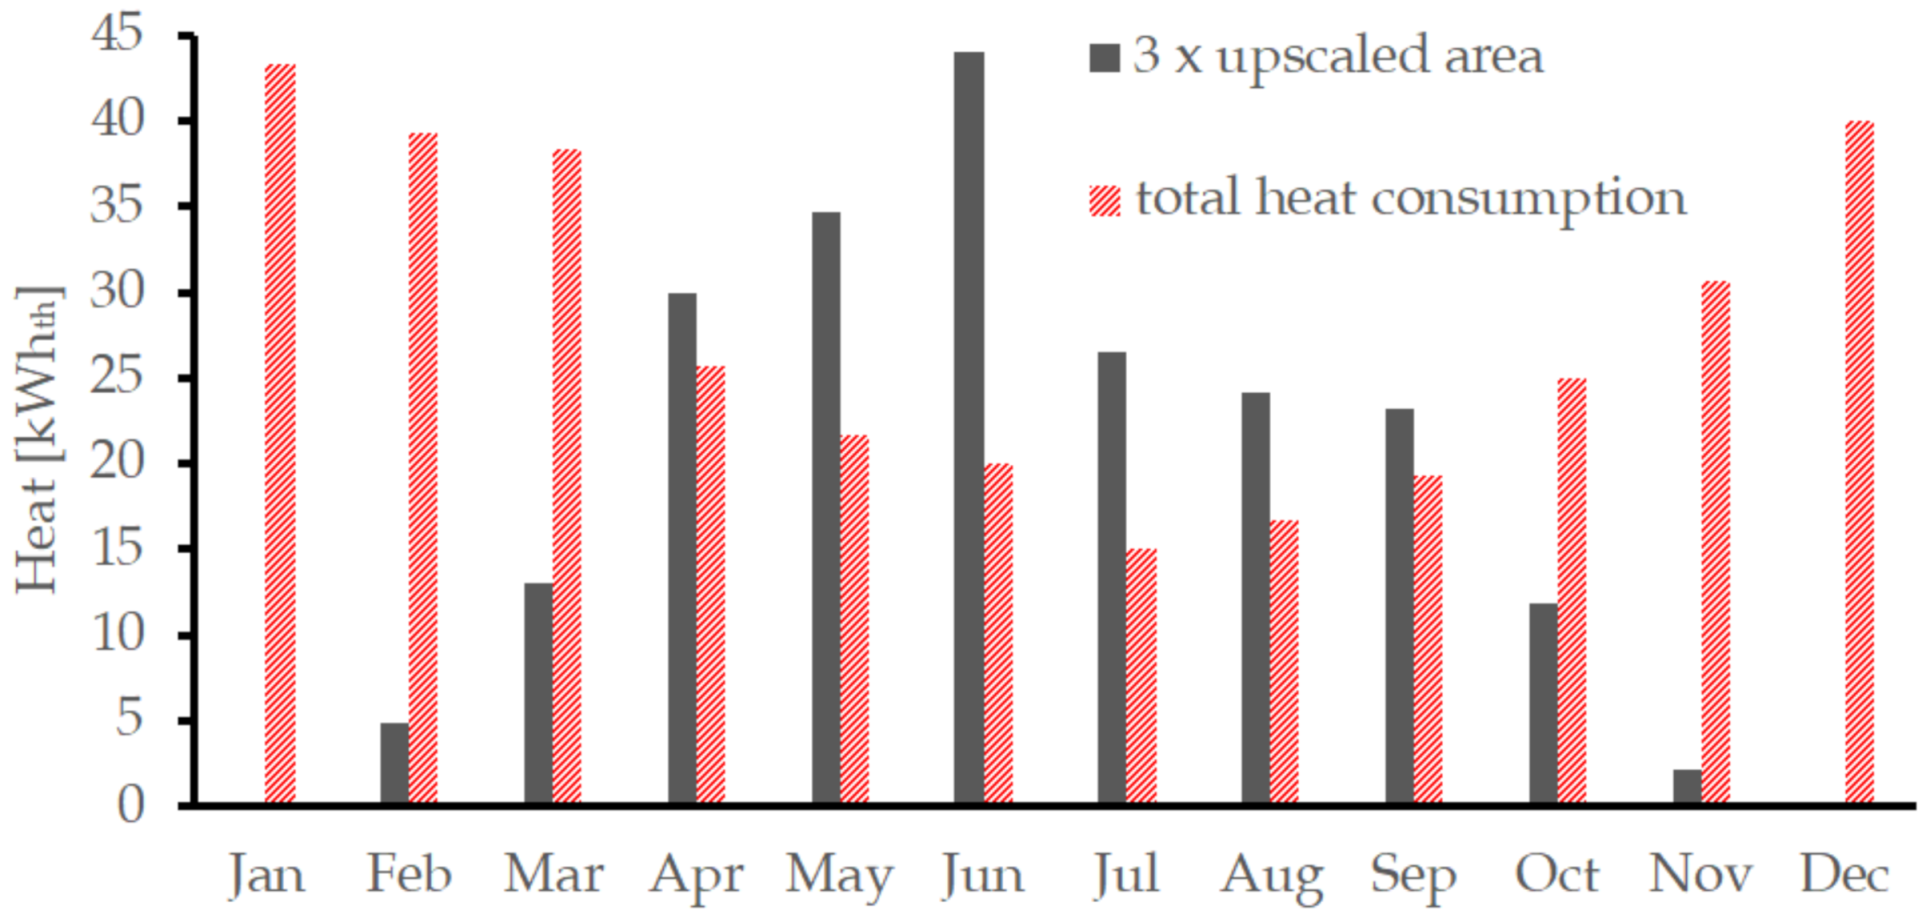
In
Figure 8 we demonstrate how the heat is produced due to a 3-fold increase of the solar collector area. The upscaling is technically possible for a typical Norwegian household with an average roof area of 90 m
2 [
14]. This figure compares the collected solar energy with more detailed statistics of energy consumption from Rekstad et al. [
11]. As it follows from the figure, the total consumption of heat is covered in April-September. The domestic hot water demand is covered in March-October. However, the upscaled facility overproduces up to 24.1 kWh
of heat in summer.
We end the discussion with a brief techno-economical analysis. According to Good et al. [
14] and Rekstad et al. [
11], an average household consumes 8604 kWh/y. In 2021 prices, electrical heating will cost 860.4 Euro/year. A complete solar collector system with vacuum tubes of 23.4 m
2 costs up to 9850 Euro in Norway. The payback period for the collectors becomes 11.5 years. Accounting for the current electricity price, the payback of the solar collector technology in Western Norway is sufficiently lower than the lifetime of collectors set, on average, at 30 years. Therefore, the vacuum tube technology is suitable for Western Norway and may become more attractive when the electricity price grows upon the maturing of the hydropower facilities.
4. Conclusions
A year-long experiment on solar heat generation was conducted in Western Norway in the city of Bergen. Bergen has an oceanic climate with plentiful rainfall in all seasons and intermittent snowfall during winter. The commercial vacuum tube solar collectors were used in the study, which demonstrated that the solar thermal technology was suitable for the given climate conditions. The solar collector facility with an area of 7.8 m2 collected up to 25 kWh/d solar heat in summer; this was enough to cover the domestic hot water demand for a typical household with maximal thermal efficiency of 72%. The collectors’ year-average thermal efficiency was 44% which corresponded to a more straightforward flat-plate solar collector system, taken for warmer climate conditions. We, therefore, expect that the flat-plate technology becomes less suitable for the considered conditions as the efficiency of the flat plates may drop down to 20–30%, making them comparable to solar cells. For future studies, this would be relevant to evaluate an opportunity to boost the efficiency of the flat-plate collectors using a nanofluid instead of the glycol solution and compare the production with the current results. To our knowledge, there are no field prototypes of the nanofluid-based flat plate collectors available in Scandinavia.
We further conclude that a conservative increase of collector’s area to 23.4 m2 will cover the sufficient heat consumption in March-October. In this case, there will be an overproduction of solar heat by 3.9 kWh/d (September) to 24.1 kWh/d (June). It is important to stress that the results for an existing upscaled facility may differ due to increased pumping costs, additional thermal leaks, and different orientation towards the sun, which is the main limitation of the presented analysis. The excessive heat may be accumulated to compensate for the underproduction in winter. The technology of thermal accumulation in a seasonal borehole thermal energy storage (BTES) is widely used in Norway. An auxiliary heat pump is required to extract heat from the wells. There are multiple projects of geothermal storage from domestic engineering companies (Sweco, Ruden etc.). However, there is minimal data available on the thermal properties and thermal regimes of the Norwegian rocks. Therefore, additional studies are required on coupling solar collectors and BTES and synchronize their operation. An optimum heating scenario might also include an installation of 15.6 m2 with auxiliary electrical heating or the use of combined photovoltaic-thermal technology. As it follows from the techno-economical analysis, the payback period for an upscaled facility with the vacuum tube solar collectors is about 12 years in Western Norway. This is at least twice shorter than the average lifetime of the collectors.


 ,
, 


