Article

A Computer Vision-Based Occupancy and Equipment Usage Detection Approach for Reducing Building Energy Demand

Department of Arch and Built Environment, University of Nottingham, University Park, Nottingham NG7 2RD, UK
*
Author to whom correspondence should be addressed.
Energies 2021, 14(1), 156; https://doi.org/10.3390/en14010156
Submission received: 16 November 2020 / Revised: 17 December 2020 / Accepted: 24 December 2020 / Published: 30 December 2020
(This article belongs to the Section G: Energy and Buildings)

Abstract

:
Because of extensive variations in occupancy patterns around office space environments and their use of electrical equipment, accurate occupants’ behaviour detection is valuable for reducing the building energy demand and carbon emissions. Using the collected occupancy information, building energy management system can automatically adjust the operation of heating, ventilation and air-conditioning (HVAC) systems to meet the actual demands in different conditioned spaces in real-time. Existing and commonly used ‘fixed’ schedules for HVAC systems are not sufficient and cannot adjust based on the dynamic changes in building environments. This study proposes a vision-based occupancy and equipment usage detection method based on deep learning for demand-driven control systems. A model based on region-based convolutional neural network (R-CNN) was developed, trained and deployed to a camera for real-time detection of occupancy activities and equipment usage. Experiments tests within a case study office room suggested an overall accuracy of 97.32% and 80.80%. In order to predict the energy savings that can be attained using the proposed approach, the case study building was simulated. The simulation results revealed that the heat gains could be over or under predicted when using static or fixed profiles. Based on the set conditions, the equipment and occupancy gains were 65.75% and 32.74% lower when using the deep learning approach. Overall, the study showed the capabilities of the proposed approach in detecting and recognising multiple occupants’ activities and equipment usage and providing an alternative to estimate the internal heat emissions.

1. Introduction and Literature Review

A significant proportion of global energy demand and emissions is due to the built environment sector [1]. Taking into account the total life cycle of the building, the energy demand of buildings is up to 35% of the total final energy consumption, and this is growing fast [2,3]. Hence it is crucial to minimise the building energy usage in order to meet the global carbon emission reduction target. A significant proportion (40%) of the operational energy use is due to the use of HVAC [4]. This is even higher in areas with very hot or cold climates [5]. Minimising the consumption and enhancing the efficiency of HVAC will go a long way towards the development of a low carbon economy and future. However, the comfort and well-being of the occupants should also be considered when developing solutions [6]. Solutions such as demand-driven controls can achieve substantial energy savings by reducing or eliminating avoidable energy usage and provide a comfortable indoor environment for occupants [7,8].
Occupancy behaviour, activities and patterns are significant factors affecting the utilisation of HVAC [9]. For example, rooms in buildings are not fully utilised or occupied during the day, and in some cases, some rooms are routinely unoccupied. While the HVAC systems use conventional control system and operate by using a fixed set point schedules which assume max occupancy during the entire working week. The use of fixed set points in combination with varying occupancy activities and patterns could lead to rooms frequently being over- or under-conditioned, which may lead to significant energy wastage [10,11]. The studies [12,13] collected occupancy data from various buildings and have shown that those average daily occupancy rates were rarely over 60%, particularly in single-person offices. While equipment or appliances in offices can be kept in operations during the entire working day, irrespective of the patterns of occupancy [14]. This also contributes to the disparity between the predicted and actual energy usage or the energy performance gap.
Hence, the use of solutions, such as demand-driven controls or occupancy-based controls is necessary. Such solutions can adapt to occupancy patterns in real-time and optimise HVAC operations while providing comfortable conditions [15]. These systems reduce energy consumption by optimising the scheduling of the HVAC as well as other building systems by using the occupancy information [16,17]. Energy savings can be achieved by the demand-driven solutions by adjusting the setpoints to reduce the temperature difference between the outdoor and air-conditioned indoor space and reducing the operation time of the systems [18,19,20].
In order to effectively develop and implement demand-driven control strategies for HVAC, accurate and real-time information on real-time occupancy patterns is necessary [21]. The occupancy information can be collected in real-time using sensors and monitoring technologies [22], including passive infrared sensor (PIR) or motion detectors [23], environmental sensors [24], wearable sensors [25] and Bluetooth or Wi-Fi sensors [26]. The capabilities of such strategies have been shown in previous works [21,22,23,24,25,26], which focused on detecting the number and positioning of the occupants in a space. However, research on detecting the occupancy activities and predicting heat gains which can affect the indoor environment conditions are limited [27,28]. The activities of occupants can affect the internal heat gains (sensible and latent heat) in spaces directly [27] and indirectly [28]. For example, a person walking around the space will have a different heat emission or heat gain as compared to a person sitting. In addition, the usage of equipment in offices such as desktops and printers can also have an impact on the internal heat gains. The information on the heat emitted by the occupants performing different activities and usage of equipment can be utilised to better assess the actual requirements of spaces in terms of heating, cooling and ventilation [29]. A potential solution is to use artificial intelligence (AI)-based techniques such as deep learning and computer vision to accurately detect, recognise and predict these information in real-time [30].
Deep learning is a machine learning technique which has been utilised to implement tasks such as classifying objects, recognising speech, detection of pedestrians with high accuracy [31]. Additionally, many studies have shown that the convolutional neural network (CNN) can perform well in computer vision tasks [32]; hence CNN was selected as the algorithm to enable real-time detection and recognition in this study. It is widely used as it can directly feed the original image into the model instead of performing the complex pre-processing of the image [33].
Deep learning and computer vision methods have recently been adopted in the built environment to enhance building system operations. Zou et al. [34] proposed a deep learning-based human activity recognition scheme to automatically identify common activities in offices which assessed a 97.6% activity recognition accuracy. Markovic et al. [35] used a deep feed-forward neural network to model the opening of windows in offices which showed an evaluation accuracy between 86% and 89%. These studies indicate that deep learning and computer vision methods have large potential to accurately evaluate the energy behaviour in the buildings and further optimise the operations of building management systems.
To form effective detection models, a suitable deep learning framework platform is required. Many deep learning framework libraries and platforms such as TensorFlow, PyTorch and Keras are highly popular and are recommended according to Google Trends (as of February 2020) [36]. Along with the comparison of deep learning frameworks by Fonnegra et al. [37], it suggests that TensorFlow is one of the most employed tools used for deep learning because of its capabilities, compatibility, speed and the support it provides. TensorFlow [38] allows the testing of configurations of deep learning algorithms and demonstration of their robustness. According to previous works, many choose TensorFlow as the desired platform for the development of solutions for building-related applications. This includes [35] where TensorFlow has been used as a platform to train the desired deep learning model. Vázquez-Canteli et al. [39] fused TensorFlow technique with building energy simulation (BES) to develop an intelligent energy management system for smart cities and Jo and Yoon [40] indicated that TensorFlow was used to establish a smart home energy efficiency model. Additionally, the provision of pre-existing open-source deep learning-based models by TensorFlow, such as the CNN TensorFlow object detection API [41] enabled researchers to use this framework as the base configuration for detection-based applications. This includes the applications by [33,42,43], which effectively fine-tuned the model to improve accuracy and to adapt for the research desired detection purposes. Therefore, the TensorFlow platform with the CNN object detection API was employed for the development of a suitable model for this study.

1.1. Literature Gap and Novelty

Previous works [34,44] have shown the capabilities of computer vision and deep learning methods to detect and classify human presence and movement. Many of the studies focused on improving the performance of such approaches such as detection accuracy, robustness, speed etc. However, studies focusing on using the provided data to seek solutions for minimising the unnecessary building energy usage have been limited. In addition, no work has employed computer vision and deep learning methods to predict the heat emitted (sensible and latent) by both occupants and equipment in a building space, which can affect the temperature and moisture levels and subsequently the operation of the HVAC. Furthermore, studies that conducted field testing of computer vision occupancy detection approaches in office spaces have been limited.

1.2. Aims and Objectives

To address the literature gaps, this study aims to detect and recognise the real-time usage of multiple equipments and occupancy patterns in a room or space using a computer vision and deep learning approach. A Faster R-CNN is developed and trained for classification and deployed to a camera for detecting the occupancy activities and equipment usage. This method identifies the multiple occupants and equipment within an indoor space and the activities performed by each of them. The model performance is evaluated in terms of the different evaluation metrics. Field testing in an actual office space at the University of Nottingham is carried out to validate the proposed approach and assess its capabilities. In order to evaluate the impact on the cooling and heating energy demand, the case study building was modelled and simulated in a building energy simulation (BES) tool and the data generated using the proposed approach were used as input. A comparison between the heat emission profiles of the proposed approach (also called here deep learning influenced profile or DLIP) and fixed or static profiles is conducted.

2. Method

The following section presents an outline of the research method and provides the proposed framework for the development of a method for detecting and recognising equipment usage and occupancy activities in an office space. It is envisioned that this approach will provide a better insight of the building operations and information which could be incorporated with the building energy management system to enhance building energy efficiency.

2.1. Overview of the Research Framework and Approach

Figure 1 presents the proposed research method and framework. Initially, an office space was chosen to carry out the initial testing of the deep learning framework. The office space was also modelled for the evaluation of its potential impact on the energy usage of the building. The approach can be split into two parts: 1. implementation of the proposed deep learning framework and 2. framework performance analysis. In the first part (highlighted in green), an appropriate model was selected, and this was modified and used to develop the models for the occupancy and equipment usage detection. The deep learning detection models were deployed to an AI-enabled camera and tested within the chosen office space. In this study, the two models were tested separately to perform a detailed evaluation of the performance of each method. It is envisioned that in future works, both methods will be combined and deployed to a single device to carry out both occupancy and equipment detection. The detection output will be used to generate heat gain profiles for occupancy and equipment, also called here deep learning influenced profiles (DLIP). This information could then be used by the controller or control system to automatically adjust the HVAC operations. In order to assess its feasibility and analyse its potential impact on building energy use, Part 2.1 presents the analysis of detection performance and recognition accuracies and Part 2.2 presents the use of scenarios and BES software.

2.2. Deep Learning Method

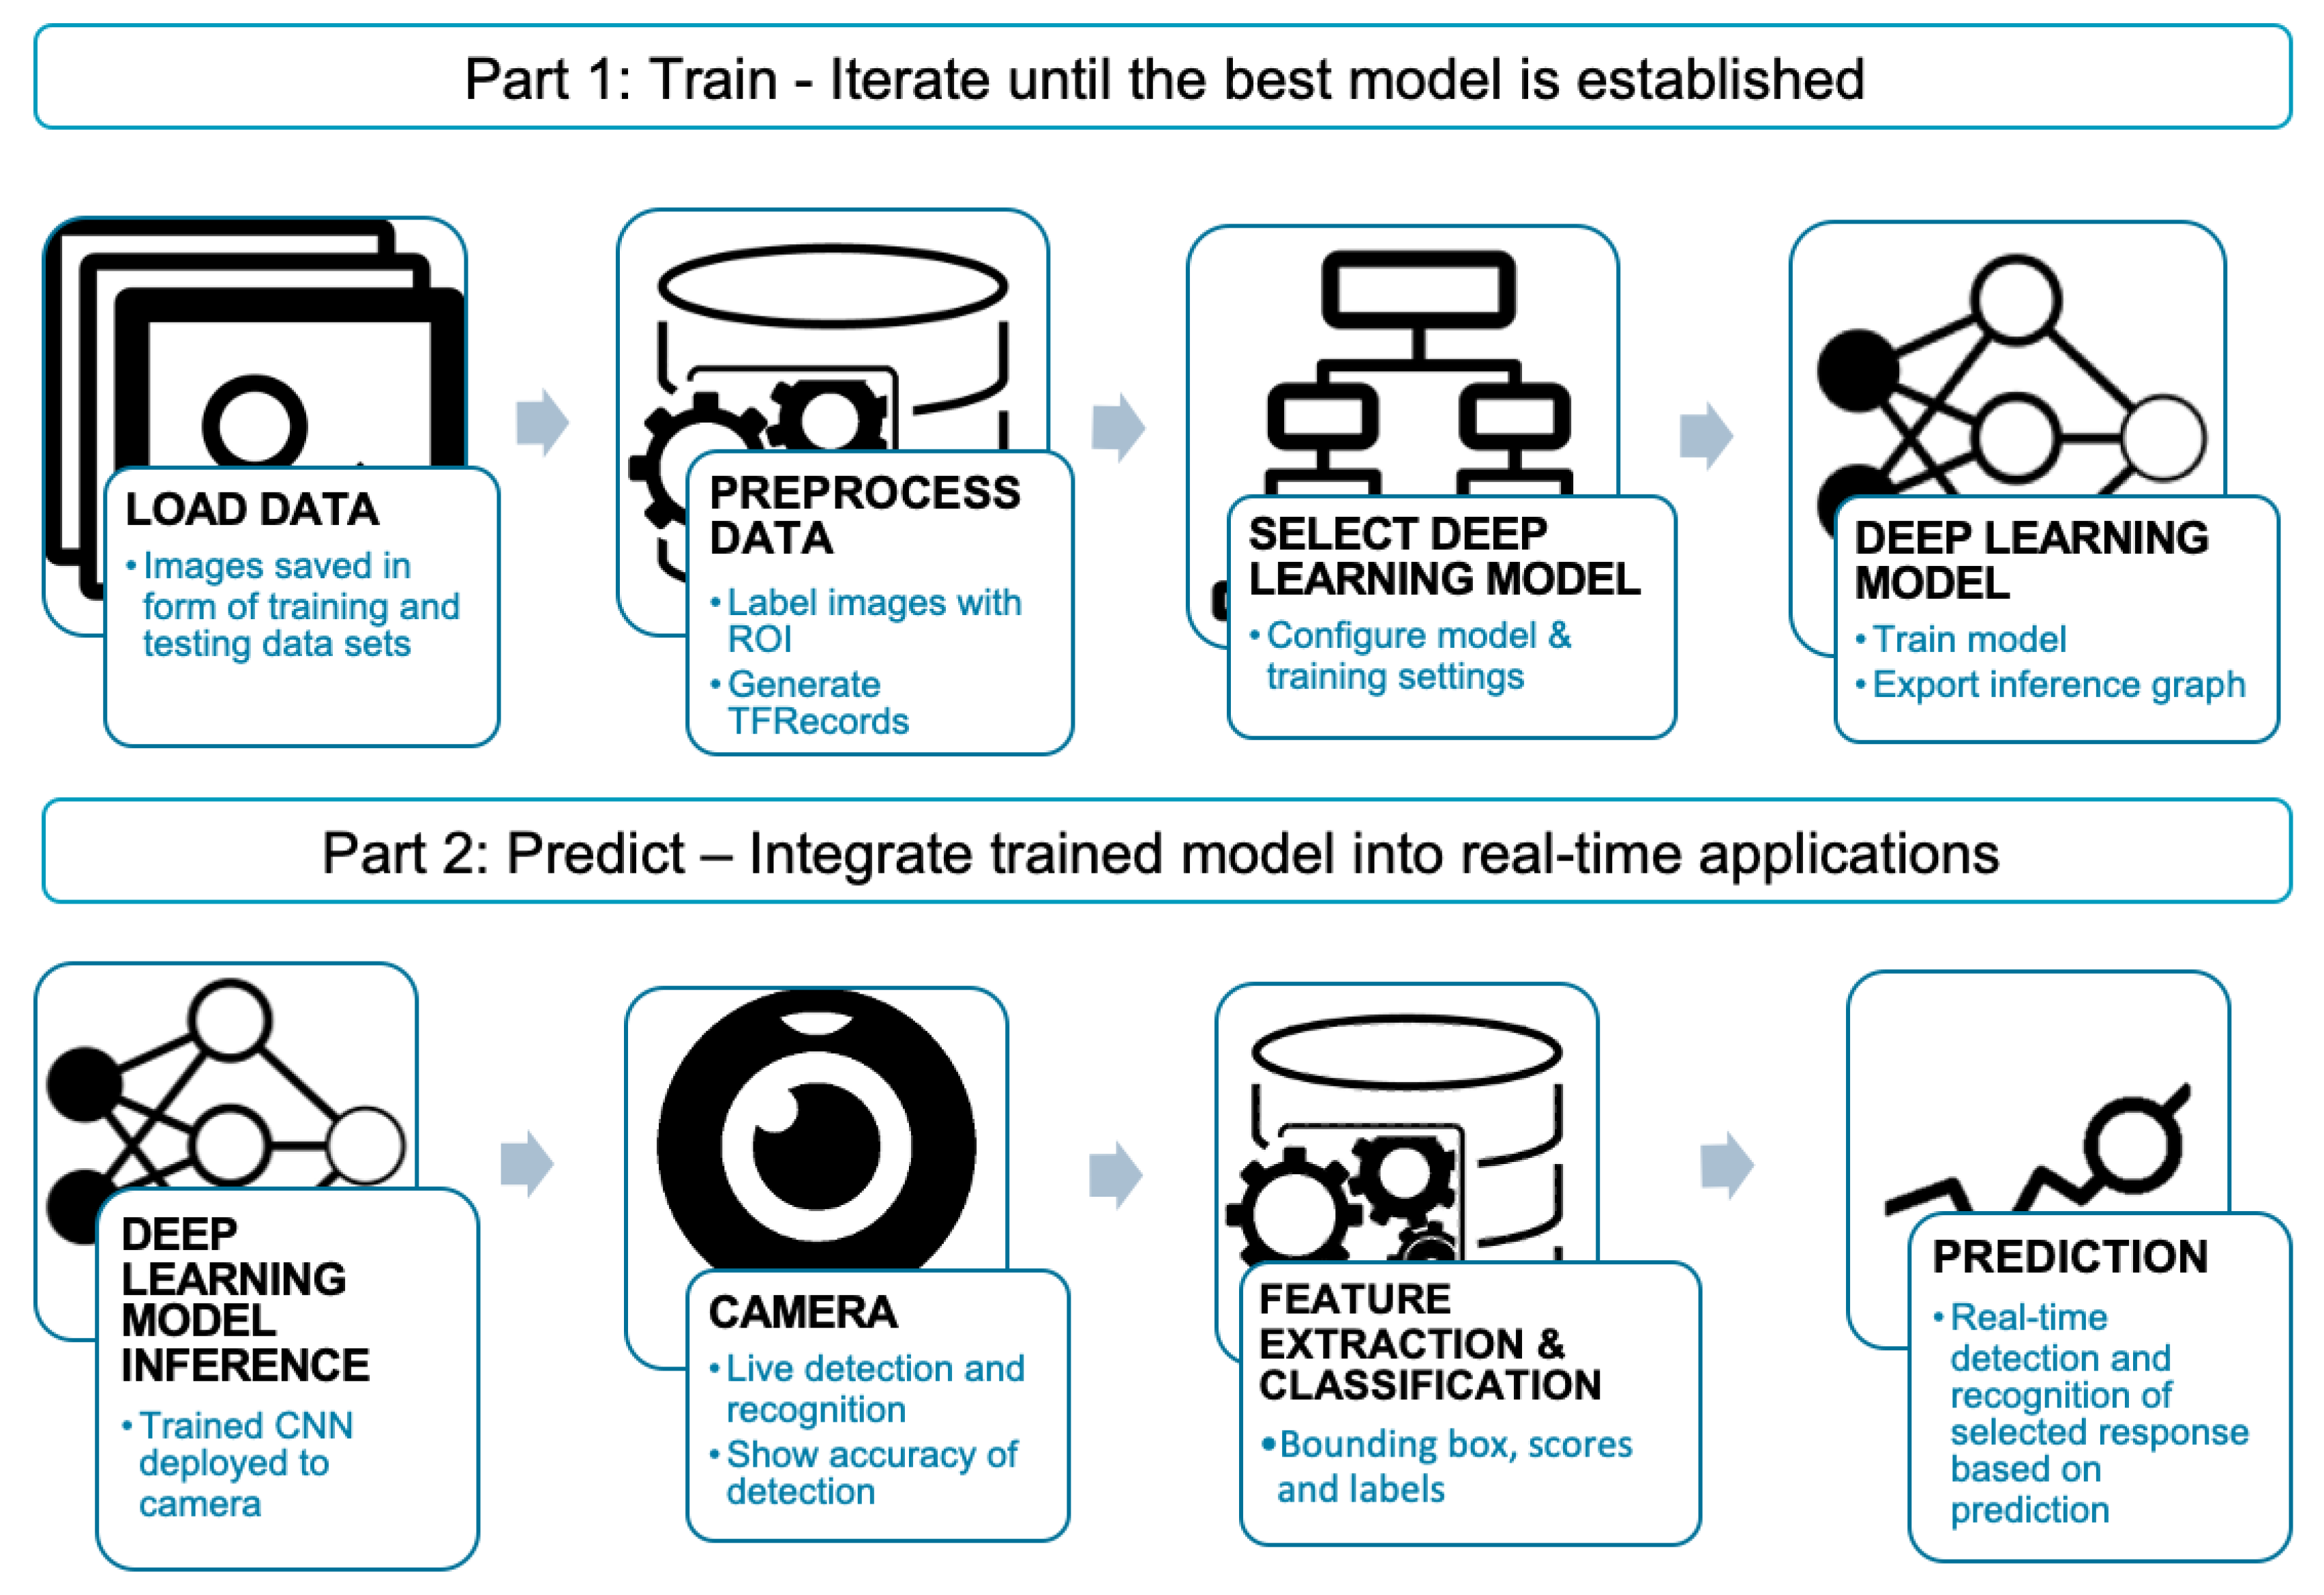
The workflow procedure for the occupancy and equipment detection-based solution is indicated in Figure 2. Part 1 consists of the data collection and model training procedure. The training datasets were in the form of images. These were collected and processed through manual labelling of the images. Next, the CNN-based deep learning model was selected as the most suitable type. The CNN TensorFlow Object Detection API was used as a base framework to enable the application in the form of a transfer learning approach. The use of such a transfer learning method to establish the deep learning model allows the development of accurate detection models with a reduced network training time and requiring fewer amounts of input data. Part 2 of the workflow consists of the deployment of the trained model into an AI-enabled camera to allow the detection and recognition of occupants and equipment usage in real-time. More details about the workflow, as shown in Figure 2 are discussed in the following subsections.

2.2.1. Data Preparation: Datasets and Pre-Processing

The initial stage of the development of the deep learning model was collecting relevant input data. Images were selected to create large datasets for training and testing. Images were collected from various sources because of the lack of relevant dataset in previous and current studies, as detailed in Table 1 and Table 2. The number of images within the datasets followed the rule of thumb and suggestion given by Ng [45] of 80% of the images being assigned for training and 20% for testing. The images were collected from the Google search engine and taken within real office spaces (different from the space used in the test) by using cameras. Both training and testing dataset images were labelled manually by using the software LabelImg [46]. LabelImg is able to label object bounding boxes in images and creates XML files that describe the objects in the images that assist the detector to recognise the objects. For some cases, when one or more of the required responses were present, it would mean multiple numbers of labels would be assigned to each image. For instance and image showing two people who were walking, it would suggest the assignment of two labels. After labelling, the associated XML files to each of the images in the dataset were converted to form TFRecord files to provide a summary of the data which would be utilised for model training.

2.2.2. Detection Model: CNN-Based Model Selection and Configuration

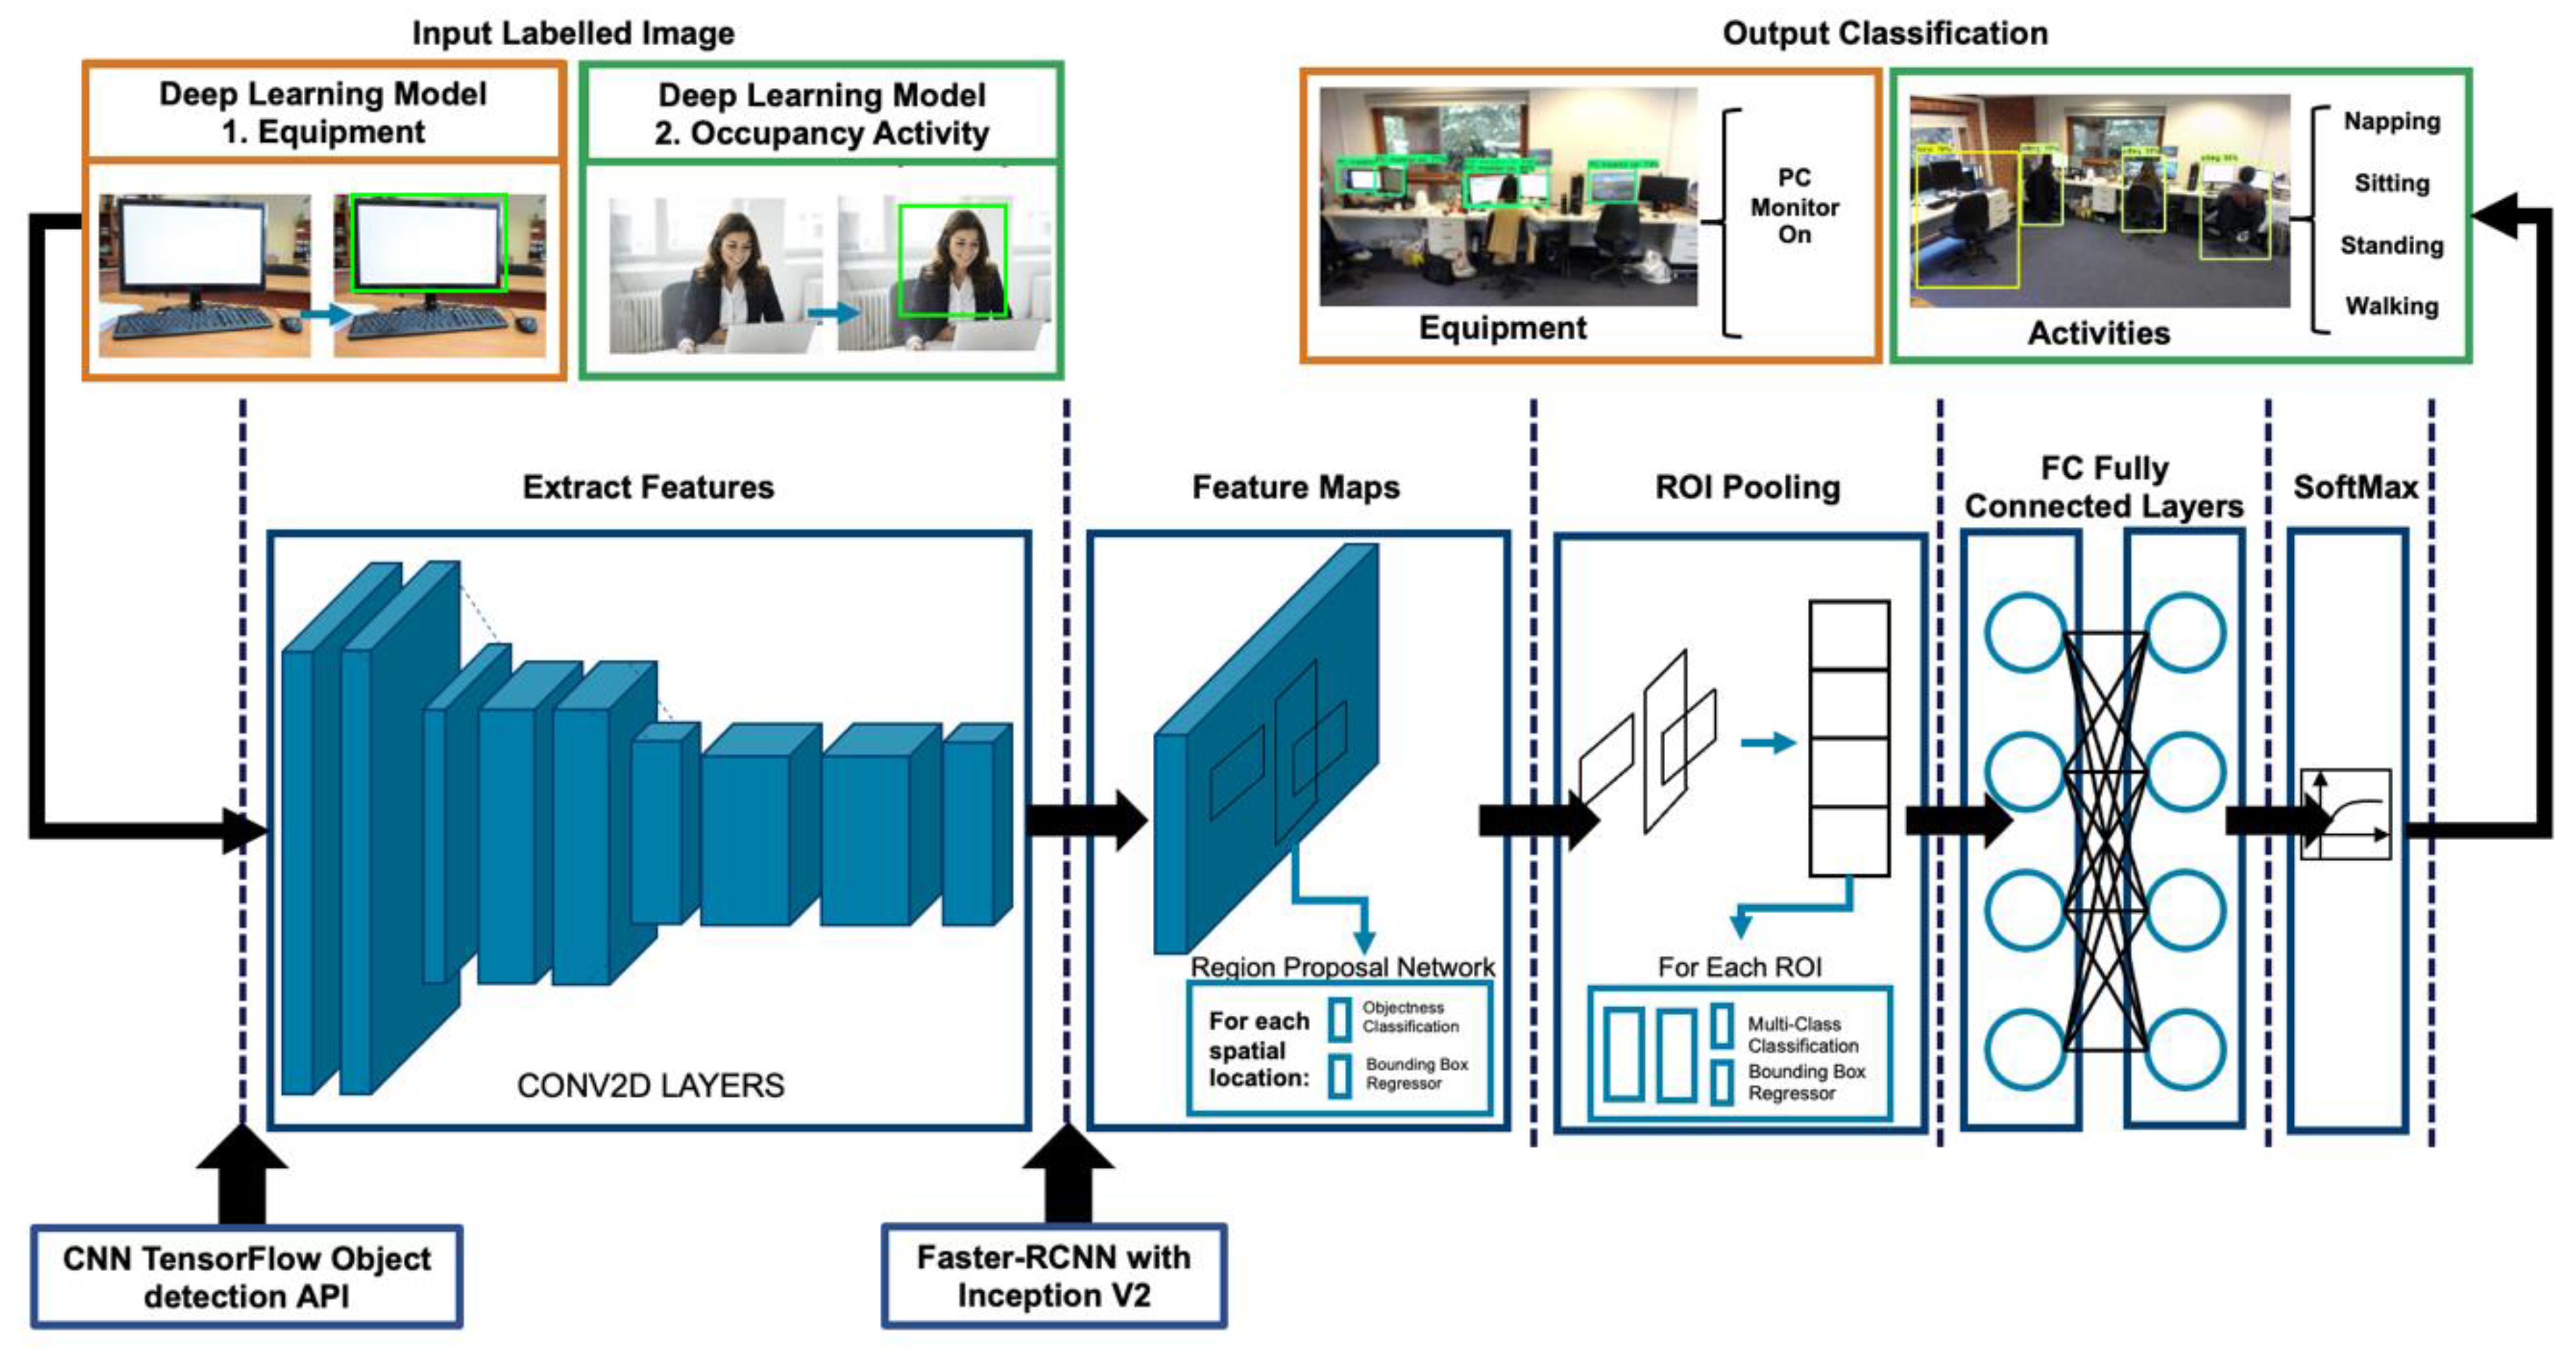
To train the convolutional neural network model, the general process requires defining the network architecture layers and training options. Based on the transfer learning approach through the application of the CNN TensorFlow Object detection API, a pre-trained training model was selected and used to train the required detection and recognition-based models. Many models consisting of different variations of similar algorithms have been established. This includes the RCNN [32], deep networks with SPP-Net [47], Fast RCNN [48] and Faster RCNN [49]. SPP-Net, Fast RCNN, Faster RCNN are the algorithms based on a different variation of the RCNN. Modifications towards the general RCNN architecture would enable the enhancement of the network performance. RCNN can identify a large number of bounding-box object region of interest (RoI) and then uses a CNN to extract features from each region individually for classification [32]. On this basis, SPP-Net proposes an SPP layer to remove the restrictions on the network fixed size and perform feature extraction [47]. Hence, unlike RCNN, which needs to run a convolution layer repeatedly to extract features, SPP-Net only requires implementing convolution operation once which results in a reduction of implementation time. Fast RCNN is similar to RCNN while instead of inputting RoI to the CNN, Fast RCNN applies the input image to the CNN layer to create a convolutional feature map and then uses an RoI pooling layer to reshape the region of proposals identified from the feature map into a fixed size and feed it into a fully connected layer [48]. Comparing with RCNN, Fast RCNN runs faster as the convolution operation is performed only once for each image rather than feeding a number of region proposals to the CNN every time.
Both RCNN and Fast RCNN employ selective search to look for the region proposals that consume a long time and further influence the performance of the network. A region proposal network (RPN) module is used by the Faster RCNN as the attention mechanism, which lets the network instead of the selective search learn the region proposals [42]. Ren et al. [49] came up with the algorithm and designed the architecture of Faster RCNN which also feeds the input image into the convolution layers to generate a convolutional feature map which is similar to Fast RCNN. Then the region proposals are predicted by using an RPN layer and reshaped by an RoI pooling layer. The image within the proposed region is then detected by the pooling layer. Overall, SPP-Net, Fast RCNN, Faster RCNN all enhance the performance of the network. However, according to the comparison of the test-time speed of different CNN-based object detection algorithms [50], Faster RCNN is much quicker than other algorithms which is important for live object detection. In addition, as the Inception module could improve the utilisation of the computing resources inside the network, it was used together with Faster RCNN to achieve a higher accuracy of the detection task [42]. Therefore, in this study, Faster RCNN with InceptionV2 was selected as the main model configuration used to train the two detection models. Tests using different training model types would be implemented in future cases to provide an analysis and validation of the most suitable training model applied for the detection model. Figure 3 summarises the architecture and the pipeline configuration of the model used for both equipment and occupancy activity detection.

2.3. Deep Learning Model Application

This section presents the methods required for the implementation of the model. It includes the details of the setup of the experiment and selected building; along with the procedure of live detection and recognition to form the deep learning influenced profile (DLIP).

2.3.1. Experiment Setup and Case Study Building

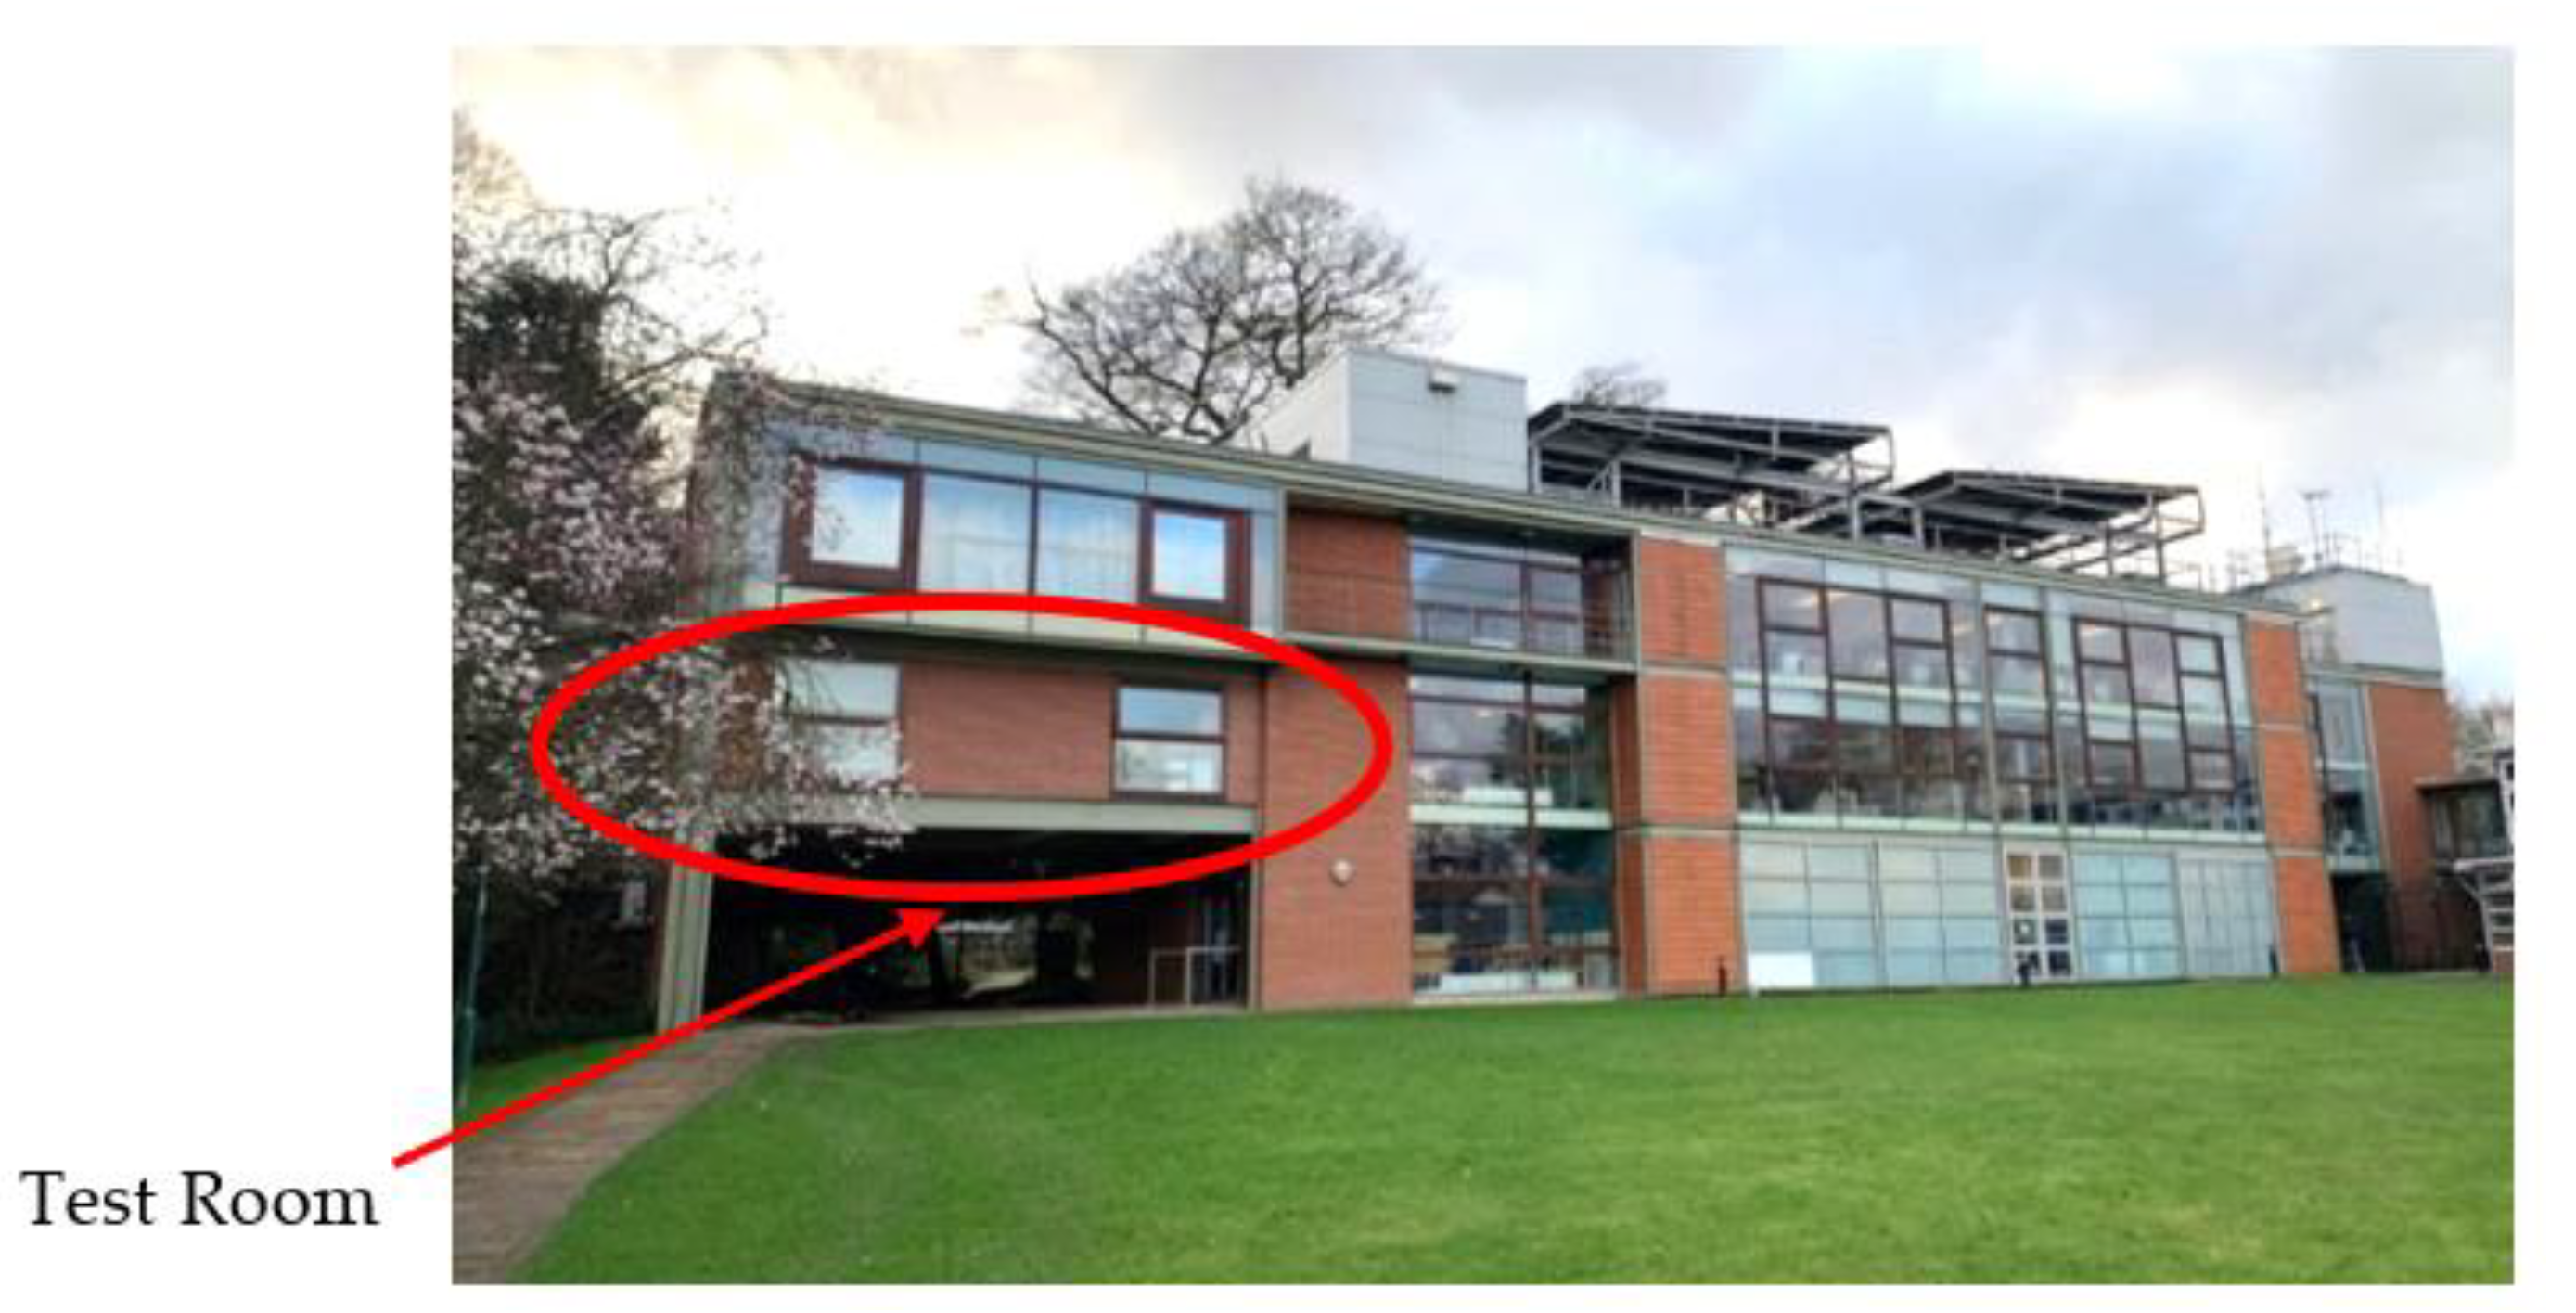
The Sustainable Research Building (University of Nottingham, Nottingham, UK) was chosen as the case study building. Given in Figure 4, it consists of a three-storey structure which provides a facility in order to research sustainable and renewable energy systems. It achieves a BREEAM rating of excellent.
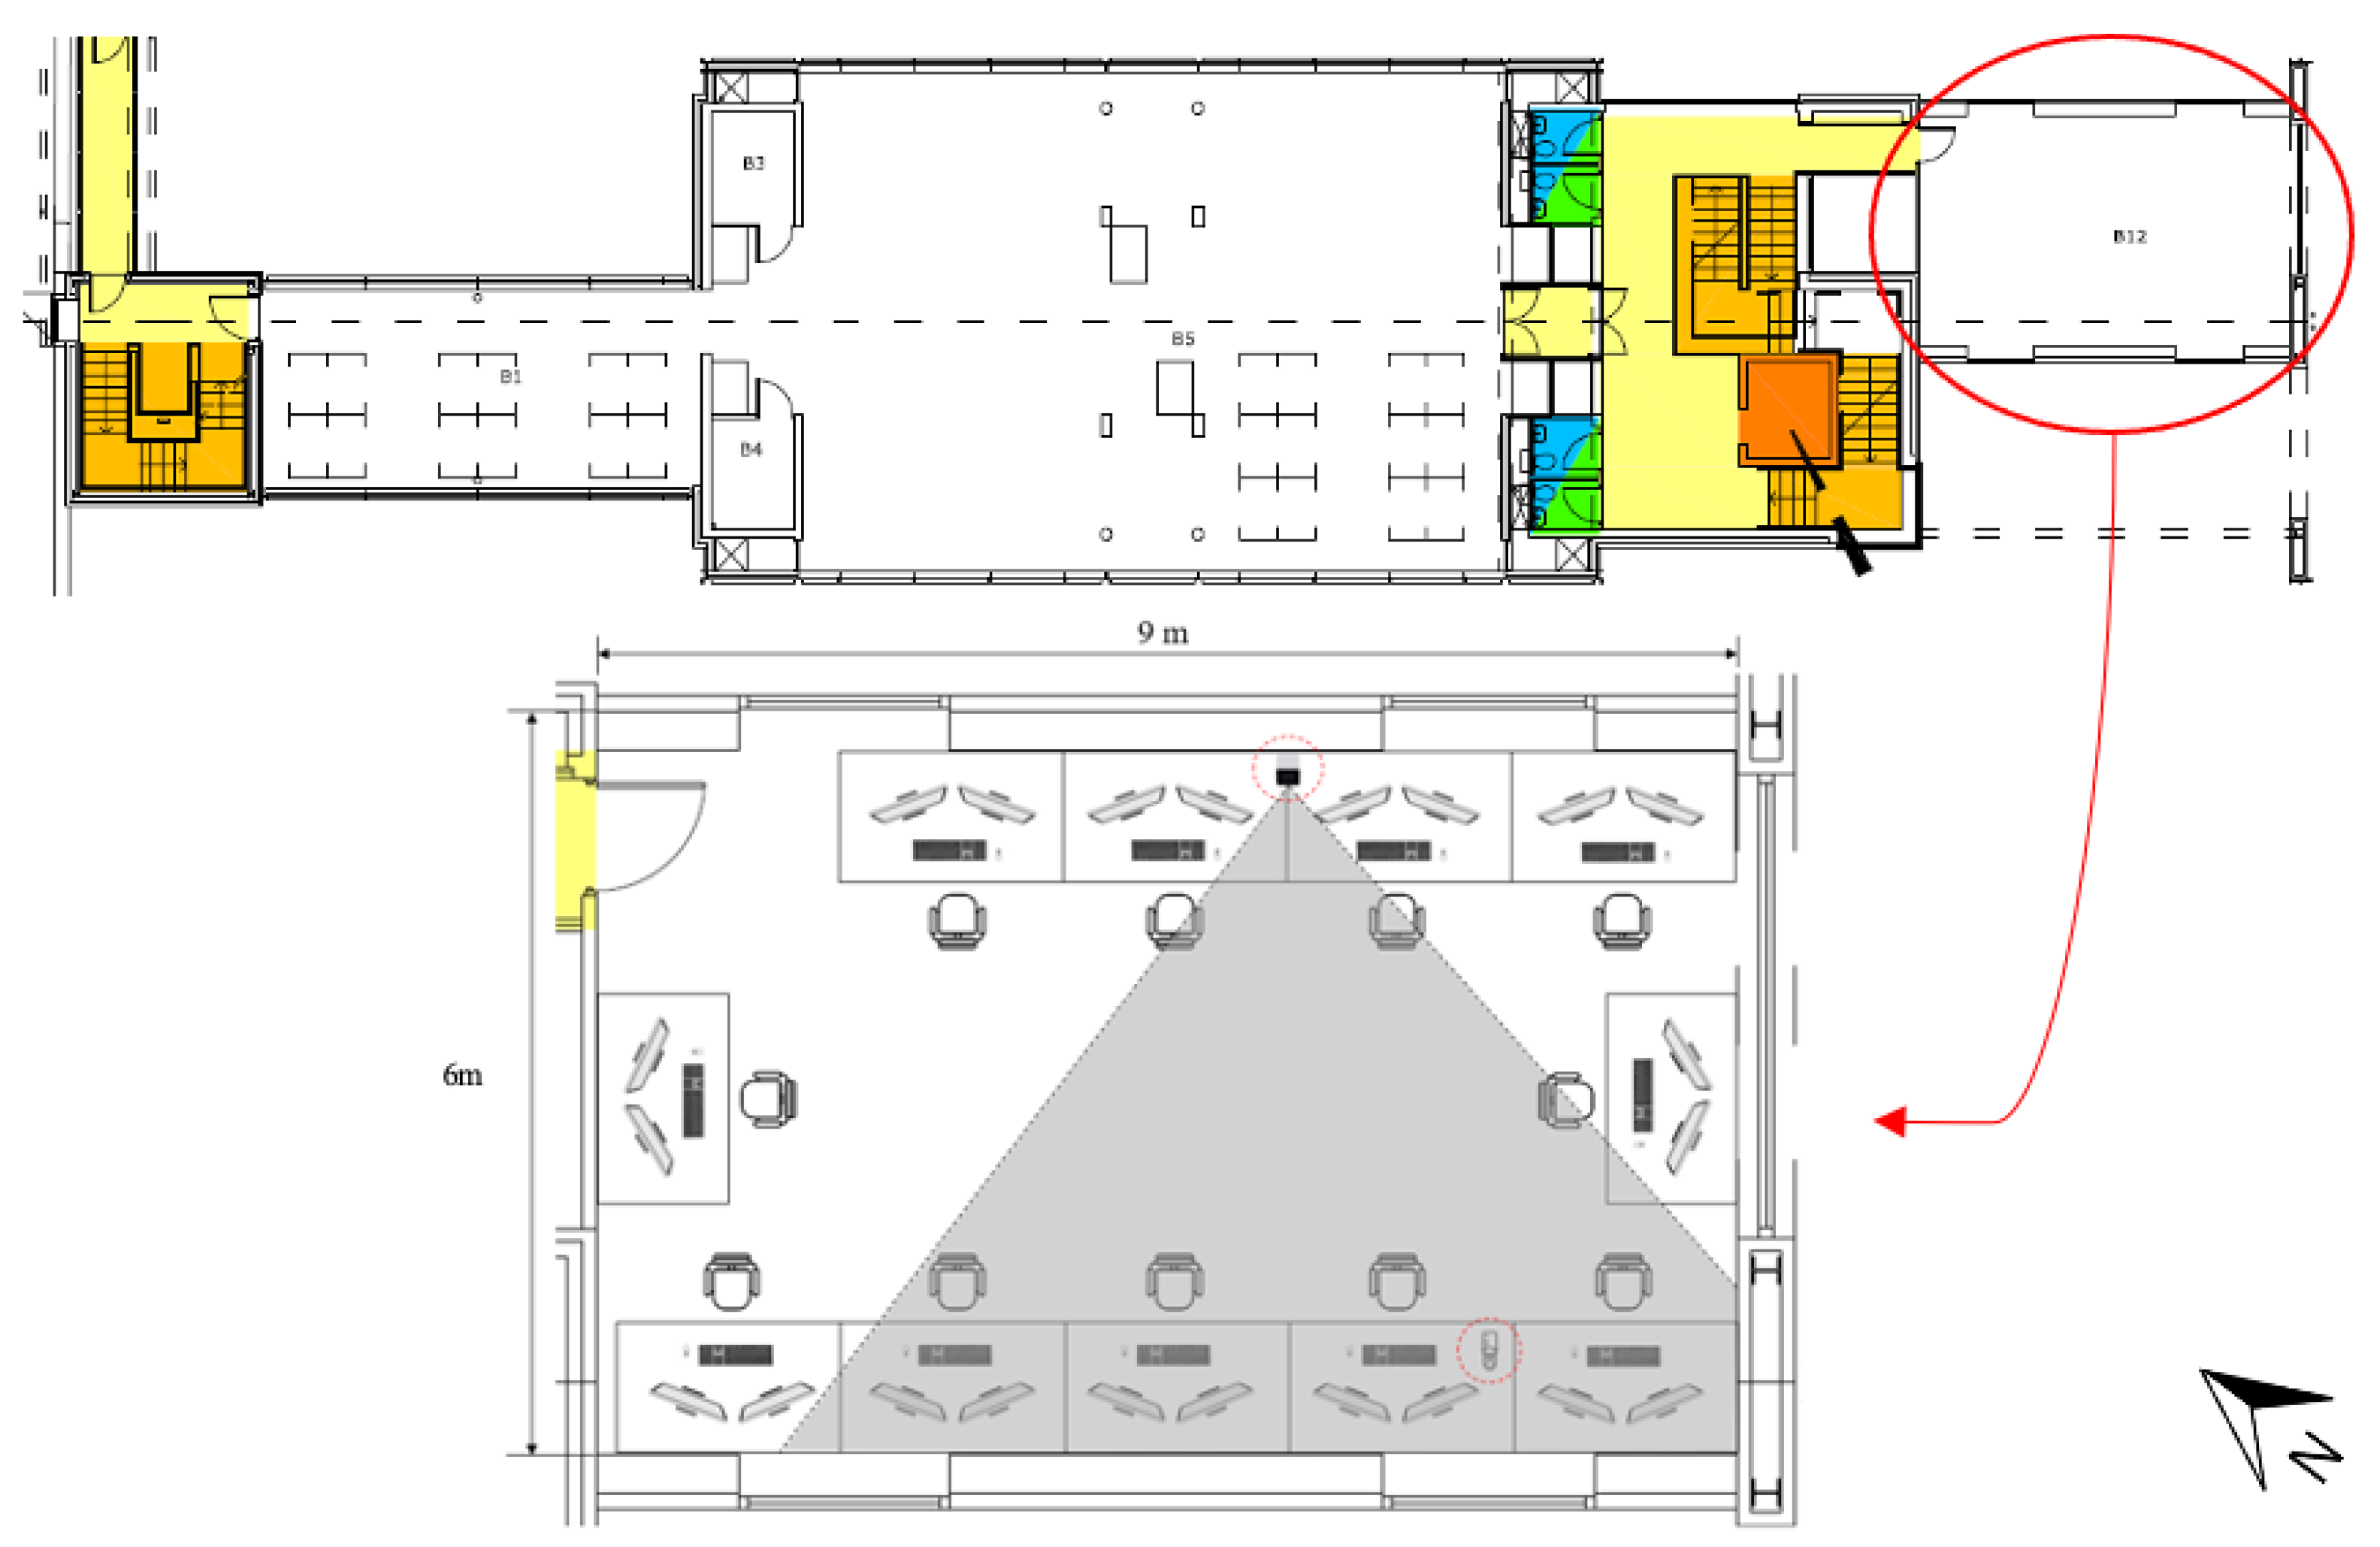
The selected open plan office on the first floor of the building was used to perform the initial live detection using the established deep learning models. The same building was also used for the initial performance analysis where the office space was modelled using the IESVE tool, a BES software [51] to evaluate the potential of this method and the impact towards building energy loads. The selected office space consists of a floor area of 54 m2. The test room has internal dimensions of 9 m × 6 m and 2.5 m height. The experimental setup is presented in Figure 5. A camera with 1080p resolution and a wide field of view was installed close to the ceiling in the office space and connected to a computer to perform equipment detection using the trained detection model.
Within the detectable range, there are eight monitors (heat rate of approx. 50 W) and each monitor is connected with a desktop computer (heat rate of approx. 200 W). Furthermore, according to [52], occupancy profiles were set with a sensible heat gain (70 W/person) and latent heat gain (45 W/person). The infiltration rate was assumed to be 0.1ach. Furthermore, the building was equipped with natural ventilation (manually operated), along with a window air-conditioning system to provide an internal set point temperature maintained at 21 °C. Scenarios with various occupancy and equipment load profiles are inputted into the BES software to simulate the energy demand for the office space. The scenarios and energy simulation model are discussed in the following subsections.

2.3.2. Live Detection and Deep Learning Influenced Profile (DLIP) Formation

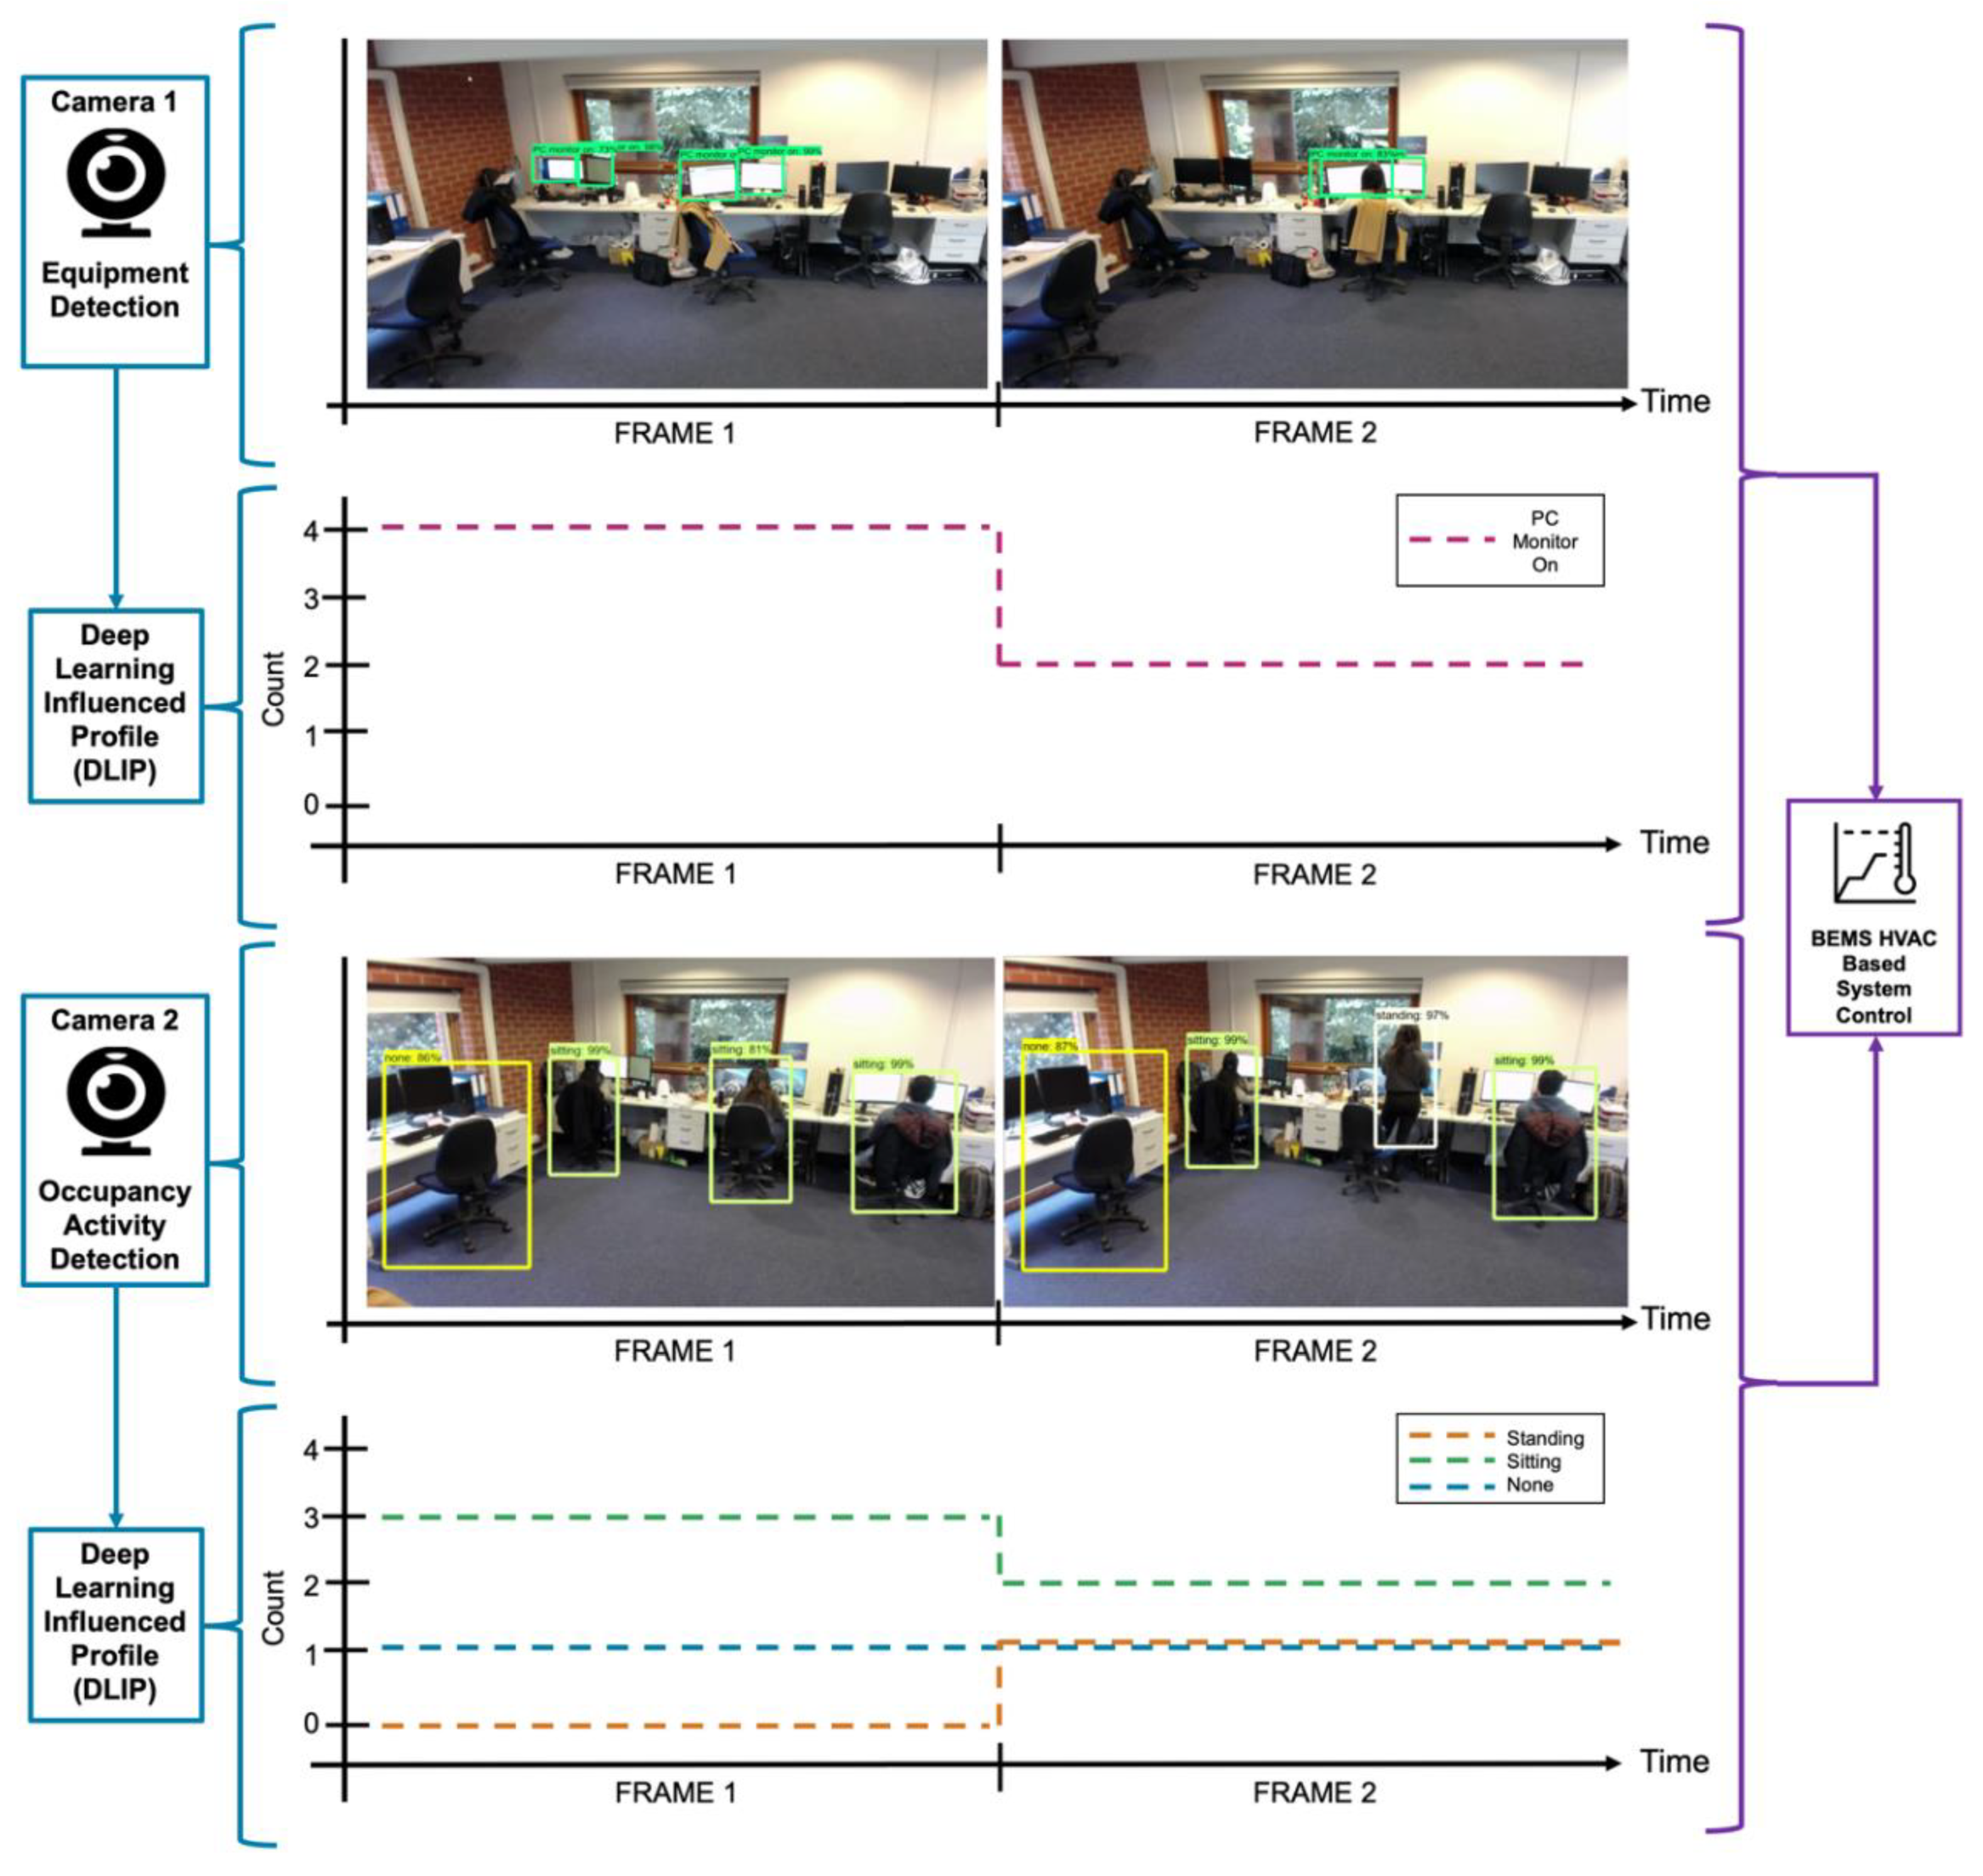
Using the developed deep learning model, a typical day was selected to perform the live experimental detection and recognition to assess the capabilities of the method. A range of activities was performed by the occupants and several PC monitors were switched on and used by the occupants. During the real-time detection, the output data for each of the detected occupants and pc monitors were used to form the occupancy and equipment deep learning profiles (DLIP) based on the number of detection and recognitions made. Figure 6 presents an example of the generated DLIP from the live detection within the selected office space. The figure also shows example snapshots or frames that include the detected condition (occupancy activity and equipment status) and the percentage of the prediction accuracy. It should be noted that for this experimental tests, the two trained deep learning models were deployed to two separate cameras. As mentioned before, in future works the models will be deployed into a single camera which will allow for simultaneous real-time detections of both equipment and occupants. The count profile could be used to form equipment and occupancy heat emissions profiles for building control systems. The profile consists of values corresponding to each of the detected occupancy activity, which can be coupled with the heat emission data for different activities within the office spaces. Similarly, heat emission values for office-based electrical equipment were considered. Further details corresponding to the selected values are given in Section 2.4.2.

2.4. Conditions for Framework Performance and Analysis

In the second part of the method (as detailed in Figure 2), the model performance is assessed based on the experimental detection and the analysis and also building energy performance analysis. The following section provides the conditions used to perform such analysis.

2.4.1. Detection Performance Evaluation

To summarise the detection results of the proposed algorithm, the test images assigned in Table 1 and Table 2 are used to evaluate the detection performance to provide results in the form of a confusion matrix, and values for the terms of true positive (TP: representing the achievement of a correct detection), true negative (TN: representing correct detection when computers are off or a different occupancy activity), false positive (FP: representing the number of instances that the prediction was not true, or another instance being wrongly identified as this response) and false negative (FN: representing the number of instances as predicted to be something else, but it actually was not). Based on the created confusion matrix, precision and recall are frequently used to evaluate the accuracy of the algorithm for object detection which are defined by the Equations (2) and (3) respectively. Precision is the measure of exactness or quality, while recall is a measure of completeness or quantity. However, it is not sufficient to evaluate the detection performance when precision and recall were separately used. With the consideration of a balance between precision and recall, a measure called F1 Score is formed by combining these two measures and expressed as Equation (4).
Accuracy = ( TP + TN ) ( P + N )
Precision = TP TP + FP
Recall = TP TP + FN
F 1   Score = 2 × Precision × Recall Precision + Recall

2.4.2. Heat Gain Calculation

To assist the operations of building HVAC system controls, the generated profiles are converted to DLIP which is based on heat emissions. In addition, using the following heat gain calculation and conditions, the profiles can be inputted within the BES model to analyse the impact of the deep learning solution on the energy demand.

Equipment

The total heat gains from equipment is the sum of the heat emission of different types of office equipment, which is the product of the number of the specific type of equipment in use and the value of heat gain of this equipment. It can be expressed as Equation (5). The number of equipment in use is the output of the proposed method. For this model, the typical values of the heat released from different types of office equipment which can be obtained from CIBSE Guide [52] or ASHARE Handbook are utilised to calculate the total equipment heat gains in this study.
Equipment   heat   gains = n × Q a
where n is the number of the specific type of appliance in use, and Qa is the heat gain of the specific type of appliance.

Occupancy

Similarly, this study uses the occupancy heat emission rates, given by [52] (Table 3) to predict the total occupancy heat gains.

2.4.3. Building Energy Simulation and Test Scenarios

This section presents the description of the method and conditions for the analysis of the proposed deep learning vision-based framework based on the use of a BES tool along with the suggested test scenarios.

Building Energy Simulation Model

A BES tool was used to model the office space with the conditions given above. The validation of the IESVE tool and equations employed are detailed in our previous studies [53,54].
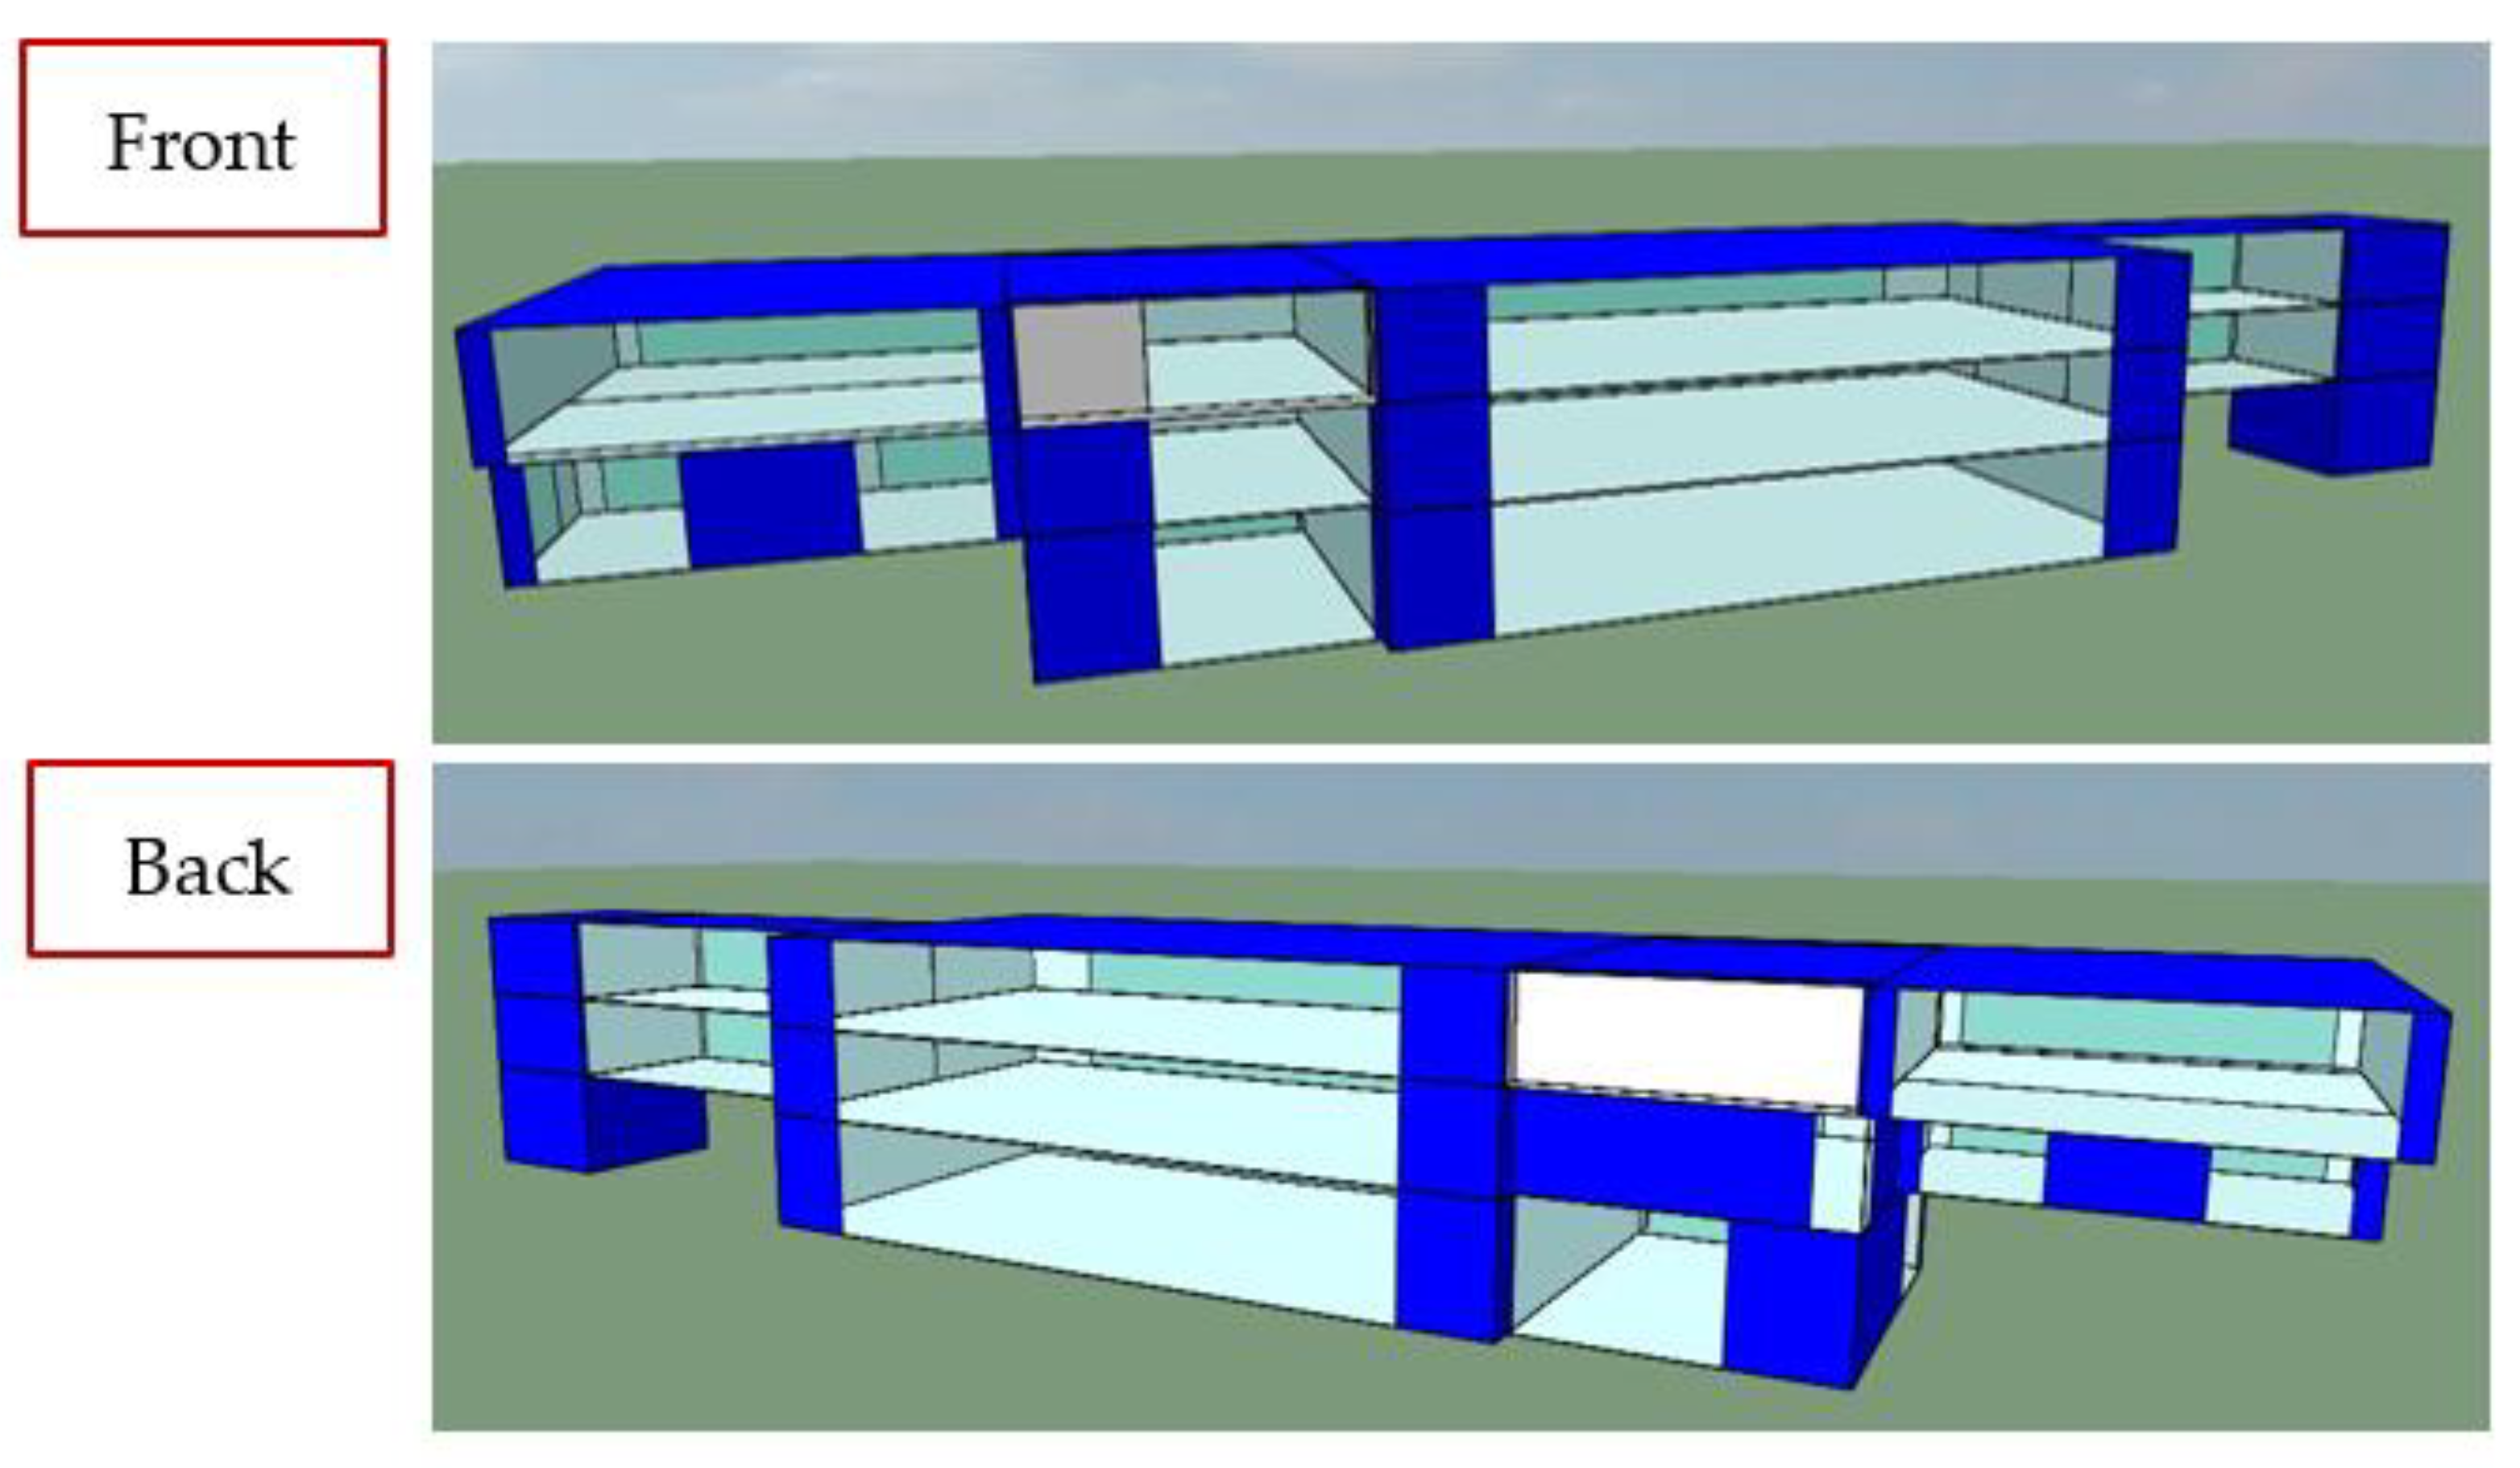
The case study building was modelled using IESVE software with some building and exterior features simplified. The building was divided into different thermal zones which allow setting up of different operation profiles for each zone. The wall U-value was 0.17 W/m2 K, roof was 0.15 W/m2 K, ground was 0.15 W/m2 K and glazing was 1.92 W/m2 K, which were obtained from the available building drawings. The weather data for Nottingham was employed for the simulations. Details about the associated profiles assigned for the building, occupancy and equipment were given differently for each of the selected test scenarios. The geometry of the case study building is created and presented in Figure 7.
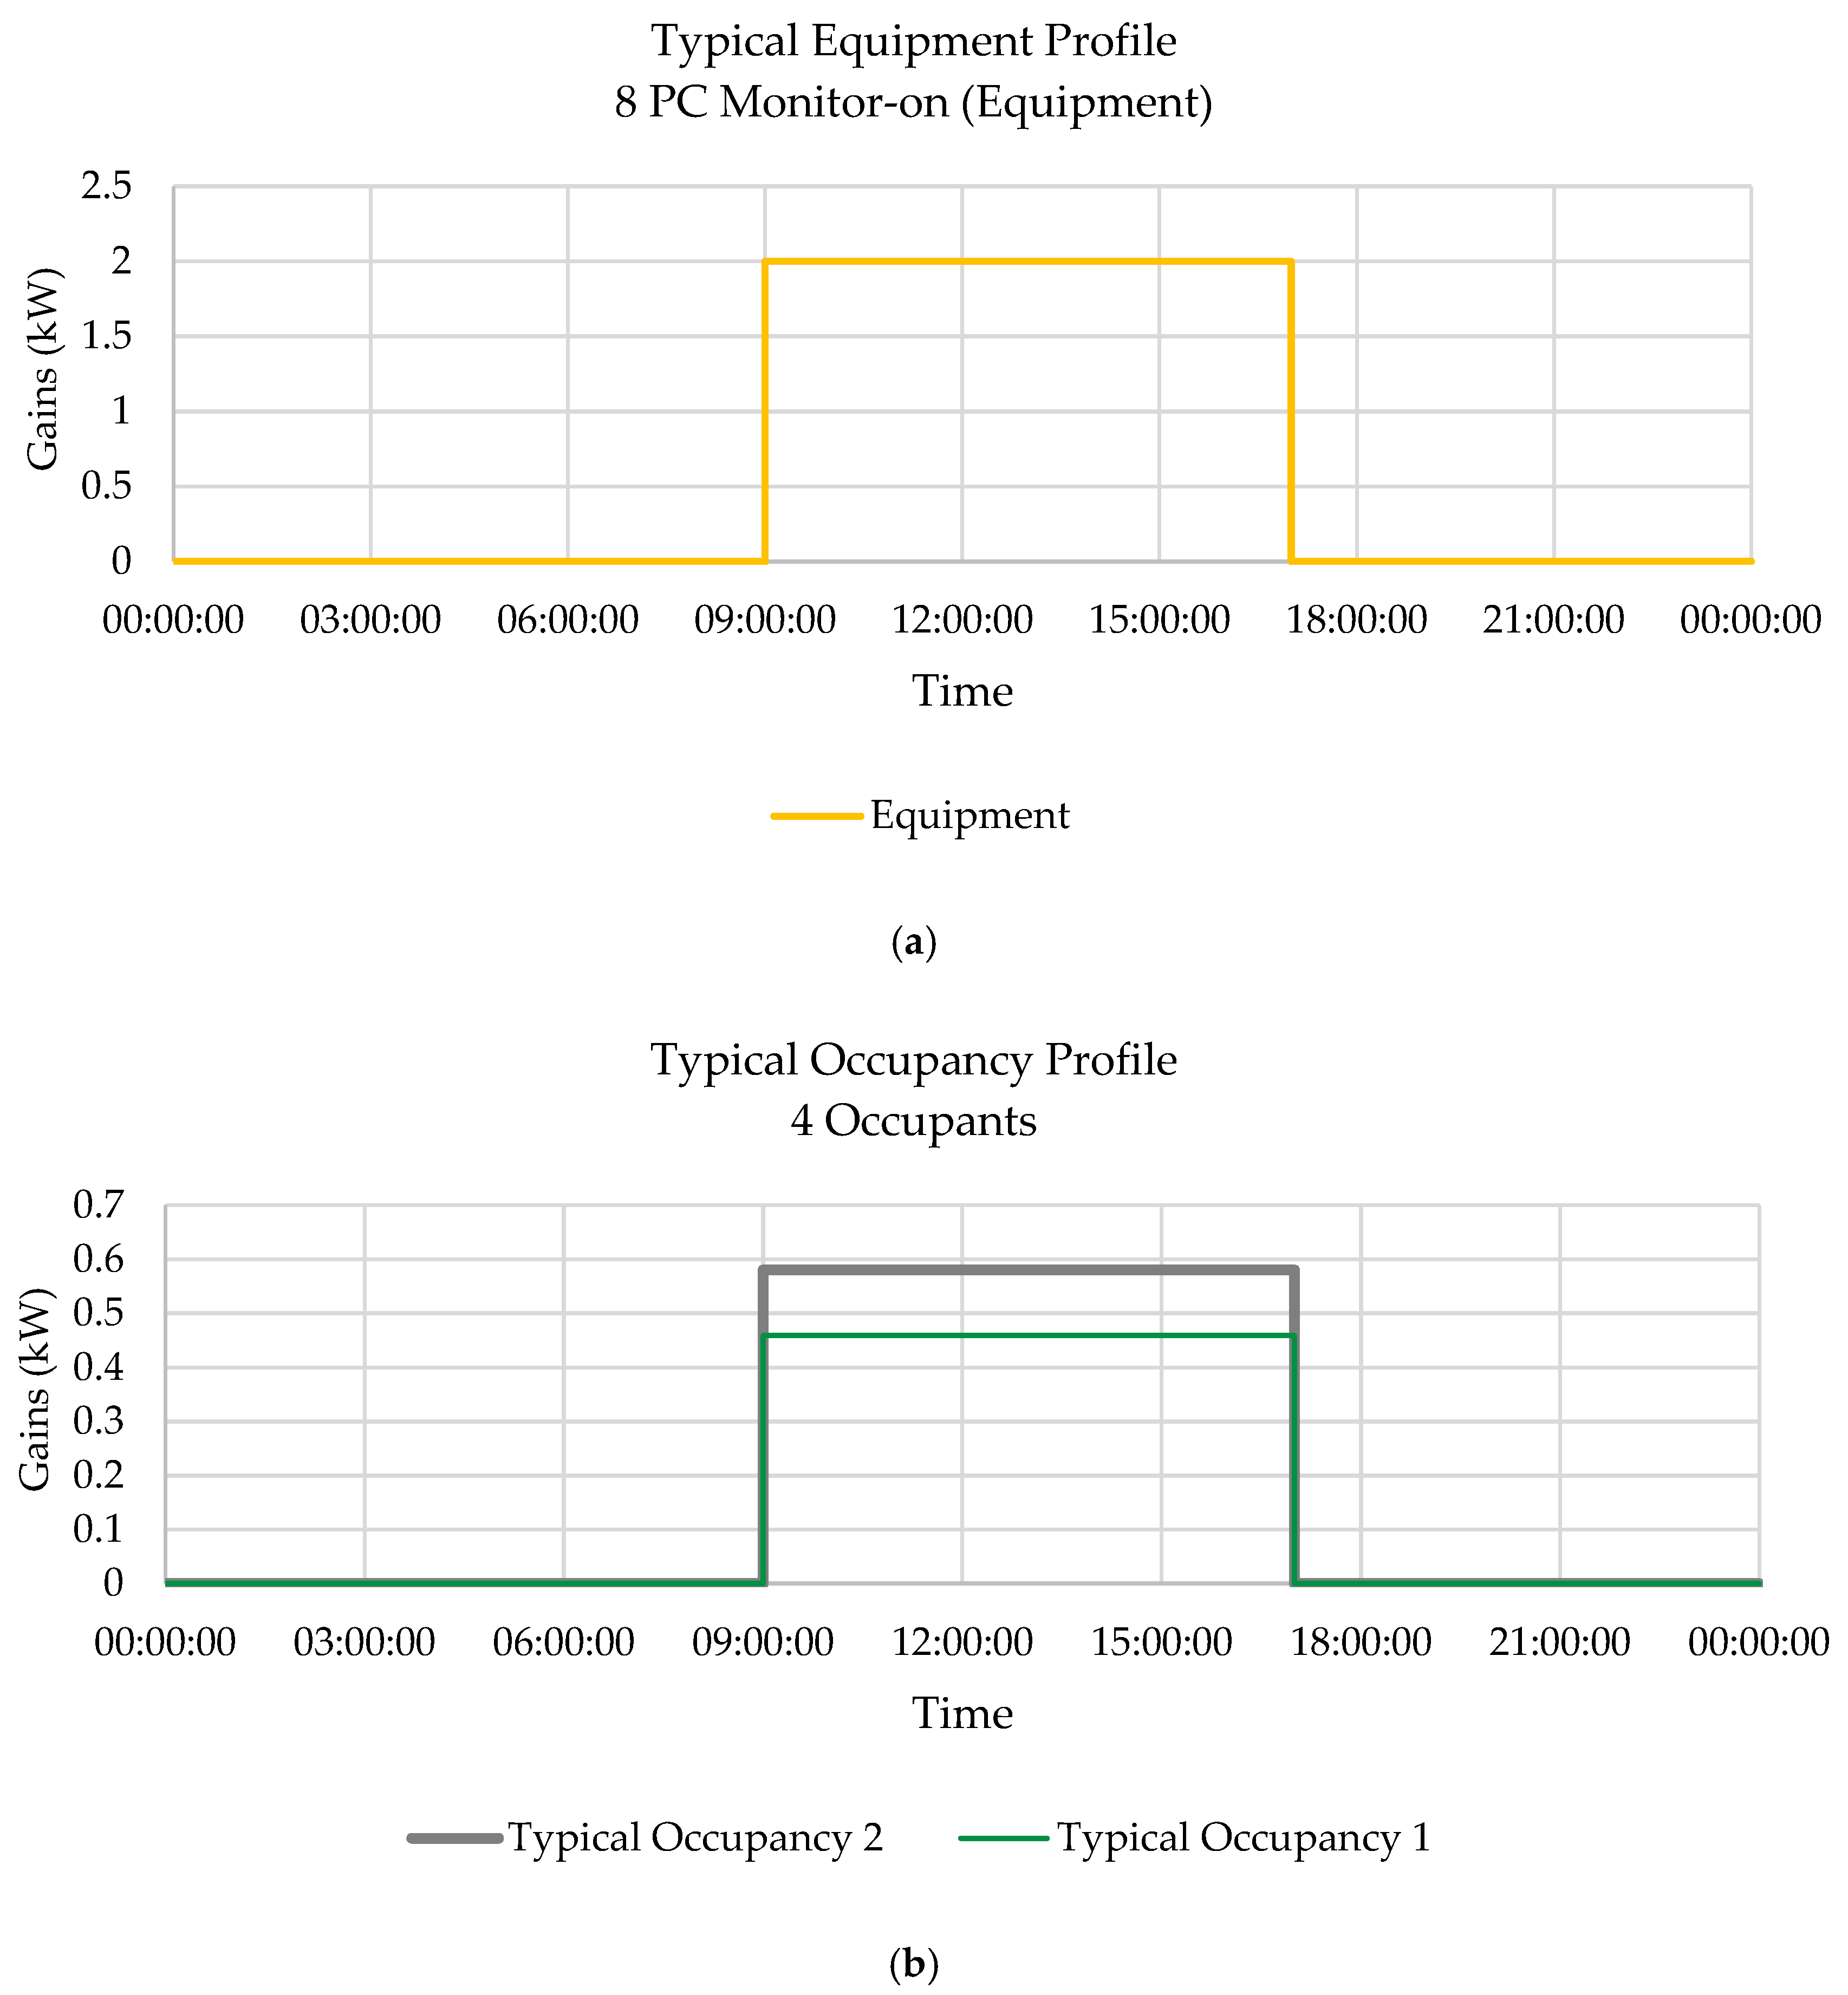
Conventionally, when modelling building internal heat gains or setting the HVAC operations, fixed or static profiles are typically used, as indicated in Figure 8. In this study, the equipment is set to be 8 PC monitors within the detection scene. Hence, the typical equipment profile given in Figure 8a indicates the operation of eight PC monitors during office hours which would provide a maximum heat gain of 2 kW. Typical Occupancy 1 represents the average heat gain emitted by four occupants from the assignment of a constant sitting activity. This gave a constant total heat gain of 0.46 kW (115 W for each occupant). Typical Occupancy Profile 2 represents the maximum levels of gains emitted by the occupant by assigning a constant activity of walking. This gave a constant total heat gain of 0.58 kW (145 W for each occupant). The use of this profile would enable the modelling of the situation when max conditions during office hours were assumed.

Test Scenarios

Experimental test scenarios were set up to investigate the impact of the application of the deep learning vision-based detection method on the building energy demand. Table 4 summaries the test scenarios set up for the corresponding building energy simulation cases. Each scenario was performed for one typical office day with the building assumed to be operated during the hours of 09:00–17:00; corresponding to the deep learning detection period. Each of the scenarios was simulated twice, to achieve results for a peak summer and winter day period. Effectively, each scenario consists of different variations in equipment and occupancy profiles to enable the evaluation of the impact of the use of control strategies, informed by real-time multiple detections on building energy demand.
Scenario 1 follows the conventional method using static or fixed control setpoints. Scenario 2 and 3 presents the use of a single deep learning model, either the equipment or the occupancy. Additionally, Scenario 4 presents the application of both deep learning methods, as indicated in Figure 1.
For the simulation cases, a maximum occupancy sensible and latent occupancy gains of 75 and 70 W were assigned. This enables the representation of all activities performed within the office space, with walking being the maximum at 100%, followed by standing at 79% sitting at 64%, and no activities would present 0%.
To ensure adequate thermal comfort conditions within the building, a constant HVAC set point temperature was assigned to the building space. The set temperature values were based on ASHRAE 90.1 [55] and ASHRAE 55 [56]. For occupied hours, it advised a temperature of 22–27 °C for cooling and 17–22 °C for heating. A room setpoint temperature of 22 °C was set during the typical occupied office hours of 09:00–17:00, and no heating was assigned to the building during the unoccupied hours. Furthermore, maximum ventilation rates were assumed during the occupied hours.

3. Results and Discussion

This section presents the model training results and the analysis of the experimental results. It consists of the evaluation of the application of the real-time detection approaches implemented in the selected office based on the detection performances; along with further analysis using the building energy performance results and scenario-based assessments.

3.1. Deep Learning Model Training and Evaluation

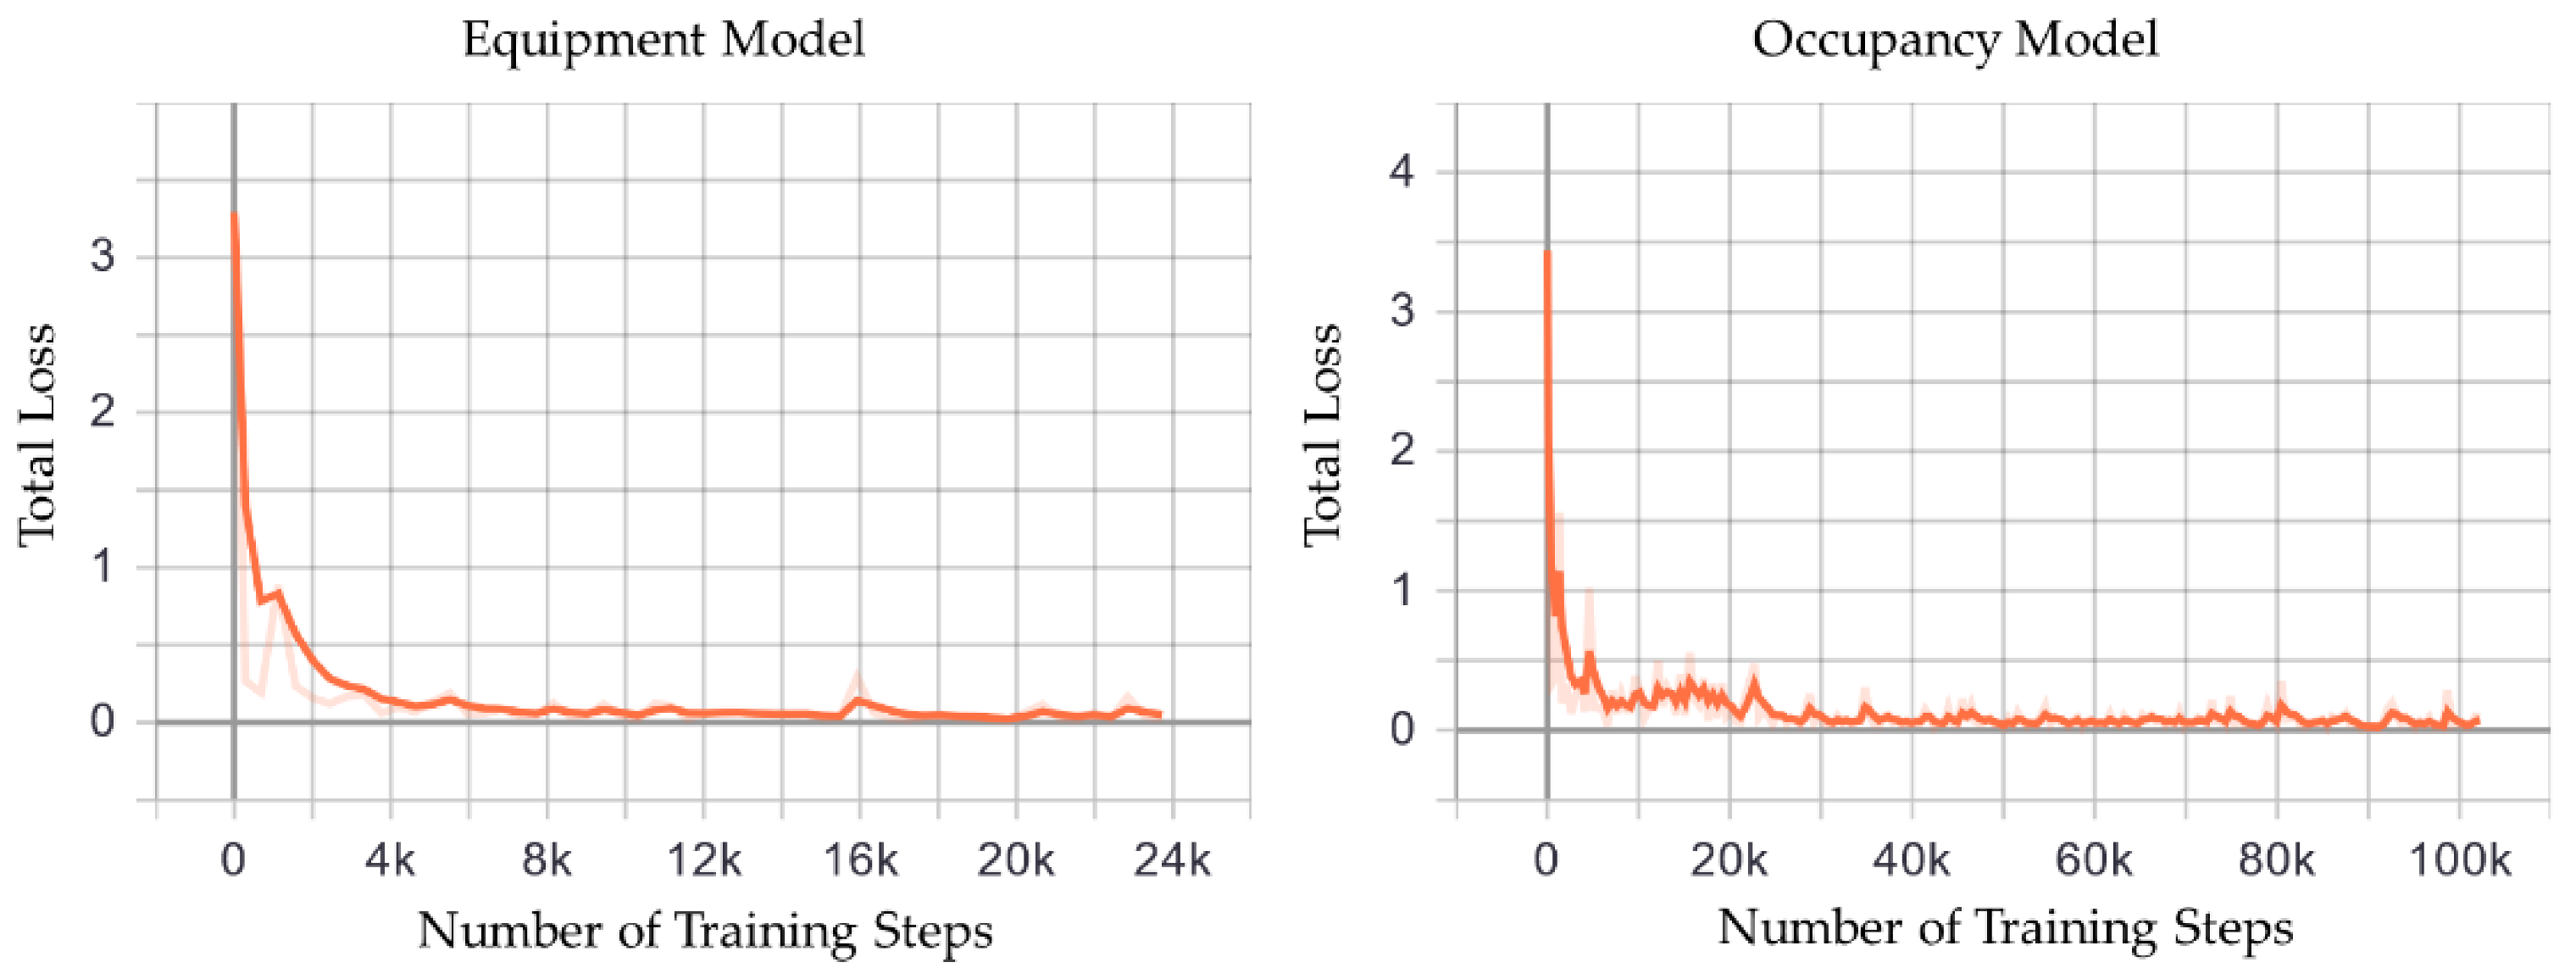
Both the equipment and occupancy activity detection models used the Faster RCNN with InceptionV2 model for training, and the following training results in Table 5 were achieved. The convergence of the loss function implies that the model has been adequately trained. The initial results presented here can be used as benchmark data for comparing the performance of future frameworks which would use more training and test data and different models [57].
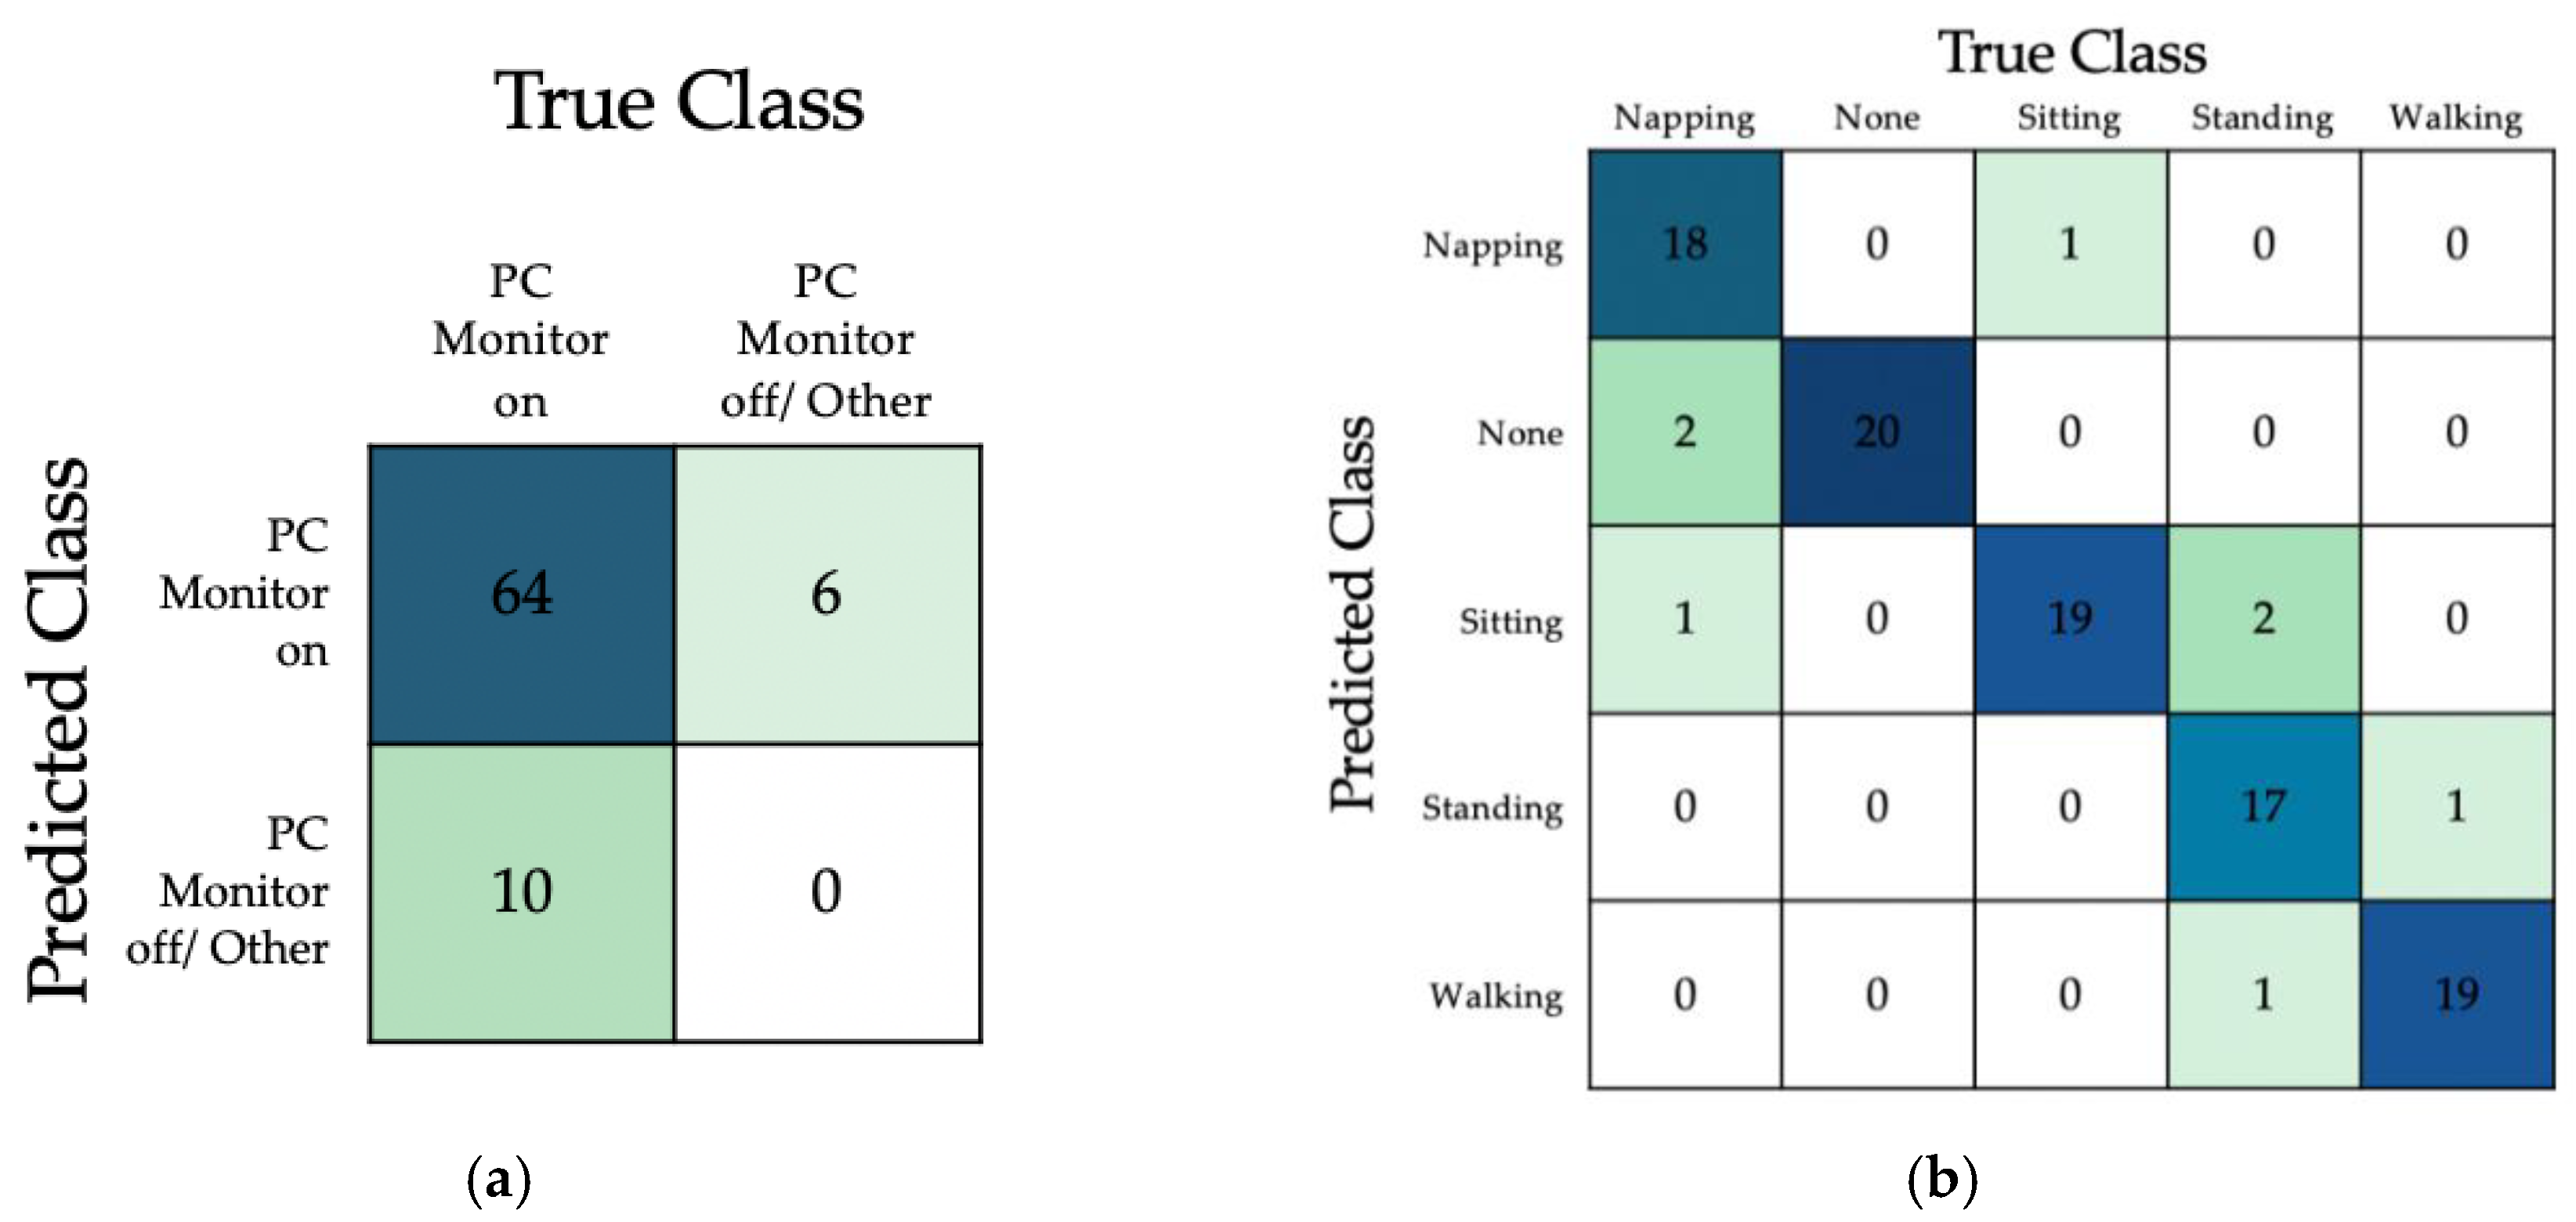
Based on the images assigned to the test dataset (Table 1 and Table 2), results in the form of a confusion matrix were established. Since one response (pc monitor -on) was selected for the equipment detection model, results for the 80 test images, all consisted of the present status of the pc monitors. Results suggested 64 of the images were correctly classified, with 10 images were not detected, but on the image, pc monitors were shown to be ON. Additionally, 6 predictions for the case of pc-monitors were not ON but was falsely predicted. This is presented in the confusion matrix given in Figure 9a,b presents the confusion matrix results for the occupancy activity model with the classification for all five responses. For both models, it shows that majority of the images to be correctly classified, giving further confidence on the two models to be suitable for both equipment and occupancy activity classification.
Furthermore, Table 6 and Table 7 present the model performance based on evaluation in terms of the different evaluation metrics. It suggested the equipment model achieved an accuracy of 80% with an F1 score of 0.8889. Furthermore, for the occupancy activity model performance, it indicated the classification for ‘none’ (when the occupant is absent) achieved the highest performance, and ‘standing’ achieved the lowest. This is perhaps due to the limitations in recognising occupancy body form and shape, as it may have been confused in identifying the sitting and walking activities. Nonetheless, average accuracy of 97.09% was achieved and an F1 Score of 0.9270.
Since this model performance evaluation is based on using still test images assigned in the given testing dataset, therefore, the following experimental detection and recognition results can provide more valuable analysis so the detection evaluation is based on a more realistic conditions, including the background conditions, environment setting and realistic occupants behaviour and actions towards their movement and equipment usage.

3.2. Detection Performance and Profiles

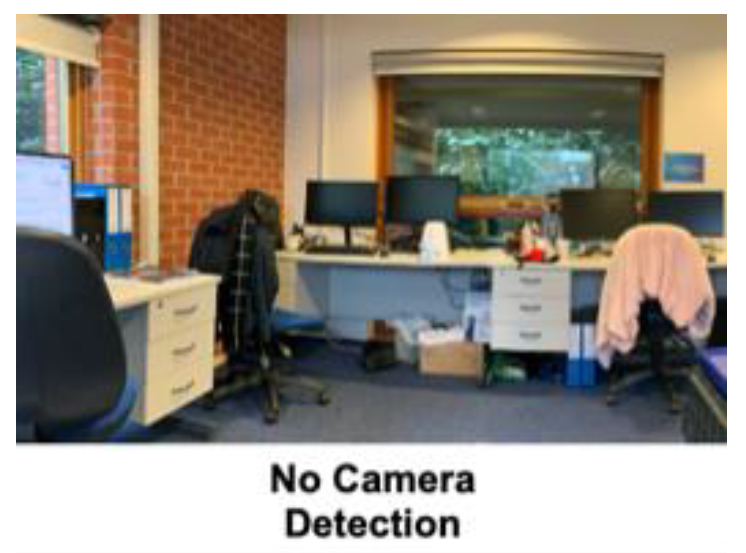
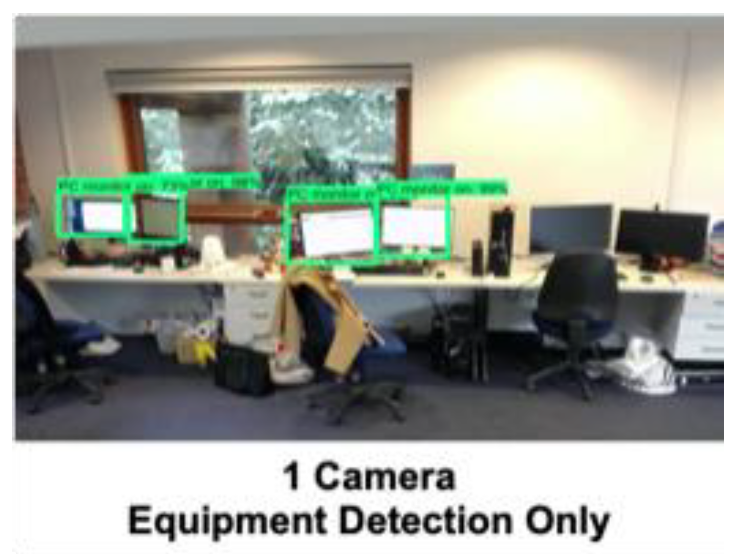
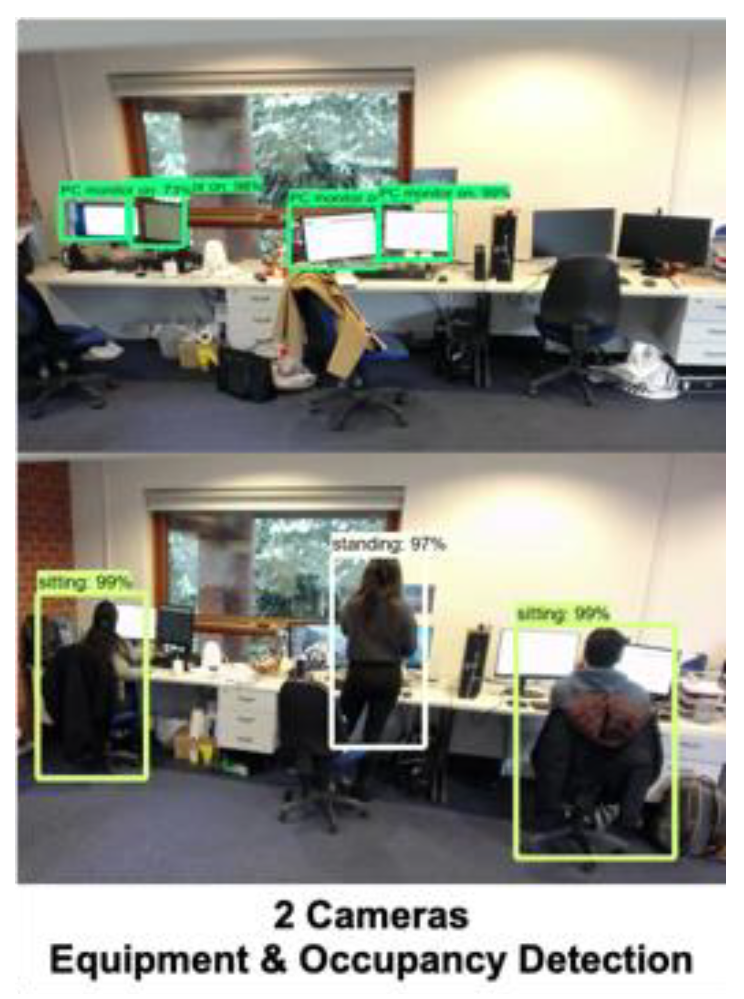
The following section presents the results achieved from the initial experimental detection using the proposed vision-based deep learning method. Figure 10 presents an example of the equipment and occupancy detection performed within the selected case study office space. Based on the set up indicated in Figure 5 and with the process given in Figure 6, it shows the ability to detect and recognise the equipment and occupants in the space. For both cases, output detection bounding boxes were present during the detection, and the accuracy for each detection was also presented above. It should be noted that in practice, these images will not be saved within the system but real-time data at intervals would be logged in the form of count profiles which can then be used to estimate and generate the heat emission DLIPs.

3.2.1. Detection Performance

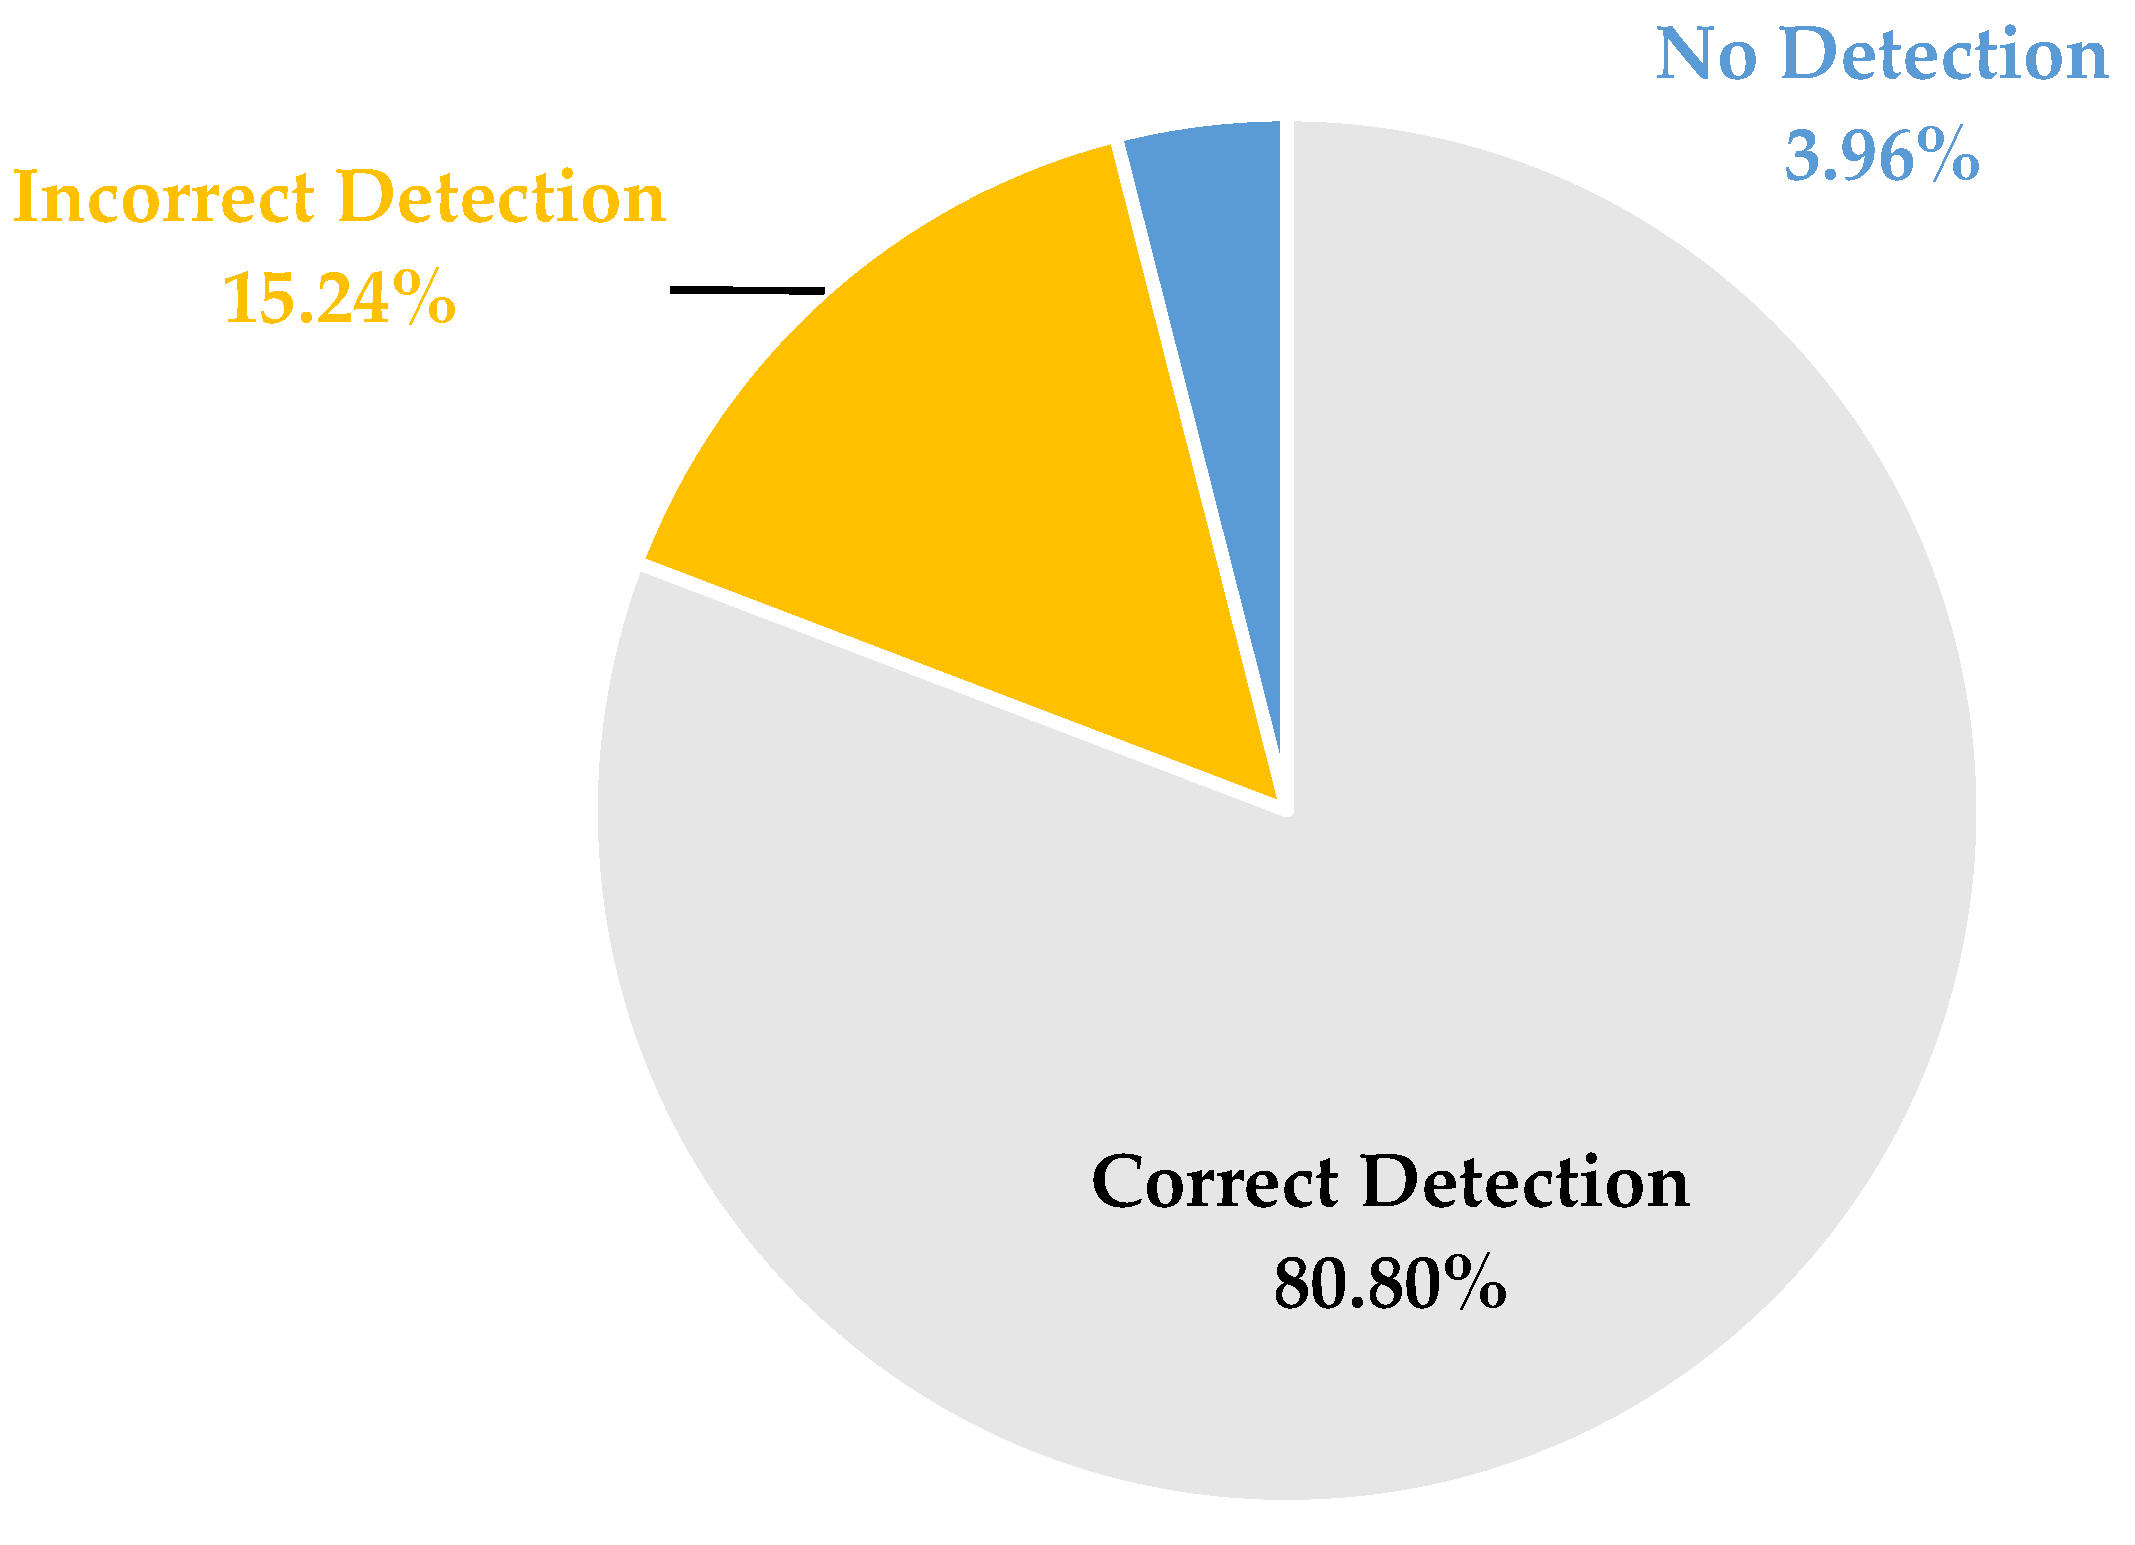
The detection performances are evaluated based on the application of the proposed approach in the selected case study building office space. The developed approach was implemented in the selected open plan office while the occupants were doing their daily work as usual. If the computers are in use, then the model will respond as ‘pc monitor on’. The overall equipment detection performance is shown in Figure 11. It shows that 80.80% correct detection could be achieved by this approach during the initial experimental test. While the errors including incorrect detection and no detection were 15.24% and 3.94% of the detection period, overall, the proposed model can perform the equipment detection task with good accuracy within the case study office building. Further improvements should be carried out by using different algorithms and more testing data.
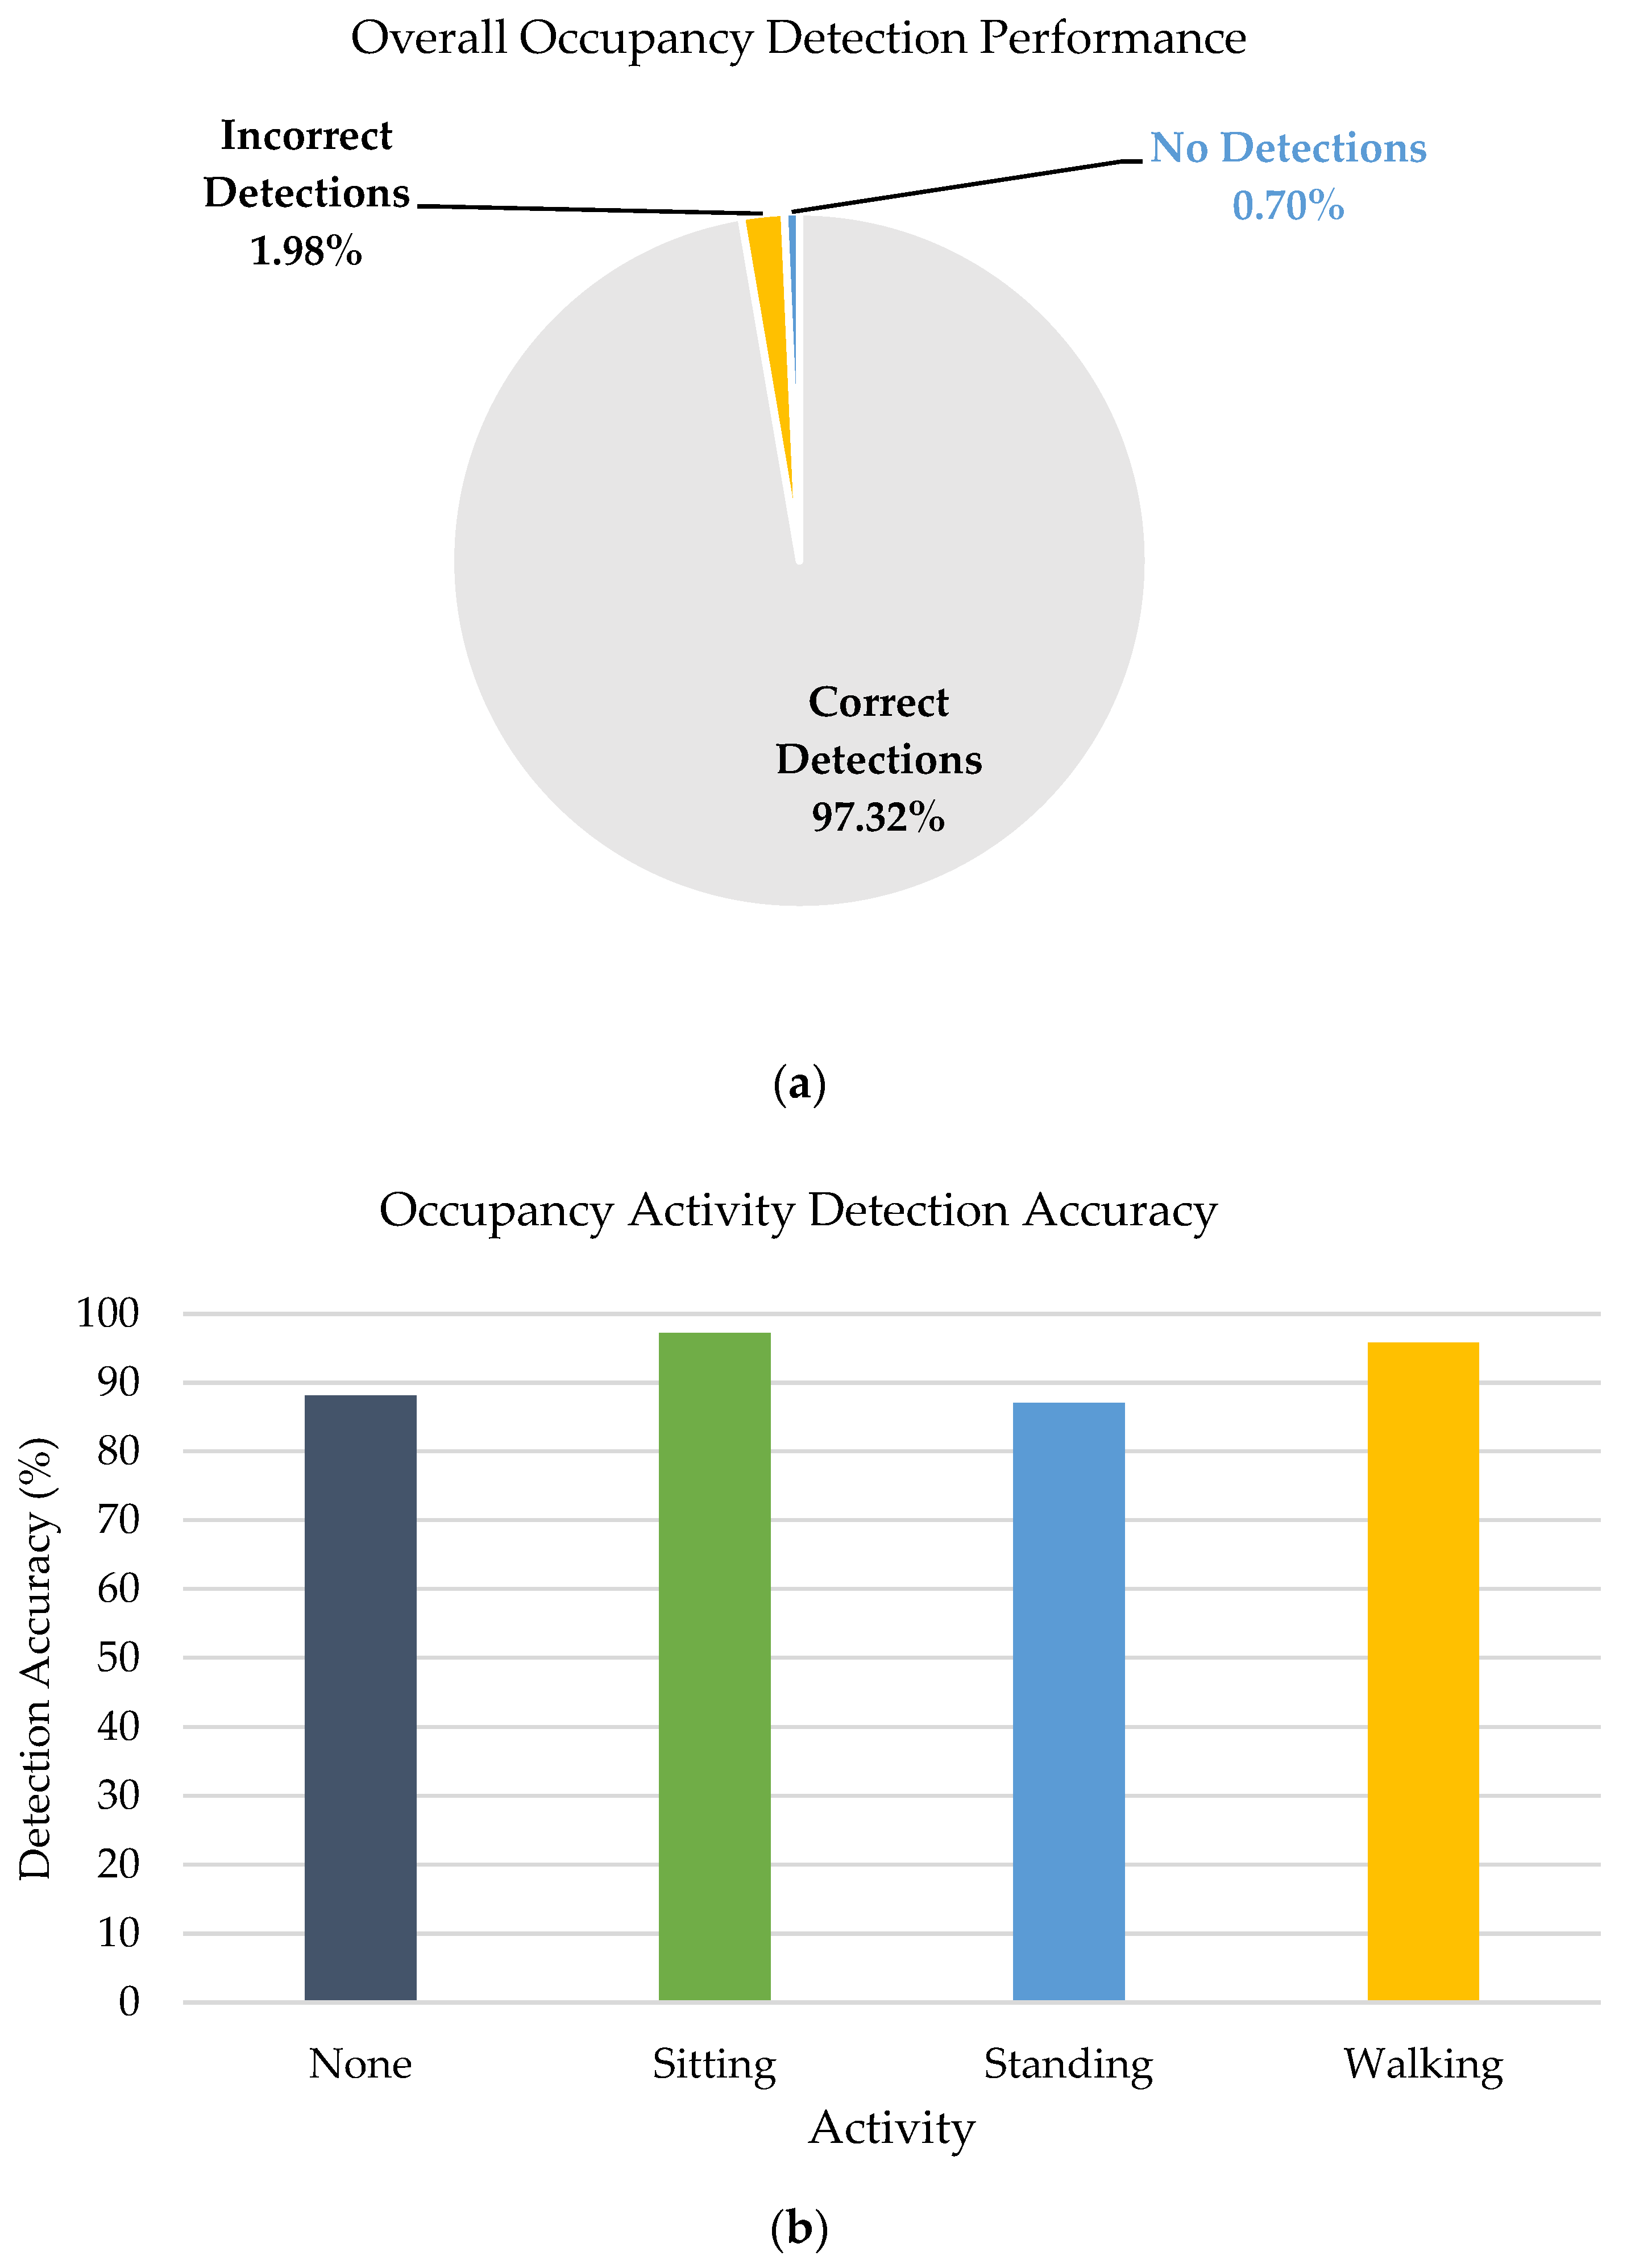
During the experimental test of the occupancy activity detection approach, occupants were asked to carry out their typical office tasks, where a range of activities were performed by the occupants. This included walking, standing, sitting and none for when no occupants are present. Figure 12a presents the overall detection performance results. It provided correct detections 97.32% of the time, incorrect detections 1.98% of the time and no detections 0.70% of the time. Overall, this indicates that the selected model provides accurate detections of various activities within the desired office space. Figure 12b presents results in terms of the selected detection response categories of occupancy activities. Individual detection accuracies for each activity includes walking with 95.83%, standing 87.02%, sitting 97.22% and none achieved an accuracy of 88.13%. This shows the capabilities of the deep learning model to recognise the differences between the corresponding human poses for each specific activity.
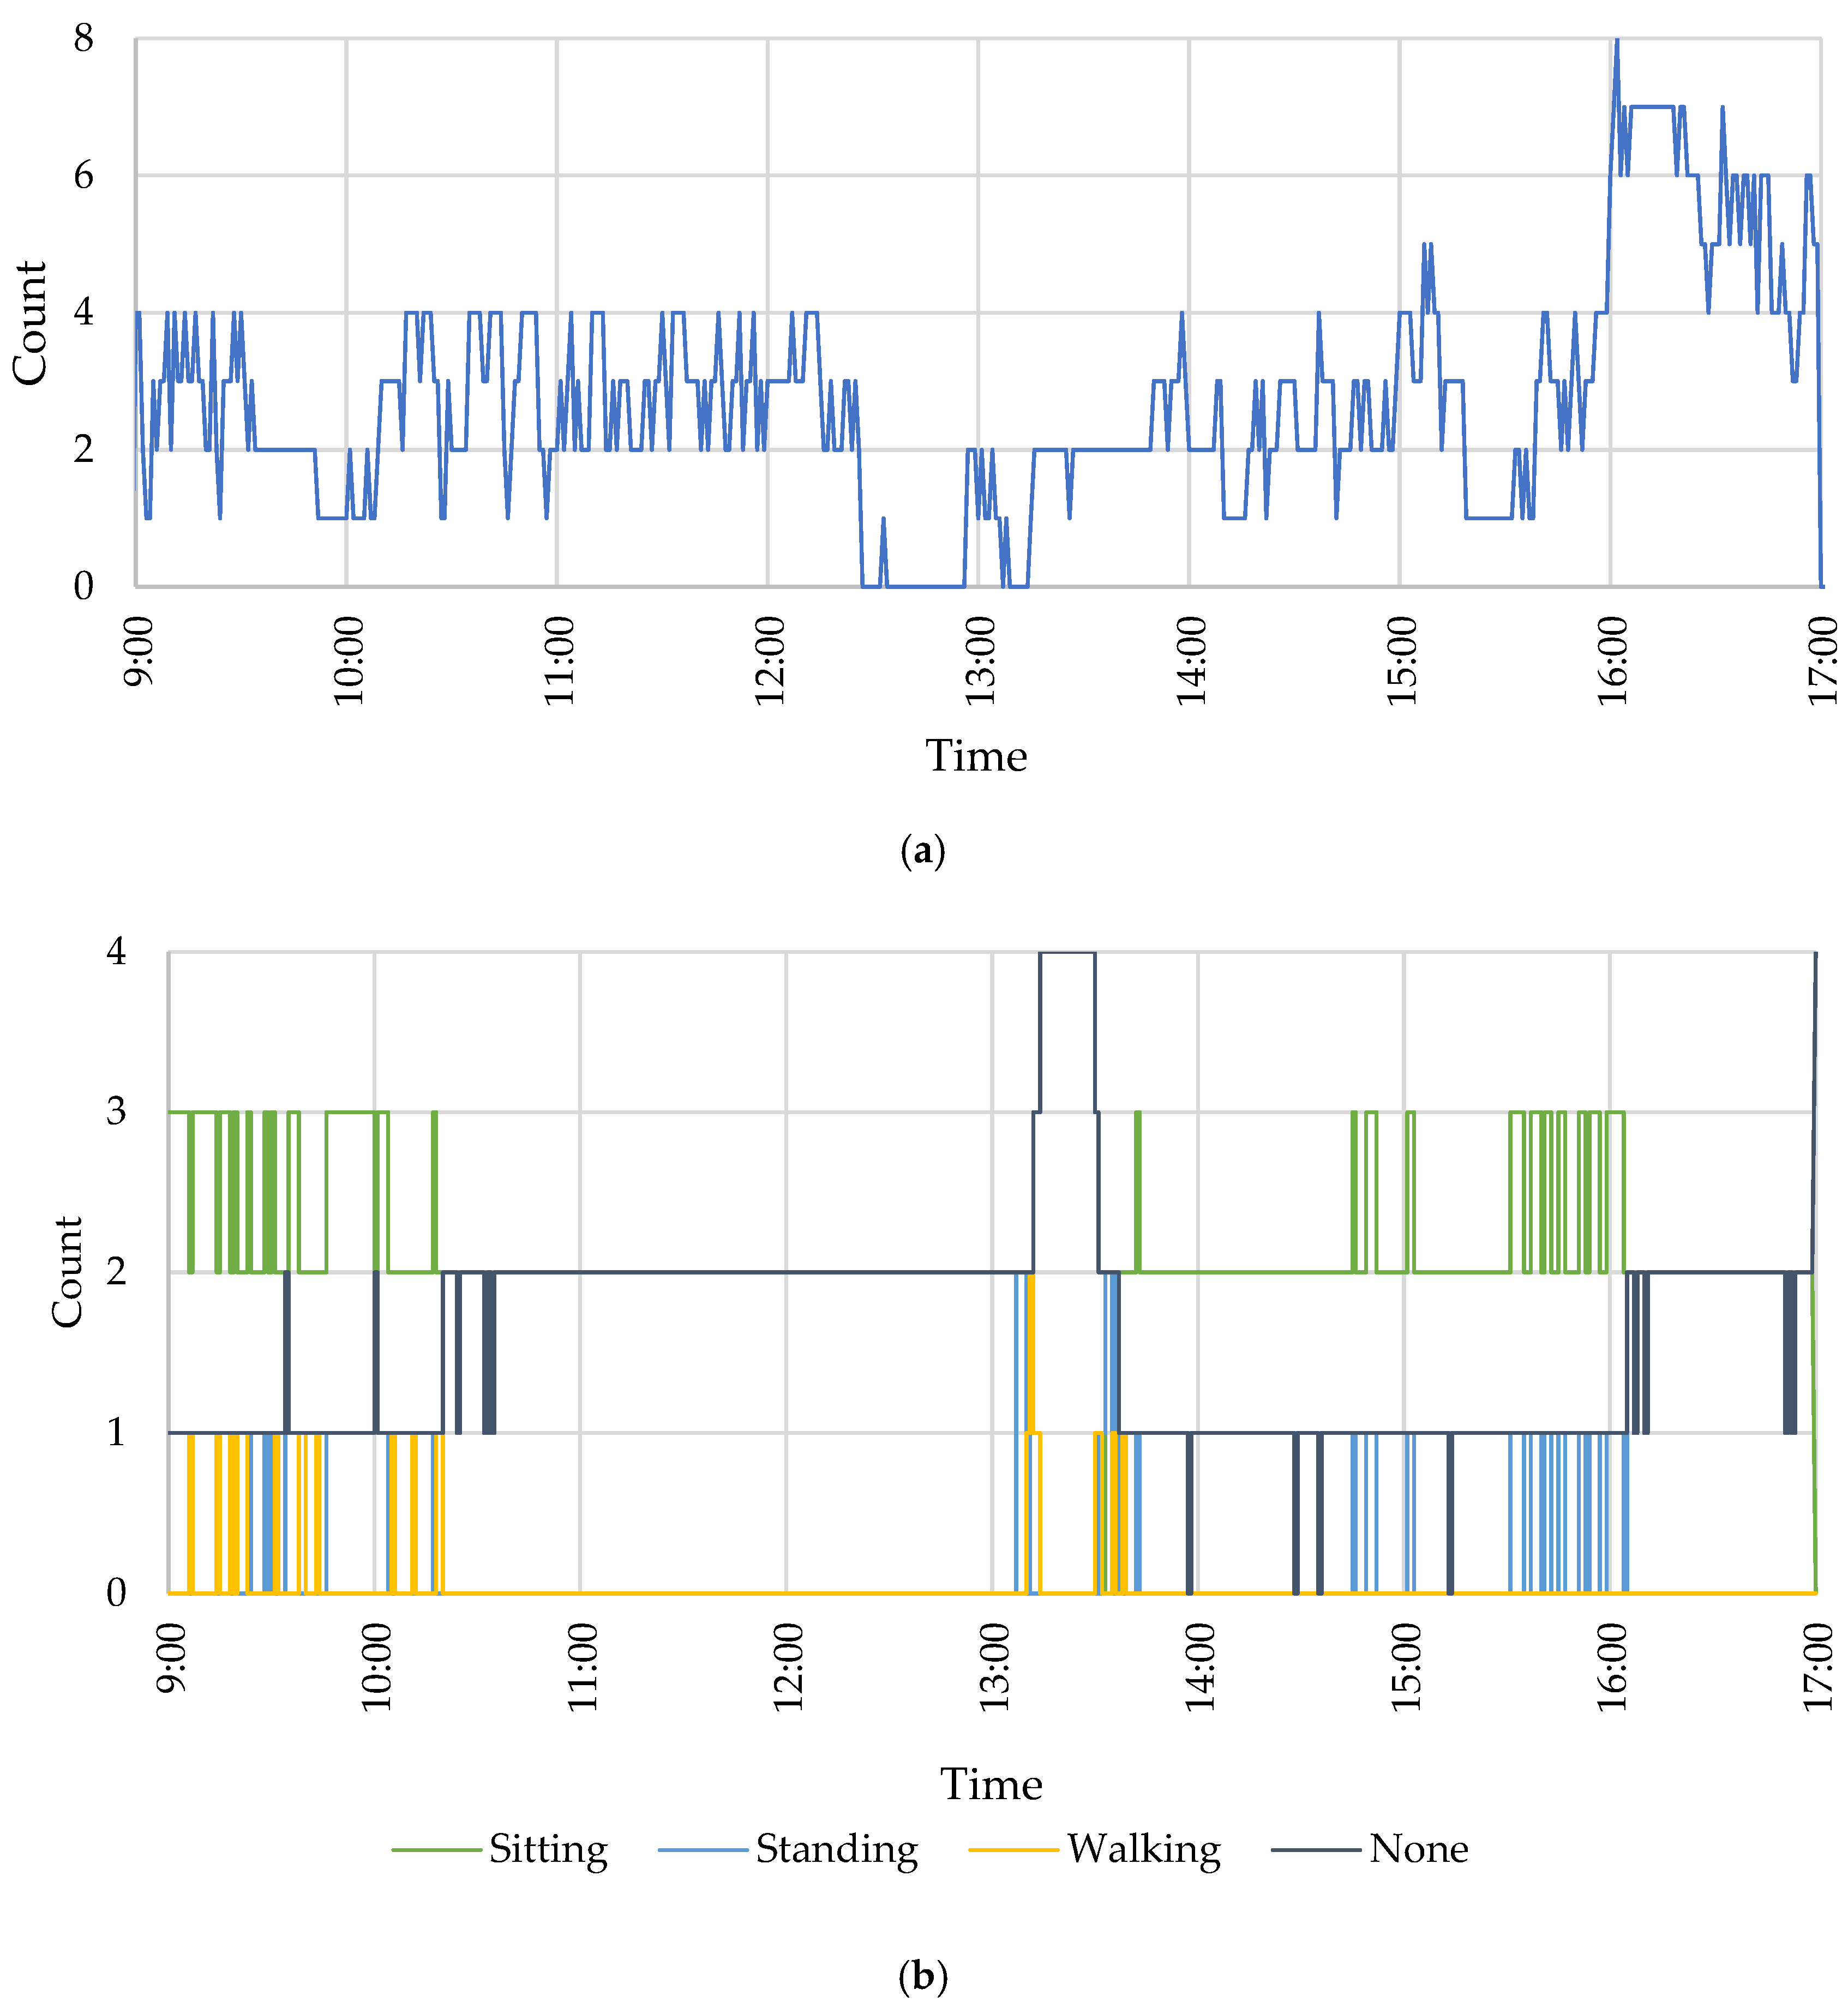
Following the approach given in Figure 1, the performance of the real-time experimental detection and recognition of both equipment and occupants within the selected office space provided time-stamped data of the selected output responses of the occupancy activity and/or pc-monitor being turned on, along with the corresponding detection accuracy. The generated data were used to form the following count-based deep learning influenced profiles (DLIP) given in Figure 13, where the formation process is shown in Figure 6.
The formed occupancy and equipment-count-based DLIP provides informative data showing the number of detected occupants performing each of the activities and the number of equipment in use across the whole detection period. This contributes towards a better understanding of the occupants and the equipment usage within the office space in comparison to conventional sensors used within buildings. Furthermore, to enable the data to assist building system controls and building energy performance simulations, both the profiles for equipment and occupancy were converted to heat emissions-based DLIP. This is further discussed in Section 3.2.2. This will allow the evaluation of the impact of the application of such deep learning detection approach.

3.2.2. Comparison between the Static and DLIP Profile

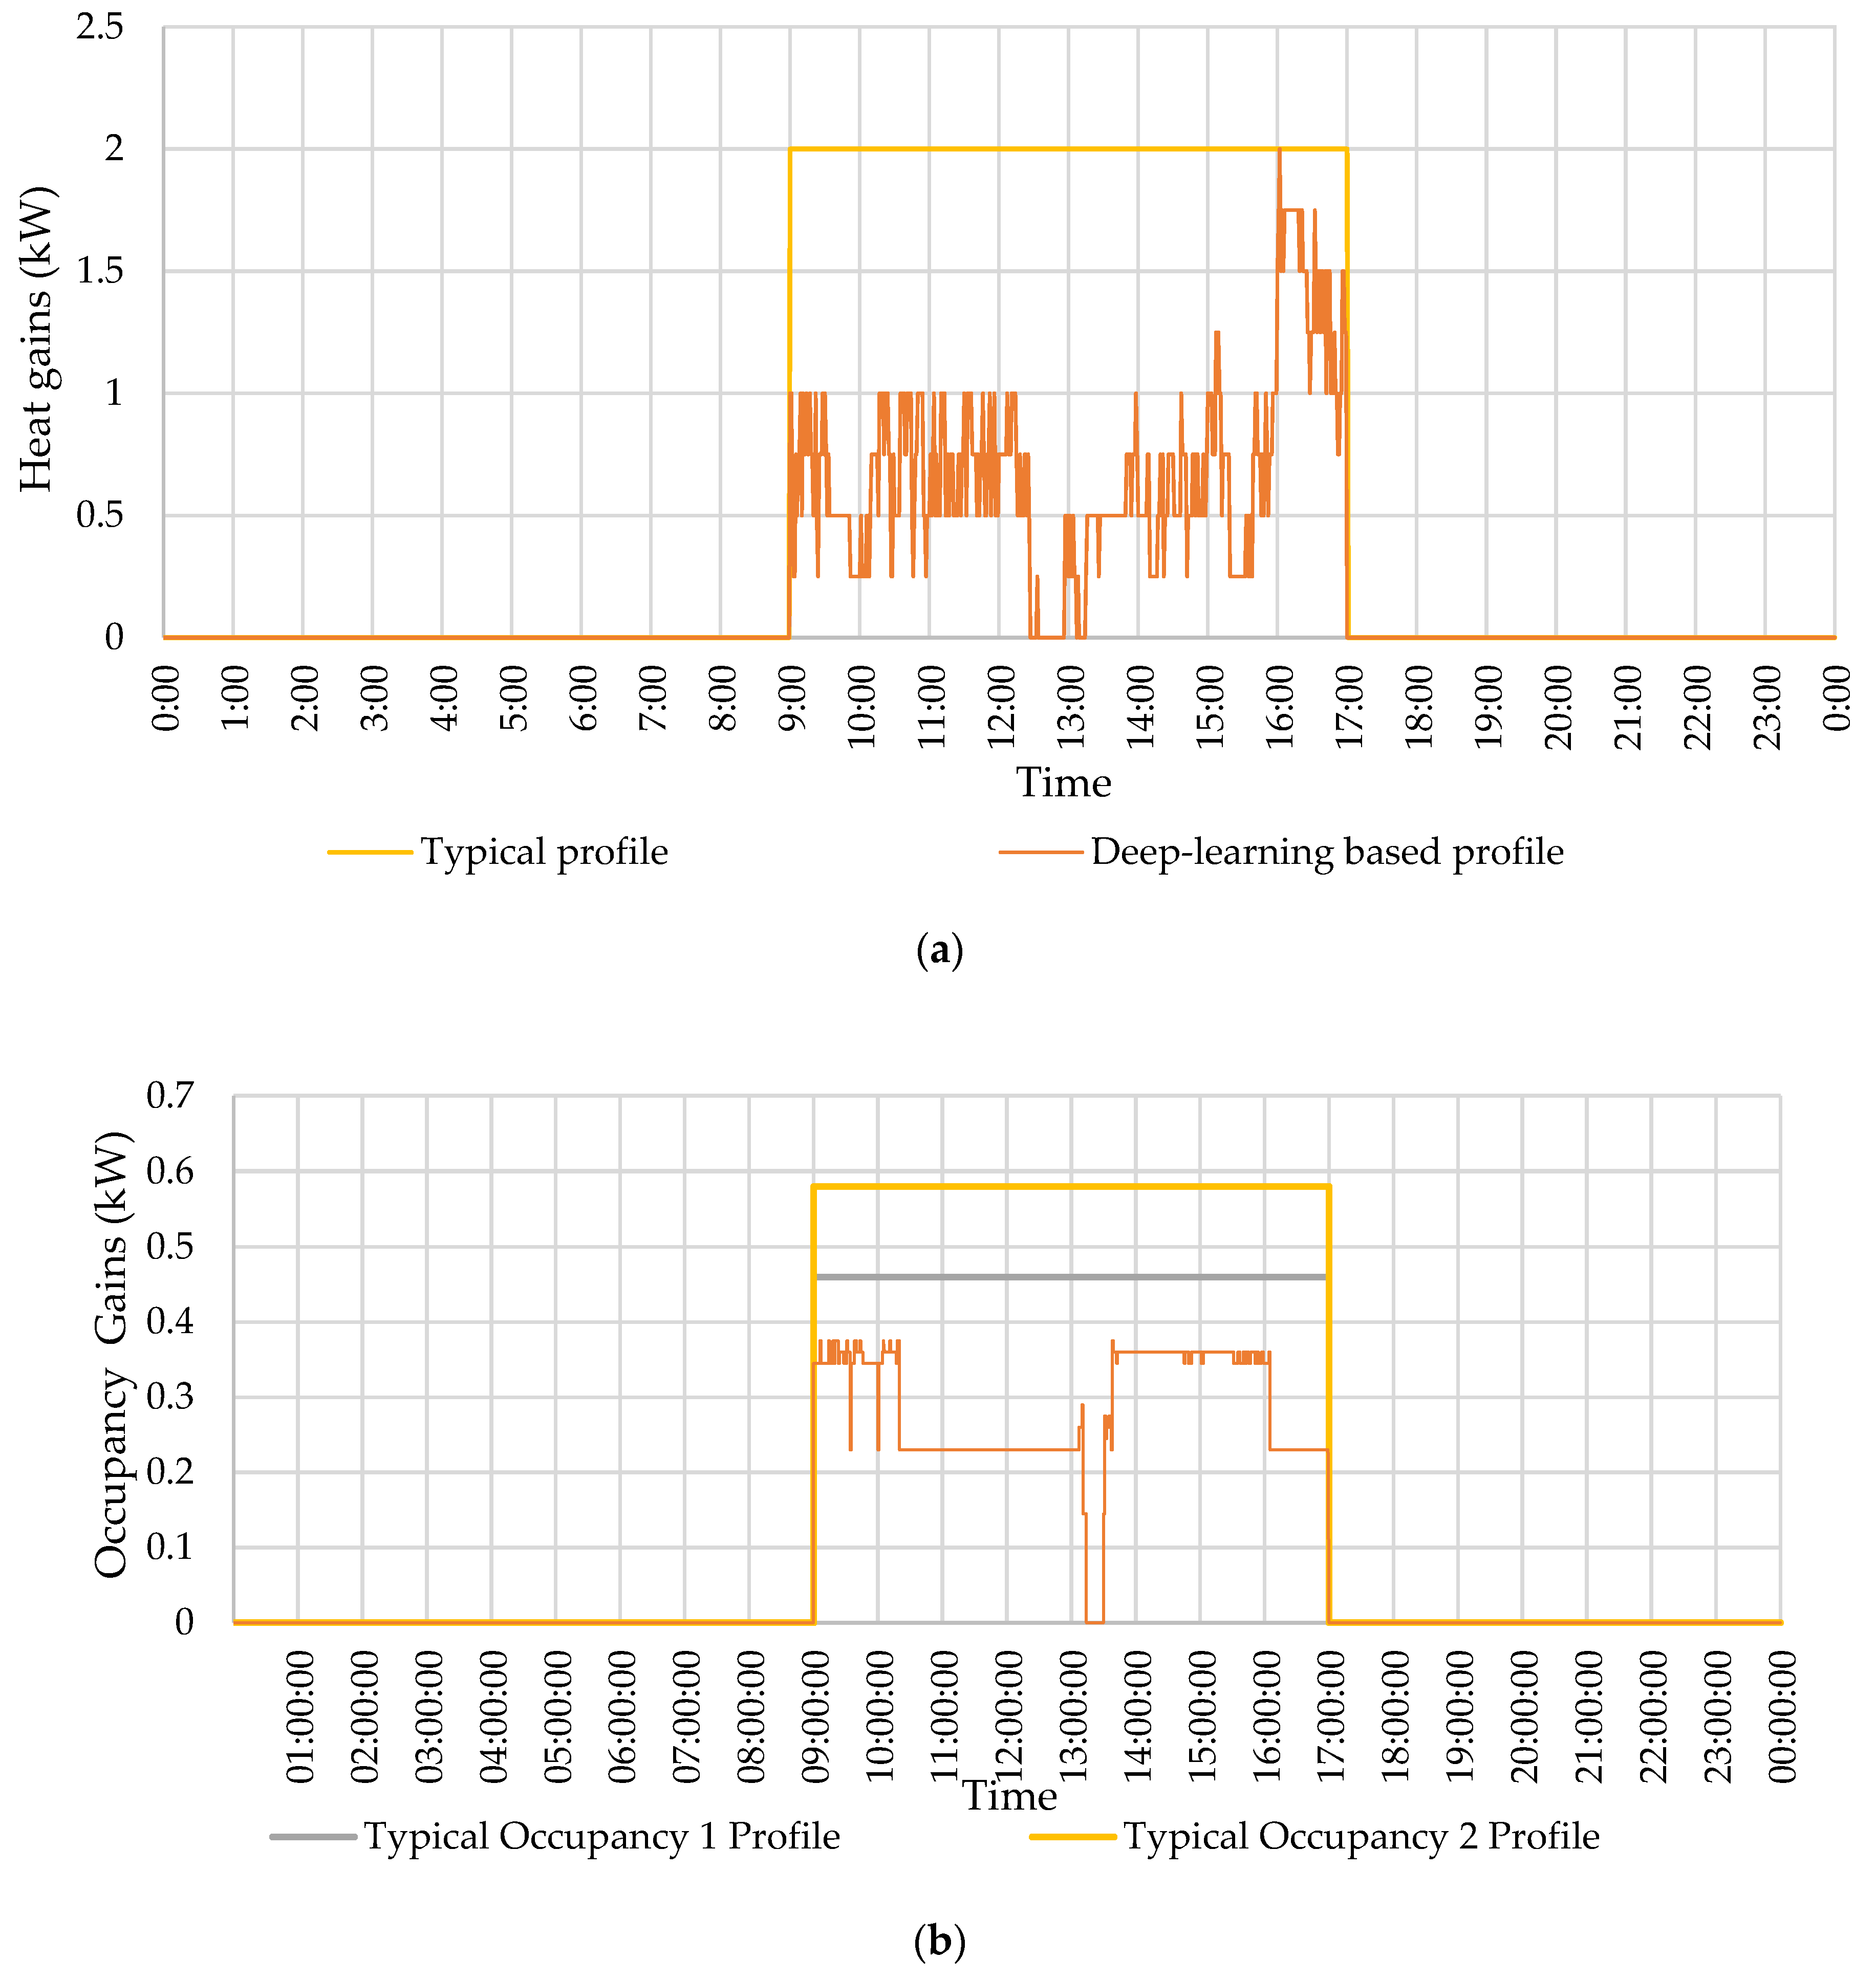
Using the data presented in Figure 13, along with the typical values of heat gain of computers and occupants performing different activities (Table 3), the following heat-emissions-based DLIP were formed. The typical equipment profile and equipment heat-emissions-based DLIP are plotted in Figure 14a. Figure 14b presents the occupancy heat-emissions-based DLIP plotted against the two Typical Occupancy profiles. The initial results showed that the proposed approach could enable the detection of the usage of equipment and various activities and identification of the times when the equipment usage or occupancy activities increased and decreased, which influence the internal heat gains. Based on the detection period, up to 65.75% difference between the typical equipment heat emission profile and the actual equipment heat emission profile was observed. While up to 37.51% and 50.44% difference was observed between the Typical Office Profiles 1 and 2 and actual occupancy heat emission profile. Hence, there was a high discrepancy between the true equipment usage and occupancy activities performed within the building spaces, and the use of static profiles. Therefore, this shows the potential of the vision-based deep learning approach for both equipment and activity recognition for providing a better understanding of the conditions within an indoor space for more effective system controls and operations.

3.3. Building Energy Performance Analysis

The following section provides an analysis of the potential impact of the proposed deep learning detection approach on building energy performance. The analysis was based on the comparison of the different Scenarios 1–4 (as described in Table 4).

3.3.1. Internal Heat Gains

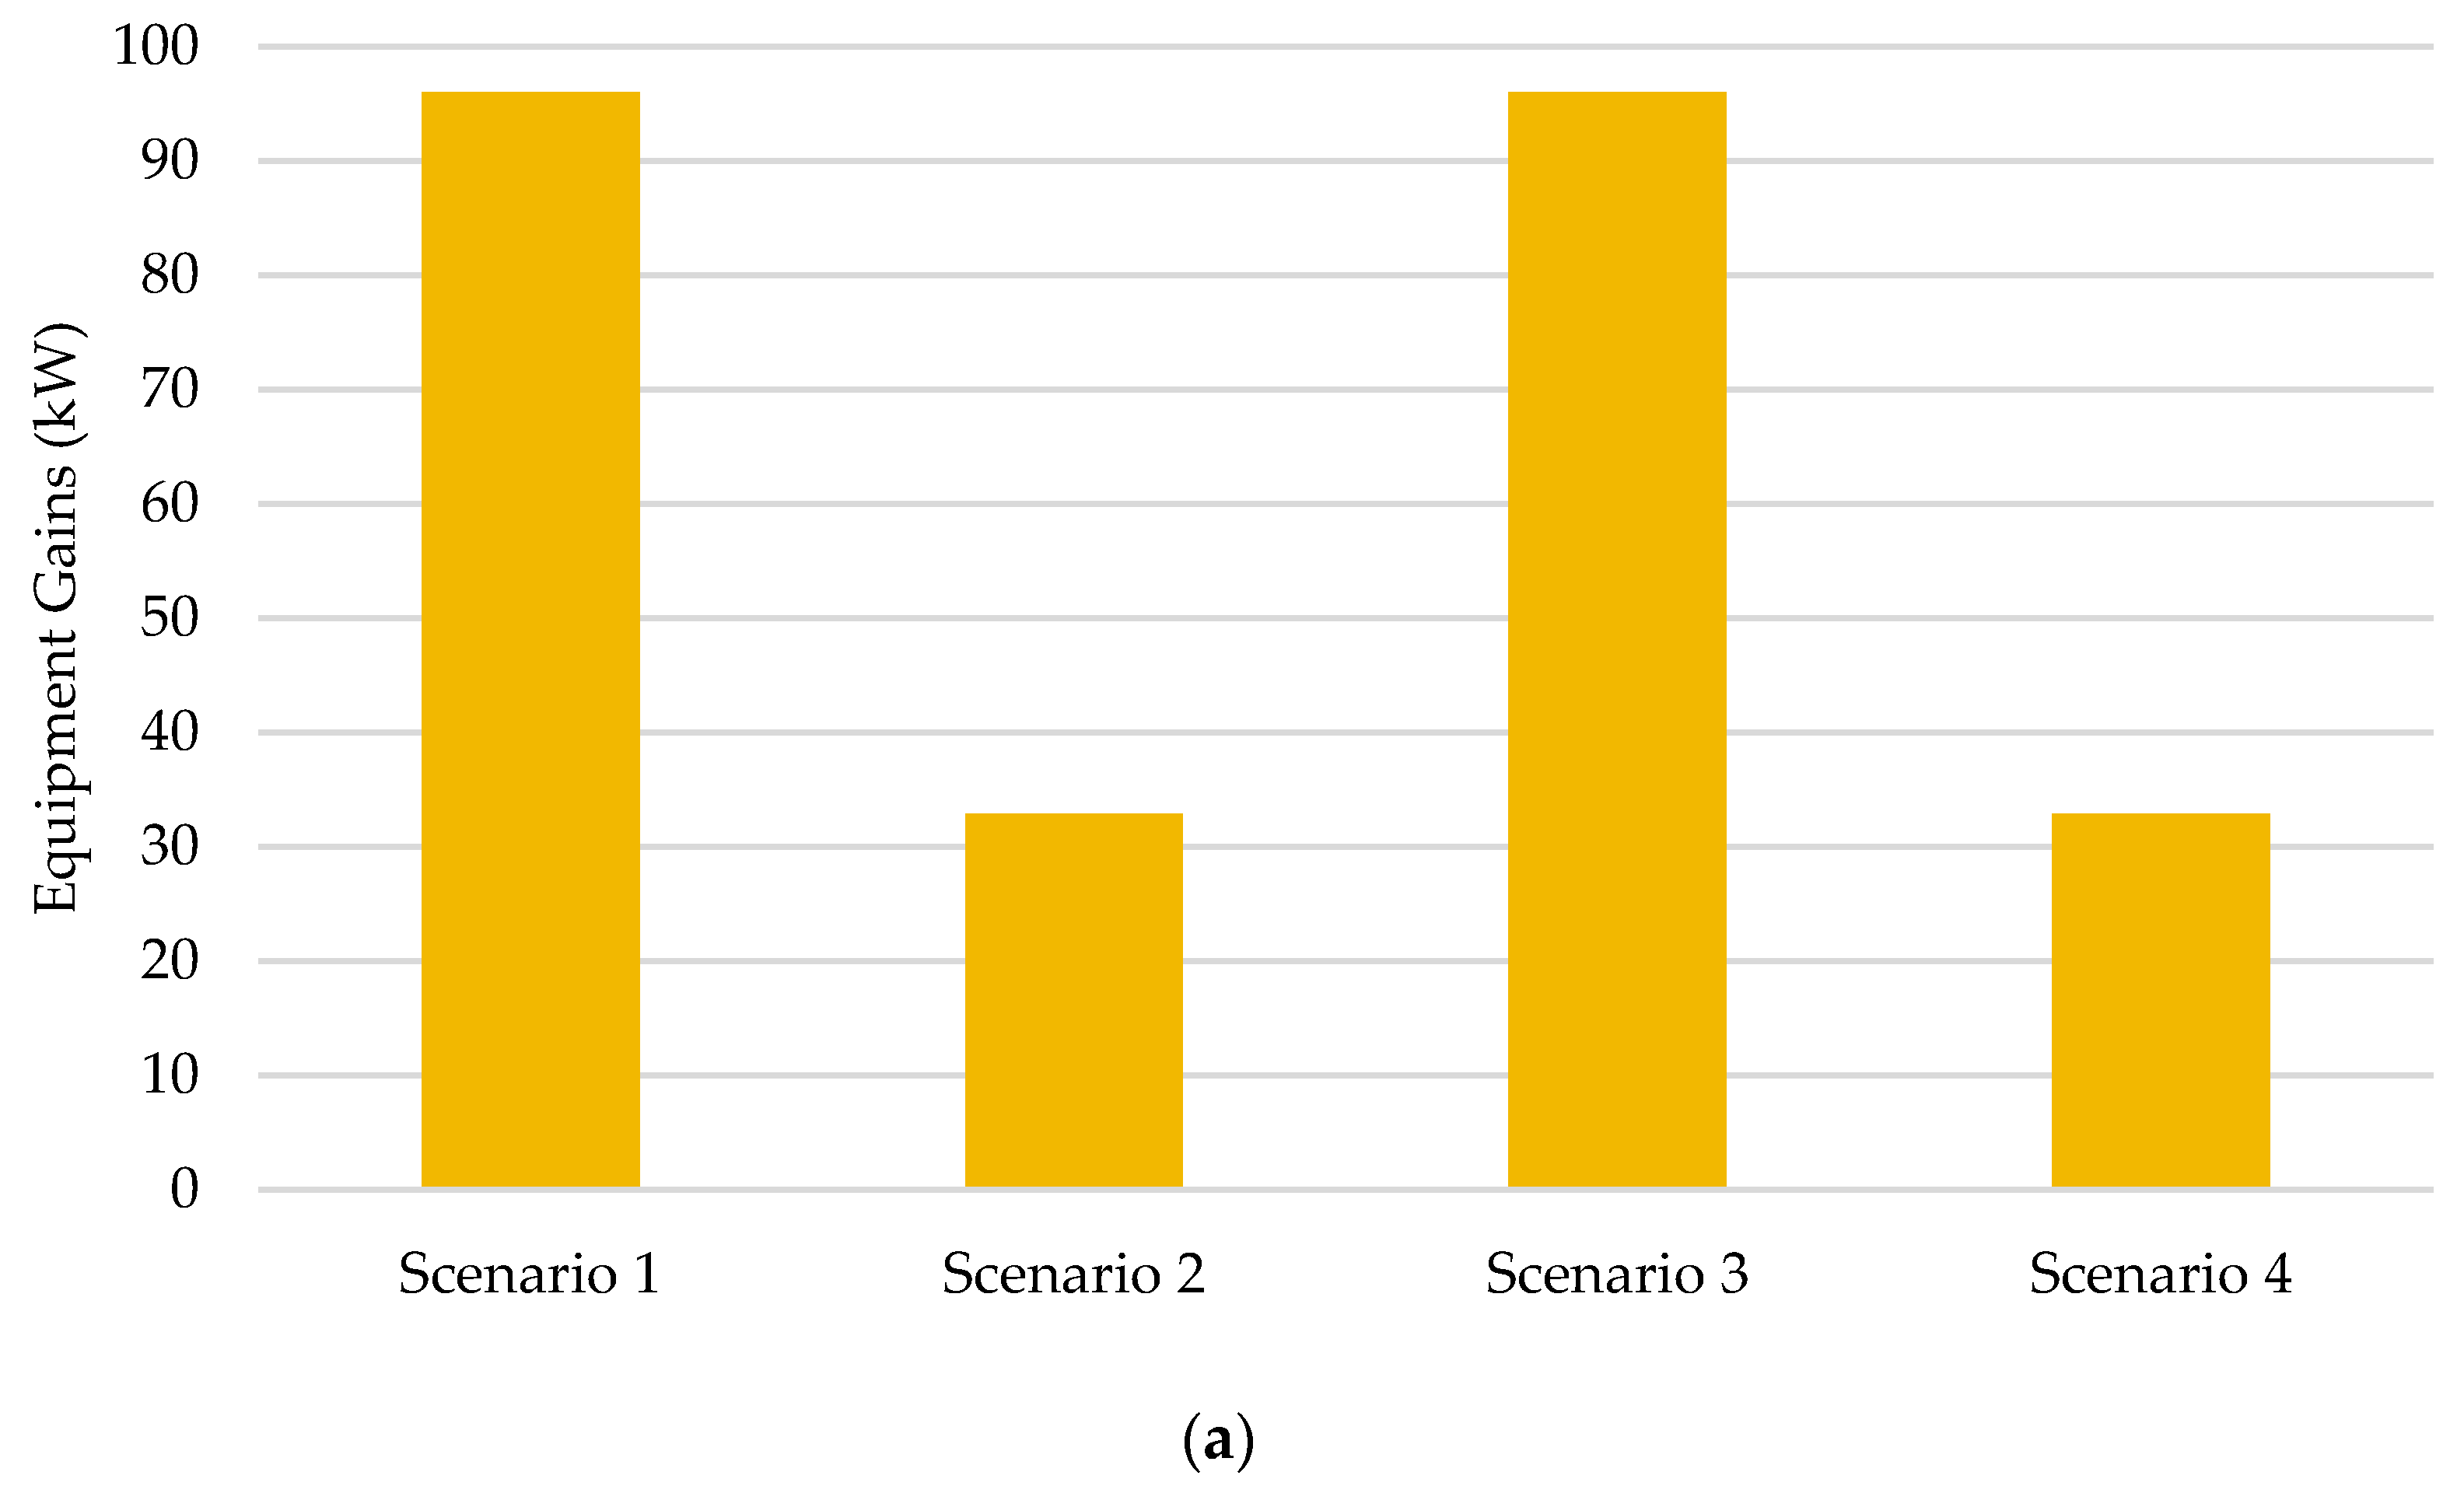
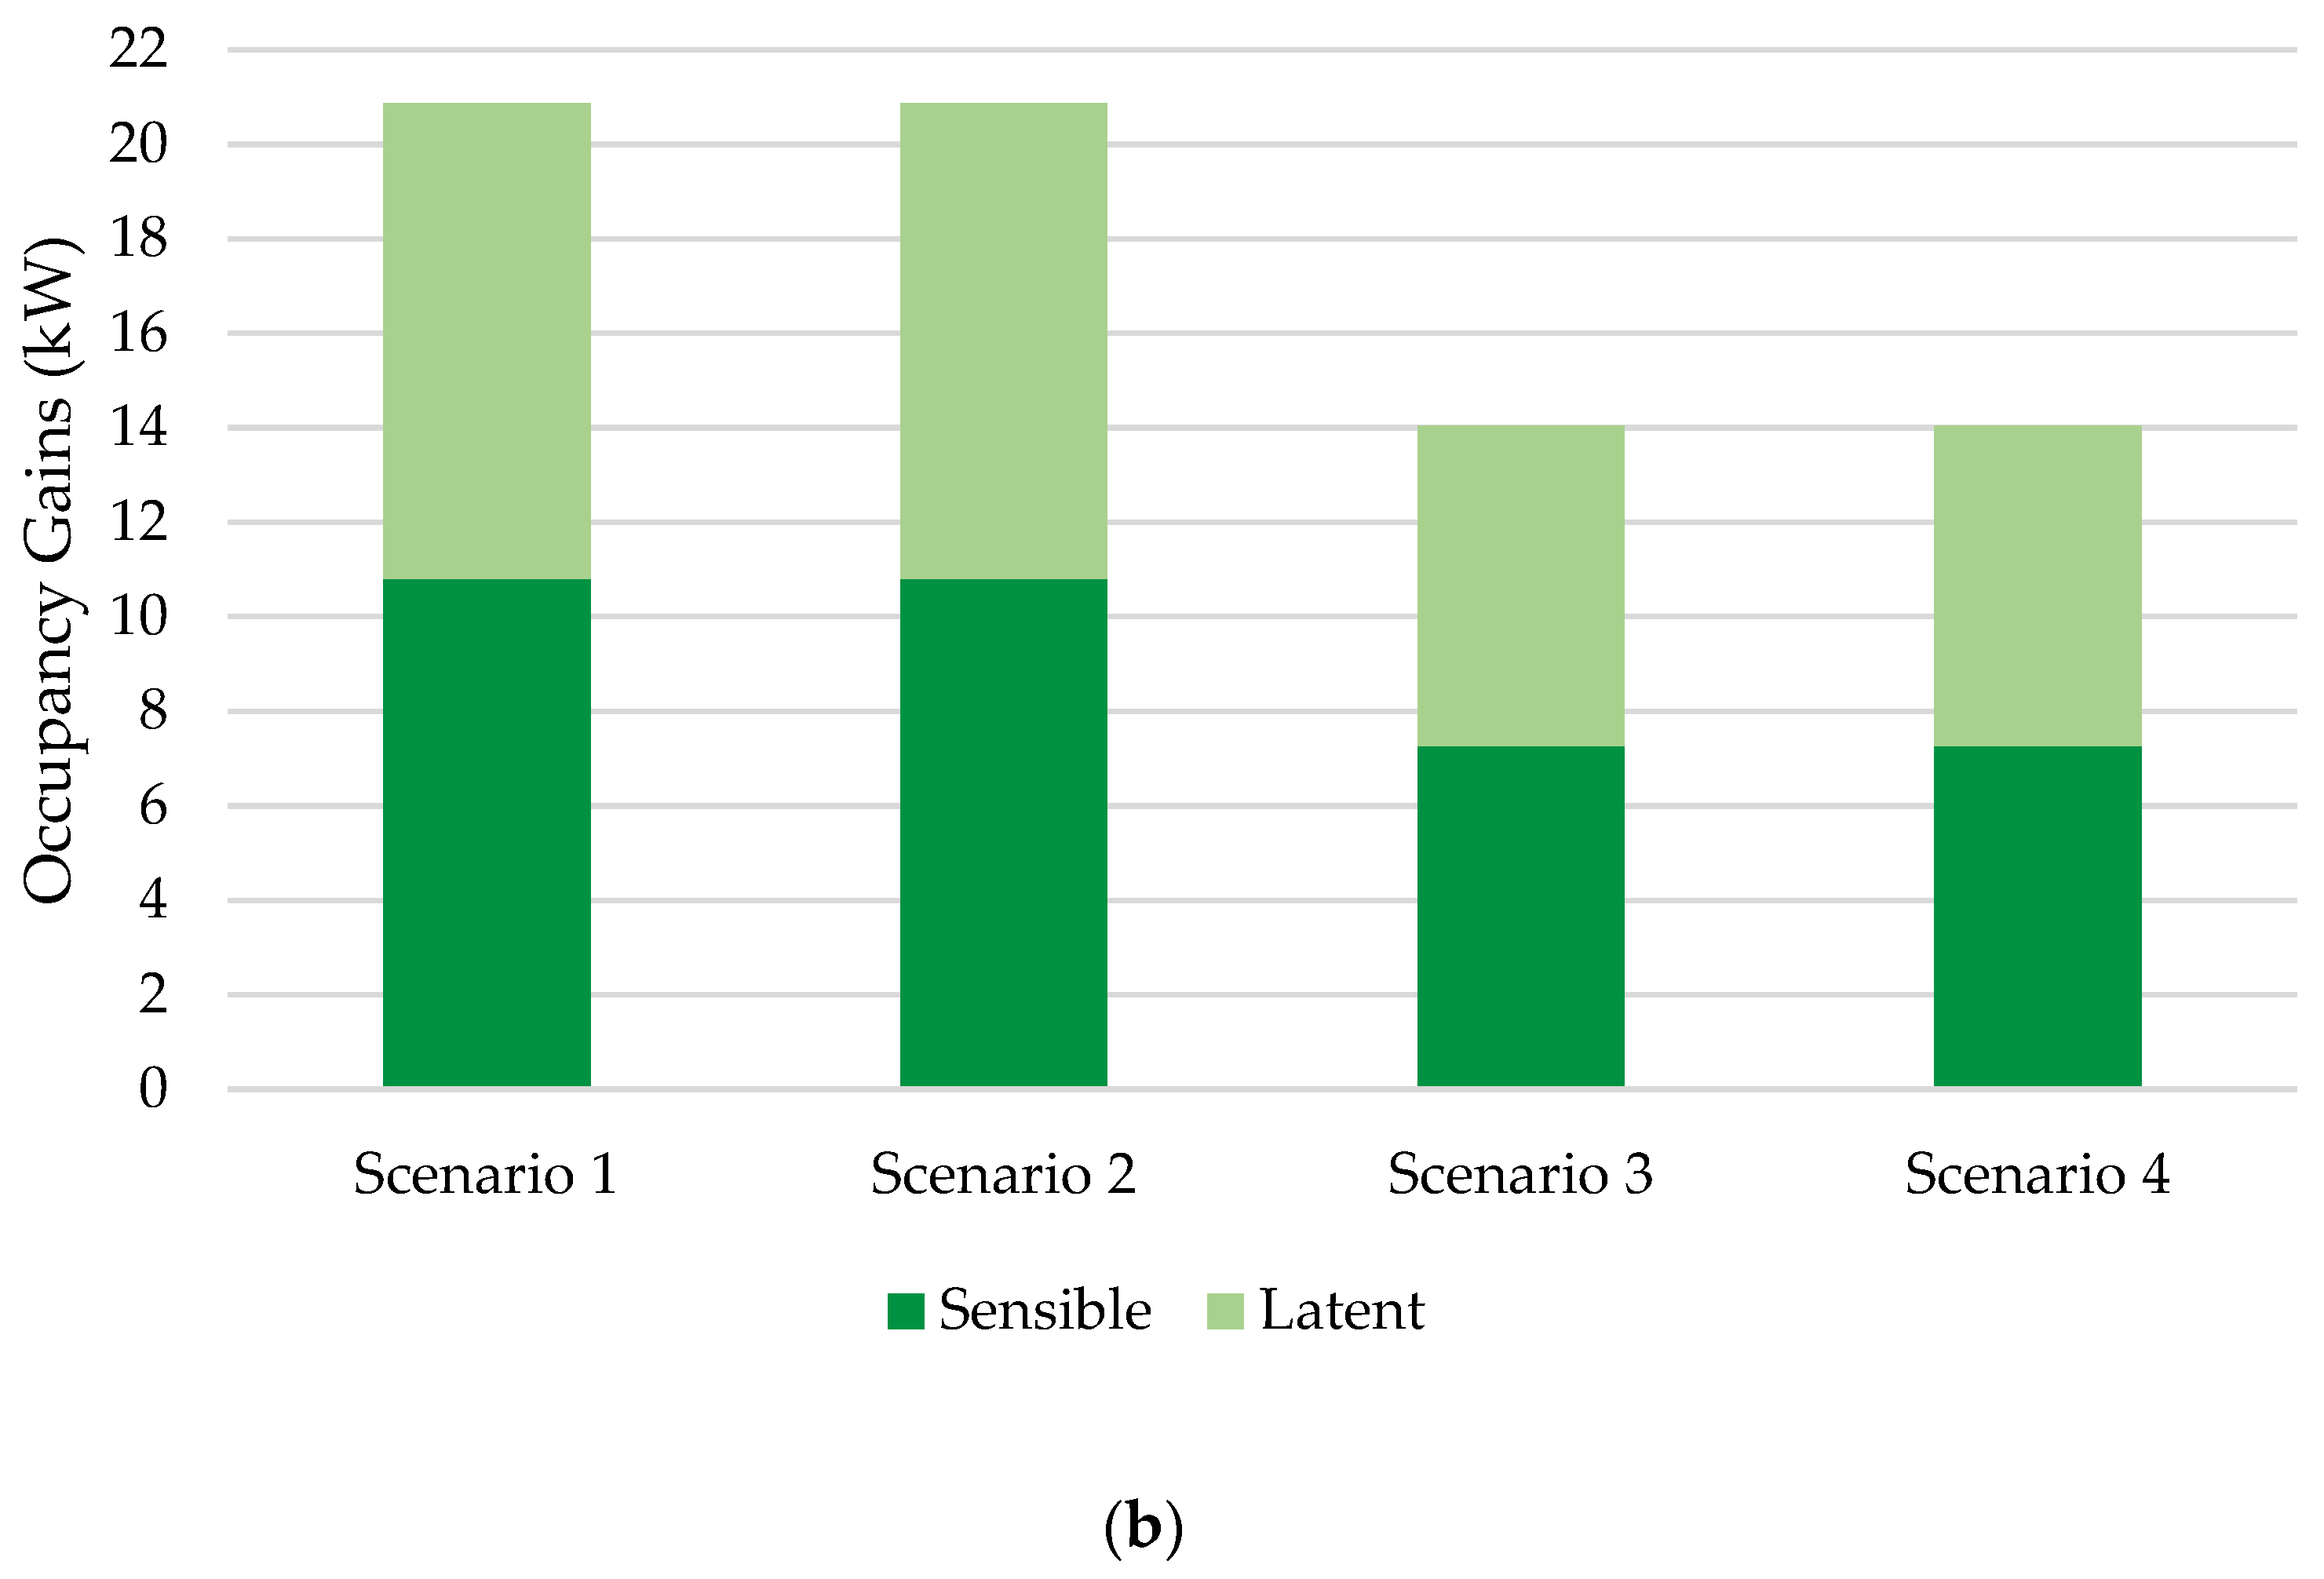
Both office equipment usage and occupancy activities can influence the internal heat gains. This results in the variation of the indoor air temperature and humidity and hence can influence the indoor thermal environment and the requirement for heating, cooling and ventilation. Figure 15 presents the comparison of the equipment and occupancy gains achieved for a typical day under the four different scenarios. Scenario 1 results suggest the benchmark values based on the assignment of typically scheduled or static profiles. The Scenario 1 equipment gains, corresponded directly with the total heat gains for the typical or static profile (Figure 8a), giving a total equipment heat gain of 96.0 kW. Additionally, the occupancy gains were directly related to the occupancy gains indicated by the Typical Occupancy 2 Profile, giving a total occupancy gain of 20.88 kW. These values were greater than the gains predicted using the deep learning approach. As observed, when both equipment and occupancy deep learning methods were used (Scenario 4), the total equipment heat gain was 32.88 kW, and total occupancy heat gain was 14.05 kW, 65.76% and 32.74% lower as compared to Scenario 1. Hence, this shows that the typical or static profiles can overestimate or underestimate the heat gains. Therefore, this shows the benefits of using the deep learning approach for demand-driven HVAC control systems.
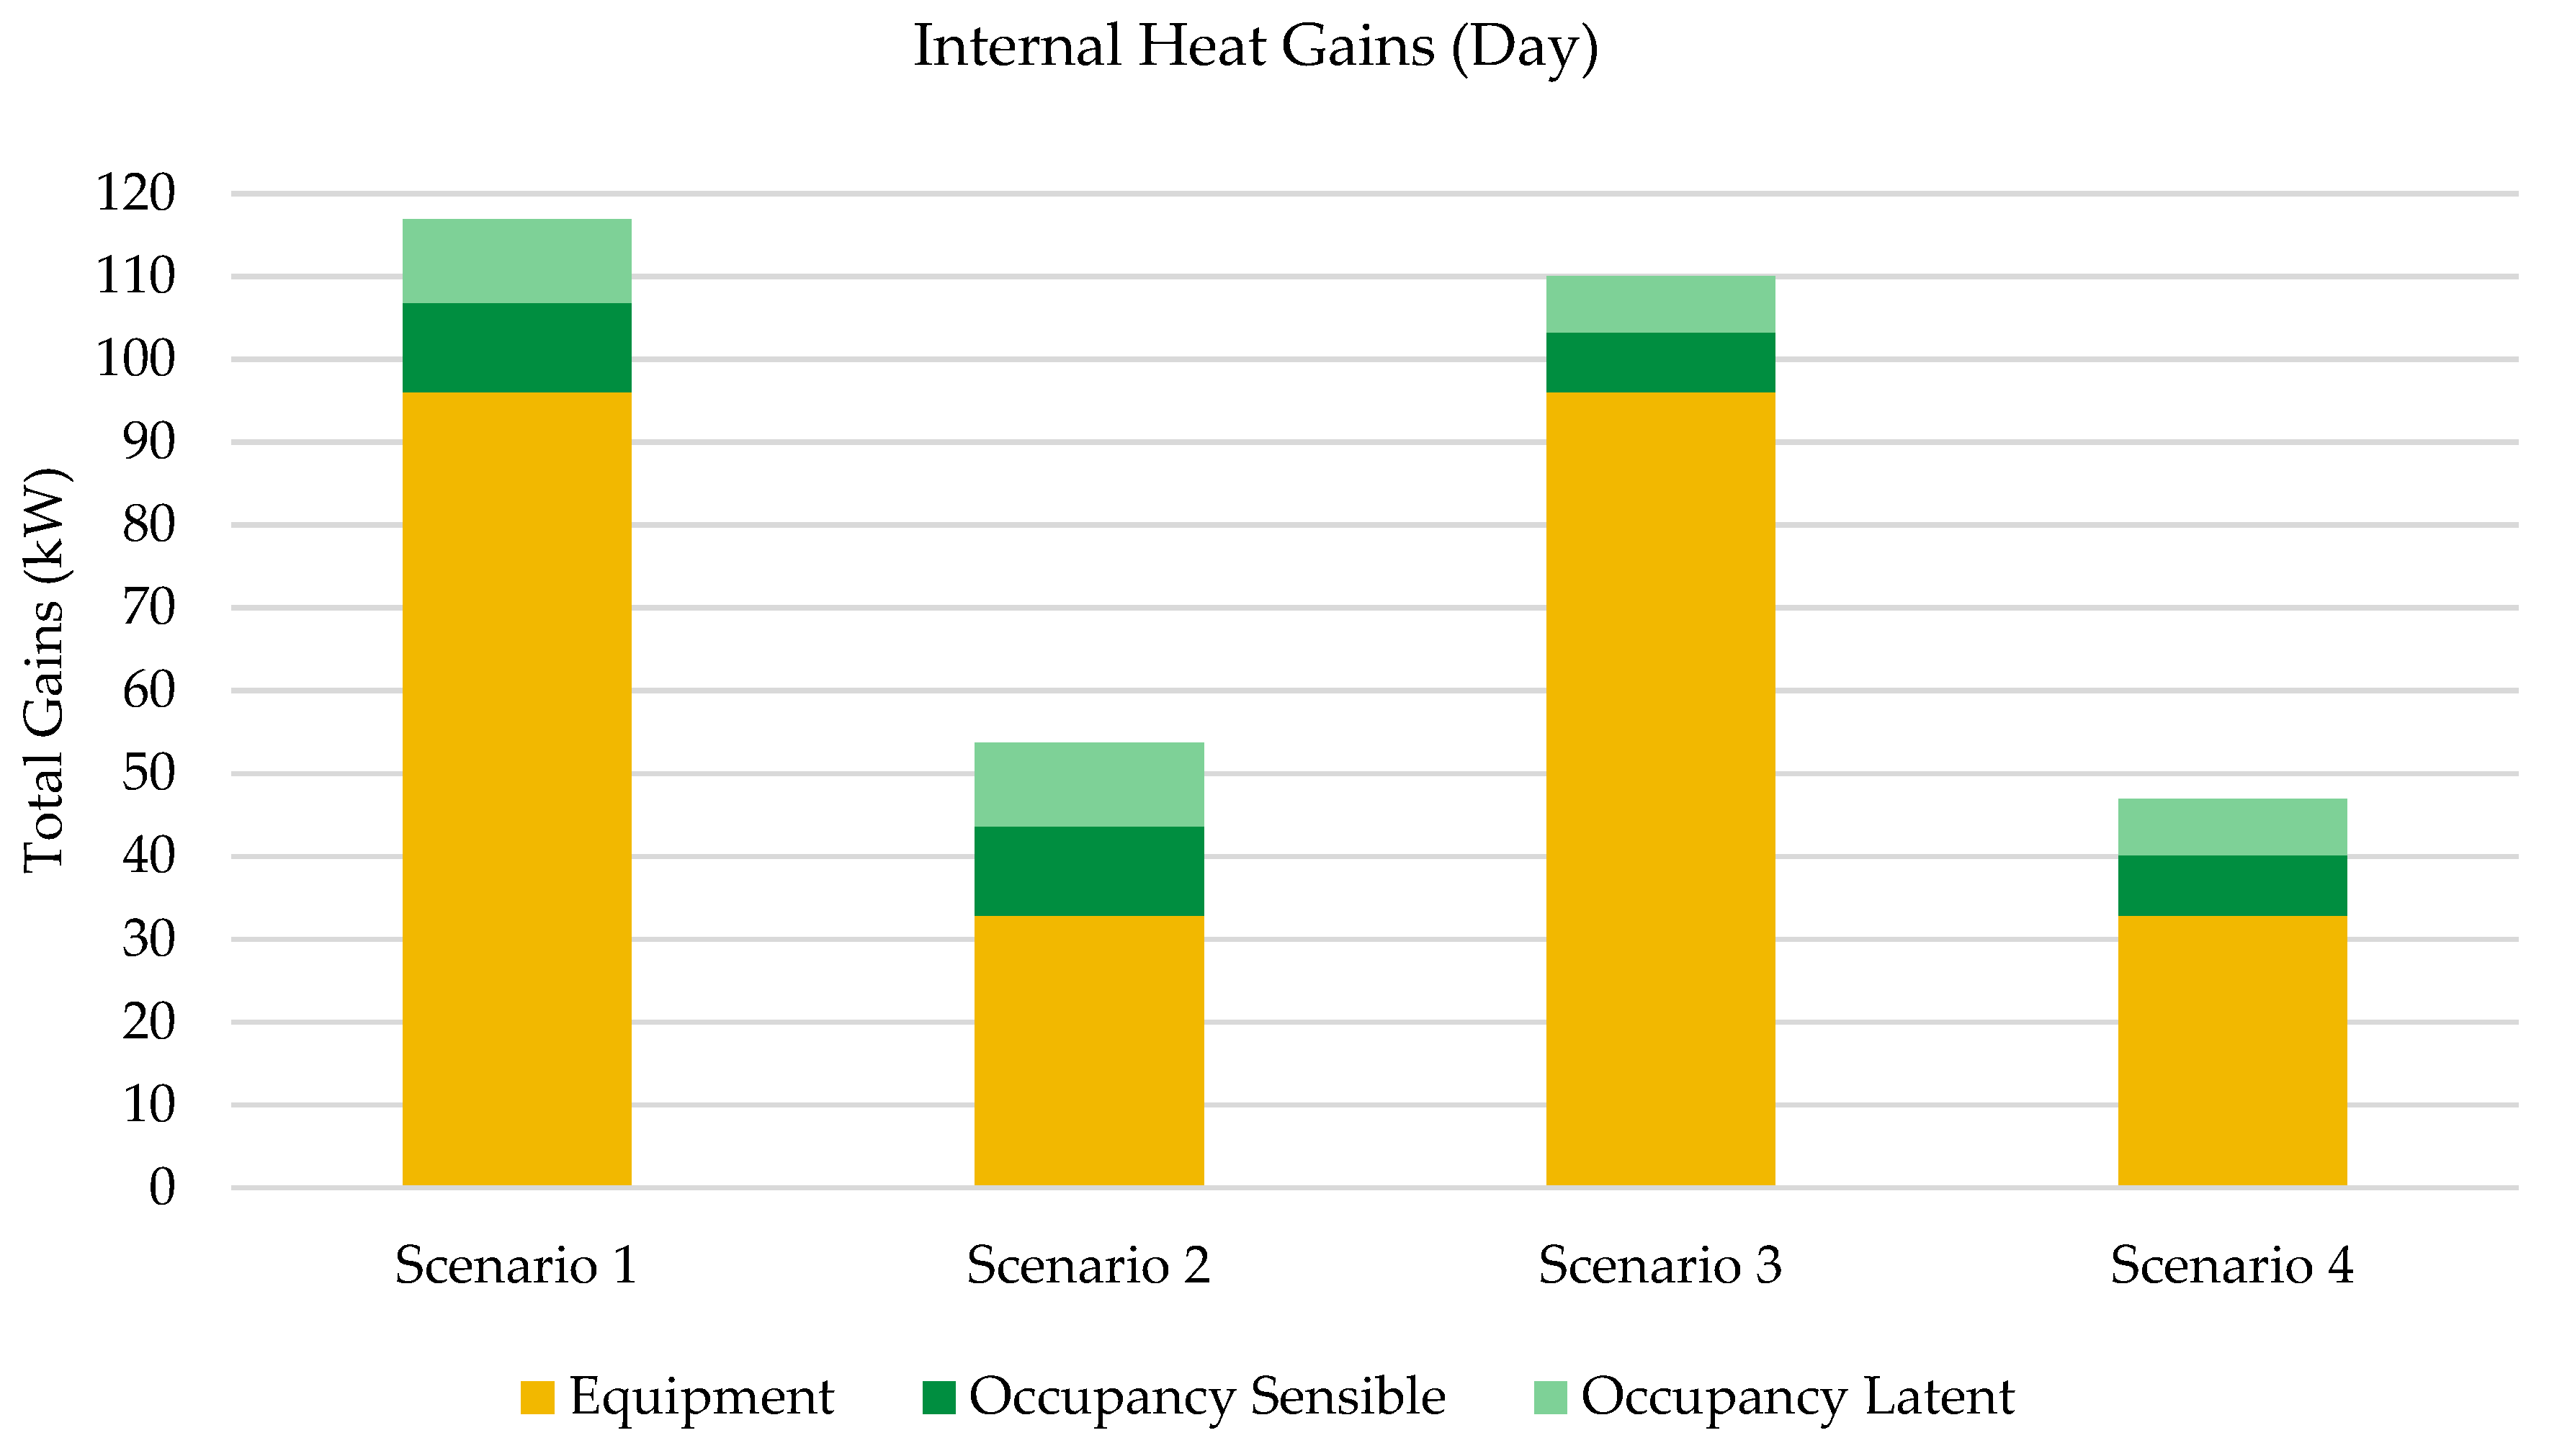
Figure 16 presents the sum of the equipment heat gains, occupancy sensible and latent heat gains predicted for the different scenarios. Because of the working environment being an office space with a greater number of office equipment emitting larger amounts of heat gains and with a low number of occupants present in the room and mostly sitting for a majority of the time, it was observed that the equipment heat gains are more significant than occupancy heat gains.
A total internal heat gain value of 116.88 kW was predicted for Scenario 1. Scenario 2, which employed equipment detection, showed a significant reduction (63.13%) as compared to Scenario 1. While Scenario 3, which had occupancy activity detection, indicated a total internal heat gain of 110.05 W. This shows that based on the conditions simulated and selected case study, the detection of occupancy movement did not have a significant impact as compared to the application of equipment detection. However, its usage could be more advantageous in an indoor environment with lots of occupancy movement and heavy occupancies such as shopping malls or indoor gyms.

3.3.2. Heating and Cooling Demand

The following analysis of the building energy consumption was based on the case study building model and the conditions set (Scenarios 1–4). Additionally, it should be acknowledged that this case study building serves as an exemplar in sustainability and its environmental credentials with a BREEAM rating of excellent. It consists of building materials with U-values that provides a highly insulated energy-efficient building design. The building is located in the UK which has a temperate maritime climate. Hence the total heating demand was based on a typical day in the winter season, and the cooling demand was based on a typical day in the summer season.
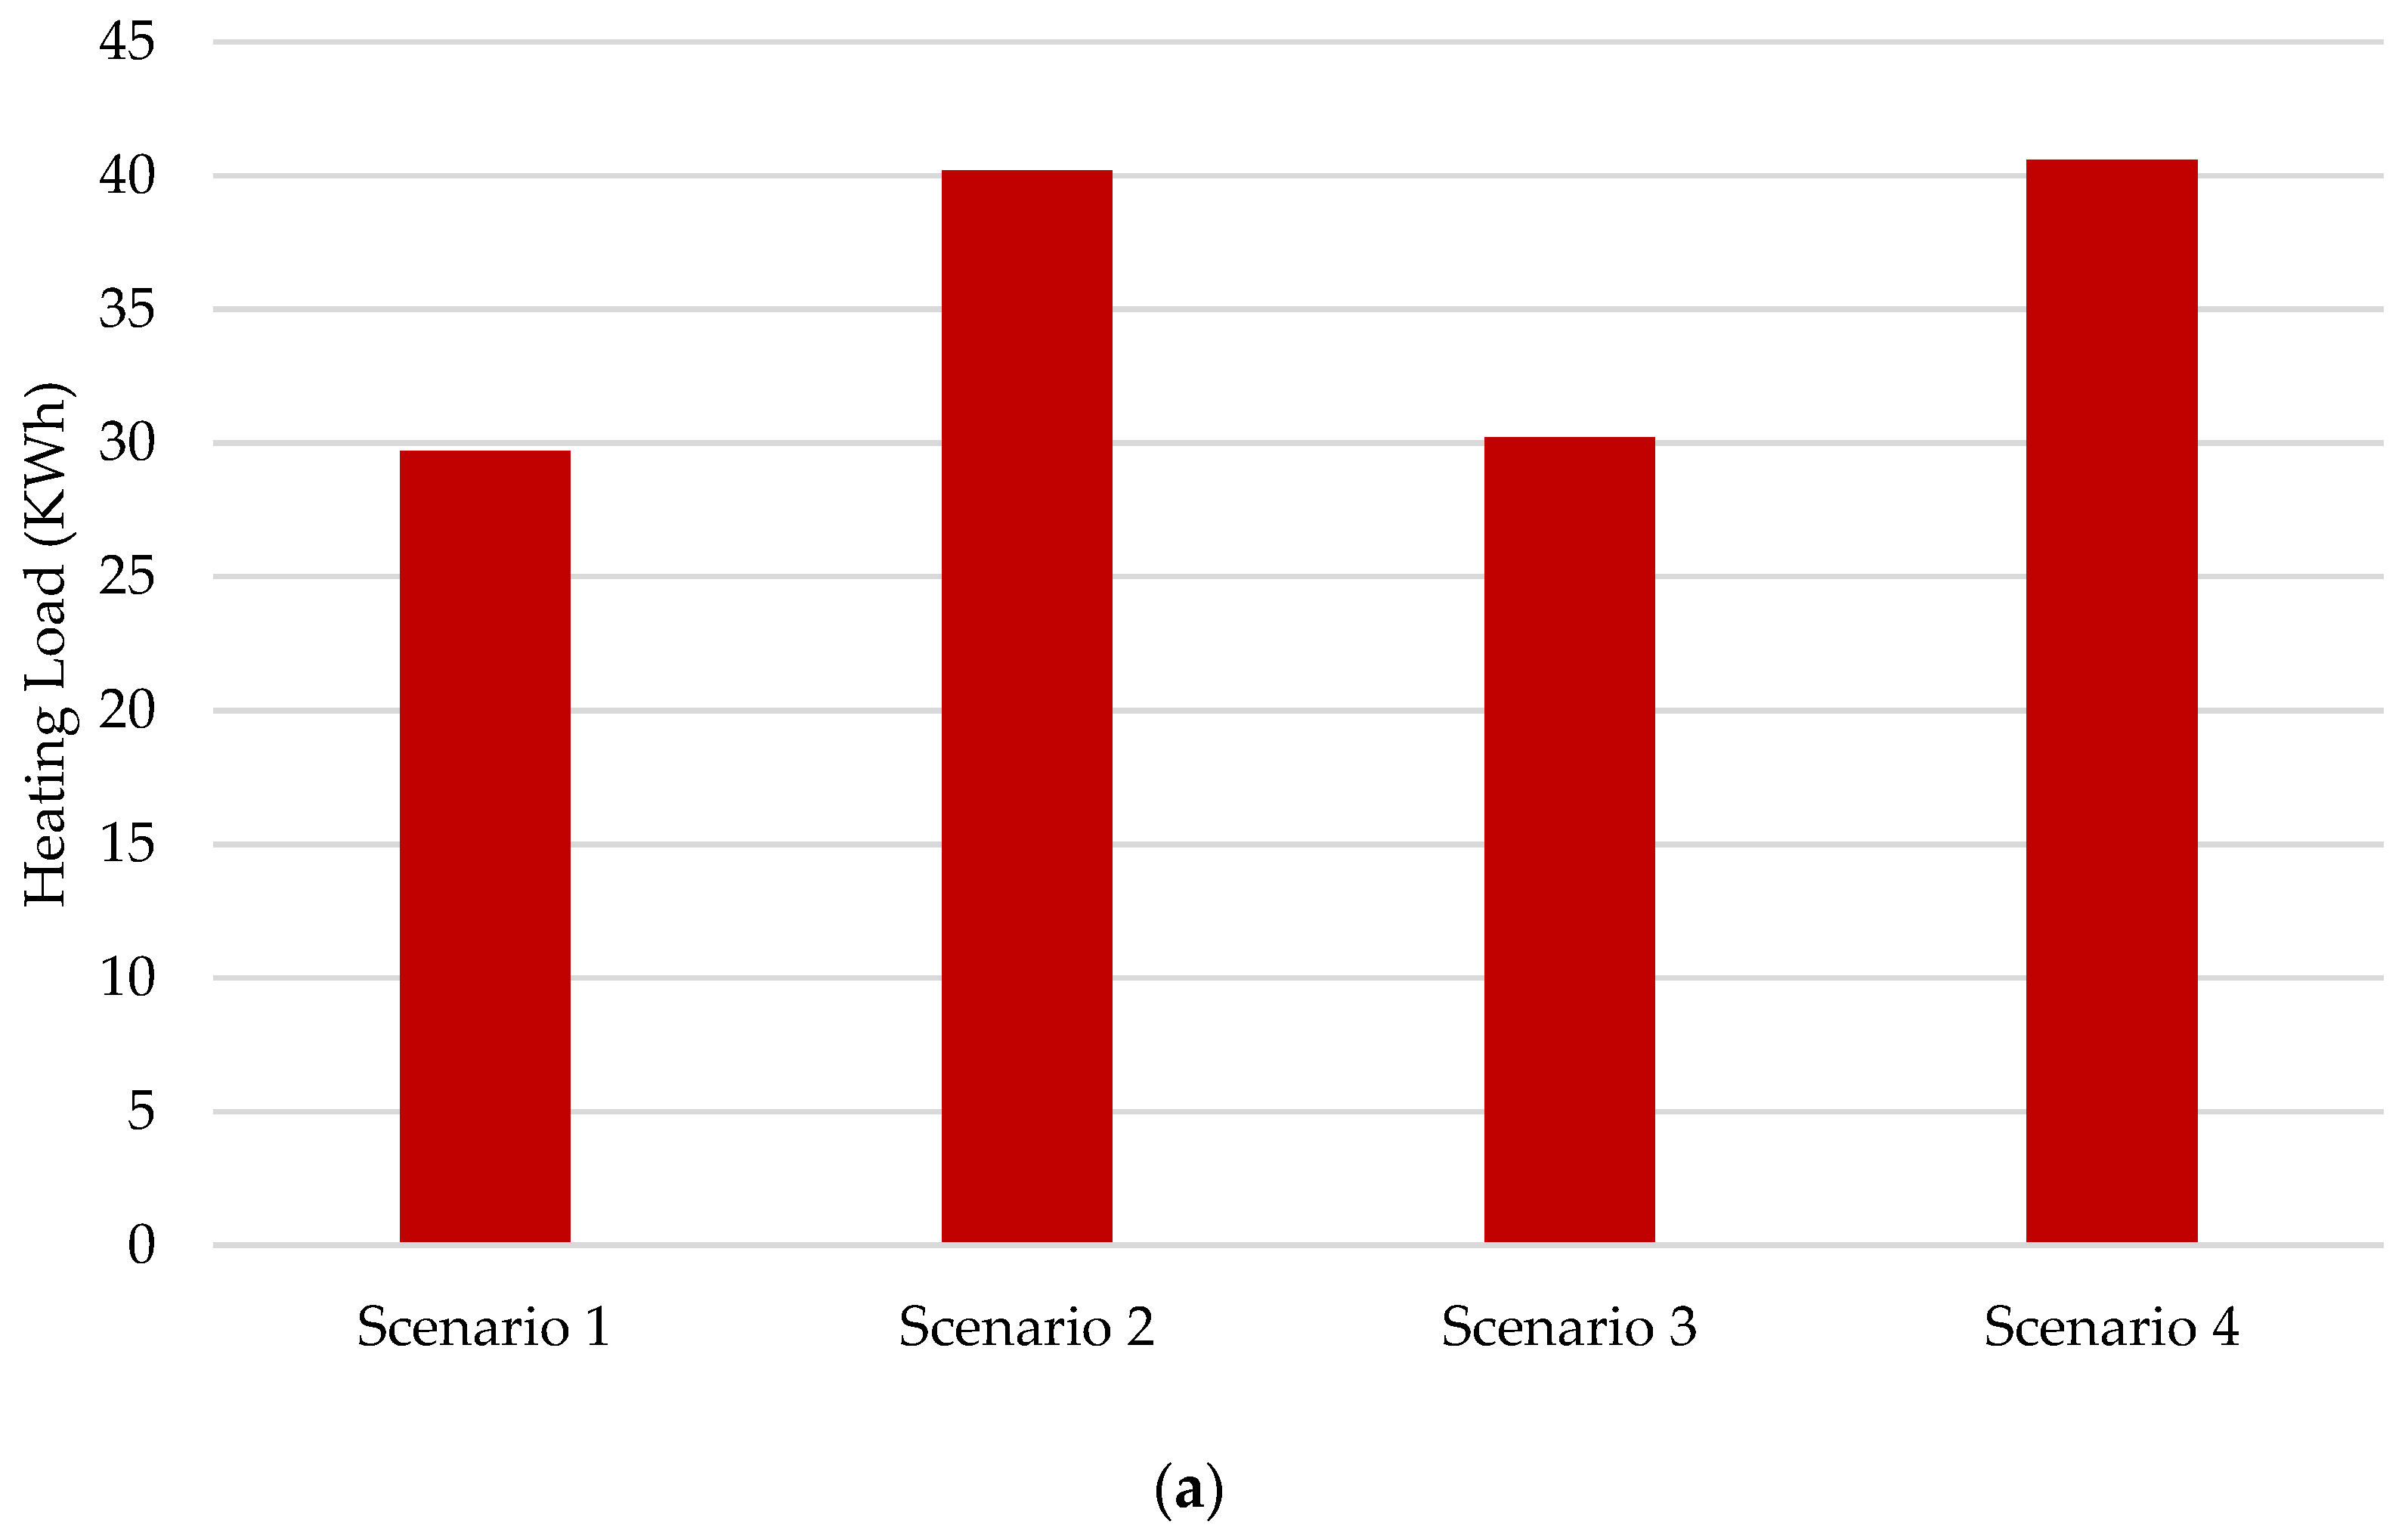
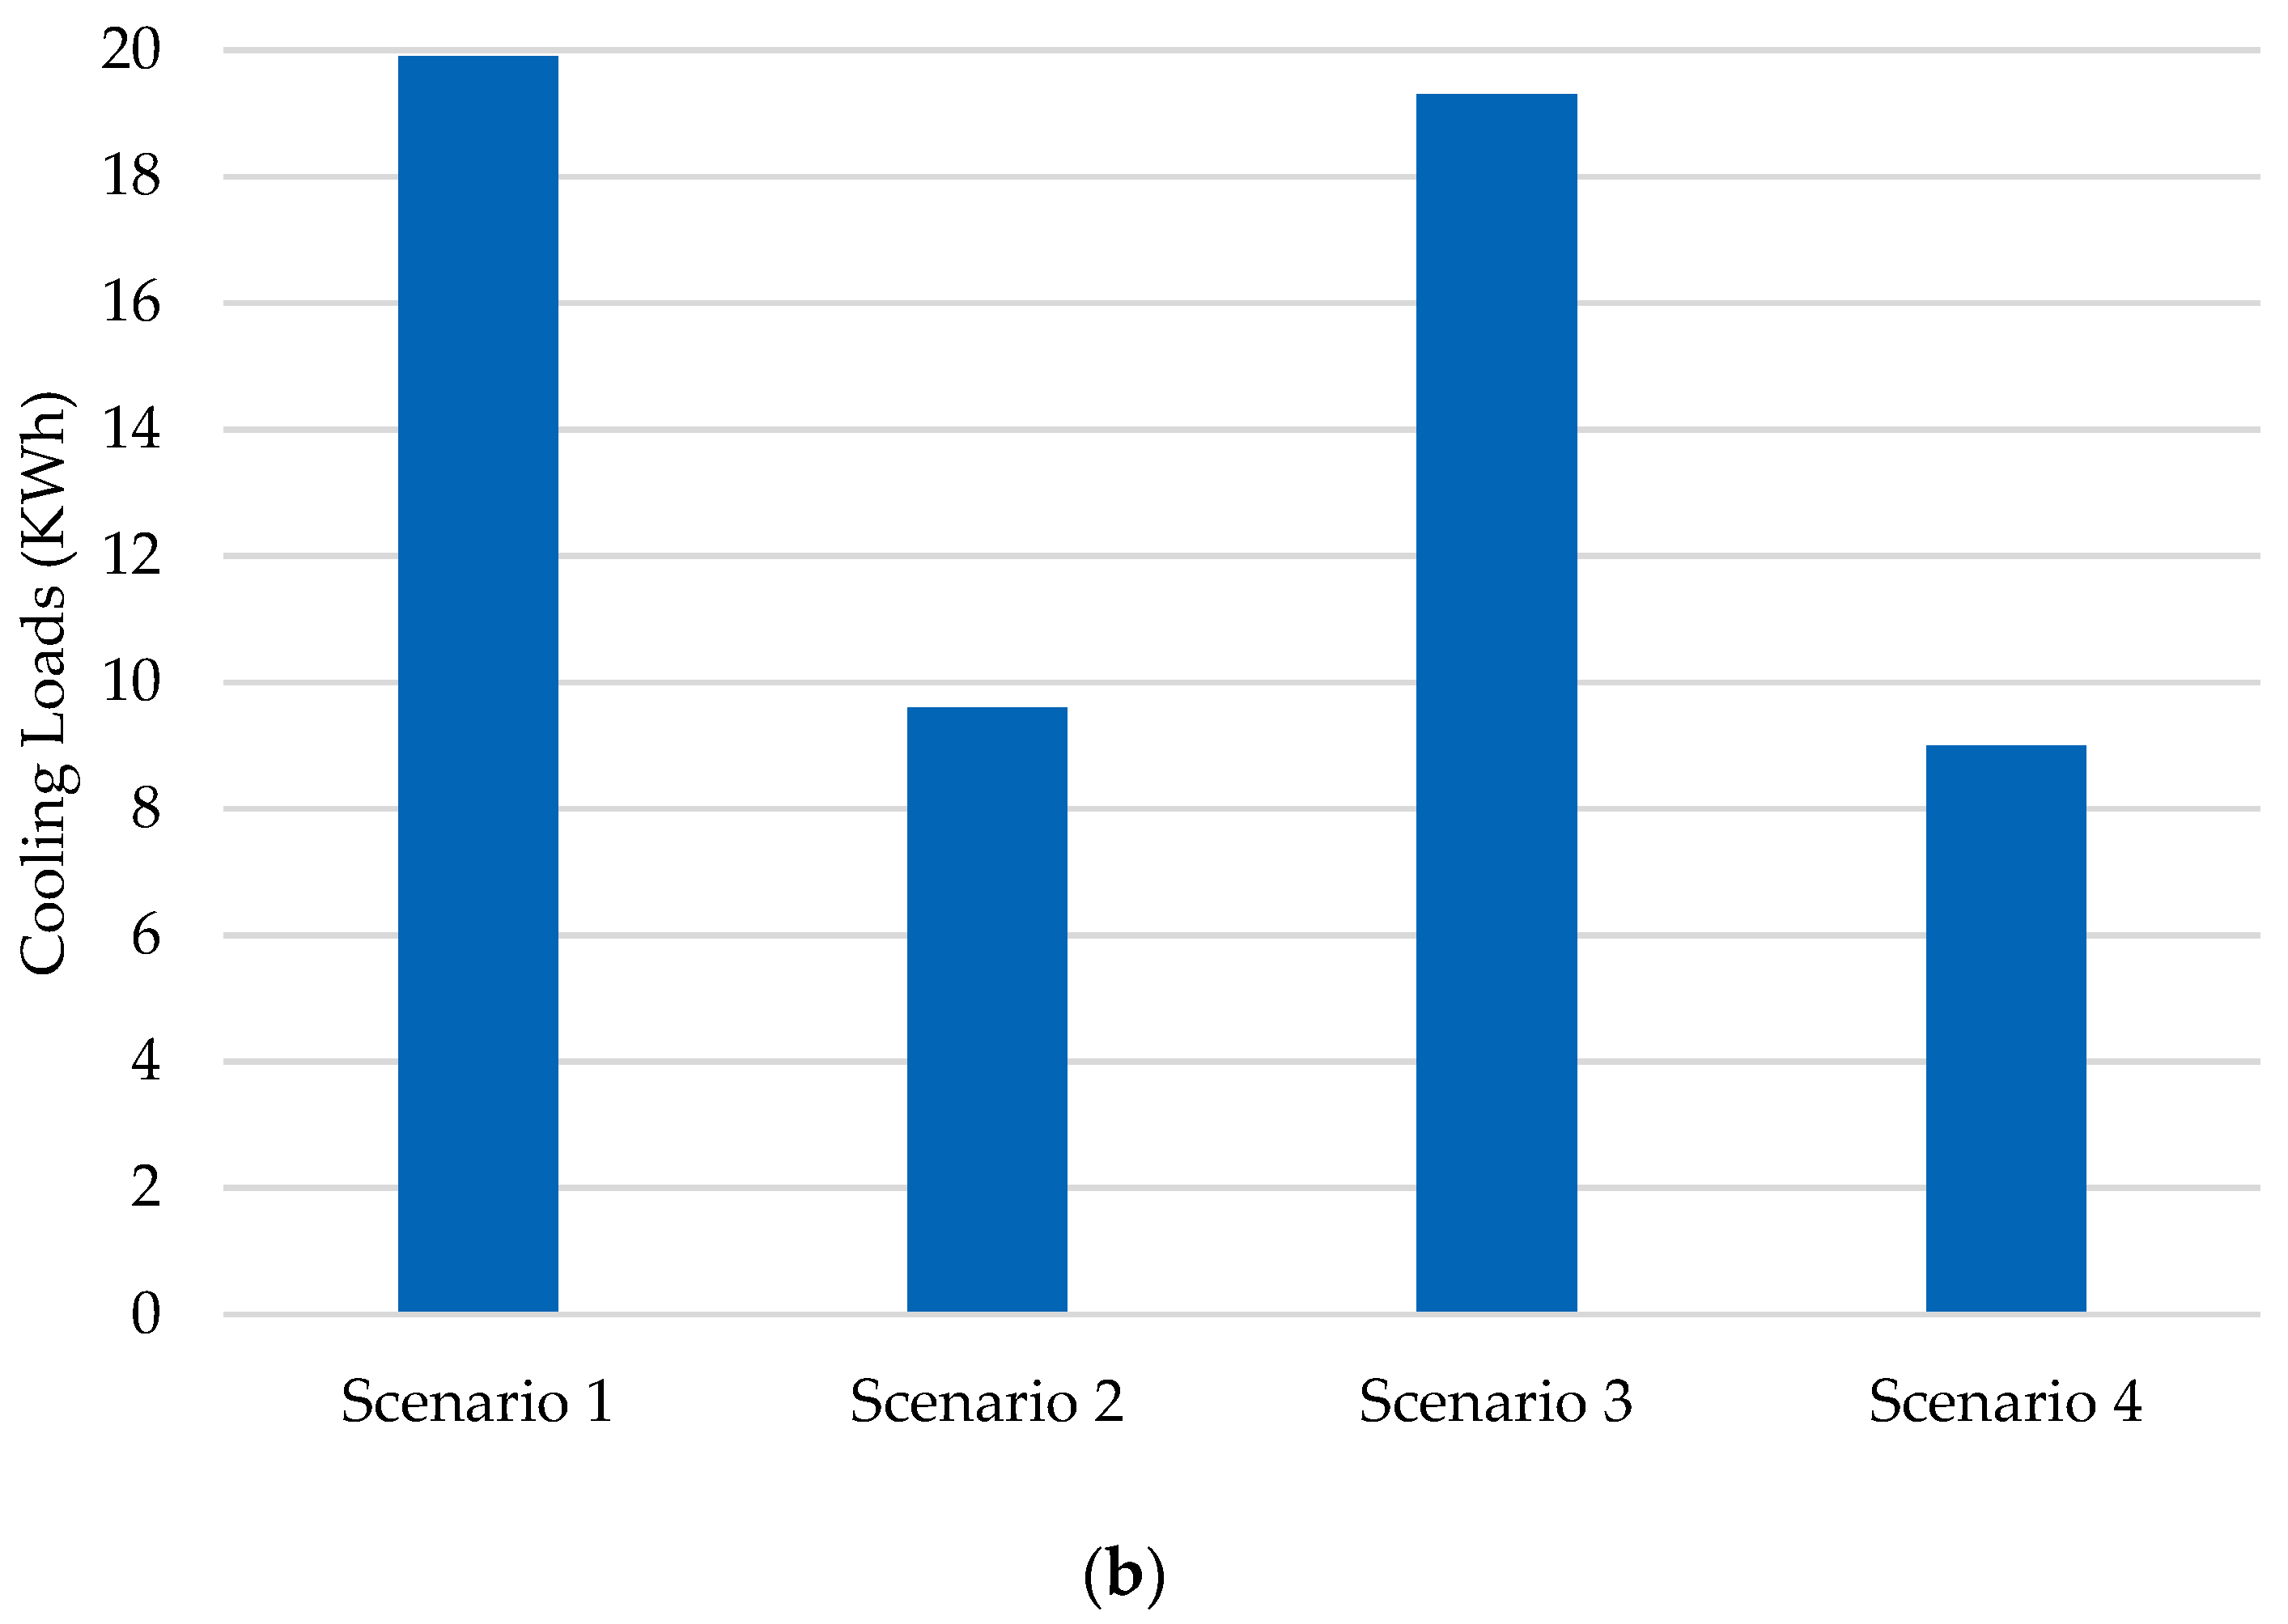
Figure 17a shows the total heating demand for a typical office day during the heating season with Scenarios 1, 2, 3 and 4 providing a total heating load of 29.70 kWh, 40.20 kWh, 30.20 kWh and 40.60 kWh. As discussed earlier, the internal heat gains predicted for Scenario 4 (with the application of the deep learning detection approach) was significantly lower than Scenario 1 (typical or static schedule). Hence the heating requirements would be higher during winter to enable the provision of adequate indoor conditions and occupant satisfaction. Figure 17b presents the total cooling demand for a typical day during the cooling season. Scenario 1, using typical or static profiles, predicted the required cooling load to be 54.77% higher than Scenario 4. Results for Scenarios 2 and 3 highlighted the importance of both types of detection methods.
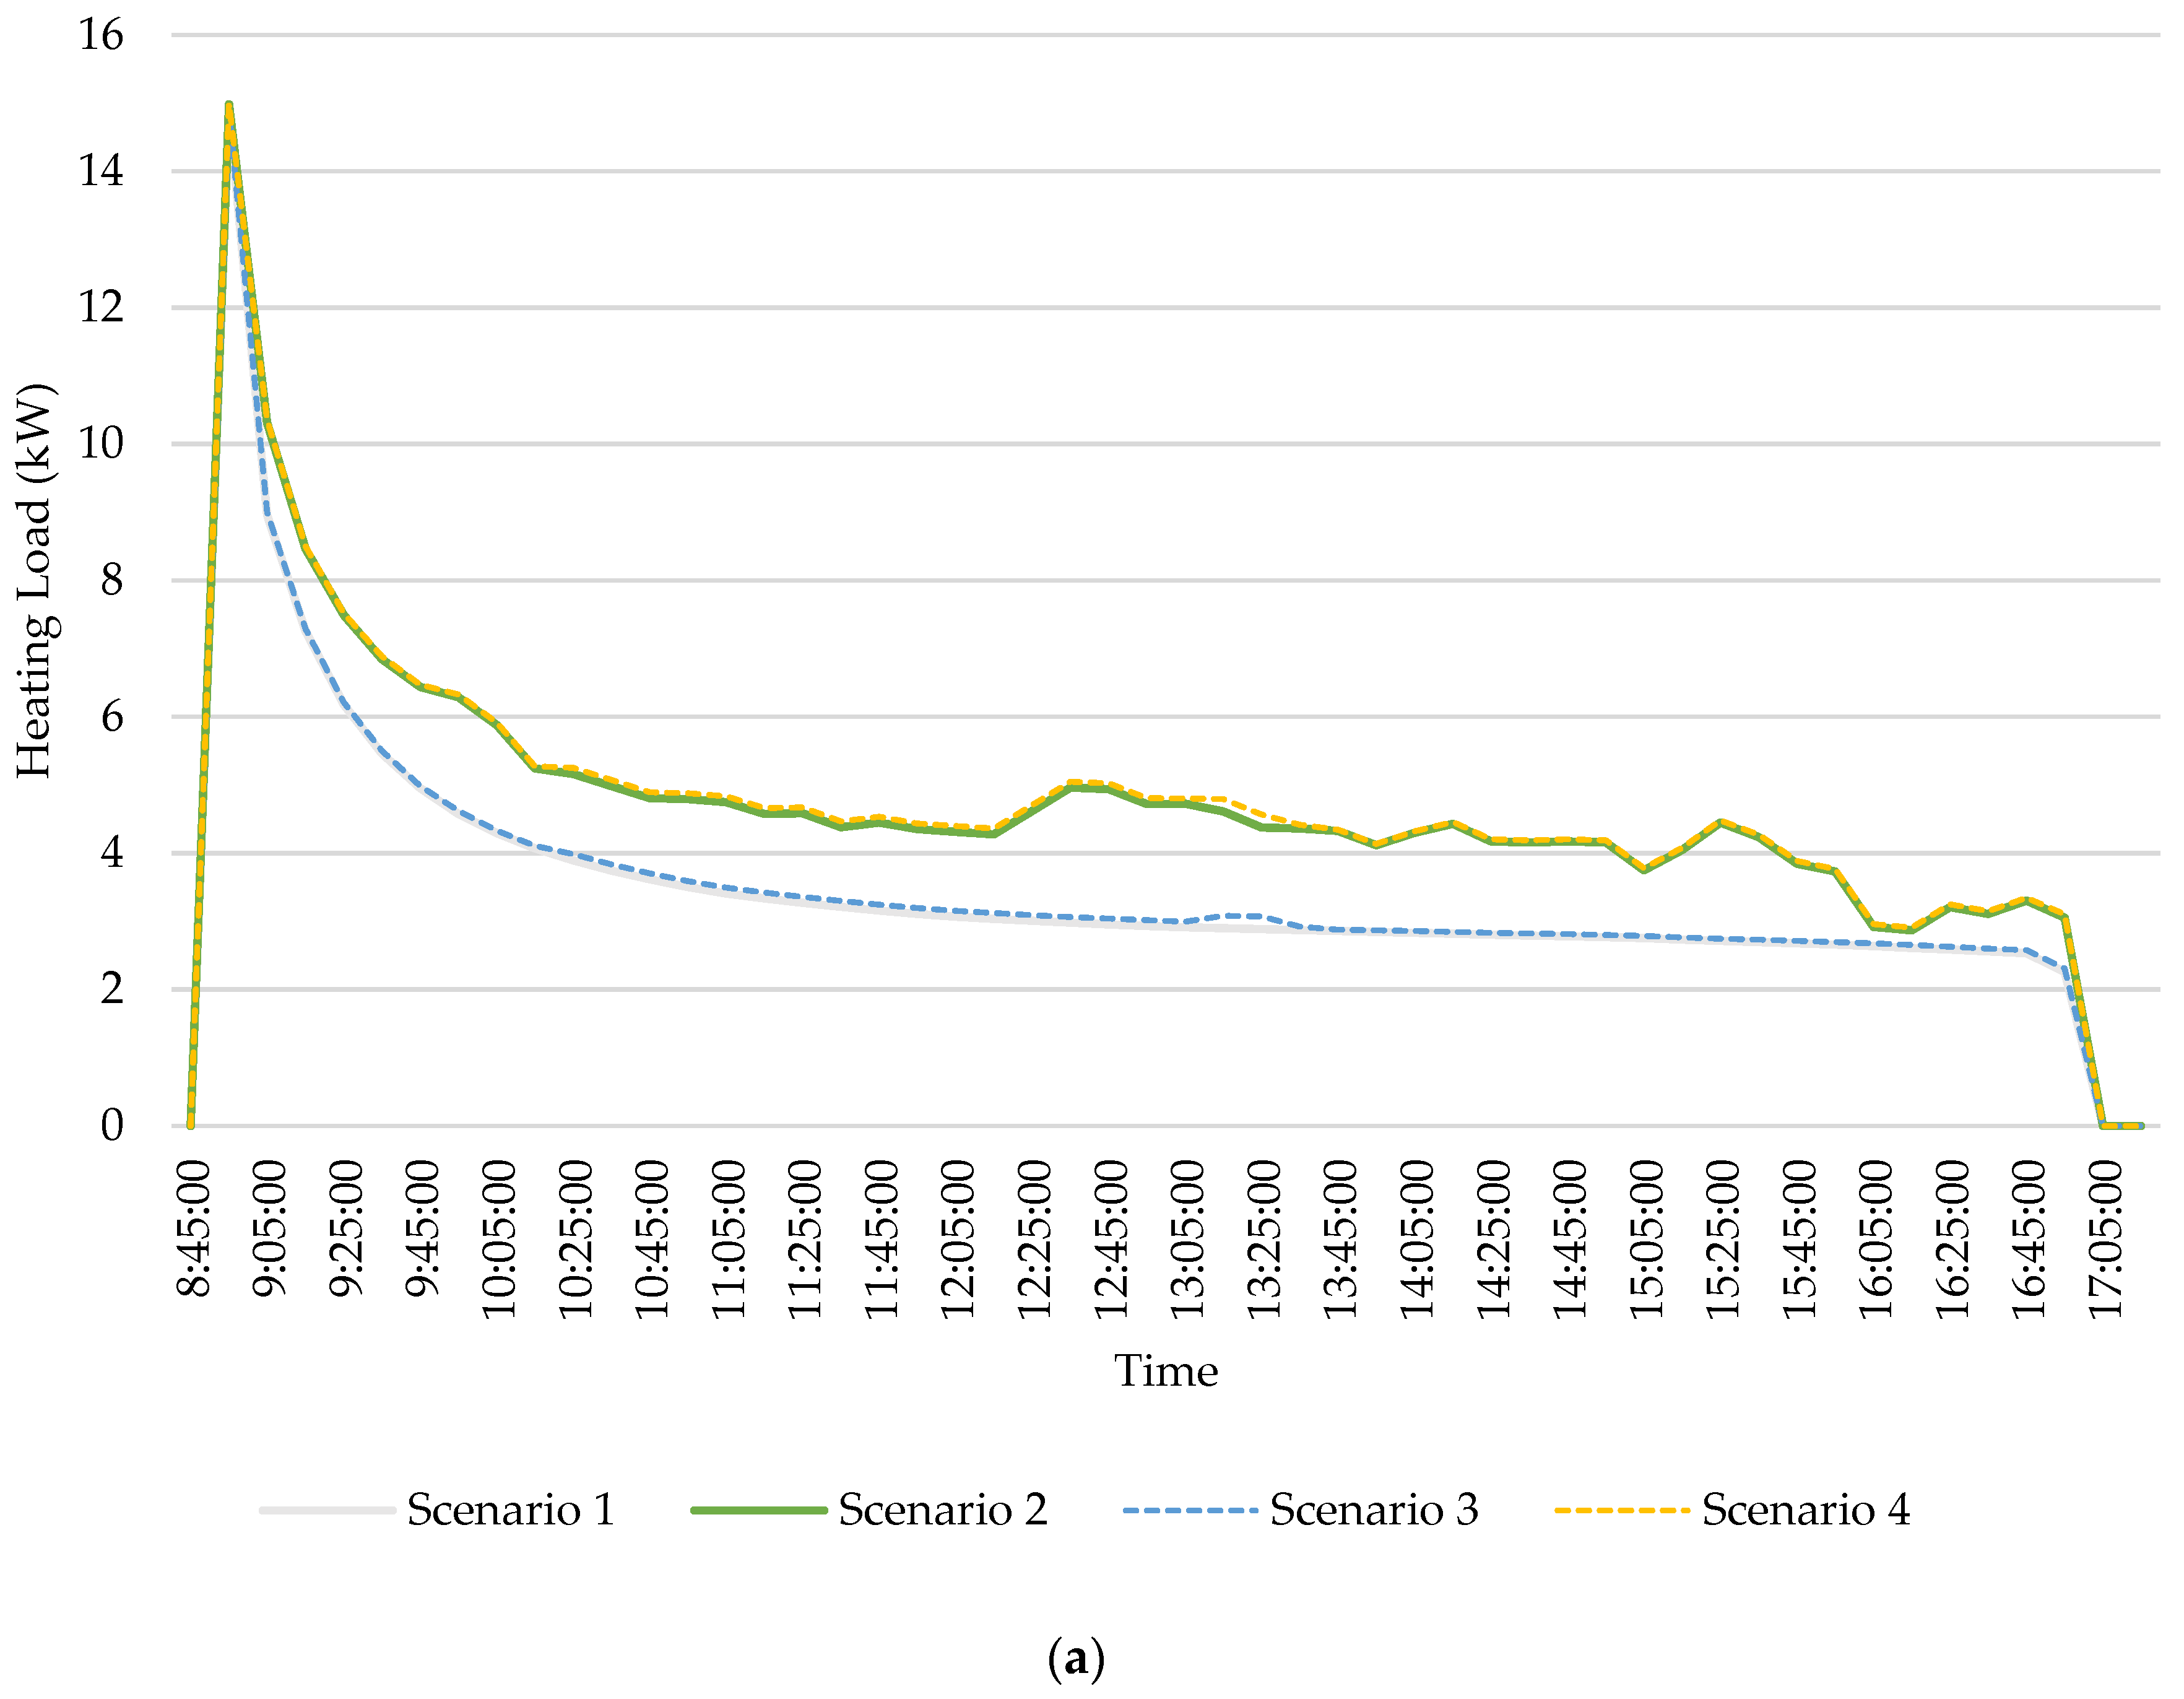
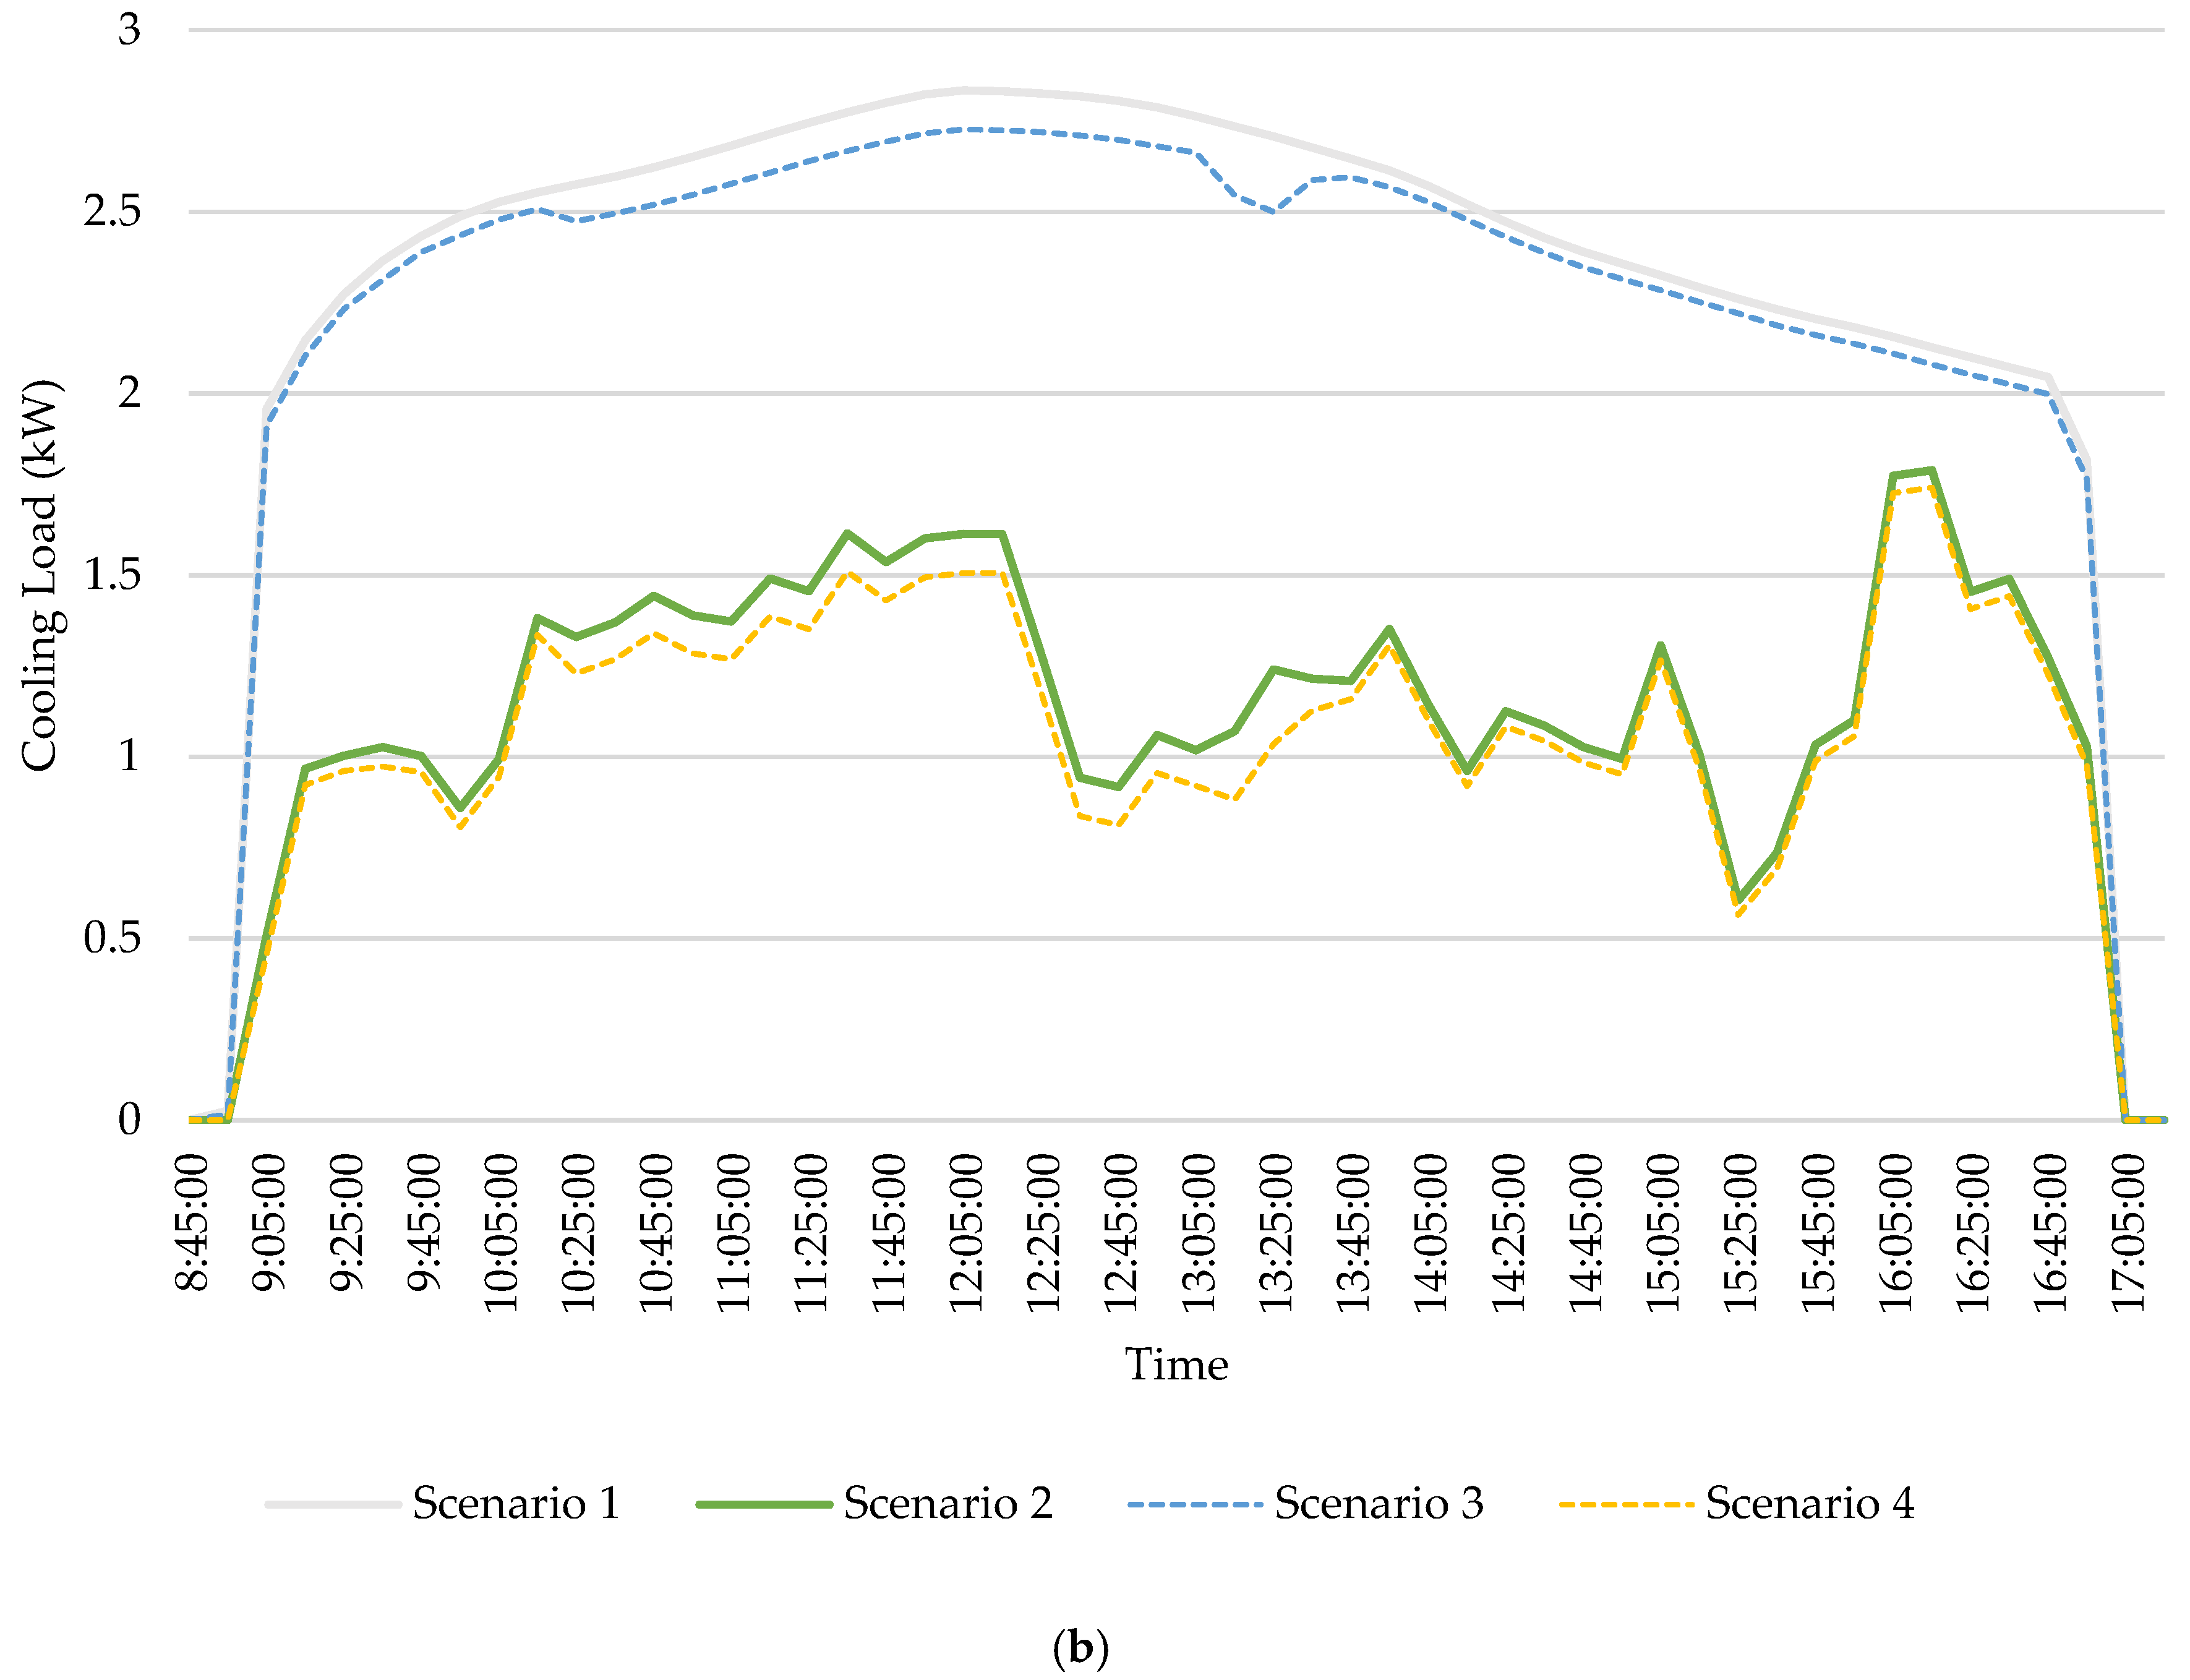
A detailed analysis of the heating and cooling energy consumption can be observed in Figure 18a,b which presents predicted hourly heating and cooling loads comparing Scenarios 1–4. It can be observed that the heating and cooling loads are directly impacted by the variations of equipment and occupancy heat gains throughout the day. With higher heat gains predicted for Scenario 1, which used fixed scheduled profiles, it resulted in having the highest heating and lowest cooling loads.
Based on the simulation results, the application of the proposed deep learning approach led to lower predicted internal heat gains (up to 59.86%) in comparison with Scenario 1 which used static scheduled profiles for both occupancy and equipment usage within a building space. This influenced the overall building loads, with up to 36.7% increase in heating during the heating season and 54.8% decrease in cooling during the cooling season. It should be noted that these energy predictions are solely based on the scenarios and the conditions applied within the selected case study building. However, this highlighted the significance of real-time monitoring of occupancy activities performed and the usage of equipment.

4. Conclusions and Future Works

This study proposes a vision-based occupancy and equipment usage detection approach for demand-driven control systems to minimise the unnecessary energy usage and enhance thermal comfort. The method can detect and recognise multiple occupants’ and their activities and equipment usage within building spaces in real-time. A Faster R-CNN was developed, trained and deployed to a camera for real-time detection of occupancy activities and equipment usage. The proposed models were validated through the use of a set of testing data, and the results suggested the equipment detection model achieved an accuracy of 80% with an F1 Score of 0.8889 and the occupancy model achieved an accuracy of 97.09% with an F1 Score of 0.9270. It indicated that the model is suitable for live occupancy and equipment detection.
Experiments were conducted within an office room to assess the capabilities and accuracy of the proposed approach. It showed that overall occupant’s activities and equipment detection accuracies of 97.32% and 80.80% were achieved respectively, which are in accordance with the test accuracies. It presents the capabilities of the model to detect the equipment usage and recognise the differences between the corresponding human poses for each specific activity. Four test scenarios in terms of the use of profiles were set up to investigate the impacts of the application of the deep learning vision-based detection method towards building energy performances. Using BES, the building was modelled and simulated using a static or fixed profile and DLIP profile to predict the influence on energy consumption. The results showed that the internal heat gains achieved by typical profiles were much greater than the gains achieved using the deep learning approach. It also suggested that when both equipment and occupancy deep learning methods were used (Scenario 4), a 65.75% and 32.74% decrease of equipment and occupancy gains could be achieved respectively in comparison to Scenario 1 results.
This highlights the benefits of using the deep learning approach to provide deep learning-based profiles to HVAC control systems to enable the achievement of meeting real-time requirements for reducing the unnecessary building loads.
Overall, the proposed approach presents the capabilities of detection and recognition of multiple occupants’ activities and equipment usage and provides an efficient alternative to accurately detect and estimate the internal heat gains. To further optimise the detection performance, some improvements are required to be applied to the approach to decrease the error rate as the error rate could result in an inaccurate prediction of the energy demand and further causes an uncomfortable indoor environment for occupants. In addition, a strategy, which transfers the data clustered from deep learning model to occupancy and equipment profiles and feeds them into BEMS to automatically adjust HVAC setpoints, is required to be developed.

Author Contributions

Conceptualisation, J.C., P.W.T. and S.W.; methodology, J.C., P.W.T. and S.W.; software, P.W.T. and S.W.; validation, P.W.T. and S.W.; formal analysis, P.W.T. and S.W.; investigation, P.W.T. and S.W.; resources, J.C.; data curation, P.W.T. and S.W.; writing—original draft preparation, P.W.T. and S.W.; writing—review and editing, J.C.; visualisation, P.W.T.; supervision, J.C.; project administration, J.C. All authors have read and agreed to the published version of the manuscript.

Funding

This work was supported by the University of Nottingham and EPSRC (EP/R513283/1).

Institutional Review Board Statement

Not applicable.

Informed Consent Statement

Informed consent was obtained from all subjects involved in the study.

Data Availability Statement

The data presented in this study are available on request from the corresponding author.

Conflicts of Interest

The authors declare no conflict of interest.

Abbreviations

AIArtificial Intelligence
ASHRAEAmerican Society of Heating, Refrigerating and Air-Conditioning Engineers
BESBuilding Energy Simulation
BREEAMBuilding Research Establishment Environmental Assessment Method
CIBSEChartered Institution of Building Services Engineers
CNNConvolutional Neural Network
DLIPDeep learning influenced profile
FNFalse Negative
FPFalse Positive
HVACHeating, Ventilation and Air-Conditioning
PIRPassive Infrared
RCNNRegion-based Convolutional Neural Network
RoIRegion of Interest
TNTrue Negative
TPTrue Positive

References

  1. IPCC. Contribution of Working Group III to the Fifth Assessment Report of the Intergovernmental Panel on Climate Change, Climate Change 2014: Mitigation of Climate Change; Cambridge University Press: Cambridge, UK; New York, NY, USA, 2014. [Google Scholar]
  2. International Energy Agency. Transition to Sustainable Buildings, Strategies and Opportunities to 2050; International Energy Agency: Paris, France, 2013. [Google Scholar]
  3. Congedo, P.M.; Baglivo, C.; D’Agostino, D.; Zacà, I. Cost-optimal design for nearly zero energy office buildings located in warm climates. Energy 2015, 91, 967–982. [Google Scholar] [CrossRef]
  4. Yang, L.; Yan, H.; Lam, J.C. Thermal comfort and building energy consumption implications—A review. Appl. Energy 2014, 115, 164–173. [Google Scholar] [CrossRef]
  5. Lu, S.; Li, J.; Lin, B. Reliability analysis of an energy-based form optimization of office buildings under uncertainties in envelope and occupant parameters. Energy Build. 2020, 209, 109707. [Google Scholar] [CrossRef]
  6. Mansor, R.; Sheau-Ting, L. Criteria for occupant well-being: A qualitative study of Malaysian office buildings. Build. Environ. 2020, 186, 197364. [Google Scholar] [CrossRef]
  7. Tien, P.W.; Calautit, J.K.; Darkwa, J.; Wood, C.; Wei, S.; Pantua, C.A.J.; Xu, W. A deep learning framework for energy management and optimisation of HVAC systems. In Proceedings of the IOP Conference Series: Earth and Environmental Science, Bangkok, Thailand, 11–14 December 2019. [Google Scholar] [CrossRef]
  8. Wei, S.; Calautit, J.K. Development of deep learning-based equipment heat load detection for energy demand estimation and investigation of the impact of illumination. Int. J. Energy Res. 2020, 1–18. [Google Scholar] [CrossRef]
  9. Hong, T.; Yan, D.; D’Oca, S.; Chen, C. Ten questions concerning occupant behavior in buildings: The big picture. Build. Environ. 2017, 114, 518–530. [Google Scholar] [CrossRef] [Green Version]
  10. Dong, J.; Winstead, C.; Nutaro, J.; Kuruganti, T. Occupancy-Based HVAC Control with Short-Term Occupancy Prediction Algorithms for Energy-Efficient Buildings. Energies 2018, 11, 2427. [Google Scholar] [CrossRef] [Green Version]
  11. Kwok, S.S.; Lee, E.W. A study of the importance of occupancy to building cooling load in prediction by the intelligent approach. Energy Convers. Manag. 2011, 52, 2555–2564. [Google Scholar] [CrossRef]
  12. Mahdavi, A.; Mohammadi, A.; Kabir, E.; Lambeva, L. Occupants’ operation of lighting and shading systems in office buildings. J. Build. Perform. Simul. 2008, 1, 57–65. [Google Scholar] [CrossRef]
  13. Peng, Y.; Rysanek, A.; Nagy, Z.; Schlüter, A. Occupancy learning-based demand-driven cooling control for office spaces. Build. Environ. 2017, 122, 145–160. [Google Scholar] [CrossRef]
  14. Masoso, O.T.; Grobler, L.J. The dark side of occupants’ behaviour on building energy use. Energy Build. 2010, 42, 173–177. [Google Scholar] [CrossRef]
  15. Sun, B.; Luh, P.B.; Jia, Q.S.; Jiang, Z.; Wang, F.; Song, C. Building energy management: Integrated control of active and passive heating, cooling, lighting, shading, and ventilation systems. IEEE Trans. Autom. Sci. Eng. 2013, 10, 588–602. [Google Scholar] [CrossRef]
  16. Valdiserri, P.; Biserni, C.; Garai, M. Energy performance of a ventilation system for an apartment according to the Italian regulation. Int. J. Energy Environ. Eng. 2016, 7, 353–359. [Google Scholar] [CrossRef] [Green Version]
  17. Tzempelikos, A.; Athienitis, A.K. The impact of shading design and control on building cooling and lighting demand. Sol. Energy 2017, 81, 369–382. [Google Scholar] [CrossRef]
  18. Sharma, I.; Dong, J.; Malikopoulos, A.A.; Street, M.; Ostrowski, J.; Kuruganti, T.; Jackson, R. A modeling framework for optimal energy management of a residential building. Energy Build. 2016, 130, 55–63. [Google Scholar] [CrossRef]
  19. Shih, H.C. A robust occupancy detection and tracking algorithm for the automatic monitoring and commissioning of a building. Energy Build. 2014, 77, 270–280. [Google Scholar] [CrossRef]
  20. Erickson, V.L.; Cerpa, A.E. Occupancy based demand response HVAC control strategy. In Proceedings of the 2nd ACM Workshop on Embedded Sensing Systems for Energy-Efficiency in Building, Zurich, Switzerland, 3–5 November 2010; pp. 7–12. [Google Scholar]
  21. Gunay, H.B.; O’Brien, W.; Beausoleil-Morrison, I. Development of an occupancy learning algorithm for terminal heating and cooling units. Build. Environ. 2015, 93 Pt 2, 71–85. [Google Scholar] [CrossRef]
  22. Labeodan, T.; Zeiler, W.; Boxem, G.; Zhao, Y. Occupancy measurement in commercial office buildings for demand-driven control applications—A survey and detection system evaluation. Energy Build. 2015, 93, 303–314. [Google Scholar] [CrossRef] [Green Version]
  23. Nagy, Z.; Yong, F.Y.; Frei, M.; Schlueter, A. Occupant centered lighting control for comfort and energy efficient building operation. Energy Build. 2015, 94, 100–108. [Google Scholar] [CrossRef]
  24. Federspiel, C.C. Estimating the inputs of gas transport processes in buildings Control Syst. Technol. IEEE Trans. 1997, 5, 480–489. [Google Scholar] [CrossRef]
  25. Benezeth, Y.; Laurent, H.; Emile, B.; Rosenberger, C. Towards a sensor for detecting human presence and characterising activity. Energy Build. 2010, 43, 305–314. [Google Scholar] [CrossRef]
  26. Zou, H.; Zhou, Y.; Yang, J.; Spanos, C.J. Towards occupant activity driven smart buildings via WiFi-enabled IoT devices and deep learning. Energy Build. 2018, 177, 12–22. [Google Scholar] [CrossRef]
  27. Tien, P.W.; Wei, S.; Calautit, J.K.; Darkwa, J.; Wood, C. A vision-based deep learning approach for the detection and prediction of occupancy heat emissions for demand-driven control solutions. Energy Build. 2020, 226, 110386. [Google Scholar] [CrossRef]
  28. Wei, S.; Tien, P.W.; Calautit, J.K.; Wu, Y.; Boukhanouf, R. Vision-based detection and prediction of equipment heat gains in commercial office buildings using a deep learning method. Appl. Energy 2020, 277, 115506. [Google Scholar] [CrossRef]
  29. Tien, P.W.; Wei, S.; Calautit, J.; Darkwa, J.; Wood, C. Occupancy heat gain detection and prediction using deep learning approach for reducing building energy demand. J. Sustain. Dev. Energy Water Environ. Syst. 2020. [Google Scholar] [CrossRef]
  30. Ramanan, D.; Forsyth, D.A. Finding and tracking people from the bottom up. In Proceedings of the IEEE Computer Society Conference on Computer Vision and Pattern Recognition, Madison, WI, USA, 18–20 June 2003; Volumn 2, pp. II-467–II-474. [Google Scholar] [CrossRef]
  31. Simonyan, K.; Zisserman, A. Very Deep Convolutional Networks for Large-Scale Image Recognition. arXiv 2014, arXiv:1409.1556. [Google Scholar]
  32. Girshick, R.; Donahue, J.; Darrell, T.; Malik, J. Rich Feature Hierarchies for Accurate Object Detection and Semantic Segmentation. In Proceedings of the 2014 IEEE Conference on Computer Vision and Pattern Recognition, Columbus, OH, USA, 24–27 June 2014. [Google Scholar]
  33. Yuan, L.; Qu, Z.; Zhao, Y.; Zhang, H.; Nian, Q. A convolutional neural network based on TensorFlow for face recognition. In Proceedings of the 2017 IEEE 2nd Advanced Information Technology, Electronic and Automation Control Conference (IAEAC), Chongqing, China, 25–26 March 2017. [Google Scholar]
  34. Zou, J.; Zhao, Q.; Yang, W.; Wang, F. Occupancy detection in the office by analysing surveillance videos and its application to building energy conservation. Energy Build. 2017, 152, 385–398. [Google Scholar] [CrossRef]
  35. Markovic, R.; Grintal, E.; Wölki, D.; Frisch, J.; van Treeck, C. Window opening model using deep learning methods. Build. Environ. 2018, 145, 319–329. [Google Scholar] [CrossRef] [Green Version]
  36. Google Trends, Comparison between Search Terms: Pytorch, Tensorflow and Keras between February 2015–2020. 2020. Available online: https://trends.google.com/trends/explore?date=2014-10-05%202019-05-15&q=Machine%20Learning,Deep%20Learning,IoT,Artificial%20intelligence (accessed on 9 July 2020).
  37. Fonnegra, R.D.; Blair, B.; Díaz, G.M. Performance comparison of deep learning frameworks in image classification problems using convolutional and recurrent networks. In Proceedings of the 2017 IEEE Colombian Conference on Communications and Computing (COLCOM), Cartagena, Colombia, 16–18 August 2017; pp. 1–6. [Google Scholar]
  38. TensorFlow. TensorFlow: An End-to-End Open Source Machine Learning Platform. 2020. Available online: https://www.tensorflow.org/ (accessed on 9 July 2020).
  39. Vázquez-Canteli, J.R.; Ulyanin, S.; Kämpf, J.; Nagy, Z. Fusing TensorFlow with building energy simulation for intelligent energy management in smart cities. Sustain. Cities Soc. 2019, 45, 243–257. [Google Scholar] [CrossRef]
  40. Jo, H.; Yoon, Y.I. Intelligent smart home energy efficiency model using artificial TensorFlow engine. Hum. Cent. Comput. Inf. Sci. 2018, 8, 1–18. [Google Scholar] [CrossRef]
  41. Huang, J.; Sun, C.; Zhu, M.; Korattikara, A.; Fathi, A.; Fischer, I.; Wojna, Z.; Song, Y.; Guadarrama, S.; Murphy, K. Speed/accuracy trade-offs for modern convolutional object detectors. arXiv 2016, arXiv:1611.10012. [Google Scholar]
  42. Galvez, R.L.; Bandala, A.A.; Dadios, E.P.; Vicerra, R.R.P.; Maningo, J.M.Z. Object Detection Using Convolutional Neural Networks. In Proceedings of the TENCON 2018—2018 IEEE Region 10 Conference, Jeju Island, Korea, 28–31 October 2018; pp. 2023–2027. [Google Scholar] [CrossRef]
  43. Phadnis, R.; Mishra, J.; Bendale, S. Objects Talk—Object Detection and Pattern Tracking Using TensorFlow. In Proceedings of the 2018 Second International Conference on Inventive Communication and Computational Technologies (ICICCT), Coimbatore, India, 20–21 April 2018; pp. 1216–1219. [Google Scholar] [CrossRef]
  44. Kim, S.; Kang, S.; Ryu, K.R.; Song, G. Real-time occupancy prediction in a large exhibition hall using deep learning approach. Energy Build. 2019, 199, 216–222. [Google Scholar] [CrossRef]
  45. Ng, A. Coursera. Model Selection and Train/Validation/Test Sets. 2019. Available online: https://www.coursera.org/lecture/machine-learning/model-selection-and-train-validation-test-sets-QGKbr (accessed on 9 July 2020).
  46. Tzutalin, LabelImg. 2015. Available online: https://github.com/tzutalin/labelImg (accessed on 9 July 2020).
  47. He, K.; Zhang, X.; Ren, S.; Sun, J. Spatial Pyramid Pooling in Deep Convolutional Networks for Visual Recognition. IEEE Trans. Pattern Anal. Mach. Intell. 2015, 37, 1904–1916. [Google Scholar] [CrossRef] [PubMed] [Green Version]
  48. Girshick, R. Fast R-CNN. In Proceedings of the 2015 IEEE International Conference on Computer Vision (ICCV), Santiago, Chile, 7–13 December 2015. [Google Scholar]
  49. Ren, S.; He, K.; Girshick, R.; Sun, J. Faster R-CNN: Towards Real-Time Object Detection with Region Proposal Networks. IEEE Trans. Pattern Anal. Mach. Intell. 2015, 39, 1137–1149. [Google Scholar] [CrossRef] [PubMed] [Green Version]
  50. John, P. Review Paper on Object Detection using Deep Learning—Understanding different Algorithms and Models to Design Effective Object Detection Network. Int. J. Res. Appl. Sci. Eng. Technol. 2019, 7, 1684–1689. [Google Scholar] [CrossRef]
  51. IESVE Integrated Environmental Solutions. 2019. Available online: https://www.iesve.com/ (accessed on 9 July 2020).
  52. CIBSE Chartered Institution of Building Services Engineer. Environmental Design: CIBSE Guide, A; CIBSE: London, UK, 2015. [Google Scholar]
  53. Shahzad, S.; Calautit, J.K.; Calautit, K.; Hughes, B.; Aquino, A.I. Advanced personal comfort system (APCS) for the workplace: A review and case study. Energy Build. 2018, 173, 689–709. [Google Scholar] [CrossRef] [Green Version]
  54. Shahzad, S.; Calautit, K.; Wei, S.; Tien, P.W.; Hughes, B. Analysis of the Thermal Comfort and Energy Performance of a Thermal Chair for Open Plan Office. J. Sustain. Dev. Energy Water Environ. Syst. 2020, 8, 373–395. [Google Scholar] [CrossRef]
  55. ASHRAE. Standard 55—Thermal Environmental Conditions for Human Occupancy; ASHRAE: Atlanta, GA, USA, 2017. [Google Scholar]
  56. ASHRAE. ANSI/ASHRAE/IES Standard 90.1-2019—Energy Standard for Buildings Except Low-Rise Residential Buildings; ASHRAE: Atlanta, GA, USA, 2019. [Google Scholar]
  57. TensorFlow, Tensorflow Detection Model Zoo. 2020. Available online: https://github.com/tensorflow/models/blob/master/research/object_detection/g3doc/detection_model_zoo.md (accessed on 9 July 2020).
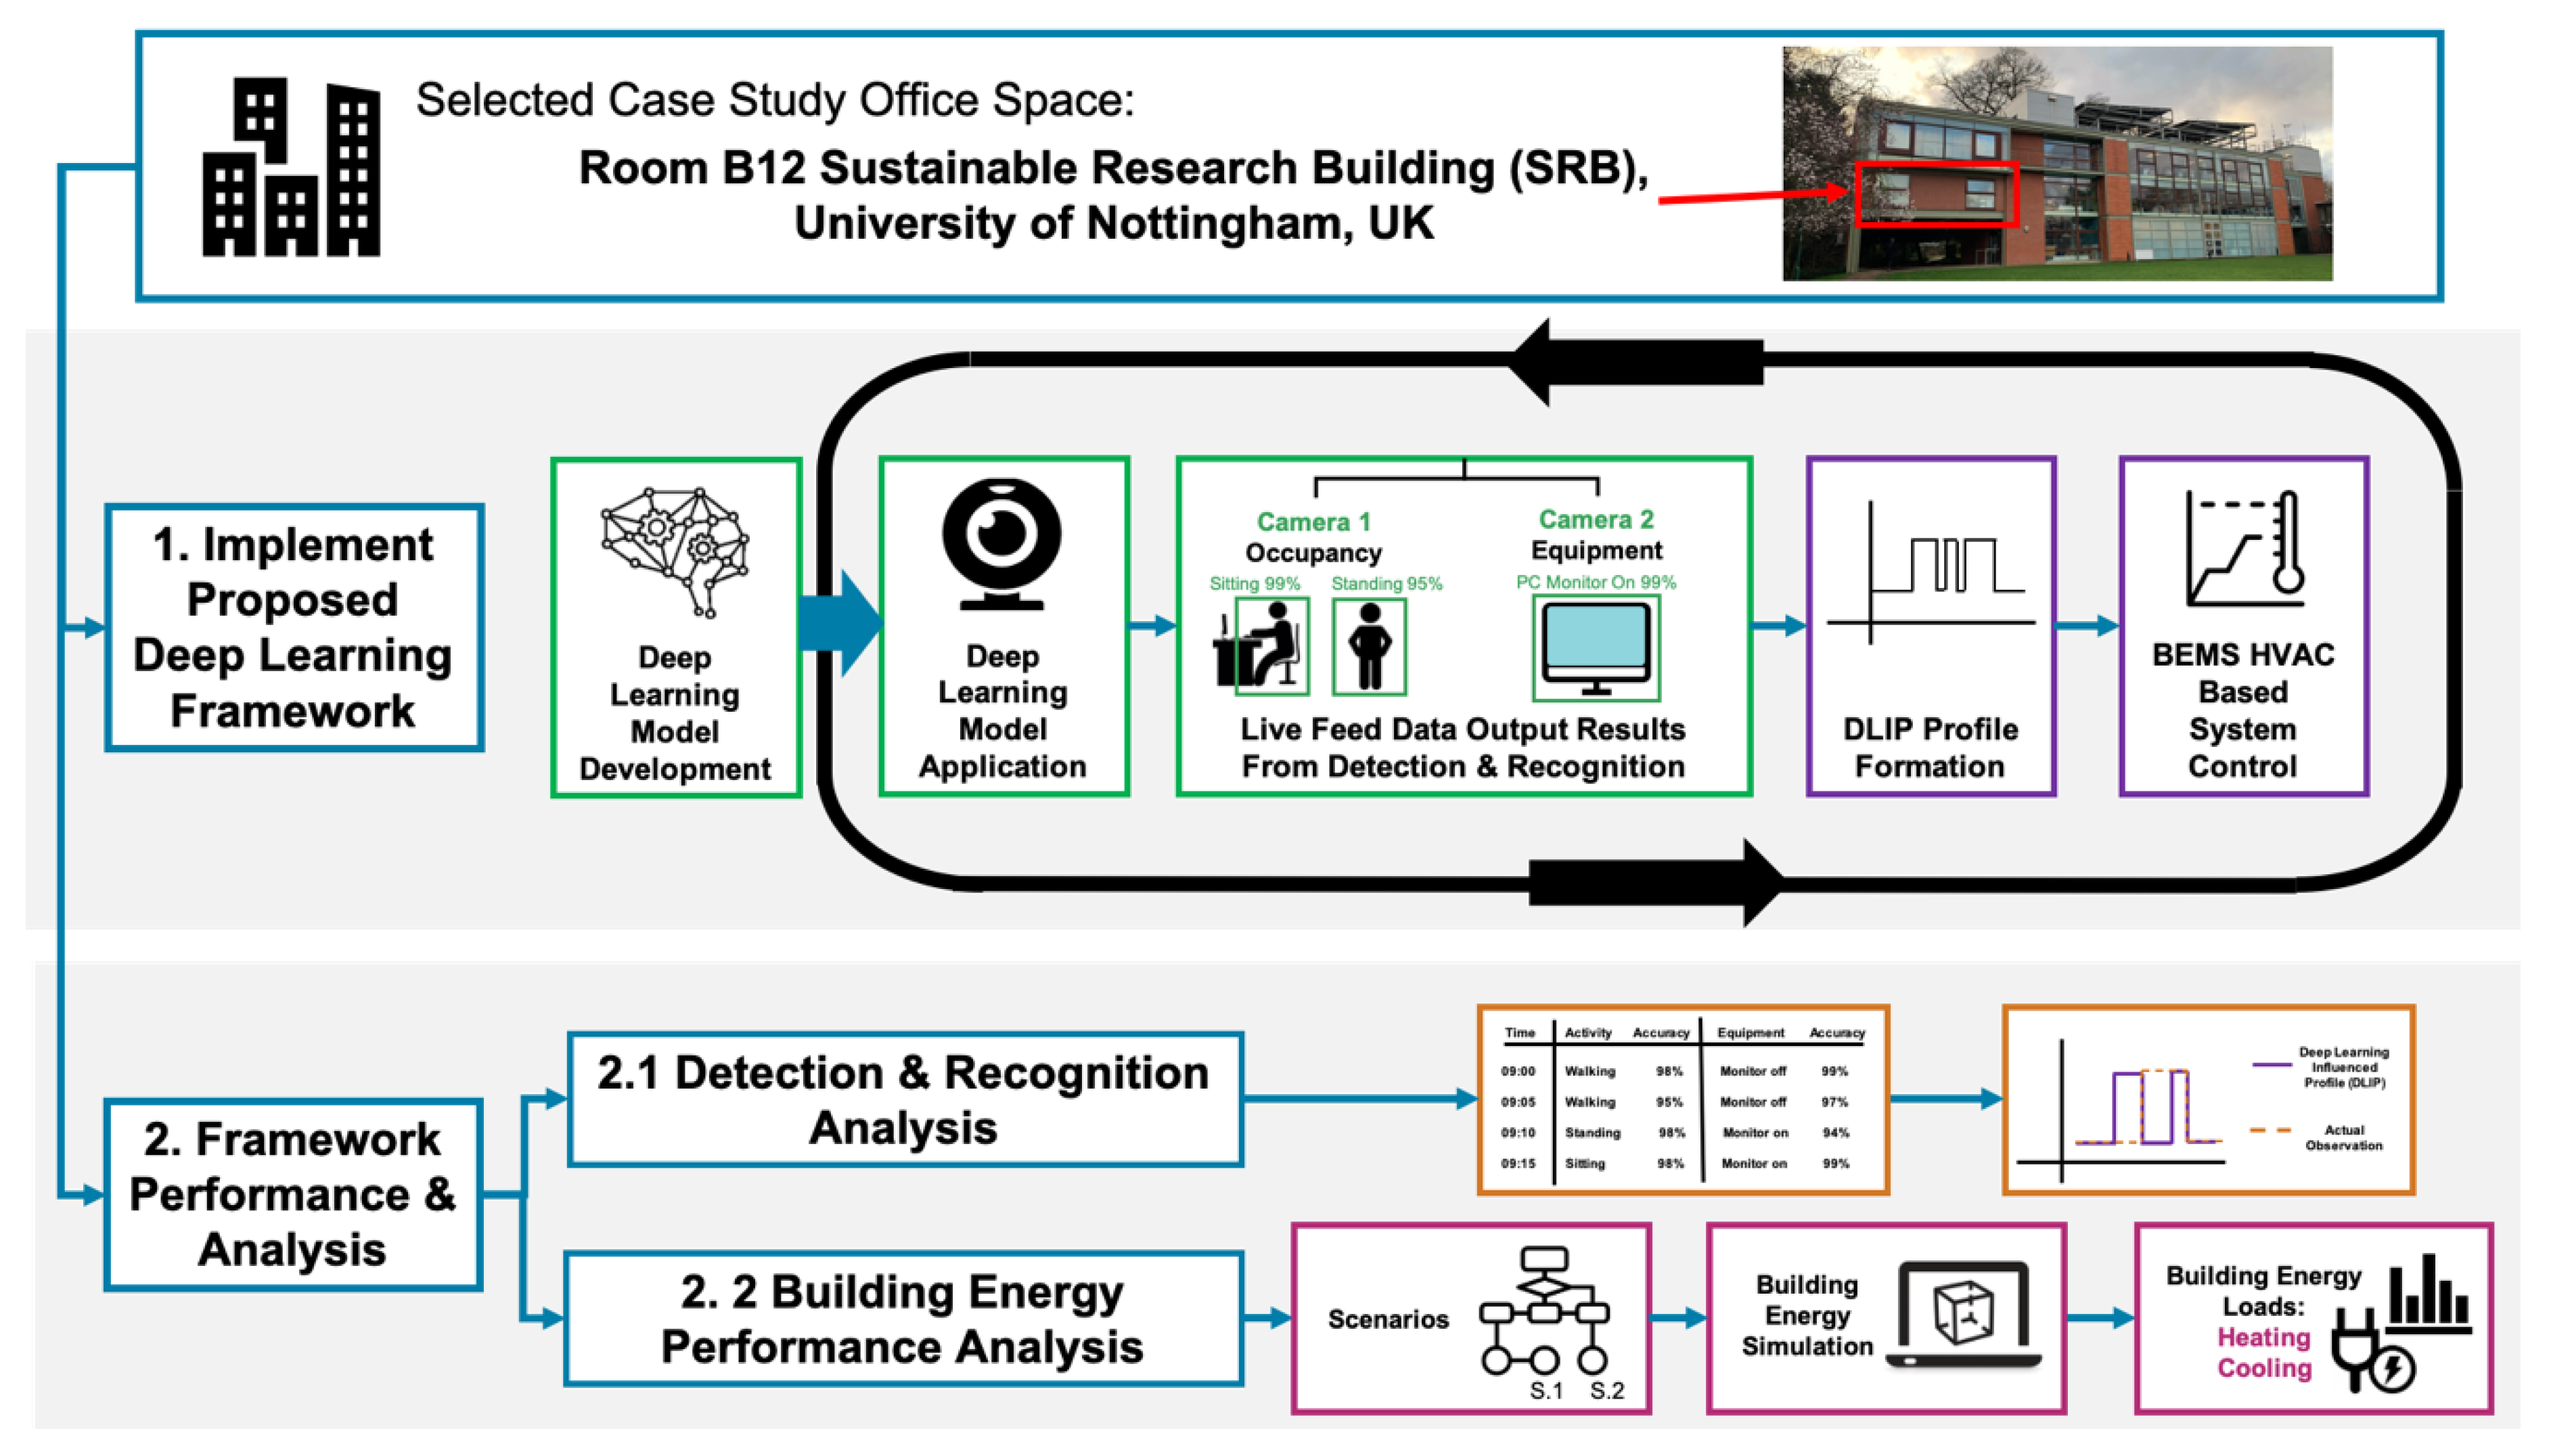
Figure 1. Research framework and method overview.
Energies 14 00156 g001
Figure 2. The workflow of the method for the development and application of the model using the TensorFlow Object Detection API.
Energies 14 00156 g002
Figure 3. The convolutional neural network (CNN) architecture and configuration used for training the models for detection and recognition.
Energies 14 00156 g003
Figure 4. An image of the Sustainable Research Building, with the highlighted office space (Room B12) used as experimental test room for this present study.
Energies 14 00156 g004
Figure 5. Selected office space (Room B12) floor plan with the experimental setup for the test room.
Energies 14 00156 g005
Figure 6. Process of forming the DLIP for (1) equipment, and (2) occupancy activity detection and recognition.
Energies 14 00156 g006
Figure 7. Front and back view of created model of the case study building.
Energies 14 00156 g007
Figure 8. Typical daily static profiles. (a) Equipment profile. (b) Occupancy profile with Typical Office 1 for constant sitting (average conditions) and Typical Office 2 for constant walking (maximum conditions).
Energies 14 00156 g008
Figure 9. Confusion matrix results validating the performance of the (a) equipment and (b) occupancy activity model in terms of classification.
Energies 14 00156 g009
Figure 10. Example of the detection result. (a) Equipment detection—PC monitors, (b) occupancy activity from the performance of the deep learning detection method within the case study office space.
Energies 14 00156 g010
Figure 11. Equipment detection performance results during the initial experimental test.
Energies 14 00156 g011
Figure 12. Occupancy activity detection performance results during the selected experimental test. (a) Percentage of time achieving correct, incorrect and no detections. (b) Performance results based on detection accuracy achieved for each response outcome of the detected activities; walking, standing, sitting and none.
Energies 14 00156 g012
Figure 13. Detected (a) equipment, and (b) occupancy number profiles generated from the application of the deep learning method in the case study office.
Energies 14 00156 g013
Figure 14. Heat-emission-based deep learning profile, (a) equipment and (b) occupancy. DLIP plotted against typical profiles from (Figure 8) for comparison.
Energies 14 00156 g014
Figure 15. Predicted (a) equipment, and (b) occupancy (sensible and latent) gains in the case study building office space based on Scenarios 1–4.
Energies 14 00156 g015aEnergies 14 00156 g015b
Figure 16. Total internal heat gains achieved based on Scenarios 1–4.
Energies 14 00156 g016
Figure 17. (a) Heating and (b) cooling building energy loads for a day in the selected office space based on Scenarios 1–4.
Energies 14 00156 g017aEnergies 14 00156 g017b
Figure 18. (a) Heating and (b) cooling building energy loads distribution for a day in the selected office space comparing Scenarios 1–4.
Energies 14 00156 g018aEnergies 14 00156 g018b
Table 1. The training and testing images for the equipment detection model.
Office EquipmentNo. of Images
Training ImagesTesting ImagesTotal Images
PC Monitor40080480
Table 2. The training and testing images for the occupancy activity detection model.
Occupant ActivityNo. of Images
Training ImagesTesting ImagesTotal Images
None10020120
Napping10020120
Sitting10020120
Standing10020120
Walking10020120
Total500100
Table 3. Occupancy heat emission rates [52].
Occupancy ActivityRate of Heat Emission
Total (W)Sensible (W)Latent (W)
None000
Napping1057035
Sitting1157545
Standing1307555
Walking1457570
Table 4. Summary of the test scenario cases with the assigned building, equipment and occupancy building energy simulation modelling profiles and conditions.
Scenario 1: Constant TypicalScenario 2: Equipment OnlyScenario 3: Occupancy OnlyScenario 4: Both
Image Representation Energies 14 00156 i001 Energies 14 00156 i002 Energies 14 00156 i003 Energies 14 00156 i004
Scenario DescriptionThe deep learning method is not appliedDeep learning equipment detection model used Deep learning occupancy detection model usedBoth equipment and occupancy detection model used
Equipment ProfileTypical Static Profile (Figure 8a)Equipment Deep Learning Influence ProfileConstant Typical (Figure 8a)Equipment Deep Learning Influence Profile
Number of PC Monitor turned on (Equipment) 8Varies according to the actual equipment usage8Varies according to the actual equipment usage and occupancy
Occupancy Profile Constant Typical Occupancy 2 (Figure 8b)Constant Typical Occupancy 2 (Figure 8b)Occupancy Deep Learning Influence ProfileOccupancy Deep Learning Influence Profile
Number of occupants’ present in room33Varies according to the actual occupancyVaries according to the actual occupancy
Occupancy Internal Gains Maximum sensible gain: 75 W/person
Maximum latent gain: 70 W/person
(To meet the maximum total of 145 W/person for the activity of walking)
Heating ProfileConstant Heating (Room set point temperature, 22 °C during office hours)
Cooling ProfileConstant Cooling (Room set point temperature, 22 °C during office hours)
Ventilation ProfileConstant Typical (Maximum ventilation conditions during office hours)
Table 5. Deep learning model training results.
Training Conditions and ResultsEquipment ModelOccupancy Model
Model UsedFaster RCNN with InceptionV2
Total Steps 24,064102,194
Training Duration2 h 24 min6 h 45 min
Average Loss0.10.06
Minimum Loss0.020.000038
Total loss versus the number of training steps Energies 14 00156 i005
Table 6. Equipment detection model performance based on the application of images from the testing dataset.
ClassAccuracyPrecisionRecallF1 Score
PC Monitor—on80.00%0.91430.86000.8889
Table 7. Occupancy activity detection model performance based on the application of images from the testing dataset.
ClassActivityAccuracyPrecisionRecallF1 Score
1Napping96.88%0.94740.90000.9231
2None98.94%0.95241.0000.9758
3Sitting95.88%0.86360.95000.9048
4Standing95.88%0.94440.85000.8947
5Walking97.89%0.95000.95000.9367
Average for all activities97.09%0.93160.93000.9270
Publisher’s Note: MDPI stays neutral with regard to jurisdictional claims in published maps and institutional affiliations.