Abstract
In the manufacturing process of ceramic brick, the step of drying needs the control of process variables to uniformly dry the porous material, producing a good end-product. The majority of numerical simulations involving drying of ceramic materials is performed considering only the solid domain, resulting in a very simplified and limited study. This way, the objective of this work is the analysis of the drying process with hot air of an industrial hollow clay brick inside the oven at different temperatures by using computational fluid dynamic (CFD). The results of the temperature and water mass distribution inside the brick and of air in the oven at different times of the drying process are shown, analyzed and checked with experimental data, and it was obtained in a concordance with the data. An equation to calculate the brick water mass diffusivity depending on the drying air temperature was proposed.
1. Introduction
The production sector of ceramic clay materials needs improvement in quality control. Despite the simplicity of the ceramic manufacturing process, the market is supplied with low quality products, resulting from poor drying—stages of the production chain, which can lead to cracks, deformities or warping. The final product is verified for factors such as resistance and water absorption. A low-quality brick (low resistance) can break easily resulting in waste. This may be the main cause of cracks in the walls, increasing water infiltrations, that may compromise the construction structure of homes and buildings.
The drying process is one of the most complex unit operations that requires a large energy consumption and has a wide industrial application that has been used in different wet materials, such as grains, fruits, vegetables, wood and ceramic products, among others. This operation consists of removing the moisture of materials by using thermal and mechanical mechanisms. The idea is to control judiciously the whole process in order to preserve the quality of the final product. Thus, the optimization of existing drying technologies or the development of newer ones with the purpose of reducing energy costs and time required to reach the desired moisture in the product, with attention to the quality control of the material, is extremely important.
Drying conditions should be determined primarily considering the effects on the quality of the product and the economy of the process or the convenience of the operation, which are sub-factors [1]. The use of high drying time rates in the brick manufacturing process results in large differences in moisture content and temperature within the samples, which causes cracks and deformations. In more severe situations, it can form a relatively impermeable coating of partially dried material, which inhibits the drying progress, and accentuate the inequality of the moisture content in the sample, and consequently enhance the tendency for the material to deteriorate.
When ceramic materials, such as bricks, are manufactured by air optimized processes, it results in less production time, less waste, lower energy consumption, higher quality product, and they can be acquired by the consumer for a more affordable price. For this reason, quality control of the final product is of utmost importance.
Many researches with experimental and theoretical approaches related to the drying process of ceramic bricks have been reported in literature [2,3,4,5,6,7,8,9]. However, these studies are focused on bricks of small dimensions, at a laboratory scale, and few works are related to bricks at the industrial scale and mainly using computational fluid dynamics as the tool of analysis. Furthermore, it can be seen an evident lack of interest in conducting researches focusing on the fluid flow phenomena occurring in the drying environment that directly influences the quality of the final product.
Numerical simulation technologies that study drying processes have presented several advantages over experimental works carried out in laboratories and pilot plants, such as:
- (a)
- The practicality of observing the temperature and moisture gradients, inside the material as it dries;
- (b)
- The possibility of quantifying heat and mass fluxes inside the material over time and space: then, it is possible to control the drying process adequately;
- (c)
- Greater sensitivity to detect the effects of changes in temperature and moisture content inside the material, eliminating uncertainties of experimental tests;
- (d)
- The predictive capacity of the modeling allows the design and optimization of dryers and drying processes, eliminating the construction of the prototype, and reducing costs;
- (e)
- Depending on the problem, numerical simulation can does not require a reduction of scale; enabling the study to be performed on a real scale, giving more physical values to the results which are obtained.
To theoretically describe the drying phenomenon, several mechanisms of moisture migration are proposed in the literature [10,11,12]:
- (a)
- Liquid diffusion due to the concentration gradient;
- (b)
- Vapor diffusion due to the gradient of moisture concentration and partial vapor pressure;
- (c)
- Liquid movement due to capillary forces;
- (d)
- Liquid or vapor flux due to differences in total pressure;
- (e)
- Flux by effusion (Knudsen): important in conditions of high vacuum, as in freeze drying, and occurs when the average free path of the vapor molecules is of the same order of magnitude as the pore diameter;
- (f)
- Flux of liquid due to gravity.
The liquid diffusion theory applied is the simplest of these theories. It only considers moisture diffusion inside the material in the liquid phase, and the effects such as moisture evaporation and vapor transport are disregarded. This theory has been applied with success on the drying of clay [13,14], ceramic tile [15] and ceramic bricks [4,16,17,18].
The existence and maintenance of an appropriated database of the drying process of different ceramic materials provides an in-depth knowledge. Thus, industrial and research engineers can, consequently, propose sufficient changes in the operational parameters for the purpose of process optimization. Furthermore, the use of the CFD tool helps to improve the ceramic brick drying process database, especially with regard to the data accuracy of experimental studies comparison, lowering the number of experimental tests.
In this context, this research is directed to give significant contribution to technological advancement in the ceramic industry, with regards to the improvement of the drying process efficiency, with special attention to the quality of the final product. Its purpose is to identify better drying conditions (optimized process), with less process time, in order to reduce or eliminate dry material waste, by using a CFD analysis. The authors have contributed to the numerical study of the drying ceramic brick considering the mass and heat transfer and fluid flow in the air around the solid in previous works [19,20,21,22].
Therefore, the general objective is to analyze the convective drying of the bricks by CFD, in a three-dimensional approach.
The numerical simulation was performed with the inclusion of the external environment to the brick in the modeling, considering the previously predicted variables by the software—such as convective heat and mass transfer coefficients—by using the velocity at which the air surrounds the ceramic brick, making the process closer to the real. The simulation with the external medium can show that the brick drying is not as symmetrical as it has been reported in the literature.
2. Methodology
2.1. Experimental Procedure
The drying experiments were performed with industrial clay bricks using an oven with controlled temperature and air velocity conditions. In the process, at 10-minute intervals during the drying, data of mass and temperature (at the vertex) of the sample were collected. The drying process was realized until the mass of the brick reached a constant value. Afterward, the sample was kept at a constant temperature for 24 hours inside the oven, with the aim of obtaining a uniform moisture content. Then, the sample was placed inside the oven at 105 °C, for 24 hs, to obtain a dry brick mass [6,23]. The experiments were performed under atmospheric pressure.
A digital balance (accuracy ± 1 g, model KC-01 Western company) measured the mass of the brick, and an infrared thermometer (range from −50 to 1000 °C, model TI 890, Instrutherm) measured the brick temperature [6,23]. A digital vane anemometer (accuracy of ± 2%, model AMI 300, Instrutemp) was used to measure the air velocity, and a thermohygrometer (model HT 208, ICEL) to measure the relative humidity and temperature of the air external to the oven. The clay brick and oven used in the experiments are shown in Figure 1.
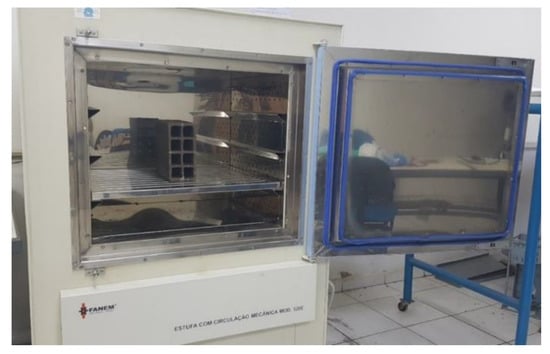
Figure 1.
Ceramic brick in the oven.
2.2. Mathematical and Computational Modeling
2.2.1. The Geometry and Mesh
The study domain (Figure 2) consists of a hollow ceramic brick inside the oven. The brick is placed at a height of 16.5 cm above the base. The ceramic brick has 8 holes [23]. In the numerical simulation, the brick was inserted with the channels open in a position perpendicular to the flow direction (Figure 2), according to the experimental drying.
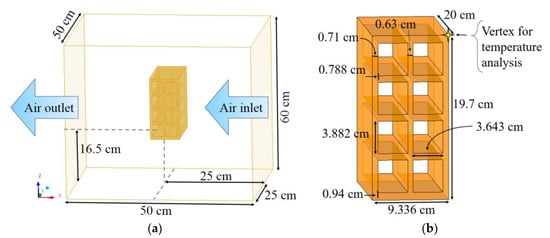
Figure 2.
Geometry representative of the (a) oven with ceramic brick and (b) brick.
The geometry and mesh (Figure 3) were constructed using ICEM CFD 15.0 software. The mesh of the brick was made using the blocking method, having 673,625 hexahedral elements.
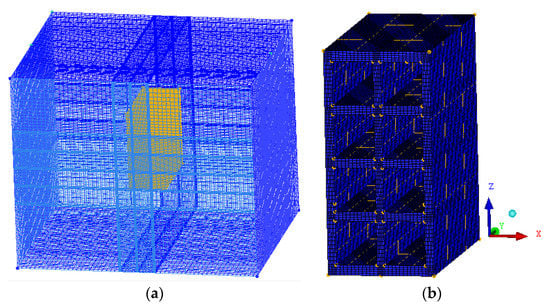
Figure 3.
Mesh of the (a) full domain and (b) brick.
2.2.2. Governing Equations
(a) Solid phase
The water mass (moisture) was inserted like an additional variable. The transport equation for this variable is given by:
where m is the water mass inside the solid material in the time t, and Dms represents the mass diffusion coefficient.
The heat transfer equation is given by:
where ρS is the specific mass, HS is the enthalpy, λS is the thermal conductivity, and TS is the temperature of the solid phase.
(b) Fluid phase
The mass conservation equation for the air in the fluid domain is given as follow:
where is the specific mass of air, and U is the air speed vector in the oven.
The transport equation that describes the flow of water in the fluid domain is given by:
where m is the water mass in the air, and Dmf is the water diffusivity into the air.
The momentum conservation equation is given as follows:
where is the pressure gradient, μeff is the effective fluid dynamic viscosity, and is source term of linear momentum.
The κ-ε turbulence model was chosen to predict the turbulence behavior of the fluid flow in the domain, being considered an industry standard model [24]. Because the low air velocity and the occurrence of a weak vortex formation after the brick, a more careful study of turbulence models has not been carried out. For this model, the effective fluid dynamic viscosity is given by:
where is the fluid dynamic viscosity, and is de turbulent viscosity defined as follows:
where is a constant value equal to 0.09, and κ and ε represent the turbulent kinetic energy and turbulent kinetic energy dissipation rate, respectively.
This turbulence model is classified as a two-equation model [24]:
where , , and are constants of which the values are: 1.44, 1.92; 1.0 and 1.3, respectively, and Pk are parameters that represent the influence of buoyancy forces. More details about this model can be found in the literature [25].
For heat transfer in the fluid, the model of thermal energy was adopted, which is suitable for low speed flows. Disregarding the internal heating by friction effects in the fluid and the source term, the heat transfer equation is given as follows:
λf is the air thermal conductivity, Hf is the air enthalpy and Tf is the air temperature.
2.2.3. Initial and Boundary Conditions
- (a)
- Solid Phase
- Initial conditions:
- ○
- Prescribed temperature, Ts_in;
- ○
- Prescribed water mass, ms_in;
- Boundary conditions:
- ○
- Conservative interface flux at the interface between the solid and fluid phases.
- (b)
- Fluid Phase
- Initial conditions:
- ○
- Prescribed temperature inside the oven, Tf;
- ○
- Prescribed water mass inside the oven, mf_in;
- Boundary conditions:
- ○
- Prescribed air flow rate in the oven inlet,
- ○
- Prescribed water flow rate in the oven inlet,
- ○
- Conservative interface flux at the interface between the solid and fluid phases was used;
- ○
- Average pressure of 101,325 Pa in the oven outlet.
2.2.4. Interface between the Solid and Fluid Phases
To consider the flux of a variable (mass or energy) between the domains, the condition of conservative interface flux at the interface of the brick was adopted. This boundary condition means that the flux of a specified variable of the brick (solid phase) crosses the interface without losses and flows through the air (fluid phase). Then, the equation that the software uses for this type of condition is:
where minterface is the instantaneous water mass of the interface; meq−interface is the water mass at equilibrium conditions, both provided by numerical simulation at the final time of the drying process, and hm is the convective mass transfer coefficient, which is calculated by using the mass diffusivity value.
For the temperature, the convective heat flux equals the diffusive heat flux at the brick surface as follows:
where f is the thermal conductivity of the air; Tinterface is the temperature at the interface at each time instant; Teq−interface is the temperature at equilibrium condition and hC is the convective heat transfer coefficient, which is calculated as a result of the numerical simulation at the final time of the drying process.
2.2.5. Process Parameters and Studied Cases
The thermophysical properties of the brick and air used for all studied cases are:
- Solid domain (clay brick):
- ○
- Specific mass: 1985.8 kg/m3 [23]
- ○
- Specific heat capacity: 1673 J/(kg·K) [23]
- ○
- Thermal conductivity: 1.675 W/(m·K) [26]
- Fluid domain (air as an ideal gas):
- ○
- Specific heat capacity: 1004.4 J/(kg·K) [27]
- ○
- Thermal conductivity: 0.0261 W/(m·K) [27]
- ○
- Dynamic viscosity: 1.831 × 10⁻⁵ kg/(m·s) [27]
Since the temperature gradient in the air is not large enough to cause significant changes in the specific heat capacity, thermal conductivity and dynamic viscosity, it was considered constant along the process. These parameters and density are established in the Ansys CFX software.
The moisture diffusivity of the brick (DS) varied for each air drying temperature. As in the present study, it was decided to use the water mass in the solid and fluid domains, instead of the dry basis moisture content in the material. Thus, the diffusion coefficient of moisture in the brick had to be adapted, for this new condition. In addition, the brick is being considered as a solid domain, unlike the real brick, which is a porous material.
All parameters used in the simulation can be found in Table 1, where Dms is the initial value of the moisture diffusivity of the brick, Ts_in is the brick initial temperature, Urel is the air relative humidity, ms_in is the initial water mass on brick, mf_in is the initial water mass in the oven, is the mass flow rate of air, is the mass flow rate of water, Dmf is the moisture diffusivity in air and ttotal is the total drying time.

Table 1.
Useful data for the numerical simulations of ceramic brick drying.
At the interface between the liquid and solid domains, the condition of conservative flux was inserted, so, the water mass that migrates inside the brick by diffusion, crosses the interface and penetrates in the liquid medium by convection.
All simulations are transient, with a time step of 10 seconds and an average quadratic residue of 10−8.
2.2.6. Statistical Treatment of Data
For providing reliability to the adopted mathematical model, the statistical treatment of dispersion measurement was used.
(a) Dispersion Analysis
The relative error (ERMQ) is given by the sum of the squares of the differences between the numerical values, Vnum, and the experimental values, Vexp, as follows:
where n is the number of experimental points.
The variance of the residuals squares (δV2) is given by:
where np is the number of fitted parameters (number of degrees of freedom) [23]. The effective moisture diffusivity of the brick was obtained by minimizing the values of ERMQ and after the fitting process.
This procedure was carried out for each drying condition, as specified in Table 1.
As the only variable to be fitted is the mass diffusion coefficient, since the other values were taken from the literature or calculated during the numerical simulation, np is equal to 1.
(b) Mass Diffusion Coefficient of the Brick as a Function of Temperature
Diffusion phenomena can occur in fluid (gaseous and liquids) and solid materials. Mass diffusion of gases, vapor and liquids in porous materials is a more complex phenomenon than diffusion in liquids. This fact occurs because porous materials usually have heterogeneous structures, and they may interact with the diffusing compounds. Thus, diffusion velocity of molecules inside these porous solids is lower than in fluids, and this effect alters the physical and chemical process velocities involving mass transfer, and consequently, the mass transport parameters.
According to water migration mechanisms through porous materials listed before, in theory, the estimative and determination of the mass transport parameters associated with each one of these mechanisms can be done in different ways.
When we use, for example, the liquid transport by pressure gradient or capillary forces (capillary flow theory), in general, the transport parameters are the permeability and porosity of the porous material, and Darcy’s law has been utilized appropriately. This theory has been well applied in water flux processes in almost dry brick, concrete block, unsaturated soil, membranes, etc. However, when the liquid transport occurs by concentration gradients (liquid diffusion theory), the main transport parameter is the mass diffusion coefficient, and Fick´s law of diffusion is well utilized. This theory has been applied appropriately in the drying process of different materials, such as wet brick, wood, grains, fruits and vegetables.
It is well-known that the mass diffusion coefficient is strongly dependent on the different geometrical (size, shape and distribution of the pores, shape, dimensions, tortuosity, porosity, constrictivity of the porous material, etc.) and physical (moisture, temperature, pressure, etc.) parameters. However, because of the complex structure of the pore network, some assumptions have been made, and the usual way to estimate the mass diffusion coefficient is to consider it to be constant along the process (effective moisture diffusion coefficient that incorporates all the cited effects).
Thus, moisture diffusivity was considered to be dependent only on the drying air temperature. Its dependence can be described by the Arrhenius equation as follows:
where D0 [m2/s] is the Arrhenius factor, Ea [kJ/mol] is the activation energy for diffusion, R [kJ/(kmol.K)] is the gas constant and T [K] is the absolute temperature.
Effective moisture diffusivity is the key drying parameter that represents the moisture migration velocity and incorporates all moisture transfer mechanisms present in the brick during the process. This parameter is usually determined by the drying curves. Activation energy is another important drying parameter that represents the energy level of water molecules for moisture diffusion and evaporation [28].
Applying the Neperian logarithm on both sides of Equation (15), Equation (16) is found, which resembles the equation of the line with angular coefficient Ea/R and linear coefficient ln(D0):
with the use of Equation (16), a linear regression is found using the Grapher software.
3. Results and Discussion
3.1. Transient Analysis of Mass Transfer
In order to expose the reliability of the mathematical model used in simulations, the comparison between the average water mass of the ceramic brick and the experimental data was made during the process, for all drying-air conditions reported in Table 1. These comparisons are shown in Figure 4, Figure 5 and Figure 6.
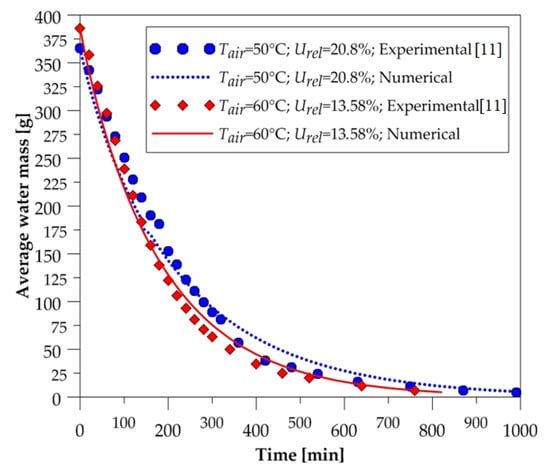
Figure 4.
Average water mass of the brick as a function of the drying time (50 and 60 °C).
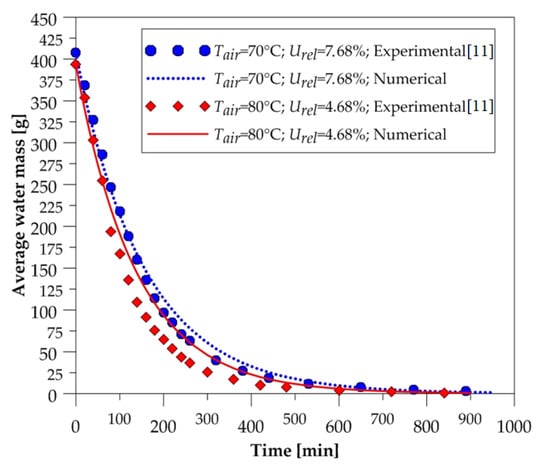
Figure 5.
Average water mass of the brick as a function of the drying time (70 and 80 °C).
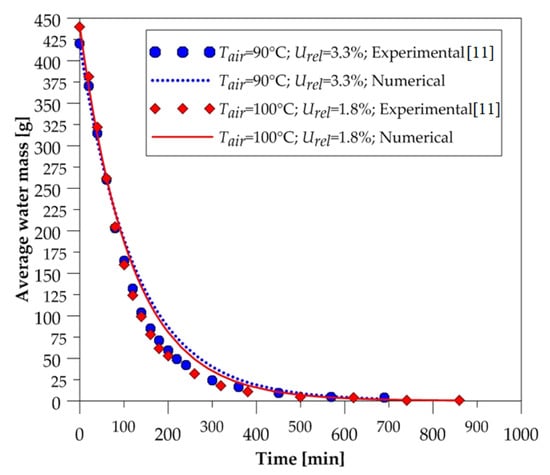
Figure 6.
Average water mass of the brick as a function of the drying time (90 and 100 °C).
After the analysis of these figures, we can state, qualitatively, that the numerical curves fit well with the experimental data. Note that at all drying temperatures, the decay displayed by the numerical results of the amount of water contained in the solid material followed the experimental data behavior. These results give credibility to the mathematical model used in the numerical simulations. Furthermore, we can see that the higher the temperature, the higher the drying rate; thus, the solid dries quickly.
Figure 7 shows the moisture distribution (dry basis) on the brick surface for drying at 90 °C. Due to the flow of drying air from right to left (perpendicular to the ZY plane), it is noted that the superior and inferior vertices on the brick right side, which is in direct contact with the drying air, dries faster compared to other regions of the material.
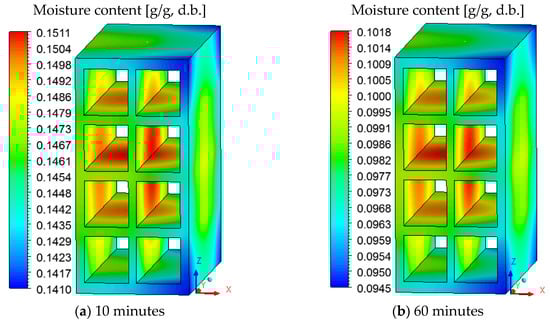
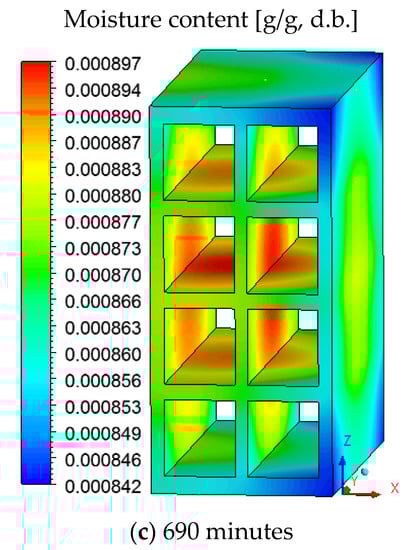
Figure 7.
Moisture content distribution on the brick surface for drying at 90 °C at different durations.
It is also noted that the surface that characterizes the hollow region of the ceramic brick remains wetter than the others, due to the low air flow velocity in this region. This difference in moisture affects the drying process and proves the usefulness of the CFD technique for this purpose.
From the analysis of Figure 7, we state that a 90-degree rotation of the ceramic brick around the Z axis would favor the flow of air in the hollow region and would reduce the difference between the moisture observed on the surface. Thus, due to the position of the material inside the oven, an asymmetric drying occurs.
In simulations where only the domain of ceramic brick is considered [4,23,29,30,31], it is not possible to observe the asymmetry in the variable at the surface of the brick. Asymmetric dehumidification is important to study, as it can cause defects in the brick during burning, such as cracks and deformations.
Figure 8, Figure 9, Figure 10 and Figure 11 show the field of water mass in the oven for drying air at 90 °C. Note that at the initial instant of drying (t = 0 min), the water mass distribution is almost uniform, containing only the mass equivalent to the absolute humidity of the drying air. Throughout the process, it is noticed that the air, when it flows over the brick, transports the mass of water lost by the material. This is clearly observable by the hue in the mass field, especially in the left side region of the brick.
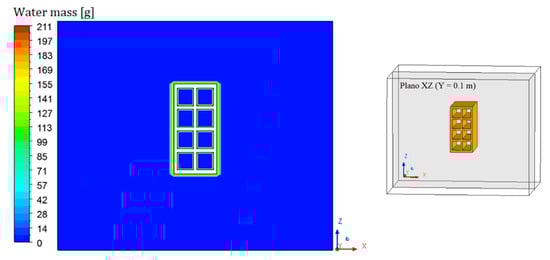
Figure 8.
Water mass distribution inside the oven (Plane XZ) for drying at 90 °C (t = 0 min).
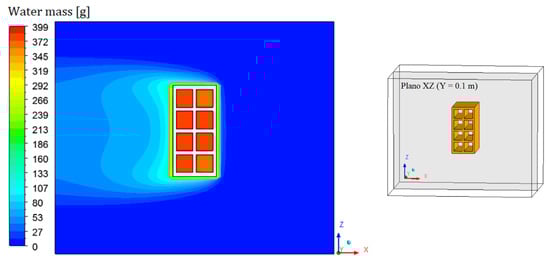
Figure 9.
Water mass distribution inside the oven (Plane XZ) for drying at 90 °C (t = 10 min).
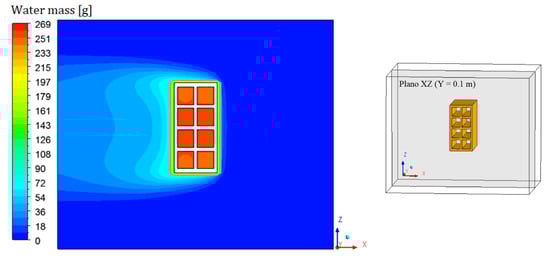
Figure 10.
Water mass distribution inside the oven (Plane XZ) for drying at 90 °C (t = 60 min).

Figure 11.
Water mass distribution inside the oven (Plane XZ) for drying at 90 °C (t = 690 min).
Due to the position of the brick inside the oven, air accumulates in the hollow region of the brick. This justifies the fact that these regions are more difficult to dehumidify, and also to heat up. It is also possible to observe, near the brick surface, a region with a high water–mass gradient and the concentration boundary layer. The results prove that there is a symmetry between the upper and lower part of the XZ plane.
To reach the values of the best mass diffusivity of the brick, several numerical simulations were made, in each drying air conditions. For each temperature, the mass diffusivity varied, producing different drying kinetics, and which the average moisture content values of the brick were compared with experimental data.
Taking the best mass diffusivities values inside the brick (Table 2) for each drying-air condition obtained and applying the Arrhenius equation (Equation (14)), a linear regression was performed.
Table 2.
Mass diffusivities obtained with the simulations.
Figure 12 shows the Neperian logarithm of the mass diffusivity for each air predicted by the simulations and Equation (16). From the analysis of this figure, we can see a linear behavior of this variable, and an excellent concordance between the results, with the coefficient of determination equal to 0.998.
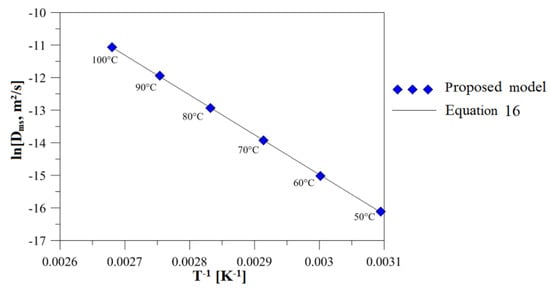
Figure 12.
Mass diffusivity in brick according to Arrhenius Law.
After fitting, the following values were obtained: D0 = 2.577 × 10⁻⁹ m2/s and Ea = 101562.96 J/mol.
The water mass gradient on the three cartesian axes (∂mX/∂X, ∂mY/∂Y e ∂mZ/∂Z) was provided for each time step in the numerical simulation, as well as the overall surface average (∂m/∂). Equation (11) is solved to obtain the convective mass transfer coefficient for each time and for each cartesian axis. From an arithmetic mean, the values of the convective mass transfer coefficient were calculated, as shown in Table 3.
Table 3.
Convective mass transfer coefficients obtained with the simulations.
3.2. Transient Analysis of Heat Transfer
The temporal evolution of the surface temperature of the brick (vertex) is shown in Figure 13, with the temperature measured in the point highlighted by Figure 2b. The same credibility of the model is observed in the material heating curves, where the numerical data are in reasonable concordance with the experimental data.
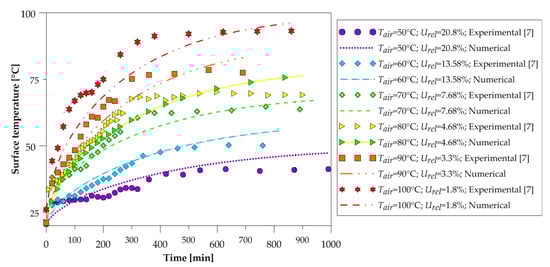
Figure 13.
Temperature of the brick surface as a function of the drying time.
It is observed that the numerical curve presents values below the experimental ones for instances of time below 600 min, after the curve is inverted, and the numerical values are higher than the experimental data. This behavior is common for all temperatures, and this phenomenon may be explained by the fact that constant thermophysical properties have been adopted in the solid domain and due to the energy required to evaporate the product water, was considered negligible in the mathematical model. Thus, the heat transferred to the solid by convection is transformed only into sensitive heat for the heating of the brick, whereas in practice, the heat is transformed into sensitive heat for the heating of the clay mass and the moisture of the brick and heat latent for moisture vaporization.
It is worth mentioning that in order to carry out the experimental measurements, it was necessary to remove the brick from inside the oven to perform the measurements, causing the external air that is colder and more humid to interfere with the measured data. This experimental measurement methodology causes inaccuracies in the experimental results, being one of the causes of the mentioned discrepancy. Furthermore, the measurement of the temperature has been done in the vertex region of the brick, and it is subjected to experimental errors easily.
For an appropriate thermal analysis, the temperature fields on the brick surface are represented in Figure 14. A small temperature variation is perceived in this region, which can reduce the effects of non-uniform drying and, consequently, failures in the material in the firing stage. The results show that the greatest temperature variation always occurs in the first hour of the process.
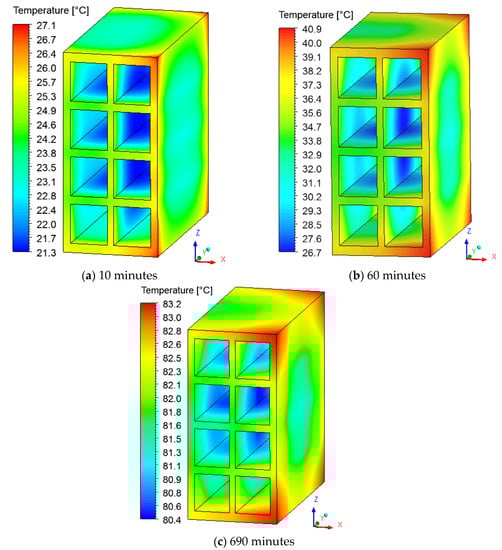
Figure 14.
Temperature distribution on the brick surface for drying at 90 °C, with different durations—(a–c).
The vertices on the right side of the brick reach high temperatures more quickly comparing to other regions, showing that it is not appropriate to assume a constant temperature on the surface of the solid. Due to the air flow direction (from right to left, perpendicular to the ZY plane), the internal part of the brick remains colder than the others region of the brick during the entire drying process. This asymmetric heating shows that the position of the material inside the oven directly affects the temperature gradient in the brick.
Therefore, it is expected that a change in the position of the brick inside the oven completely changes the behavior of the temperature on the surface of the solid. It is important to note that high temperature gradients, caused by uncontrolled drying, can cause various types of defects in the brick, such as cracks, deformations, fissures, among others. These types of problems can occur when using, for example, drying air conditions, a high temperature and velocity, and low relative humidity of the drying air. Obviously, defects arising from the forming process are not being taken into account.
Figure 15, Figure 16 and Figure 17 illustrate the distribution of air temperature inside the oven (Plane XZ) at different drying times and conditions. From the analysis of these figures, we can see that the heat transfer by a spontaneous process occurs from the high temperature (air) to the lower temperature (brick) regions. During drying, the hot air supply heats the brick and, as it passes over the material, it undergoes a slight decrease in its temperature, especially near the brick surface and within the thermal boundary layer. Furthermore, as the air flows from right to left of the brick, there is also a symmetry between the upper and lower part of the material in the XZ Plane.
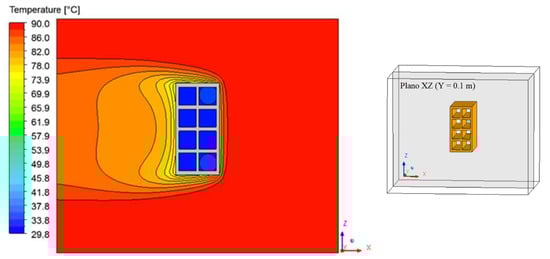
Figure 15.
Air temperature distribution inside the oven (Plane XZ) for drying at 90 °C (t = 10 min).
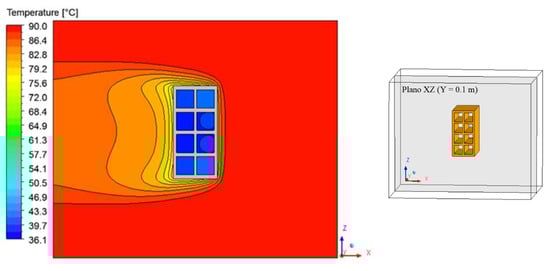
Figure 16.
Air temperature distribution inside the oven (Plane XZ) for drying at 90 °C (t = 60 min).
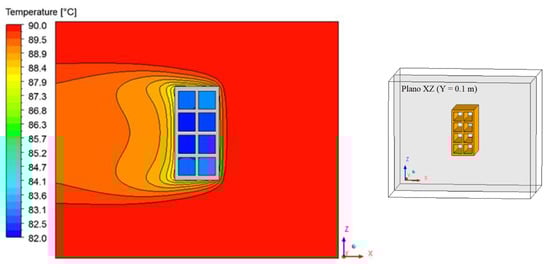
Figure 17.
Air temperature distribution inside the oven (Plane XZ) for drying at 90 °C (t = 690 min).
The greatest temperature variation occurs in the initial drying times, where the brick is at a low temperature and at any temperature of the drying air. It was observed that the largest temperature gradients occur, precisely in the vicinity of the brick surface, corresponding to the thermal boundary layer.
For each instant of time, the results of the numerical simulation provide the values of the convective heat transfer coefficients. Performing an arithmetic mean of the results, the values of this parameter for each drying temperature are reported in Table 4.
Table 4.
Convective heat transfer coefficient obtained with the simulations.
4. Conclusions
According to the numerical results obtained for drying hollow ceramic bricks, it can be concluded that:
- (a)
- The proposed mathematical modeling was adequate, providing numerical results of the temperature at the vertex and water mass of the bricks along the drying process with a good agreement with the experimental data;
- (b)
- The higher the drying air temperature, the faster the heating and drying rates are;
- (c)
- The temperature and moisture content distribution on the brick surface have shown a strong dependence with the direction of air flow inside the oven and drying conditions;
- (d)
- There were variations in both moisture content and temperature on the brick surface and temperature and absolute humidity, showing that a convective boundary condition is more appropriate for describing this process;
- (e)
- The heat and mass transfer coefficients by convection and the mass diffusion coefficient increased with increasing drying air temperature;
- (f)
- The rise in mass diffusivity with the drying-air temperature is in accordance with the Arrhenius law.
Author Contributions
Conceptualization, M.d.V.A.; methodology, M.d.V.A.; R.S.S. and A.G.B.d.L.; software, M.d.V.A.; validation, M.d.V.A. and A.G.B.d.L.; formal analysis, M.d.V.A. and A.G.B.d.L.; investigation, M.d.V.A.; resources, M.d.V.A. and A.G.B.d.L.; data curation, M.d.V.A. and A.G.B.d.L.; writing—original draft preparation, M.d.V.A.; B.R.d.B.C. and A.G.B.d.L.; writing—review and editing, M.d.V.A. and A.G.B.d.L.; visualization, M.d.V.A.; B.R.d.B.C.; R.S.S.; supervision, M.d.V.A. and A.G.B.d.L.; project administration, M.d.V.A.; V.A.A.B.; funding acquisition, M.d.V.A.; B.R.d.B.C.; V.A.A.B.; I.R.d.O.; R.S.S.; G.L.d.O.N.; L.P.d.L.S. and A.G.B.d.L. All authors have read and agreed to the published version of the manuscript.
Funding
This research was funded by CNPQ, CAPES and FINEP.
Acknowledgments
The authors thank CNPQ, CAPES and FINEP (Brazilian Research Agencies) for financial support and the researchers cited in the text that helped in the improvement.
Conflicts of Interest
The authors declare no conflict of interest.
References
- Foust, A.S.; Wenzel, L.A.; Clump, C.W.; Maus, L.; Andersen, L.B. Principles of Unit Operations. Rio Jan. Guanabara Dois S. A 2015, 1. [Google Scholar]
- Batista, V.R.; Nascimento, J.J.S.; Lima, A.G.B. Drying and burning of massive and cast ceramic bricks including dimensional variations and structural damage. Rev. Eletrônica Mater. Process. 2008, 3, 46–61. (In Portuguese) [Google Scholar]
- Batista, V.R.; Nascimento, J.J.S.; Lima, A.G.B. Drying and volumetric retraction of solid and hollow ceramic bricks: A theoretical and experimental investigation. Matéria 2009, 14, 1088–1100. (In Portuguese) [Google Scholar]
- Cadé, M.A.; Nascimento, J.J.S.; Lima, A.G.B. Drying of Holed Ceramic Bricks: An Approach by Finite-Volumes. Matéria 2005, 10, 443–453. (In Portuguese) [Google Scholar]
- Nascimento, J.J.S.; Lima, A.G.B. Experimental Drying of Ceramics Bricks Including Shrinkage. Defect Diffus. Forum 2015, 365, 106–111. [Google Scholar] [CrossRef]
- Silva, J.B.; Almeida, G.S.; Lima, W.C.P.B.; Neves, G.A.; Lima, A.G.B. Heat and Mass Transfer and Volume Variations during Drying of Industrial Ceramic Bricks: An Experimental Investigation. Defect Diffus. Forum 2012, 326, 267–272. [Google Scholar] [CrossRef]
- Lopez, E.M.; Cortes, L.L. Moisture transfer analysis during drying of brick by temperature and relative humidity profiles. Eur. Sci. J. 2012, 9, 109–122. [Google Scholar]
- Pel, L.; Ketelaars, A.A.J.; Adan, O.C.G.; Van Well, A.A. Determination of moisture diffusivity in porous media using scanning neutron radiography. Int. J. Heat Mass Transf. 1993, 36, 1261–1267. [Google Scholar] [CrossRef]
- Gualtieri, A.F.; Ricchi, A.; Gualtieri, M.L.; Maretti, S.; Tamburini, M. Kinetic study of the drying process of clay bricks. J. Therm. Anal. Calorim. 2016, 123, 153–167. [Google Scholar] [CrossRef]
- Brooker, D.B.; Bakker-Arkema, F.W.; Hall, C.W. Drying and Storage of Grains and Oilseeds; AVI Book: New York, NY, USA, 1992; 450p. [Google Scholar]
- Fortes, M.; Okos, M.R. Advances in Drying; Hemisphere Publishing Corporation: Washington, WA, USA, 1980; Volume 1, pp. 119–154. [Google Scholar]
- Strumillo, C.; Kudra, T. Drying: Principles, Science and Design; Gordon and Breach Science Publishers: New York, NY, USA, 1986; 448p. [Google Scholar]
- Augier, F.; Coumans, W.J.; Hugget, A.; Kaasschieter, E.F. On the risk of cracking in clay drying. Chem. Eng. J. 2002, 86, 133–138. [Google Scholar] [CrossRef]
- Van der Zanden, A.J.J.; Schoenmakers, A.M.E.; Kerkhof, P.J.A.M. Isothermal vapour and liquid transport inside clay during drying. Dry. Technol. 1996, 14, 647–676. [Google Scholar] [CrossRef]
- Silva, W.P.; Farias, V.S.O.; Neves, G.A.; Lima, A.G.B. Modeling of water transport in roof tiles by removal of moisture at isothermal conditions. Heat Mass Transf. 2012, 48, 809–821. [Google Scholar] [CrossRef]
- Tomas, S.; Skansi, D.; Sokele, M. Convection drying of porous material. Ceram. Int. 1994, 20, 9–16. [Google Scholar] [CrossRef]
- Van der Zanden, A.J.J.; de Wit, M.H. A procedure to measure the diffusion coefficient of water in brick as a function of the water concentration. Dry. Technol. Int. J. 2012, 30, 526–534. [Google Scholar] [CrossRef]
- Telljohann, U.; Junge, K.; Specht, E. Moisture diffusion coefficients for modeling the first and second drying sections of green bricks. Dry. Technol. 2008, 26, 855–863. [Google Scholar] [CrossRef]
- Araújo, M.V.; Santos, R.S.; Silva, R.M.E.; Lima, A.G.B. Drying of Industrial Hollow Ceramic Brick: Analysis of the Moisture Content and Temperature Parameters. Defect Diffus. Forum 2017, 380, 72–78. [Google Scholar] [CrossRef]
- Araújo, M.V.; Delgado, J.M.P.Q.; Barbosa de Lima, A.G. On the Use of CFD in Thermal Analysis of Industrial Hollow Ceramic Brick. Diffus. Found. 2017, 10, 70–82. [Google Scholar] [CrossRef]
- Araújo, M.V.; Santos, R.S.; Silva, R.M.; Nascimento, J.B.S.; Santos, W.R.G.; Lima, A.G.B. Drying of Industrial Hollow Ceramic Brick: A Numerical Analysis Using CFD. Defect Diffus. Forum 2019, 391, 48–53. [Google Scholar] [CrossRef]
- Araújo, M.V.; Pereira, A.S.; Oliveira, J.L.; Brandão, V.A.A.; Brasileiro Filho, F.; De, A.; Silva, R.M.; Lima, A.G.B. Industrial Ceramic Brick Drying in Oven by CFD. Materials 2019, 12, 1612. [Google Scholar] [CrossRef]
- Silva, J.B. Simulation and Experimentation of Drying Ceramic Bricks. Ph.D. Thesis, Federal University of Campina Grande, Campina Grande, Brazil, 2009; 173p. (In Portuguese). [Google Scholar]
- Inc Ansys. NSYS CFX-Solver Theory Guide; Inc Ansys: Canonsburg, PA, USA, 2013; 356p. [Google Scholar]
- Araújo, M.V. Numerical Study of the Water and Oil Biphasic Flow in T-Connections in the Presence of Leak. Master’s Thesis, dissertation in Chemical Engineering, Federal University of Campina Grande, Campina Grande, Brazil, 2014; 87p. (In Portuguese). [Google Scholar]
- Almeida, G.S. Simulation and Experimentation of Red Ceramic Drying in Industrial Thermal Systems. Ph.D. Thesis, Federal University of Campina Grande, Campina Grande, Brazil, 2009; 189p. (In Portuguese). [Google Scholar]
- Çengel, Y.A.E.; Ghajar, A.J. Heat and Mass Transfer: Fundamentals & Applications; AMGH: Porto Alegre, Brazil, 2012. (In Portuguese) [Google Scholar]
- Corrêa, P.C.; Resende, O.; Goneli, A.L.D.; Botelho, F.M.; Nogueira, B.L. Determination of the liquid diffusion coefficient of beans. Braz. J. Agro Ind. Prod. 2006, 8, 117–126. (In Portuguese) [Google Scholar]
- Silva, J.B.; Almeida, G.S.; Lima, W.C.P.B.; Neves, G.A.; Lima, A.G.B. Heat and mass diffusion including shrinkage and hygrothermal stress during drying of holed ceramics bricks. Defect Diffus. Forum 2011, 312, 971–976. [Google Scholar] [CrossRef]
- Silva, W.P.; Silva, C.M.D.P.S.; Silva, L.D.; Farias, V.S.O. Drying of clay slabs: Experimental determination and prediction by two-dimensional diffusion models. Ceram. Int. 2013, 39, 7911–7919. [Google Scholar] [CrossRef]
- Shokouhmand, H.; Abdollahi, V.; Hosseini, S.; Vahidkhah, K. Performance optimization of a brick dryer using porous simulation approach. Dry. Technol. Int. J. 2011, 29, 360–370. [Google Scholar] [CrossRef]


© 2020 by the authors. Licensee MDPI, Basel, Switzerland. This article is an open access article distributed under the terms and conditions of the Creative Commons Attribution (CC BY) license (http://creativecommons.org/licenses/by/4.0/).