Combined Cluster Analysis and Global Power Quality Indices for the Qualitative Assessment of the Time-Varying Condition of Power Quality in an Electrical Power Network with Distributed Generation

 ,
,  ,
,  ,
,  and
and
Abstract
1. Introduction
- Sacasqui et al. [39] present an application of grey clustering with entropy weight methodology. The proposed solution was used to calculate a unified quality index of distributed electricity. Their research is based on [40], where a new unified index was proposed, as well as a network model. The model consists of a 138 kV system, wind energy system, hybrid wind-photovoltaic-fuel cell system and the load. The PQ data consist of current total harmonic distortion, voltage total harmonic distortion, sag, frequency deviation, instantaneous flicker level, and power factor. The unified index is calculated for different working conditions using gray CA and entropy weight for the measurement points separately. The research is based on simulations.
- The work of Song et al. [41] concerns the application of cluster analysis combined with a support vector machine for the prediction of PQ indexes. The real measurement data from a 35 kV substation are processed. The database contains selected PQ parameters including frequency deviation, voltage unbalance, and total harmonic distortion (THD) in voltage, as well as weather conditions and data on other associated factors. In the described article, CA was used to obtain implicit classifications of indexes. The analysis concerns a single measurement point.
- Florencias-Oliveros et al. [42] present the analysis of recorded signals representing different disturbances. The proposed index realizes a comparison of the variance values, skewness, and kurtosis connected with each cycle, versus the ideal signal. Then, the CA is used to create a classification of the disturbances using proposed PQ index.
- Application of cluster analysis for the data collected from several measurement points distributed in the supply network of a mining industry in order to achieve suitable identification of different working conditions of the observed network. This approach treats the collected data as a common database more representative of the observed area than particular measurement points.
- New synthetic global power quality indices are used for the assessment of groups of PQ data identified by cluster analysis. The proposed definition of the GPQI consists of a set of classical PQ parameters based on a 10-min aggregation interval; however, it is also extended by selected parameters based on a 200-ms aggregation interval. The aim of extending the proposed GPQI definition with parameters related to a 200-ms aggregation interval is to enhance the sensitivity of the obtained global index. This proposed approach is tested by investigating the influence of the factors which comprise the proposed global power quality index on the sensitivity of the assessment.
- The proposed approach of using GPQIs leads to a straightforward comparison of the clusters in terms of a generalized assessment of the power quality conditions, which in turn finally allows a comparative assessment of different working conditions of the investigated network to be performed. The indicated clusters, which represent different working conditions, may be easily compared using a single GPQI for each of the measurement points.
2. Global Power Quality Indices
3. Results of Power Quality Assessment Using Cluster Analysis and Global Power Quality Indices
3.1. Cluster Analysis—Identification of the Power Quality Data Representing Different PQ Conditions Due to the Impact of DG
3.2. Qualitative Assessment of the Determined Clusters Based on the Proposed Global Power Quality Indices
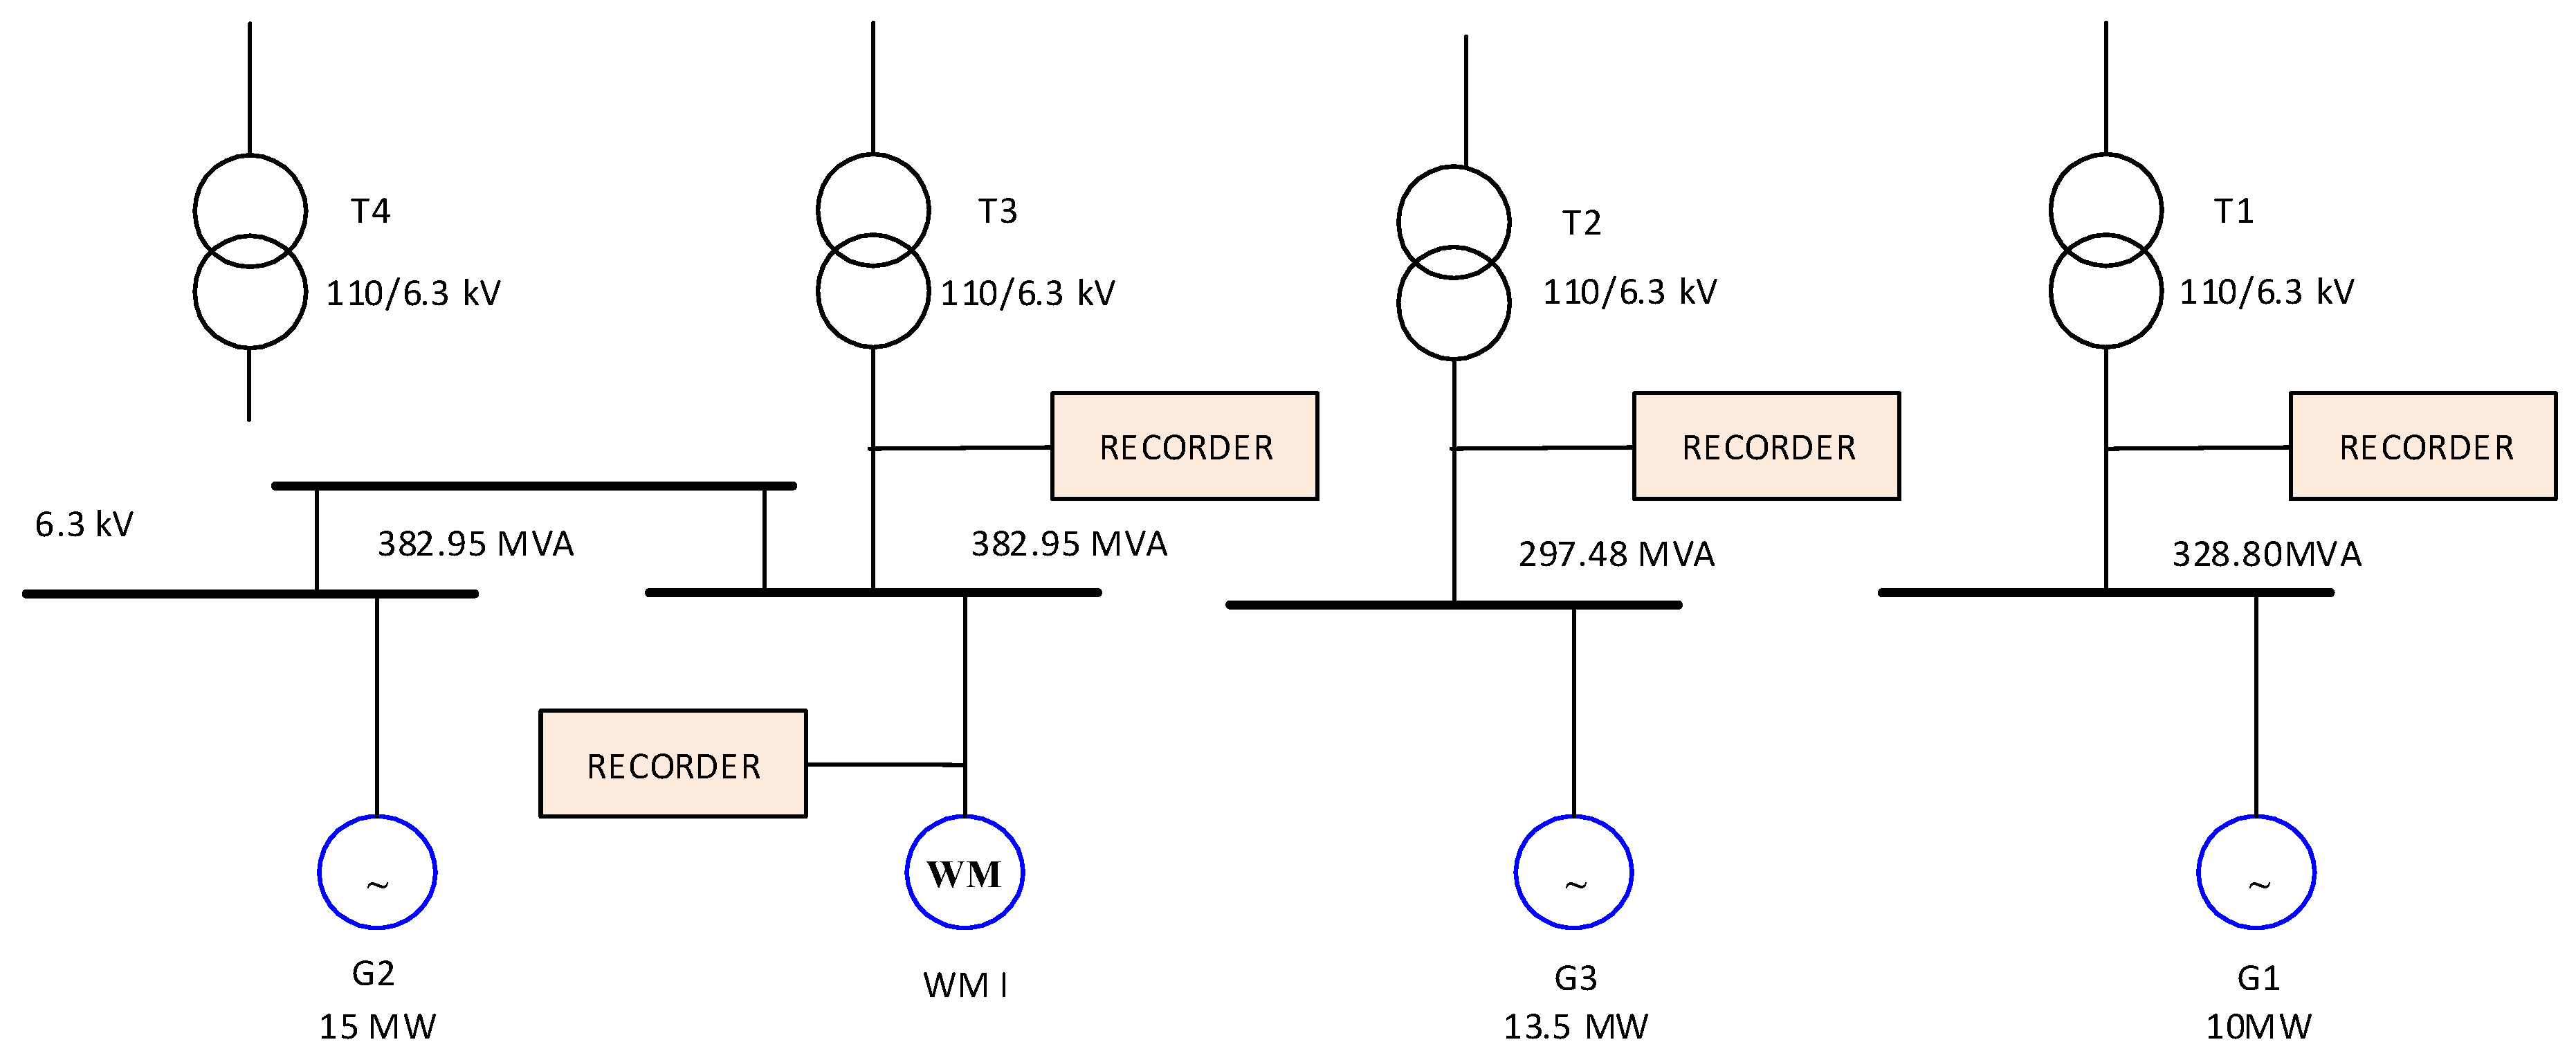
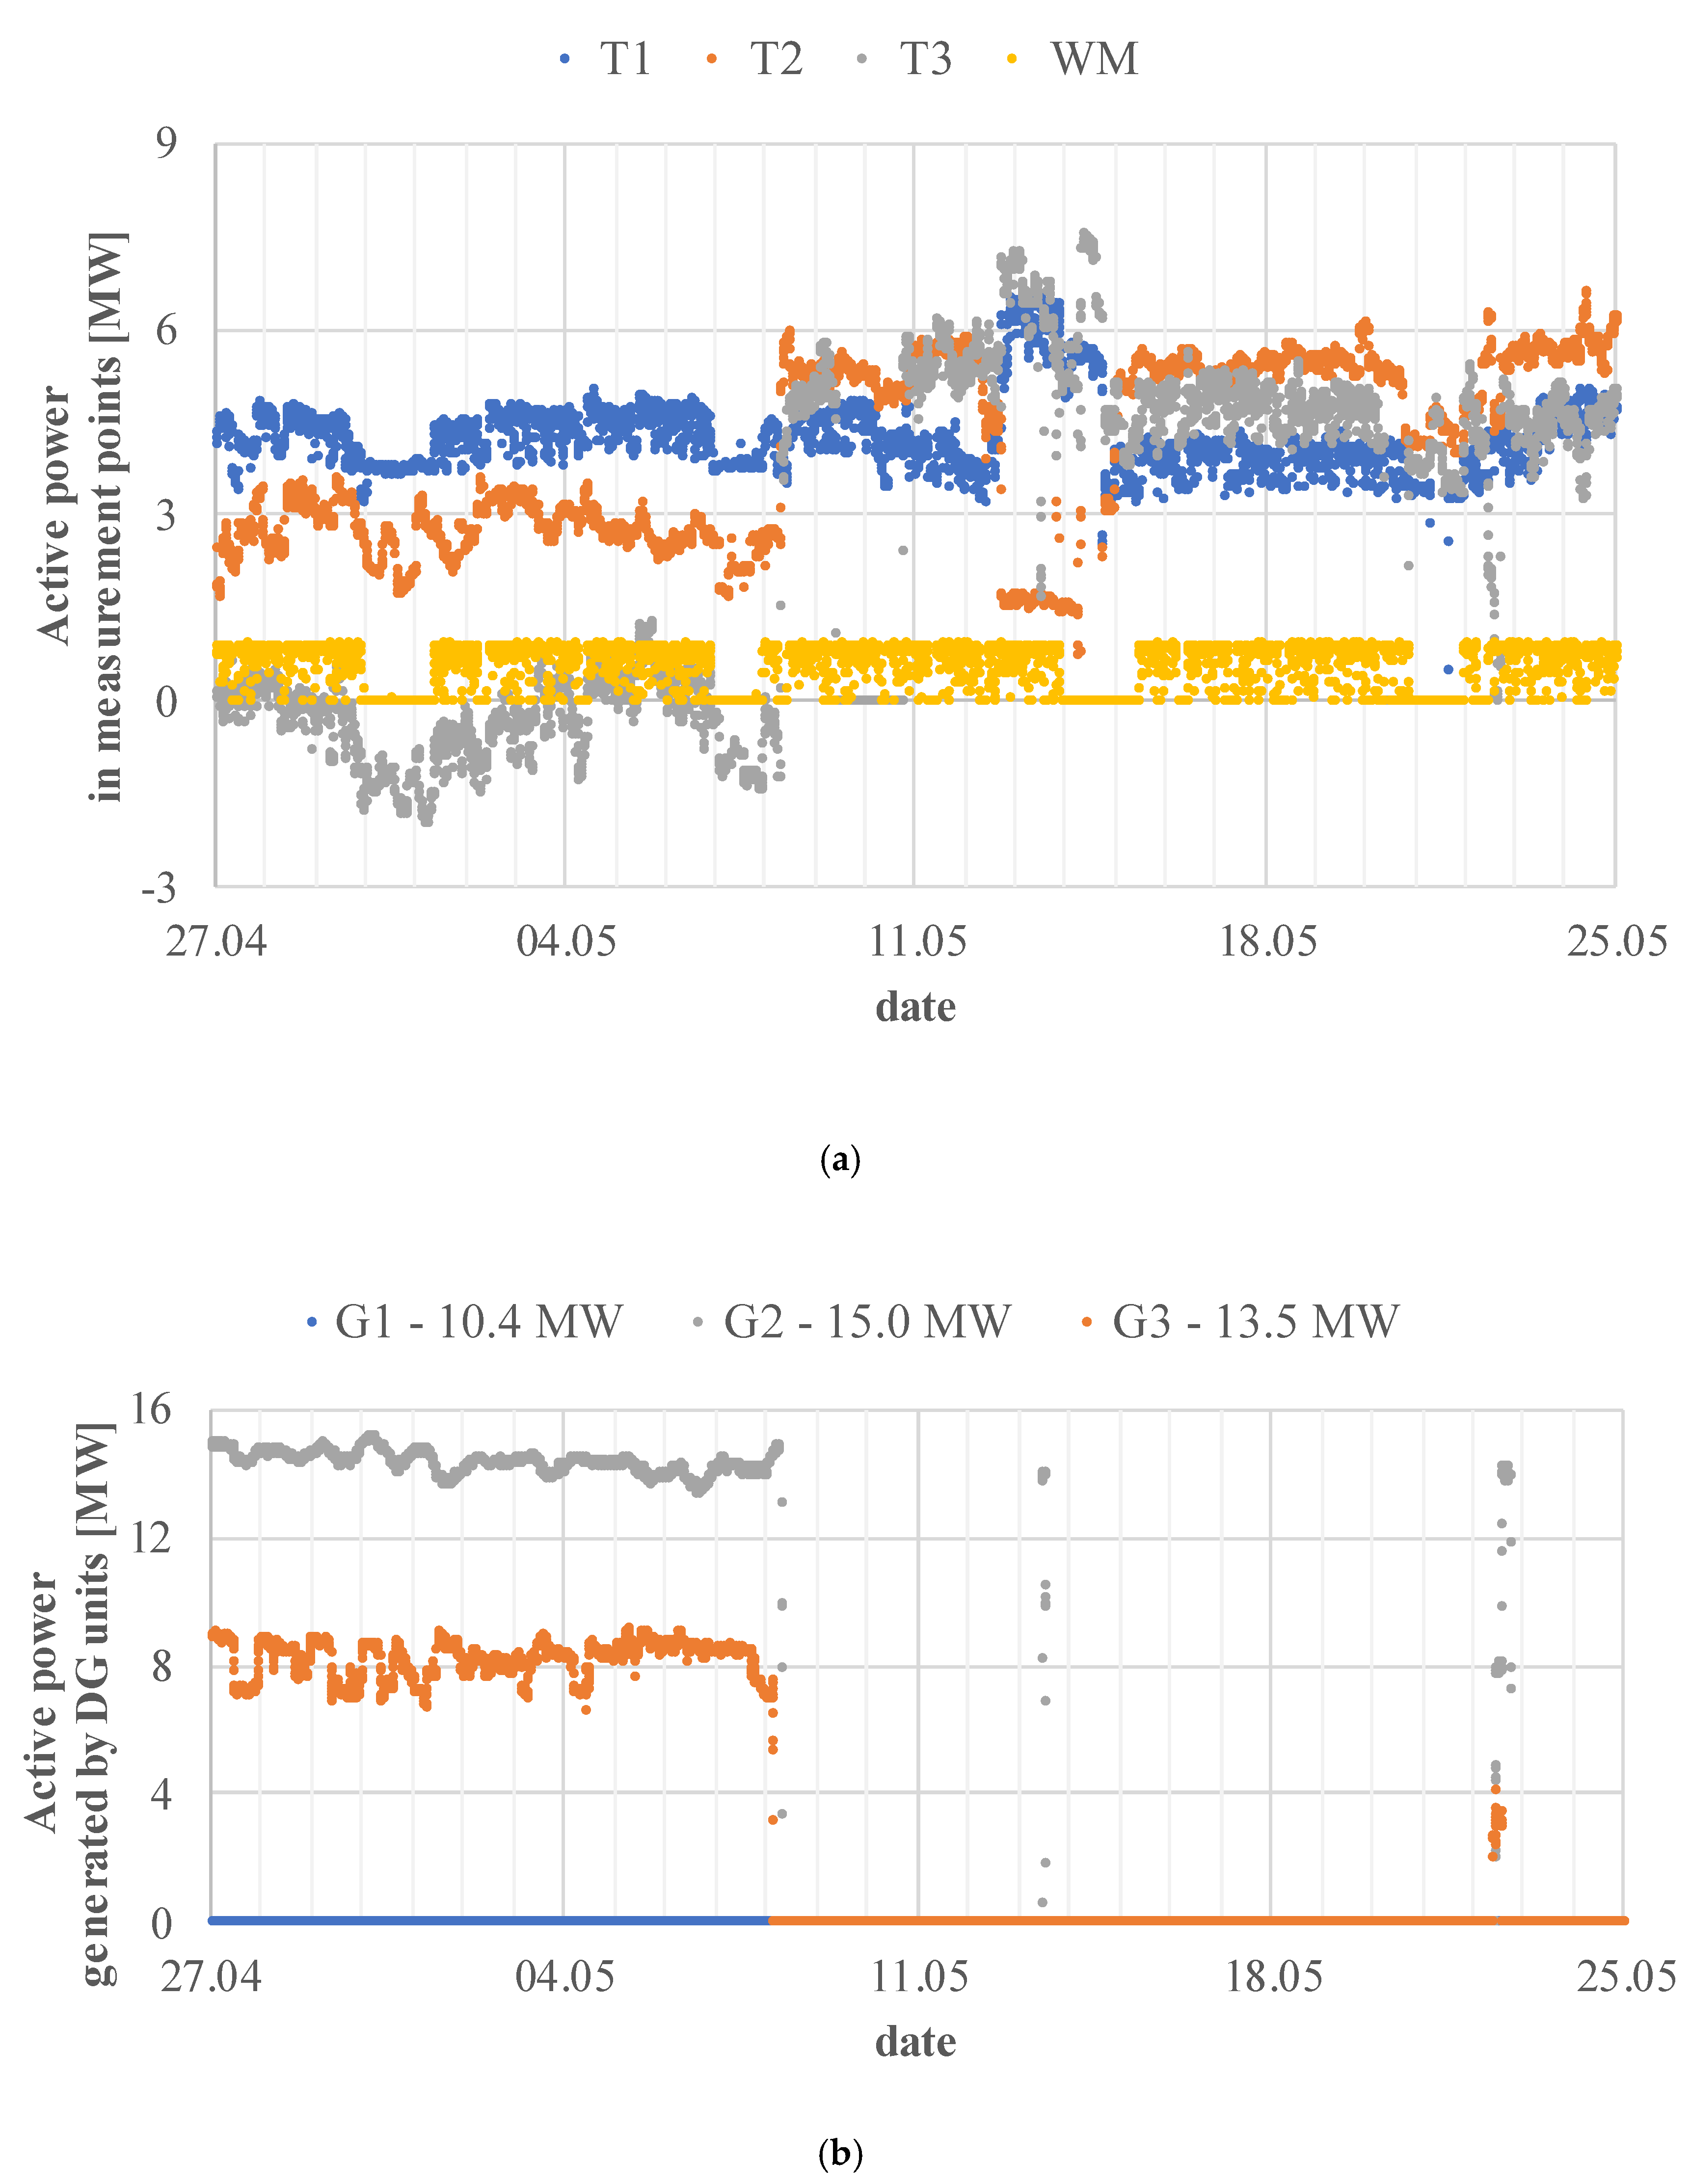
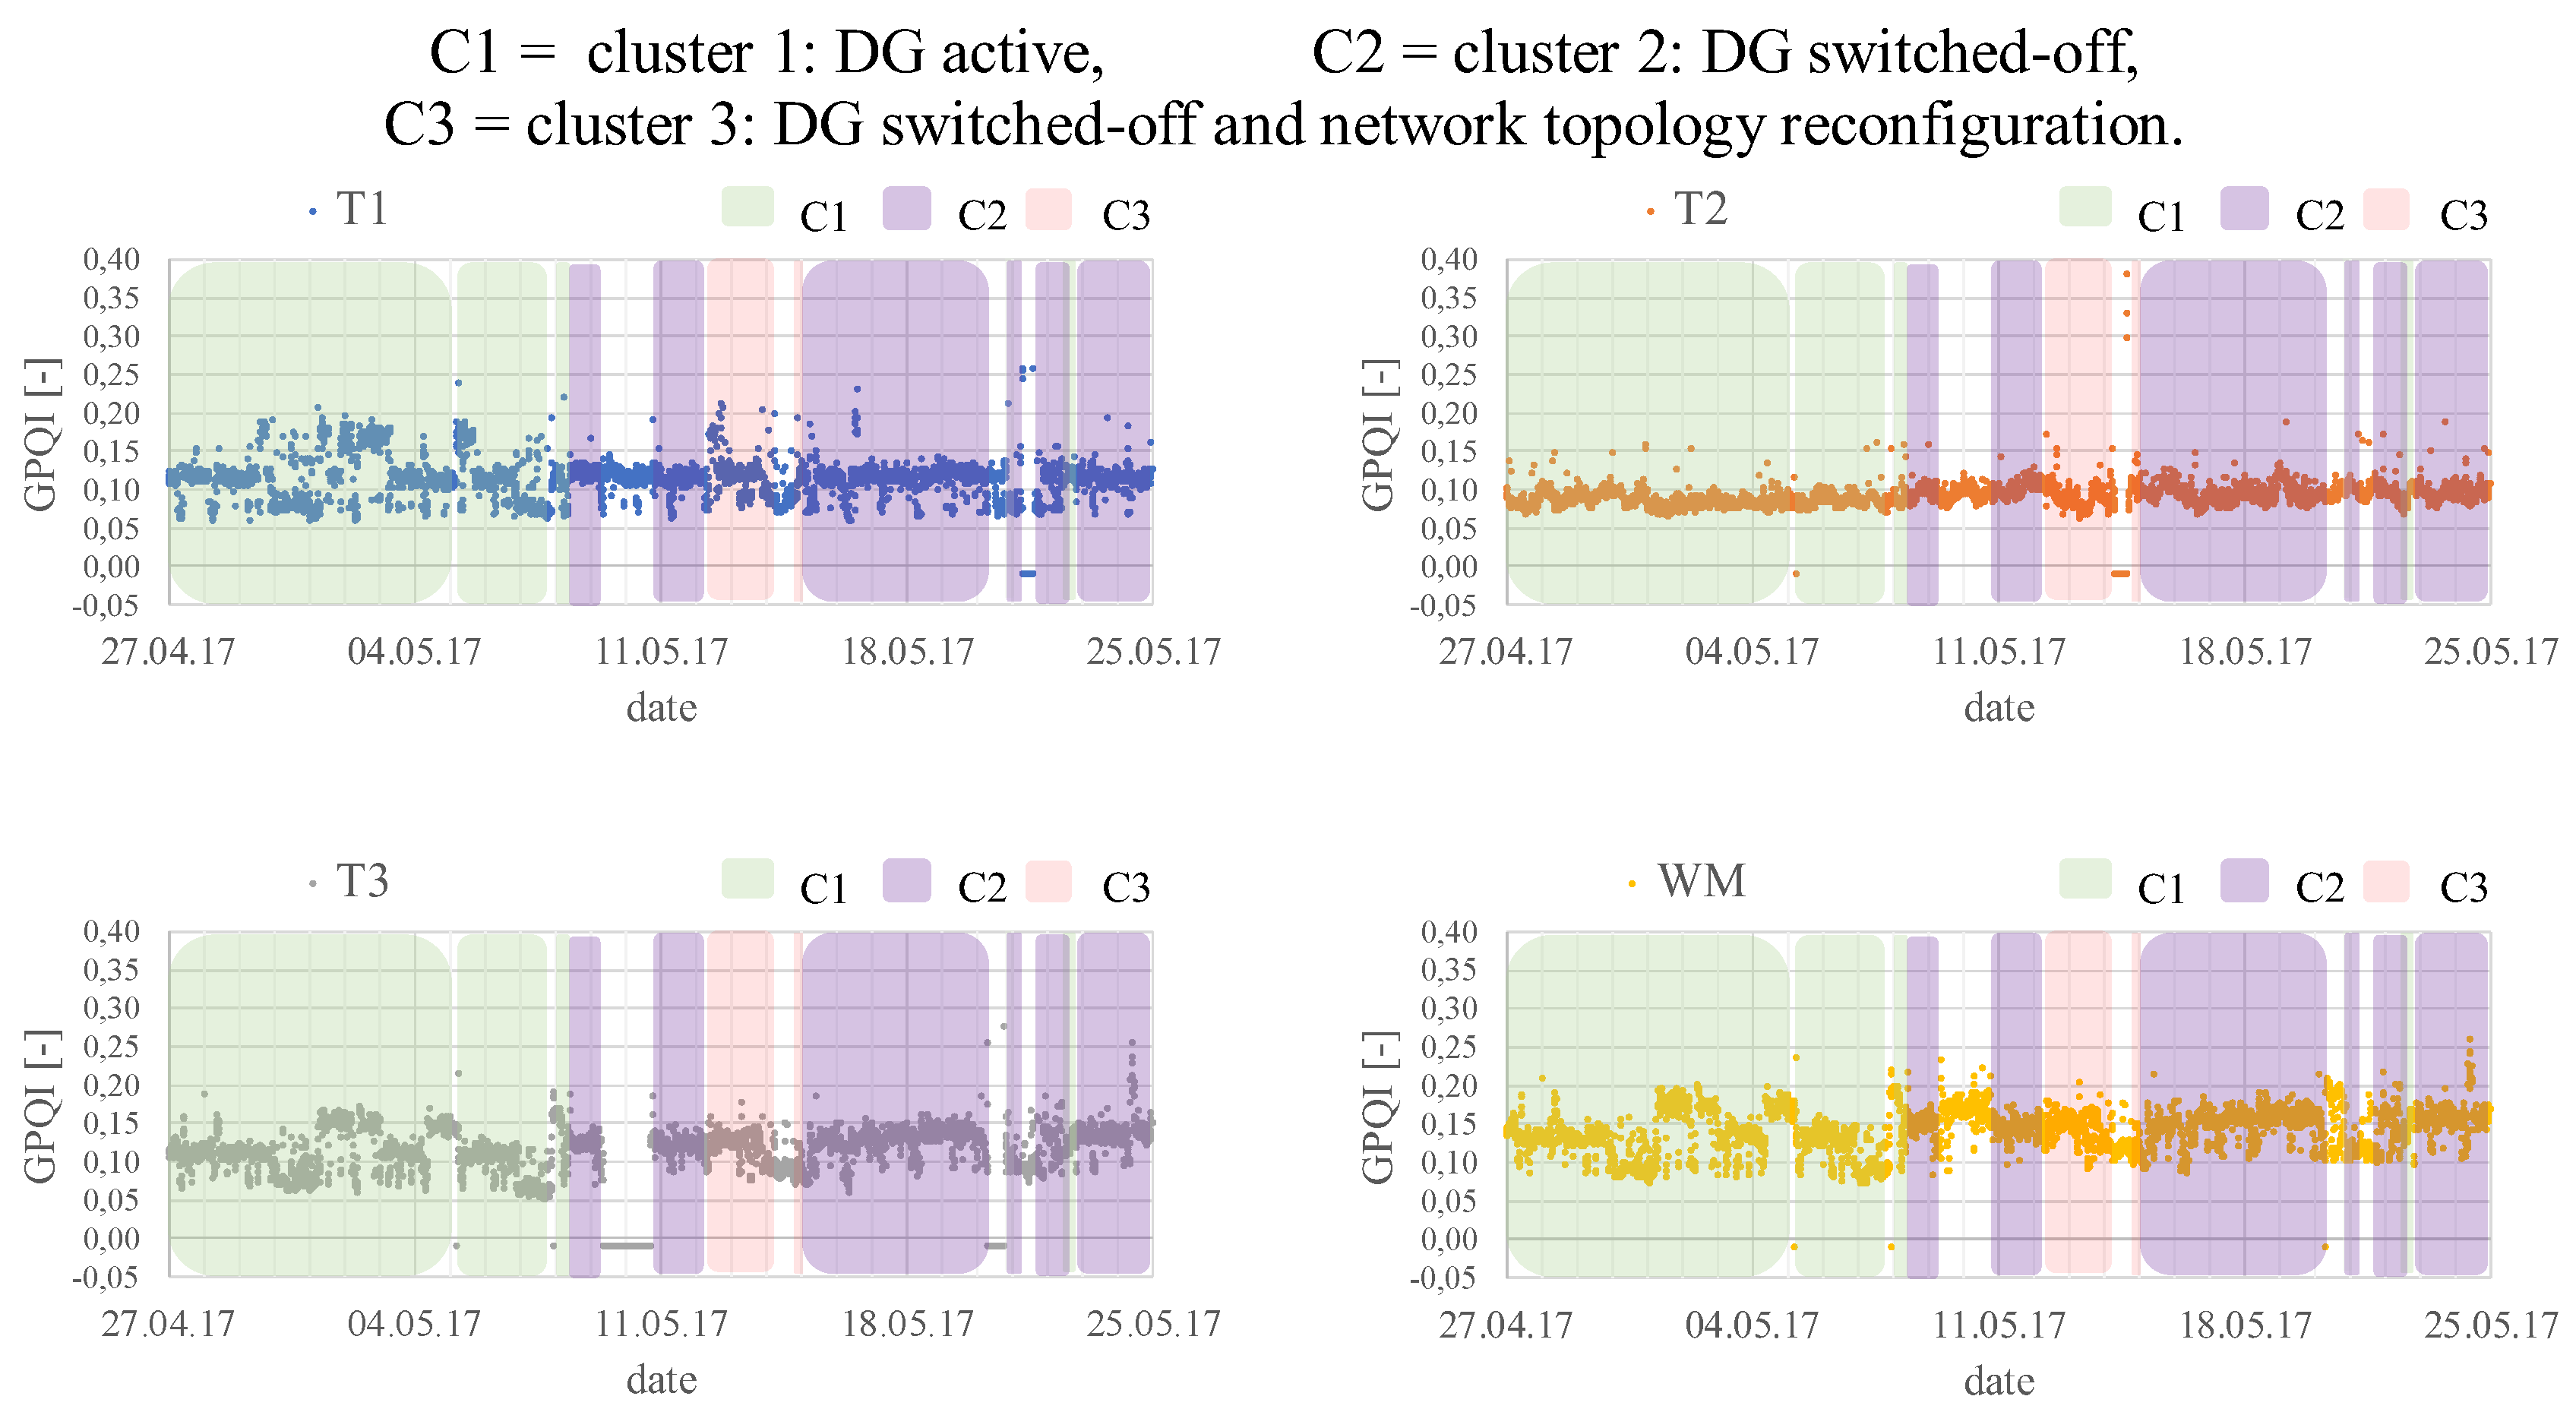
- Transformers T2 and T3, as well as the connection point of the welding machine WM, had the highest level of ADI for cluster 2 when the DG was switched off, and the lowest for cluster 1 when the DG was active. Distributed generation units were connected directly to T2 and T3 and the impact of the DGs was identified.
- Transformer T1 had relatively higher ADI values for cluster 1 when the DG was active, and the lowest for cluster 2 when the DG was switched off. However, there was active generation directly connected to transformer T1.
- The highest level of ADI was recognized in the outcoming feeder that supplies the welding machine which is a significant load with highly time-varying nature.
- Referring to cluster 1 when the DG was active, the ADI had the lowest level for T2, then T3, and the highest for T1.
- Referring to cluster 2 when the DG was switched off, the ADI had the lowest level for T2, and the highest for T3.
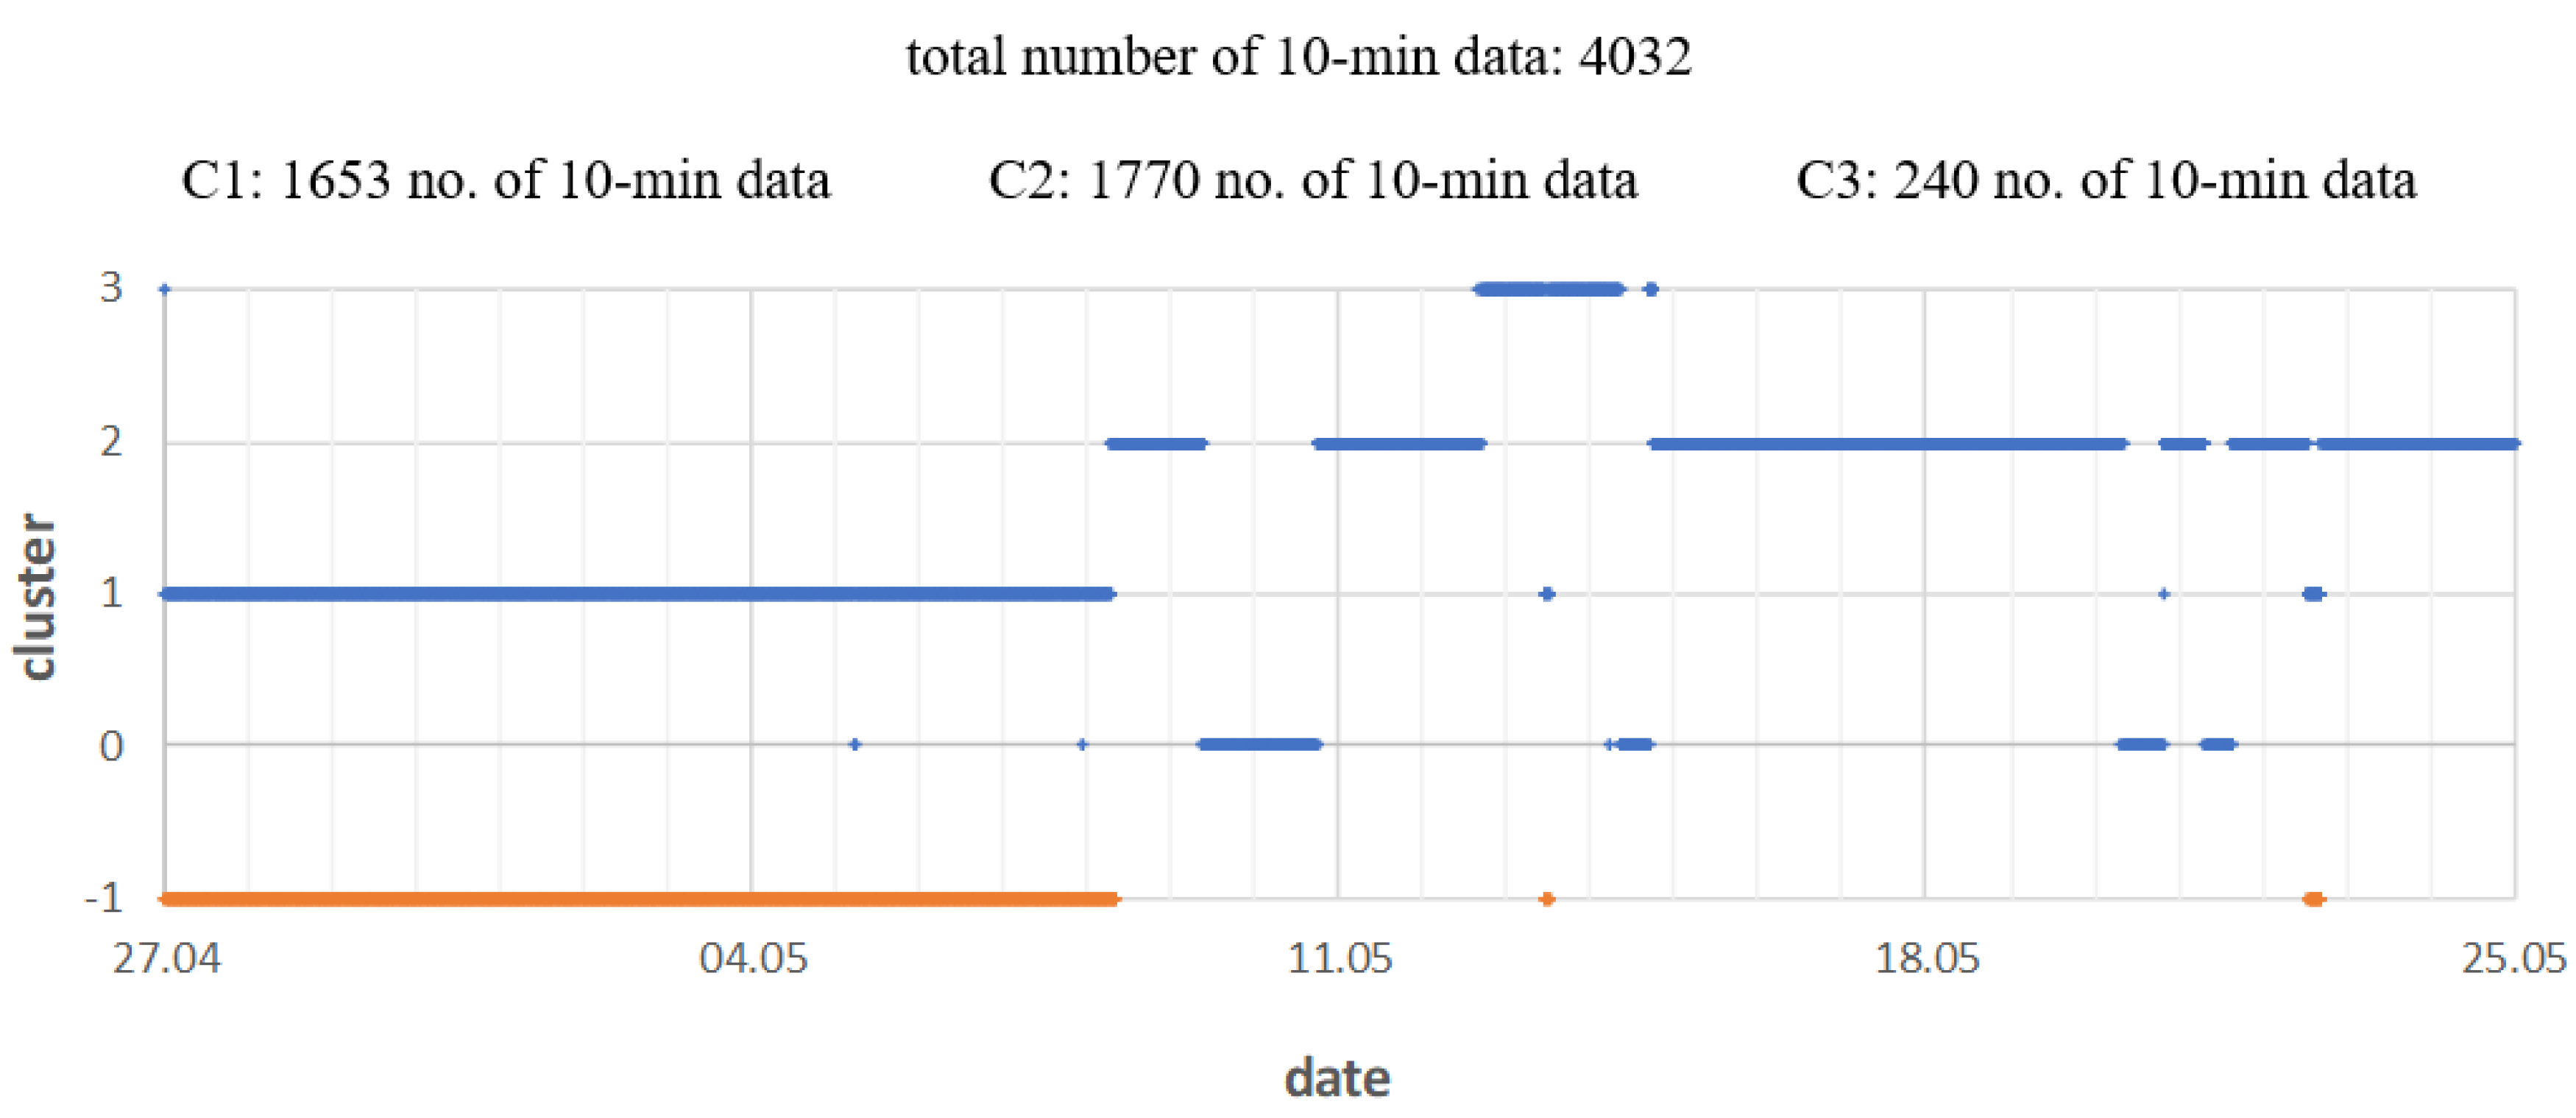
- Cluster 3 represents a short period of time (around 2 days) when all the DGs were switched off and some reconfiguration of the electrical power network connection was made. During the reconfiguration, transformer T1 was more loaded, and transformers T2 and T3 were less loaded. Comparing the ADI level during cluster 3, consisting of a period of time when there was a network reconfiguration with cluster 2, when the network was operating in the normal configuration, it can be seen that the values of the ADI decreased for T2, T3 and WM, and increased for T1.
- —no correlation;
- 0.1—slight correlation;
- 0.4—poor correlation;
- 0.7—noticeable correlation;
- 0.9—high correlation;
- —strong correlation.
3.3. Influence of the Factors Comprising the Proposed Global Power Quality Indices on the Sensitivity of the Assessment
4. Discussion
5. Conclusions
Author Contributions
Funding
Acknowledgments
Conflicts of Interest
Nomenclature
| ADI | aggregated data index |
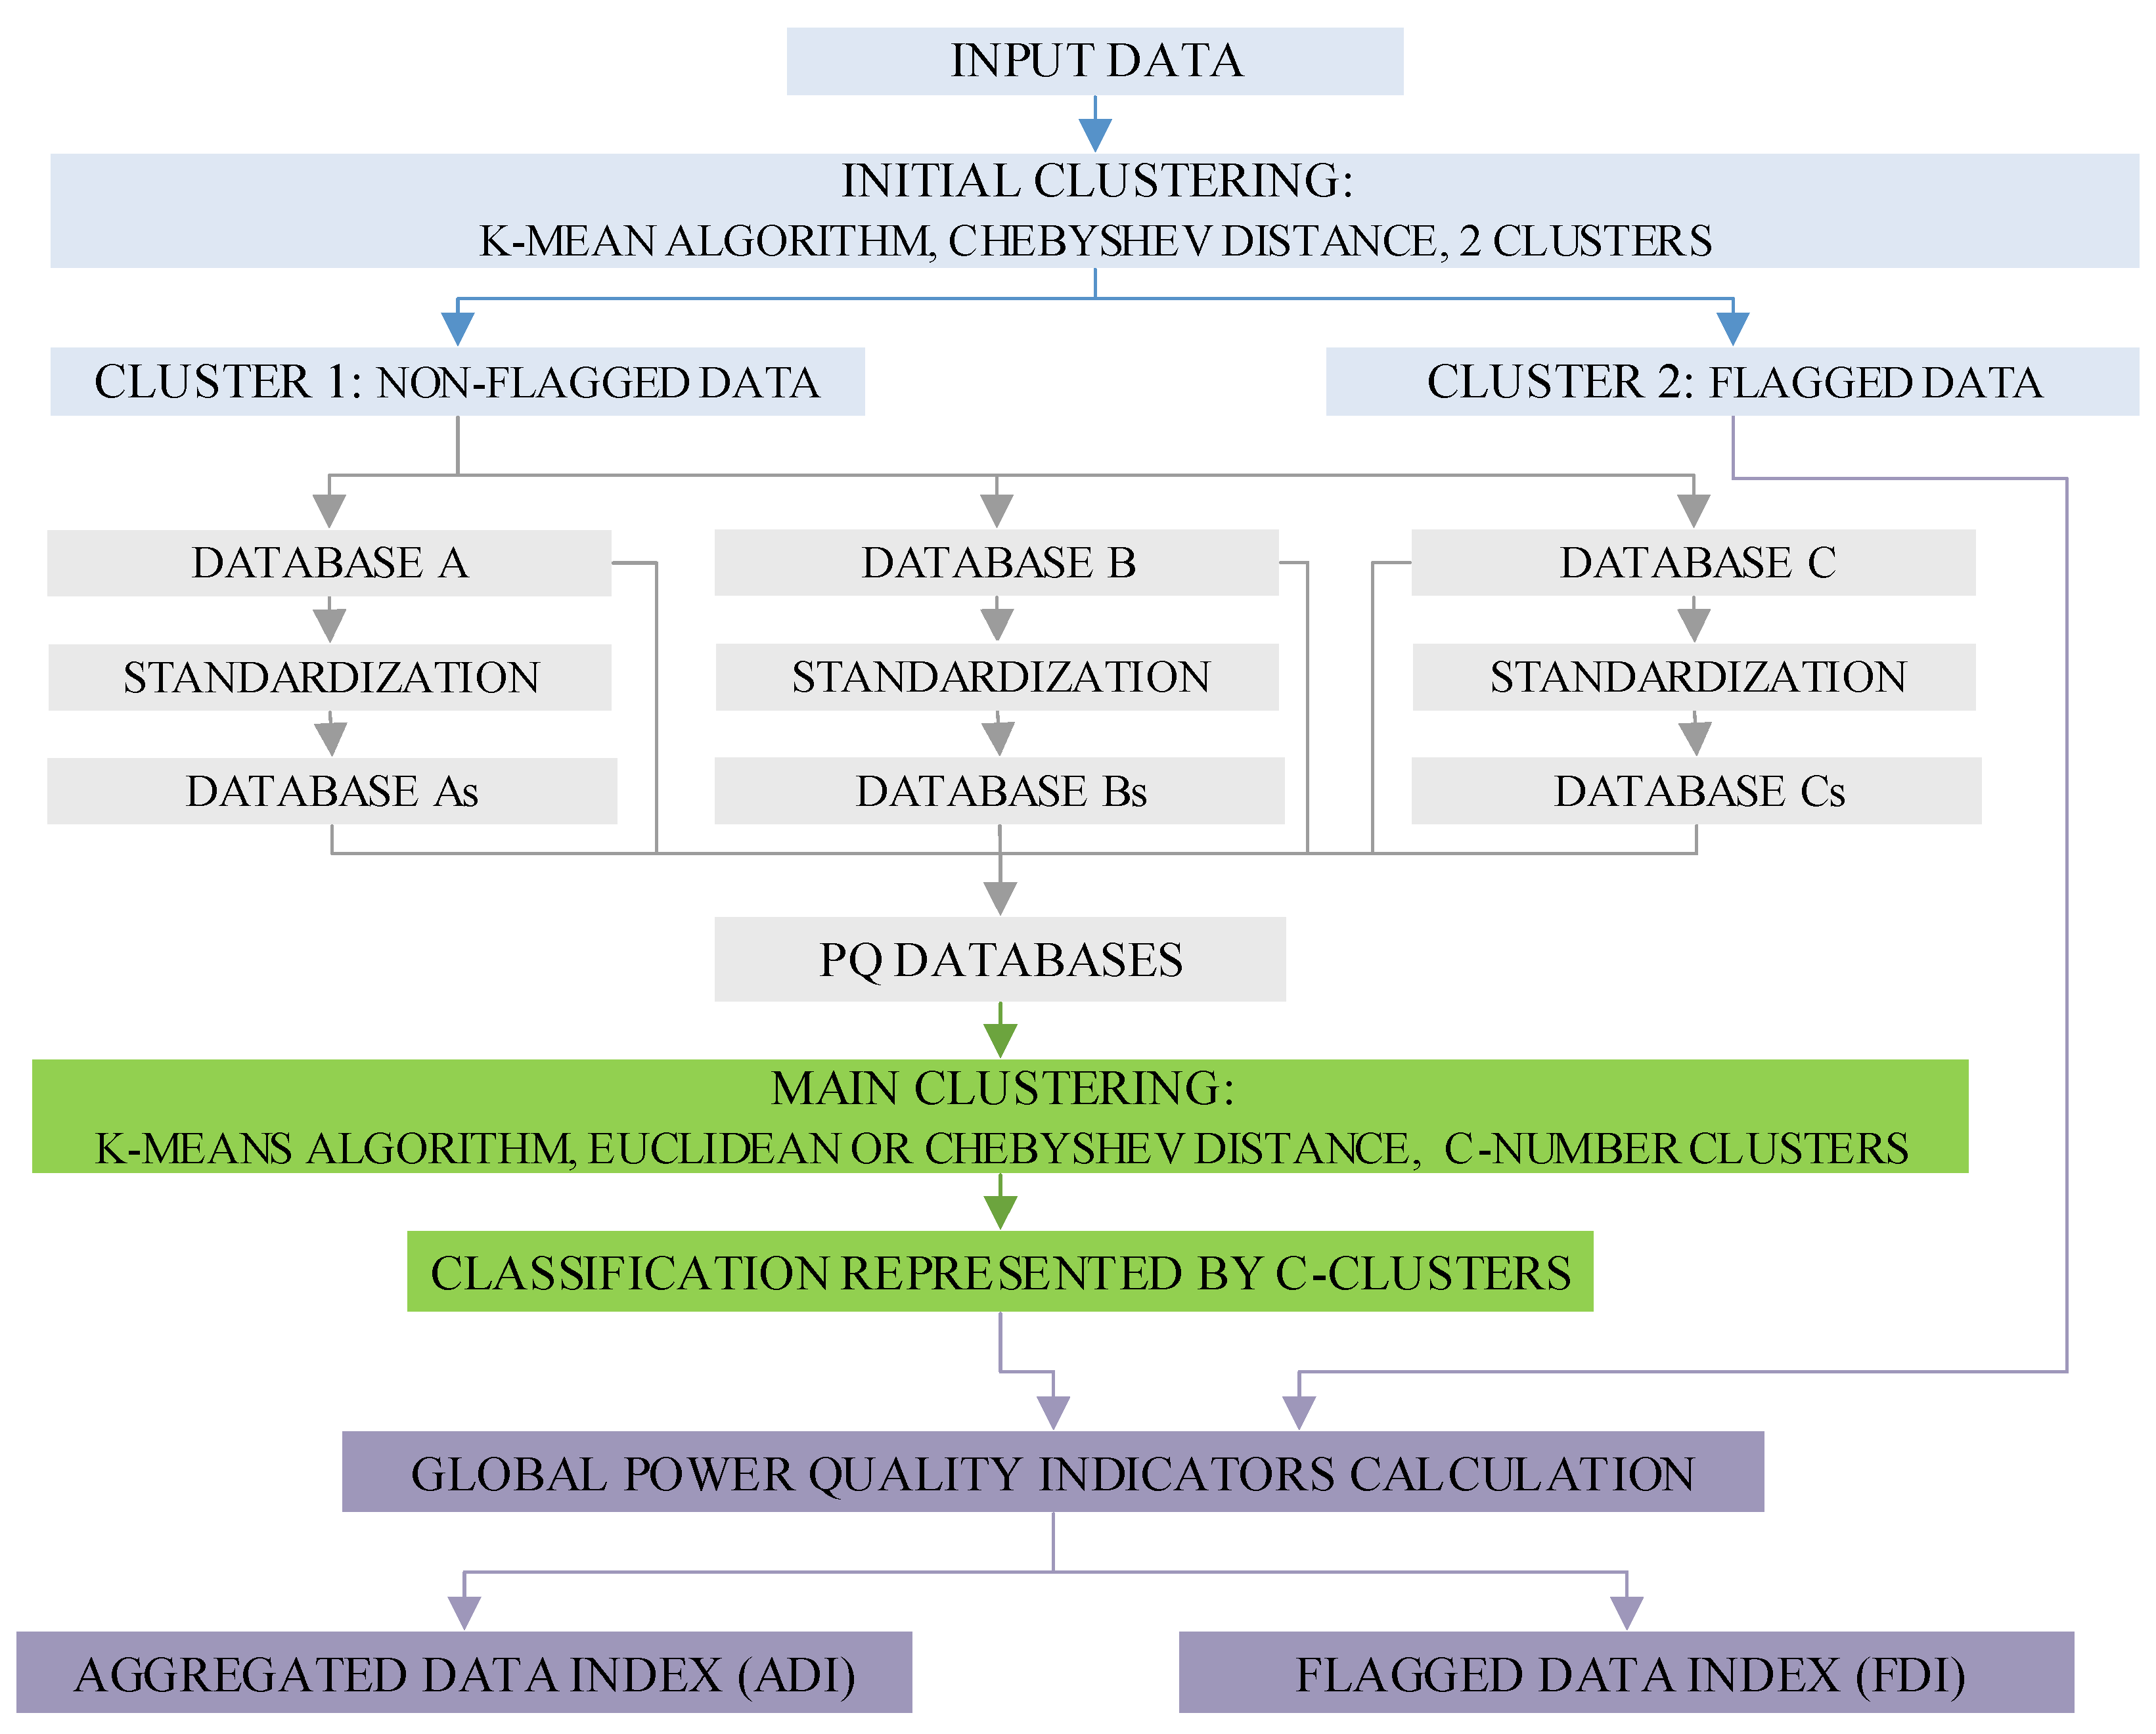
| C | database for non-standardized data |
| Cs | database for standardized data |
| C | number of classes or clusters |
| DG | distributed generation |
| GPQI | global power quality index |
| ki | importance rate (weighted factors) of a particular power quality factor constituting the synthetic aggregated data index, range of [0, 1] |
| ku2 | asymmetry |
| P | active power |
| Plt | long-term flicker severity |
| Pst | short-term flicker severity |
| PQ | power quality |
| THD | total harmonic distortion |
| U | voltage variation |
| Wi | particular power quality factors comprising the synthetic aggregated data index |
| WM | welding machine |
References
- International Energy Agency. Key World Energy Statistics; International Energy Agency: Paris, France, 2017. [Google Scholar]
- Nieto, A.; Vita, V.; Ekonomou, L.; Mastorakis, N.E. Economic Analysis of Energy Storage System Integration with a Grid Connected Intermittent Power Plant, for Power Quality Purposes. WSEAS Trans. Power Syst. 2016, 11, 65–71. [Google Scholar]
- Nieto, A.; Vita, V.; Maris, T.I. Power Quality Improvement in Power Grids with the Integration of Energy Storage Systems. Int. J. Eng. Res. Technol. 2016, 5, 438–443. [Google Scholar]
- Ceaki, O.; Seritan, G.; Vatu, R.; Mancasi, M. Analysis of power quality improvement in smart grids. In Proceedings of the 2017 10th International Symposium on Advanced Topics in Electrical Engineering (ATEE), Bucharest, Romania, 23–25 March 2017; IEEE: Piscataway, NJ, USA, 2017; pp. 797–801. [Google Scholar]
- Seritan, G.; Tristiu, I.; Ceaki, O.; Boboc, T. Power quality assessment for microgrid scenarios. In Proceedings of the 2016 International Conference and Exposition on Electrical and Power Engineering (EPE), Iasi, Romania, 20–22 October 2016; IEEE: Piscataway, NJ, USA, 2016; pp. 723–727. [Google Scholar]
- EN 50160: Voltage Characteristics of Electricity Supplied by Public Distribution Network; British Standards: London, UK, 2015.
- IEC 61000 4-30 Electromagnetic Compatibility (EMC)–Part 4-30: Testing and Measurement Techniques–Power Quality Measurement Methods; International Electrotechnical Commission: Geneva, Switzerland, 2015.
- IEEE P1159: Monitoring and Definition of Electric Power Quality; IEEE: Piscataway, NJ, USA, 2009.
- Jasiński, M.; Sikorski, T.; Borkowski, K. Clustering as a tool to support the assessment of power quality in electrical power networks with distributed generation in the mining industry. Electr. Power Syst. Res. 2019, 166, 52–60. [Google Scholar] [CrossRef]
- Jasiński, M.; Sikorski, T.; Kostyła, P.; Kaczorowska, D.; Leonowicz, Z.; Rezmer, J.; Szymańda, J.; Janik, P.; Bejmert, D.; Rybiański, M.; et al. Influence of Measurement Aggregation Algorithms on Power Quality Assessment and Correlation Analysis in Electrical Power Network with PV Power Plant. Energies 2019, 12, 3547. [Google Scholar] [CrossRef]
- Borges, F.A.S.; Fernandes, R.A.S.; Silva, I.N.; Silva, C.B.S. Feature Extraction and Power Quality Disturbances Classification Using Smart Meters Signals. IEEE Trans. Ind. Inform. 2015, 12, 824–833. [Google Scholar] [CrossRef]
- Erişti, H.; Demir, Y. Automatic classification of power quality events and disturbances using wavelet transform and support vector machines. IET Gener. Transm. Distrib. 2012, 6, 968–976. [Google Scholar] [CrossRef]
- Jamali, S.; Farsa, A.R.; Ghaffarzadeh, N. Identification of optimal features for fast and accurate classification of power quality disturbances. Meas. J. Int. Meas. Confed. 2018, 116, 565–574. [Google Scholar] [CrossRef]
- CIGRE. Broshure 292: Data Mining Techniques and Applications in the Power Transmission Field; CIGRE: Paris, France, 2006. [Google Scholar]
- Xi, Y.; Li, Z.; Zeng, X.; Tang, X.; Liu, Q.; Xiao, H. Detection of power quality disturbances using an adaptive process noise covariance Kalman filter. Digit. Signal Process. A Rev. J. 2018, 76, 34–49. [Google Scholar] [CrossRef]
- Kanirajan, P.; Suresh Kumar, V. Power quality disturbance detection and classification using wavelet and RBFNN. Appl. Soft Comput. J. 2015, 35, 470–481. [Google Scholar] [CrossRef]
- Mahela, O.P.; Shaik, A.G. Power quality recognition in distribution system with solar energy penetration using S -transform and Fuzzy C-means clustering. Renew. Energy 2017, 106, 37–51. [Google Scholar] [CrossRef]
- Gu, T.; Kadurek, P.; Cobben, J.F.G.; Endhoven, A.W. Power quality data evaluation in distribution networks based on data mining techniques. In Proceedings of the 2013 12th International Conference on Environment and Electrical Engineering, Wroclaw, Poland, 5–8 May 2013; IEEE: Piscataway, NJ, USA, 2013; pp. 58–63. [Google Scholar]
- Gao, Q.; Pan, F.; Yuan, F.; Pan, J.; Zhang, J.; Zhang, Y. The Classification of Multiple Power Quality Disturbances Based on Dynamic Event Tree and Support Vector Machine. In International Conference on Advanced Machine Learning Technologies and Applications; Springer: Cham, Switzerland, 2020; pp. 321–329. [Google Scholar]
- Bagheri, A.; Bollen, M.H.J.; Gu, I.Y.H. Improved characterization of multi-stage voltage dips based on the space phasor model. Electr. Power Syst. Res. 2018, 154, 319–328. [Google Scholar] [CrossRef]
- Ahire, P.G.; Patil, P.D.; Patil, R.A.; Golande, A.L. An Approach to Clustering of Power Quality Events Data. Proc. Int. J. Eng. Innov. Technol. 2012, 2, 164–168. [Google Scholar]
- Mittal, D.; Mahela, O.P.; Jain, R. Classification of Power Quality Disturbances in Electric Power System: A Review. Iosr-Jeee 2012, 3, 6–14. [Google Scholar] [CrossRef]
- Shaik, A.G.; Mahela, O.P. Power quality assessment and event detection in hybrid power system. Electr. Power Syst. Res. 2018, 161, 26–44. [Google Scholar] [CrossRef]
- Meier, R.; McCamish, B.; Cotilla-Sanchez, E.; Landford, J.; Bass, R.B.; Chiu, D. Event Detection Using Correlation within Arrays of Streaming PMU Data. In Proceedings of the 2018 IEEE Power & Energy Society General Meeting (PESGM), Portland, OR, USA, 5–10 August 2018; IEEE: Piscataway, NJ, USA, 2018; pp. 1–5. [Google Scholar]
- Guder, M.; Salor, O.; Çadirci, N.; Ozkan, B.; Altintas, A. Data Mining Framework for Power Quality Event Characterization of Iron and Steel Plants. Proc. Ind. Appl. Soc. Annu. Meet 2015, 51, 3521–3531. [Google Scholar] [CrossRef]
- Dent, I.; Aickelin, U.; Rodden, T. The Application of a Data Mining Framework to Energy Usage Profiling in Domestic Residences Using UK Data. SSRN Electron. J. 2011, 1–10. [Google Scholar] [CrossRef]
- Asheibi, A.; Stirling, D.; Robinson, D. Identification of Load Power Quality Characteristics using Data Mining. In Proceedings of the 2006 Canadian Conference on Electrical and Computer Engineering, Ottawa, ON, Canada, 7–10 May 2006; IEEE: Piscataway, NJ, USA, 2006; pp. 157–162. [Google Scholar]
- Zhou, K.; Yang, S.; Shen, C. A review of electric load classification in smart grid environment. Renew. Sustain. Energy Rev. 2013, 24, 103–110. [Google Scholar] [CrossRef]
- Alfares, H.K.; Nazeeruddin, M. Electric load forecasting: Literature survey and classification of methods. Int. J. Syst. Sci. 2002, 33, 23–34. [Google Scholar] [CrossRef]
- Kotriwala, A.M.; Hernandez-Leal, P.; Kaisers, M. Load Classification and Forecasting for Temporary Power Installations. In Proceedings of the 2018 IEEE PES Innovative Smart Grid Technologies Conference Europe (ISGT-Europe), Sarajevo, Bosnia-Herzegovina, 21–25 October 2018; IEEE: Piscataway, NJ, USA, 2018; pp. 1–6. [Google Scholar]
- Azizi, E.; Ghaemi, S.; Mohammadi-Ivatloo, B.; Piran, M.J. Application of comparative strainer clustering as a novel method of high volume of data clustering to optimal power flow problem. Int. J. Electr. Power Energy Syst. 2019, 113, 362–371. [Google Scholar] [CrossRef]
- Stankovic, S.; Soder, L. Optimal Power Flow Based on Genetic Algorithms and Clustering Techniques. In Proceedings of the 2018 Power Systems Computation Conference (PSCC), Dublin, Ireland, 11–15 June 2018; IEEE: Piscataway, NJ, USA, 2018; pp. 1–7. [Google Scholar]
- Huynh, V.; Ngo, V.; Le, D.; Nguyen, N. Probabilistic Power Flow Methodology for Large-Scale Power Systems Incorporating Renewable Energy Sources. Energies 2018, 11, 2624. [Google Scholar] [CrossRef]
- Galvani, S.; Choogan, M. Data clustering based probabilistic optimal power flow in power systems. IET Gener. Transm. Distrib. 2019, 13, 181–188. [Google Scholar] [CrossRef]
- Florencias-Oliveros, O.; Aguera-Perez, A.; Gonzalez-De-La-Rosa, J.J.; Palomares-Salas, J.C.; Sierra-Fernandez, J.M.; Montero, A.J. Cluster analysis for Power Quality monitoring. In Proceedings of the 2017 11th IEEE International Conference on Compatibility, Power Electronics and Power Engineering (CPE-POWERENG), Cadiz, Spain, 4–6 April 2017. [Google Scholar]
- Lin, S.; Xie, C.; Tang, B.; Liu, R.; Pan, A.; Grid, S.; Municipal, S.; Power, E. The Data Mining Application in the Power Quality Monitoring Data Analysis. In Proceedings of the 2016 IEEE 11th Conference on Industrial Electronics and Applications (ICIEA), Hefei, China, 5–7 June 2016; pp. 338–342. [Google Scholar]
- Seera, M.; Lim, C.P.; Loo, C.K.; Singh, H. A modified fuzzy min-max neural network for data clustering and its application to power quality monitoring. Appl. Soft Comput. J. 2015, 28, 19–29. [Google Scholar] [CrossRef]
- Seera, M.; Lim, C.P.; Loo, C.K.; Singh, H. Power Quality Analysis Using a Hybrid Model of the Fuzzy Min–Max Neural Network and Clustering Tree. IEEE Trans. Neural Networks Learn. Syst. 2016, 27, 2760–2767. [Google Scholar] [CrossRef] [PubMed]
- Sacasqui, M.; Luyo, J.; Delgado, A. A Unified Index for Power Quality Assessment in Distributed Generation Systems Using Grey Clustering and Entropy Weight. In Proceedings of the 2018 IEEE ANDESCON, Santiago de Cali, Colombia, 22–24 August 2018; IEEE: Piscataway, NJ, USA, 2018; pp. 1–4. [Google Scholar]
- Elbasuony, G.S.; Abdel Aleem, S.H.E.; Ibrahim, A.M.; Sharaf, A.M. A unified index for power quality evaluation in distributed generation systems. Energy 2018, 149, 607–622. [Google Scholar] [CrossRef]
- Song, J.; Xie, Z.; Zhou, J.; Yang, X.; Pan, A. Power quality indexes prediction based on cluster analysis and support vector machine. CIRED-Open Access Proc. J. 2017, 2017, 814–817. [Google Scholar] [CrossRef]
- Florencias-Oliveros, O.; Agüera-Pérez, A.; González-de-la-Rosa, J.J.; Palomares-Salas, J.-C.; Sierra-Fernández, J.-M. A novel instrument for power quality monitoring based in higher-order statistics: A dynamic triggering index for the smart grid. Renew. Energy Power Qual. J. 2017, 1, 43–48. [Google Scholar] [CrossRef]
- Singh, L.P.; Deswal, S.S.; Bhatia, R.; Jain, D.K. A New Approach for Analysing Voltage Sag Severity Based on Power Quality Indices. Int. J. Emerg. Technol. 2004, 4, 1–5. [Google Scholar]
- Ignatova, V.; Villard, D.; Hypolite, J.M. Simple indicators for an effective Power Quality monitoring and analysis. In Proceedings of the 2015 IEEE 15th International Conference on Environment and Electrical Engineering, EEEIC 2015-Conference Proceedings, Rome, Italy, 10–13 June 2015; pp. 1104–1108. [Google Scholar]
- Nourollah, S.; Moallem, M. A Data Mining Method for Obtaining Global Power Quality Index. In Proceedings of the 2011 2nd International Conference on Electric Power and Energy Conversion Systems (EPECS), Sharjah, United Arab Emirates, 15–17 November 2011; pp. 1–7. [Google Scholar]
- Raptis, T.E.; Vokas, G.A.; Langouranis, P.A.; Kaminaris, S.D. Total Power Quality Index for Electrical Networks Using Neural Networks. Energy Procedia 2015, 74, 1499–1507. [Google Scholar] [CrossRef]
- Lee, S.; Park, J.; Member, S.; Venayagamoorthy, G.K. New Power Quality Index in a Distribution Power System by Using RMP Model. IEEE Trans. Ind. Appl. 2010, 46, 1204–1211. [Google Scholar]
- Hanzelka, Z.; Firlit, A.; Błajszczak, A. Syntetyczne miary jakości napięcia. Autom. Elektr. Zakłócenia 2012, 3, 62–70. [Google Scholar]
- Caramia, P.; Carpinelli, G.; Verde, P. Power Quality Indices in Liberalized Markets.pdf; John Wiley & Sons: Hoboken, NJ, USA, 2009; ISBN 9780470033951. [Google Scholar]
- Jasiński, M.; Sikorski, T.; Kostyla, P.; Borkowski, K. Global power quality indices for assessment of multipoint power quality measurements. In Proceedings of the Electronics, Computers and Artificial Intelligence, Iasi, Romania, 28–30 June 2018; IEEE: Piscataway, NJ, USA, 2018; pp. 1–6. [Google Scholar]
- Jasiński, M.; Borkowski, K.; Sikorski, T.; Kostyla, P. Cluster Analysis for Long-Term Power Quality Data in Mining Electrical Power Network. In Proceedings of the 2018 Progress in Applied Electrical Engineering (PAEE), Koscielisko, Poland, 18–22 June 2018; IEEE: Piscataway, NJ, USA, 2018; pp. 1–5. [Google Scholar]
- Jasiński, M.; Sikorski, T.; Borkowski, K. Application of cluster analysis to identification flagged power quality measurements in area-related approach. [Zastosowanie eksploracji danych do identyfikacji oznaczonych wyników pomiaru jakosci energii elektrycznej w ujeciu obszarowym]. Prz. Elektrotechniczny 2020, 3, 9–12. [Google Scholar]


| Point | Type of Event | Flag Start | Flag Stop | Number of 10-min Flagged Data | ||
|---|---|---|---|---|---|---|
| Date | Hour | Date | Hour | |||
| T1 | long interruption, voltage dip, swell, rapid voltage change | 21.05 | 07:50:00 | 21.05 | 15:10:00 | 45 |
| T2 | voltage dip | 05.05 | 05:40:00 | 05.05 | 05:40:00 | 1 |
| long interruption, short interruption, voltage dip, swell, rapid voltage change | 14.05 | 08:20:00 | 14.05 | 16:20:00 | 49 | |
| voltage dip | 05.06 | 14:00:00 | 05.06 | 14:00:00 | 1 | |
| T3 | voltage dip | 05.05 | 05:30:00 | 05.05 | 05:30:00 | 1 |
| rapid voltage change | 07.05 | 22:40:00 | 07.05 | 22:40:00 | 1 | |
| long interruption, voltage dip, swell, rapid voltage change | 09.05 | 09:00:00 | 10.05 | 17:20:00 | 195 | |
| long interruption, voltage dip, transient overvoltage, rapid voltage change | 20.05 | 08:00:00 | 20.05 | 19:20:00 | 69 | |
| WM | voltage dip | 05.05 | 05:30:00 | 05.05 | 05:30:00 | 1 |
| rapid voltage change | 07.05 | 22:40:00 | 07.05 | 22:40:00 | 1 | |
| short interruption, voltage dip, rapid voltage change | 20.05 | 07:40:00 | 20.05 | 07:40:00 | 1 | |
| Parameter | Value |
|---|---|
| 0.5 Hz | |
| 10% | |
| 1.2 | |
| 2% | |
| 8% |
| Cluster | Cluster 1—DG Working | Cluster 2—DG Switched Off | Cluster 3—DG Switched Off and With a Different Network Topology Configuration | ||||||||||
|---|---|---|---|---|---|---|---|---|---|---|---|---|---|
| Measurement Point | T1 | T2 | T3 | WM | T1 | T2 | T3 | WM | T1 | T2 | T3 | WM | |
| ADI | Minimal value | 0.119 | 0.087 | 0.115 | 0.130 | 0.060 | 0.069 | 0.060 | 0.084 | 0.071 | 0.062 | 0.075 | 0.092 |
| Mean value | 0.121 | 0.089 | 0.105 | 0.137 | 0.113 | 0.098 | 0.124 | 0.148 | 0.114 | 0.091 | 0.116 | 0.142 | |
| Maximum value | 0.123 | 0.092 | 0.115 | 0.145 | 0.259 | 0.188 | 0.256 | 0.260 | 0.212 | 0.382 | 0.178 | 0.203 | |
| FDI (%) | 0.00 | 0.15 | 0.17 | ||||||||||
| Measurement Point | |||||||
|---|---|---|---|---|---|---|---|
| T1 | slight | slight | high | slight | high | noticeable | high |
| T2 | slight | poor | noticeable | poor | noticeable | noticeable | high |
| T3 | poor | slight | noticeable | poor | high | high | high |
| WM | poor | poor | noticeable | poor | high | noticeable | high |
| Cluster | Cluster 1—DG Working | Cluster 2—DG Switched Off | Cluster 3—DG Switched Off and with a Different Network Topology Configuration | ||||||||||
|---|---|---|---|---|---|---|---|---|---|---|---|---|---|
| Measurement point | T1 | T2 | T3 | WM | T1 | T2 | T3 | WM | T1 | T2 | T3 | WM | |
| ADI | Minimal value | 0.106 | 0.095 | 0.099 | 0.124 | 0.052 | 0.064 | 0.056 | 0.090 | 0.071 | 0.062 | 0.075 | 0.092 |
| Mean value | 0.110 | 0.095 | 0.097 | 0.133 | 0.099 | 0.099 | 0.111 | 0.144 | 0.114 | 0.091 | 0.116 | 0.142 | |
| Maximum value | 0.114 | 0.096 | 0.104 | 0.142 | 0.221 | 0.193 | 0.219 | 0.231 | 0.212 | 0.382 | 0.178 | 0.203 | |
| ADI | Delta of Clusters | T1 | T2 | T3 | WM | ||||||||
|---|---|---|---|---|---|---|---|---|---|---|---|---|---|
| Min | Mean | Max | Min | Mean | Max | Min | Mean | Max | Min | Mean | Max | ||
| with 200 ms | Δ C1−C2 | 0.059 | 0.008 | −0.136 | 0.017 | −0.009 | −0.097 | 0.055 | −0.019 | −0.141 | 0.046 | −0.010 | −0.114 |
| Δ C1−C3 | 0.048 | 0.007 | −0.089 | 0.025 | −0.001 | −0.290 | 0.040 | −0.012 | −0.063 | 0.038 | −0.004 | −0.058 | |
| Δ C2−C3 | −0.012 | −0.001 | 0.047 | 0.007 | 0.007 | −0.193 | −0.014 | 0.008 | 0.078 | −0.008 | 0.006 | 0.056 | |
| without 200 ms | Δ C1−C2 | 0.053 | 0.011 | −0.107 | 0.030 | −0.004 | −0.097 | 0.043 | −0.014 | −0.115 | 0.034 | −0.011 | −0.089 |
| Δ C1−C3 | 0.034 | −0.004 | −0.097 | 0.033 | 0.005 | −0.286 | 0.024 | −0.020 | −0.075 | 0.032 | −0.009 | −0.061 | |
| Δ C2−C3 | −0.019 | −0.015 | 0.010 | 0.002 | 0.009 | −0.188 | −0.019 | −0.006 | 0.041 | −0.002 | 0.002 | 0.028 | |
| Logical comparative assessment no change in assessment: 1 change in assessment: −1 | 1 | 1 | 1 | 1 | 1 | 1 | 1 | 1 | 1 | 1 | 1 | 1 | |
| 1 | −1 | 1 | 1 | −1 | 1 | 1 | 1 | 1 | 1 | 1 | 1 | ||
| 1 | 1 | 1 | 1 | 1 | 1 | 1 | −1 | 1 | 1 | 1 | 1 | ||
© 2020 by the authors. Licensee MDPI, Basel, Switzerland. This article is an open access article distributed under the terms and conditions of the Creative Commons Attribution (CC BY) license (http://creativecommons.org/licenses/by/4.0/).
Share and Cite
Jasiński, M.; Sikorski, T.; Kostyła, P.; Leonowicz, Z.; Borkowski, K. Combined Cluster Analysis and Global Power Quality Indices for the Qualitative Assessment of the Time-Varying Condition of Power Quality in an Electrical Power Network with Distributed Generation. Energies 2020, 13, 2050. https://doi.org/10.3390/en13082050
Jasiński M, Sikorski T, Kostyła P, Leonowicz Z, Borkowski K. Combined Cluster Analysis and Global Power Quality Indices for the Qualitative Assessment of the Time-Varying Condition of Power Quality in an Electrical Power Network with Distributed Generation. Energies. 2020; 13(8):2050. https://doi.org/10.3390/en13082050
Chicago/Turabian StyleJasiński, Michał, Tomasz Sikorski, Paweł Kostyła, Zbigniew Leonowicz, and Klaudiusz Borkowski. 2020. "Combined Cluster Analysis and Global Power Quality Indices for the Qualitative Assessment of the Time-Varying Condition of Power Quality in an Electrical Power Network with Distributed Generation" Energies 13, no. 8: 2050. https://doi.org/10.3390/en13082050
APA StyleJasiński, M., Sikorski, T., Kostyła, P., Leonowicz, Z., & Borkowski, K. (2020). Combined Cluster Analysis and Global Power Quality Indices for the Qualitative Assessment of the Time-Varying Condition of Power Quality in an Electrical Power Network with Distributed Generation. Energies, 13(8), 2050. https://doi.org/10.3390/en13082050