The Application of Hierarchical Clustering to Power Quality Measurements in an Electrical Power Network with Distributed Generation

 ,
,  ,
,  ,
, 
Abstract
1. Introduction
2. Literate Review
3. Methods and Results
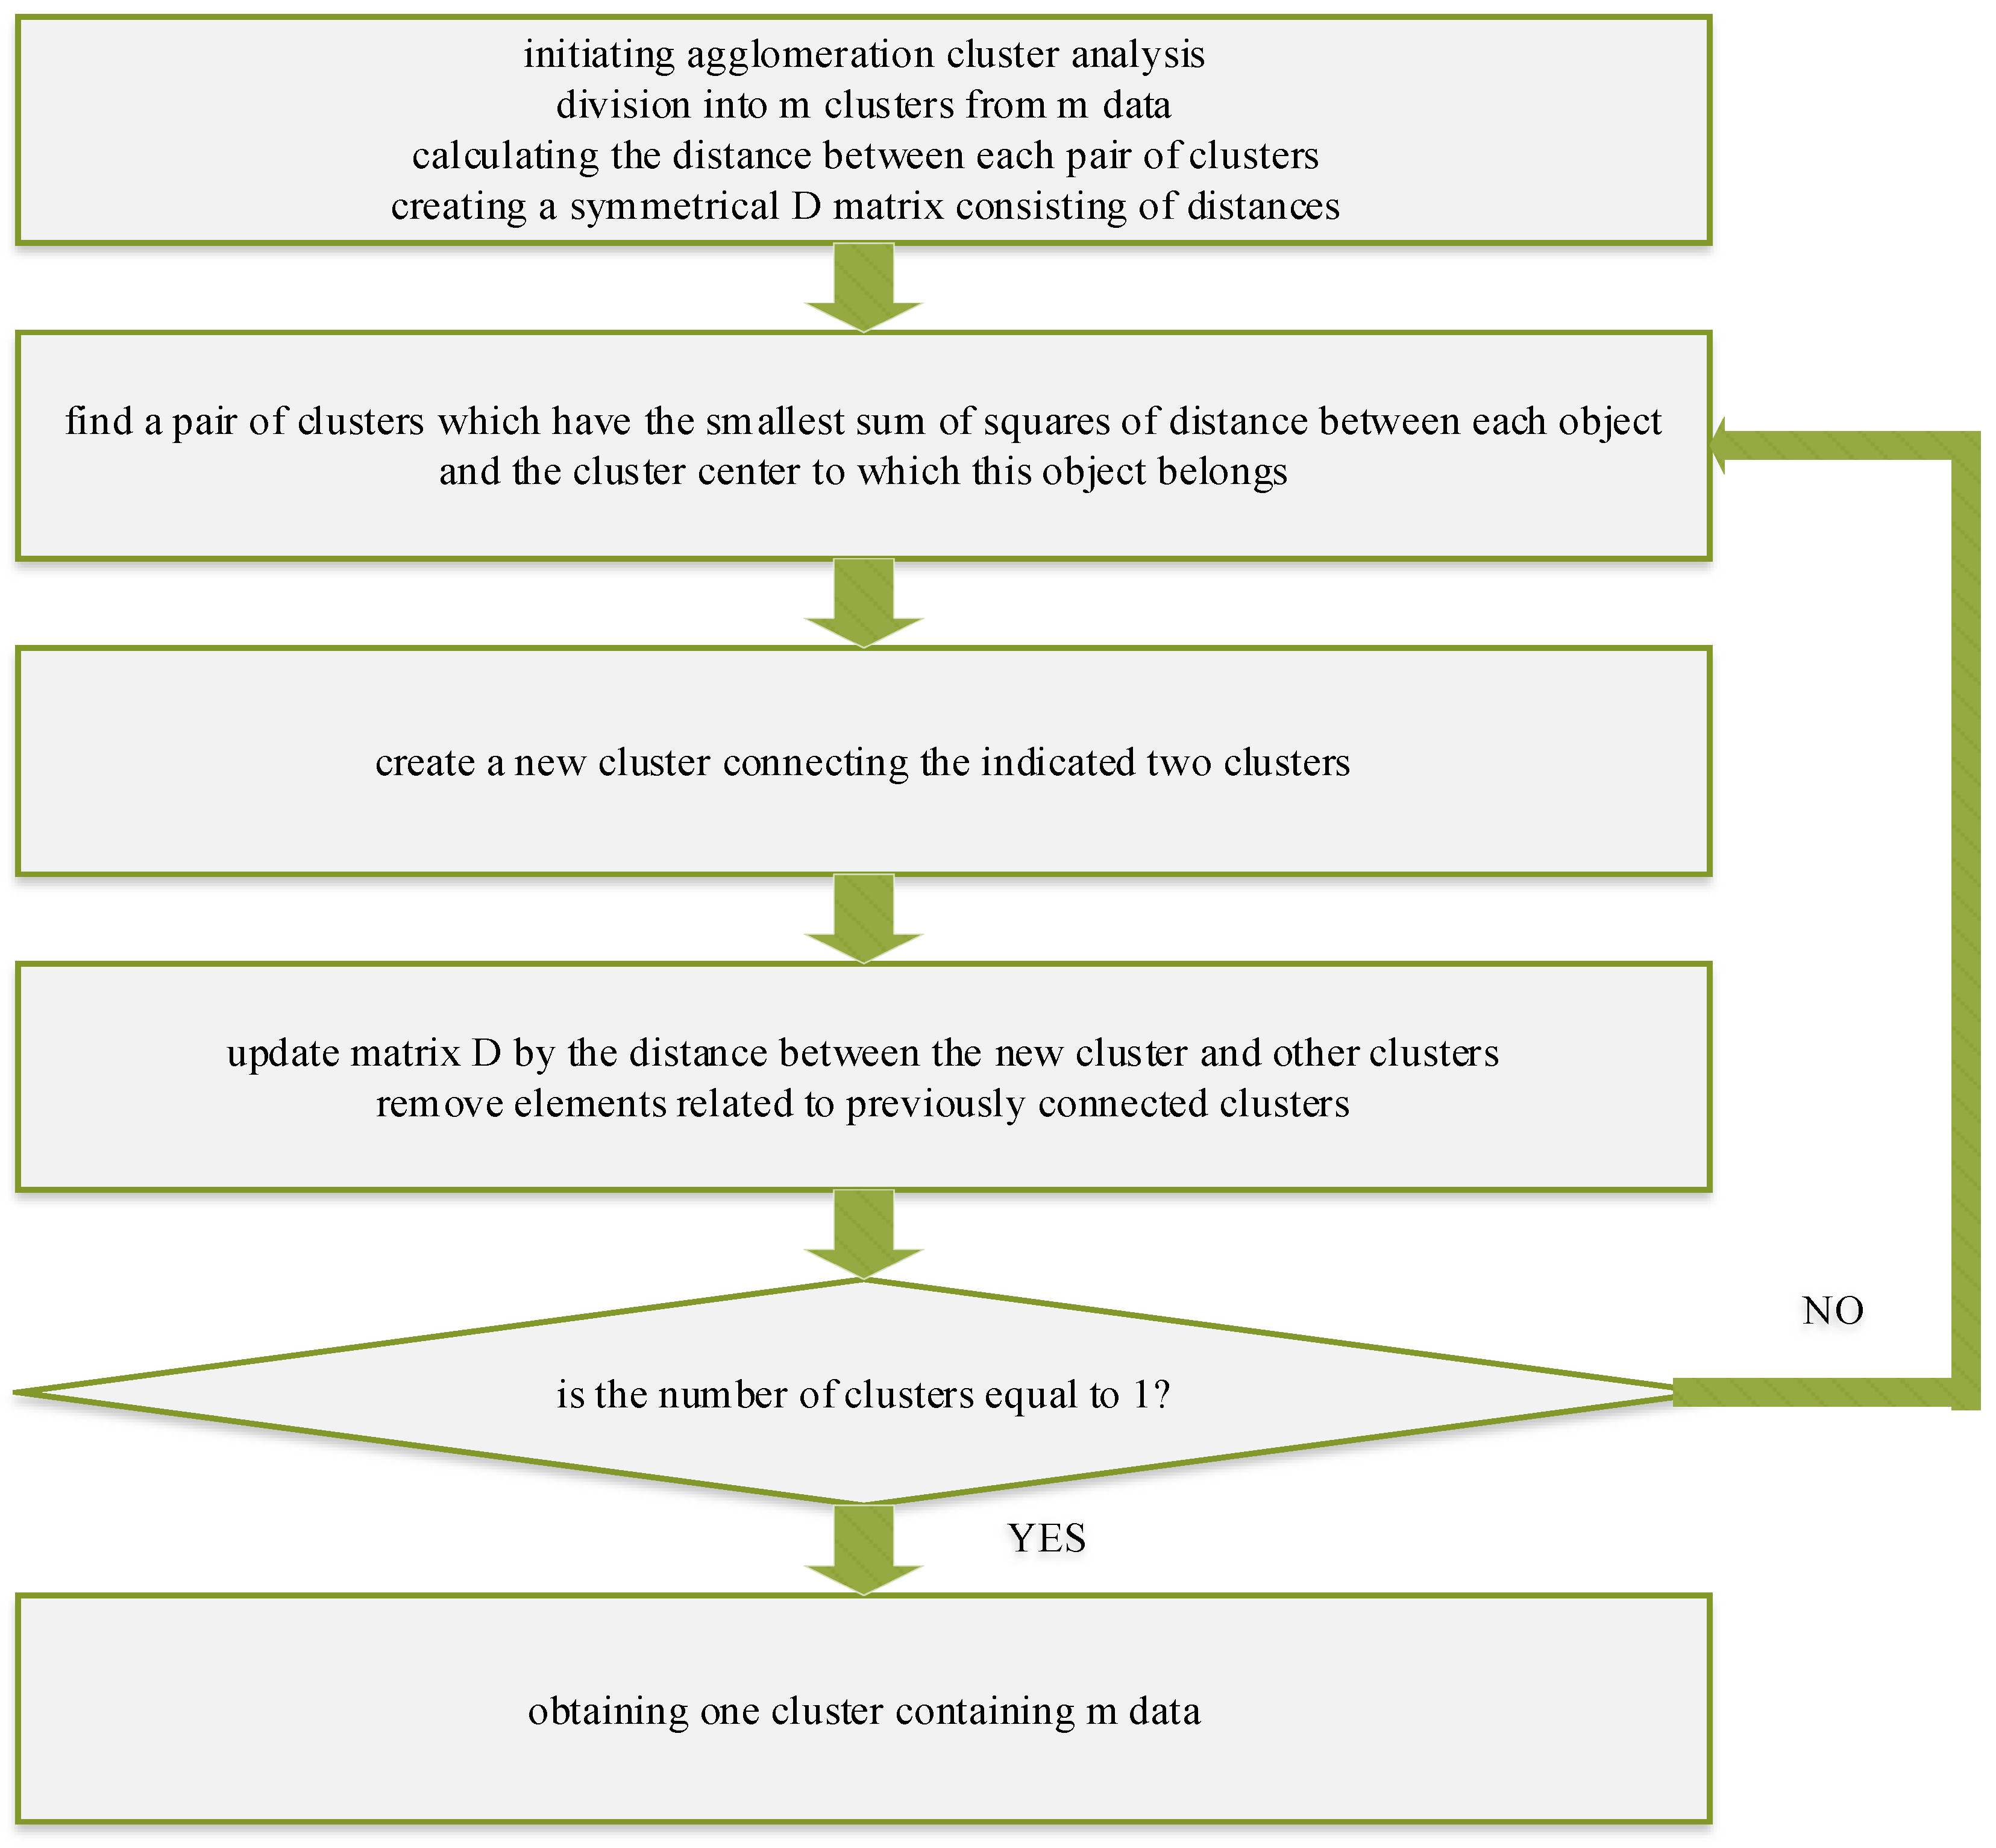
3.1. Cluster Analysis—Ward Algorithm
- decision trees
- neural networks
- clustering
- regression
- mining association rules
- the multilayered perceptron network—MLP network
- genetic algorithms
- fuzzy interference systems
- high-performance computing
- inductive logic programming
- memory-based reasoning methods
- fuzzy sets
- hierarchical
- non-hierarchical
- the single linkage method
- the complete linkage method
- the average linkage method
- the weighted pair-group average linkage method
- the unweighted pair-group centroid linkage method
- the unweighted pair-group centroid linkage method
- the Ward method of minimum variance
- Dpr—distance of the new cluster to cluster of number “r”,
- r—proceed numbers of cluster from “p” to “q”,
- dpr—distance of primary cluster “p” from cluster “r”,
- dqr—distance of primary cluster “q” from cluster “r”,
- dpq—common distance of primary clusters “p” and “q”,
- n—number of single objects in each object.
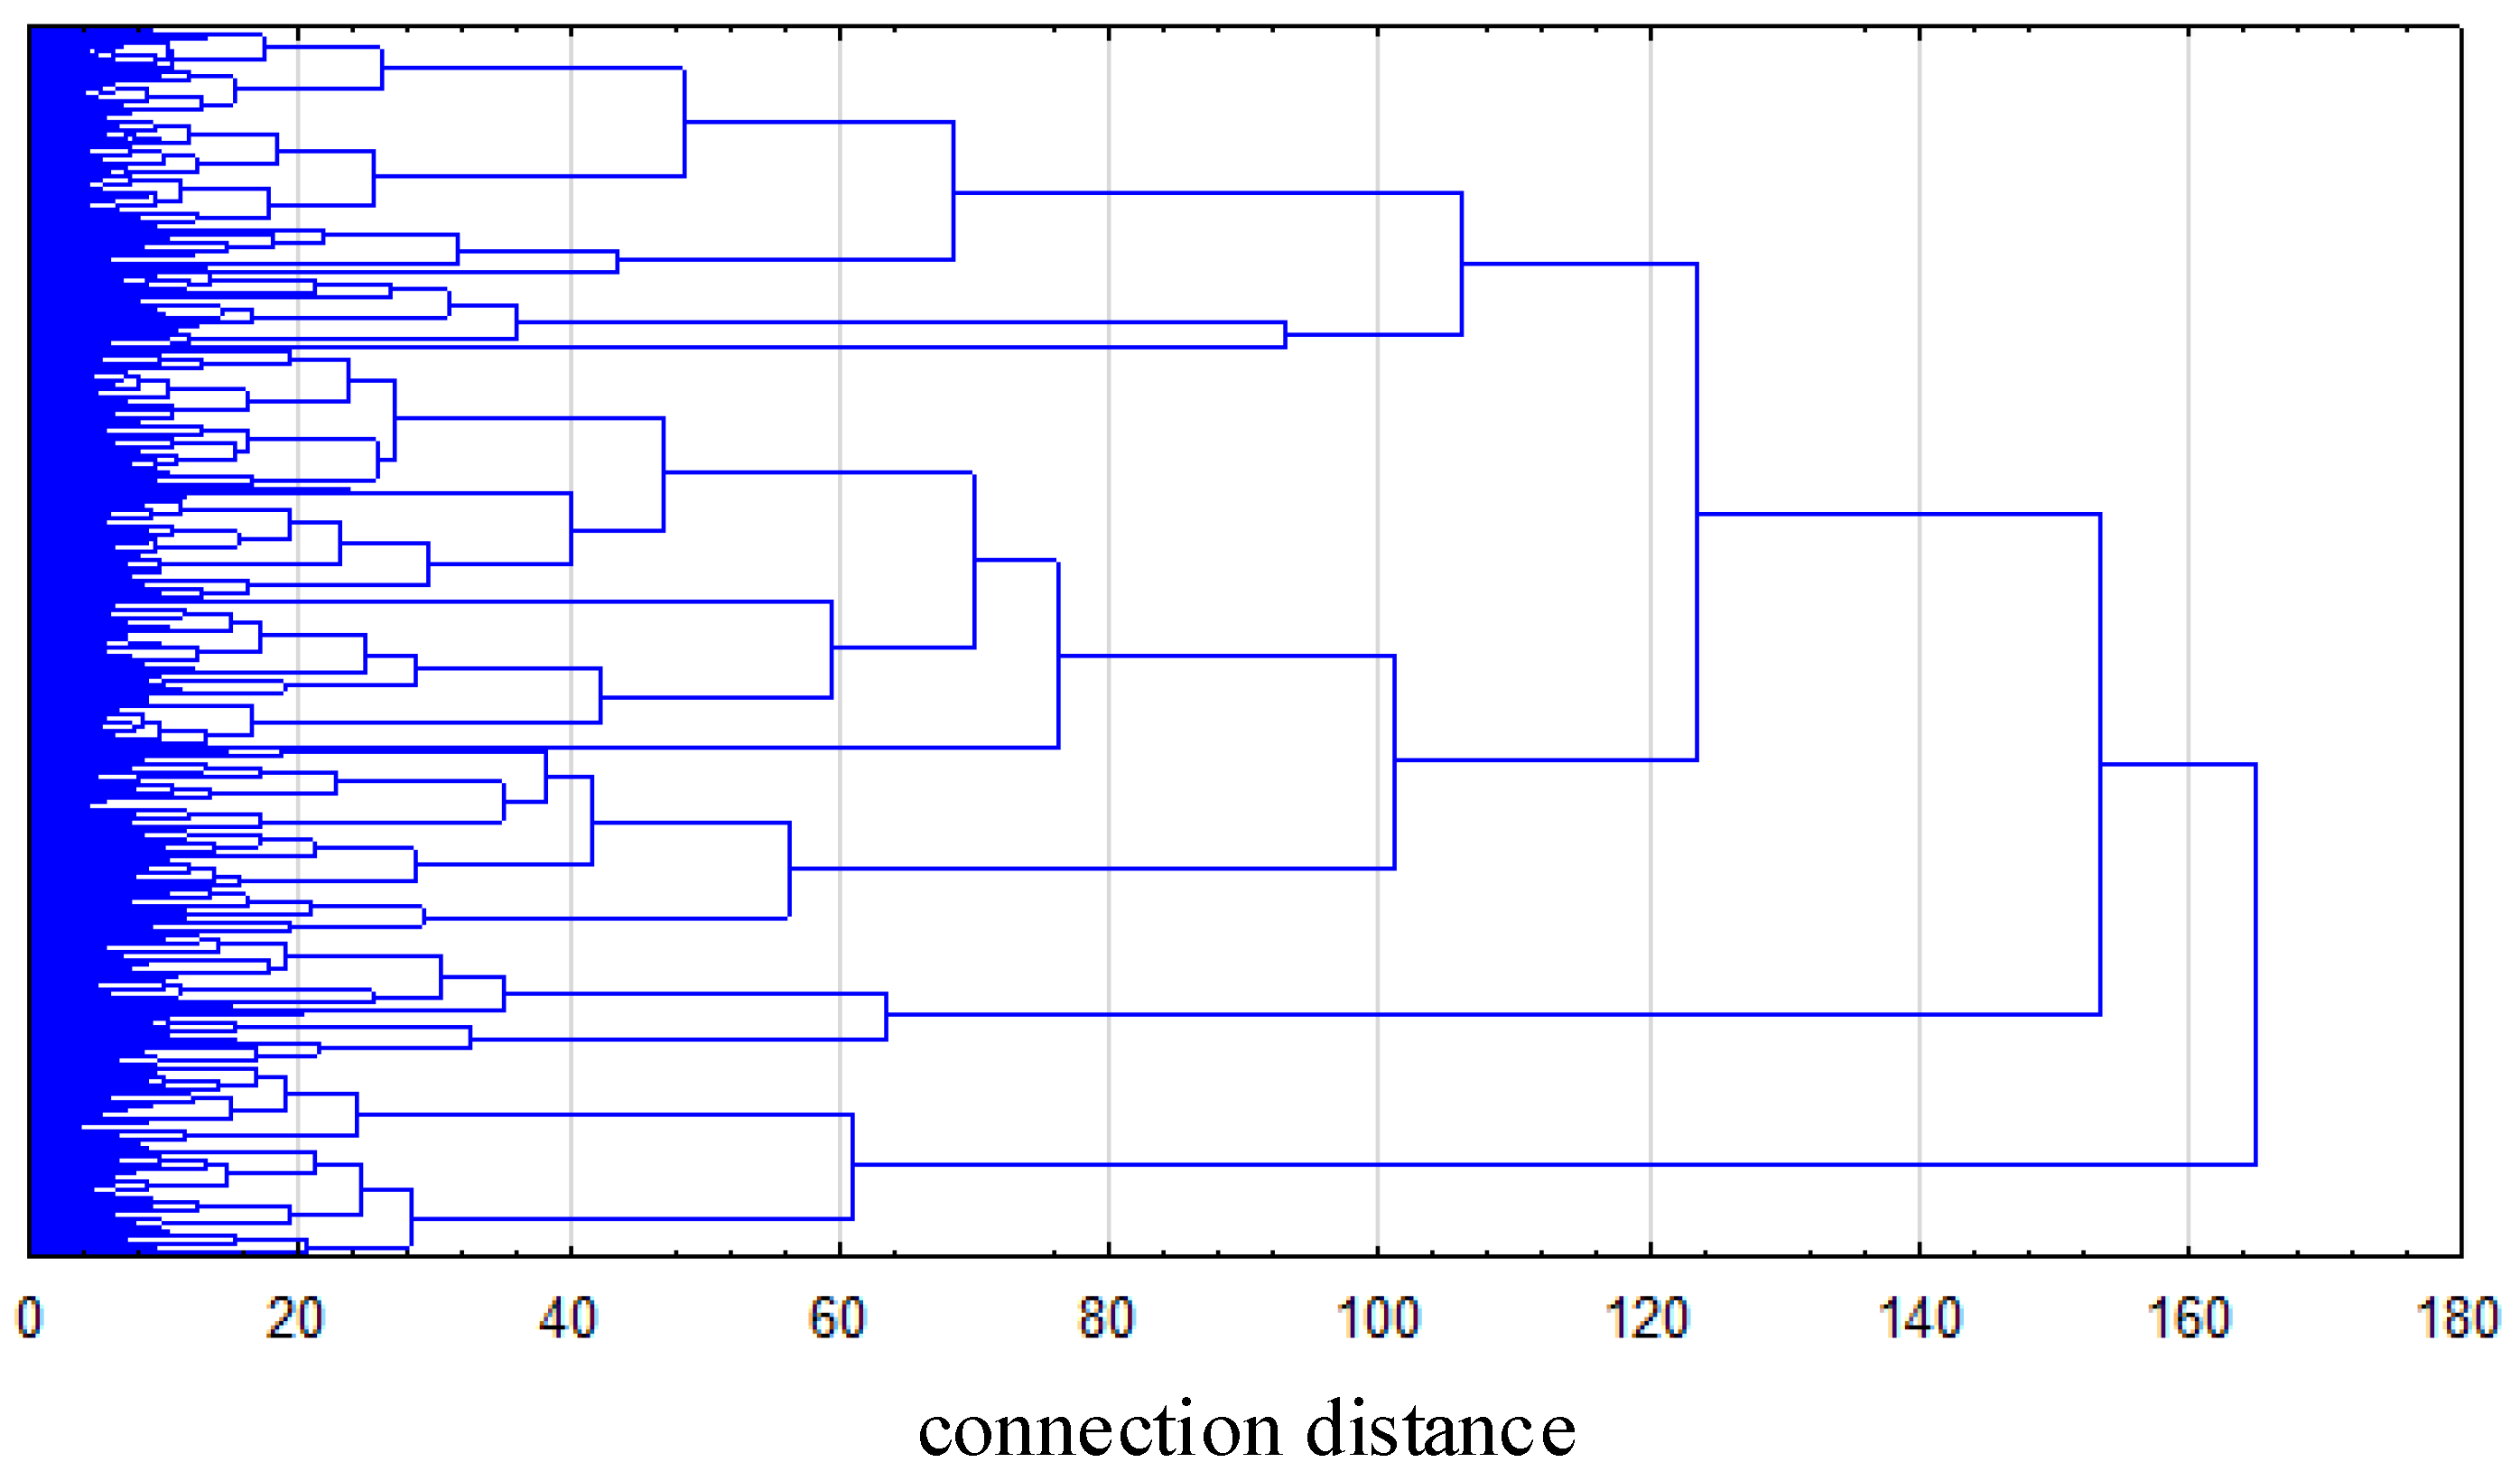
- a dendrogram is analyzed in terms of the difference in distance between successive clusters. A big value of difference means that the data in the cluster are various. Thus, the division ends when the difference in the distance is maximal
- if a clear flattening (log vertical line) can be observed on the dendrogram, it means that in this point the clusters are distant and it is the best point for division
- an approach based on the root-mean-square standard deviation
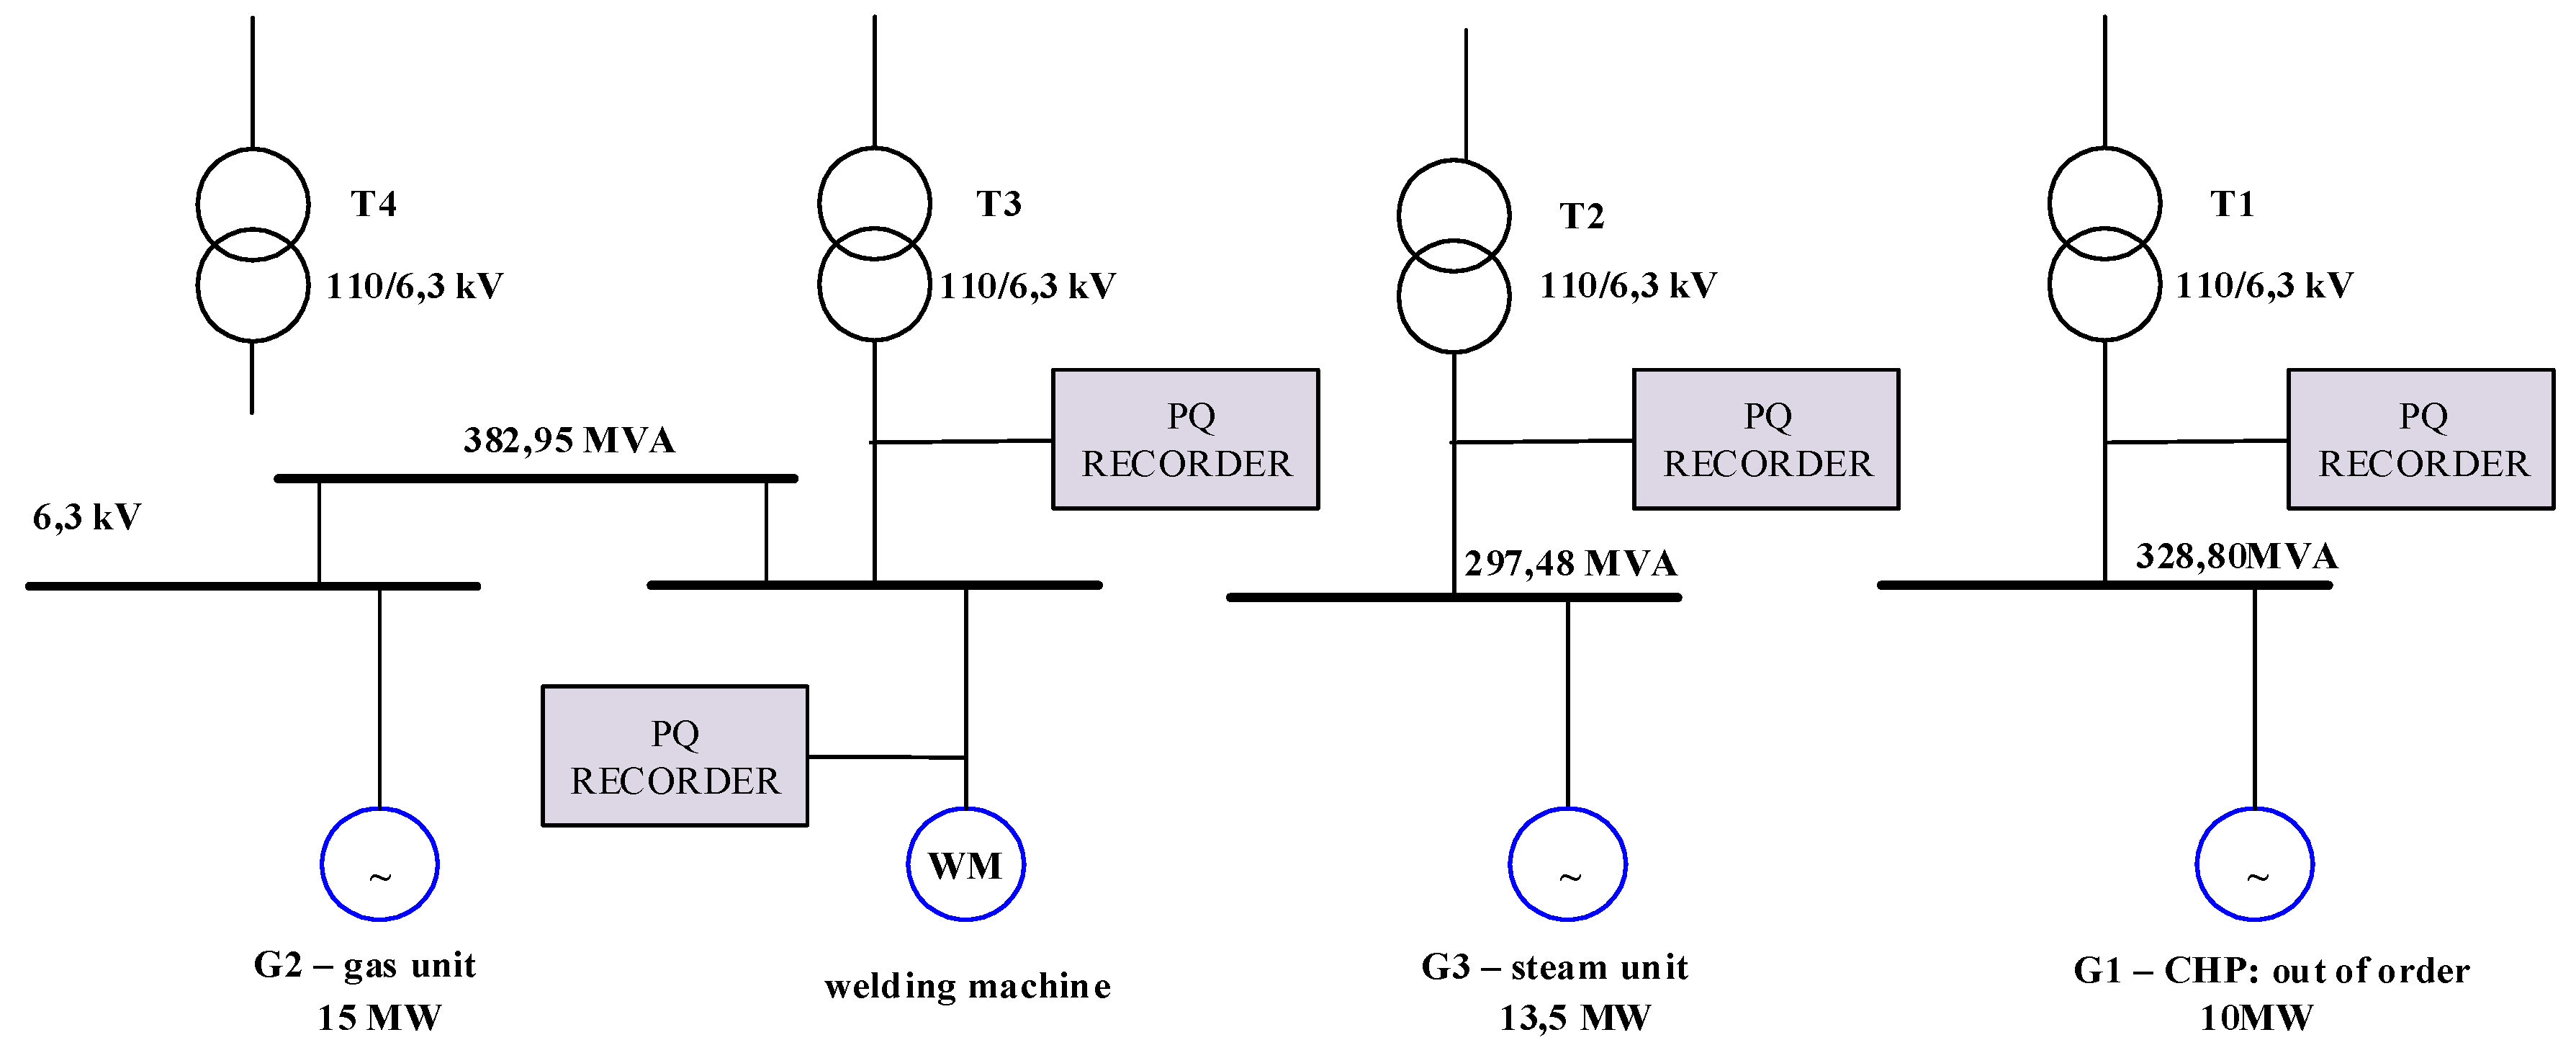
3.2. An Electrical Power Network of the Mining Industry and the Source of the PQ Data
- substations R-1 work independently
- substations R-2 work independently
- substations R-3 and R-4 are coupled
- welding machines
- conveyor belts
- drainage pumps
- combined heat and power (CHP)
- gas-steam units
3.3. Cluster Analysis Results
3.3.1. Parameters Included to the Input Database
- frequency variation (f)
- voltage variation (U)
- short-term flicker severity (Pst)
- asymmetry (ku2)
- total harmonic distortion in voltage (THDu)
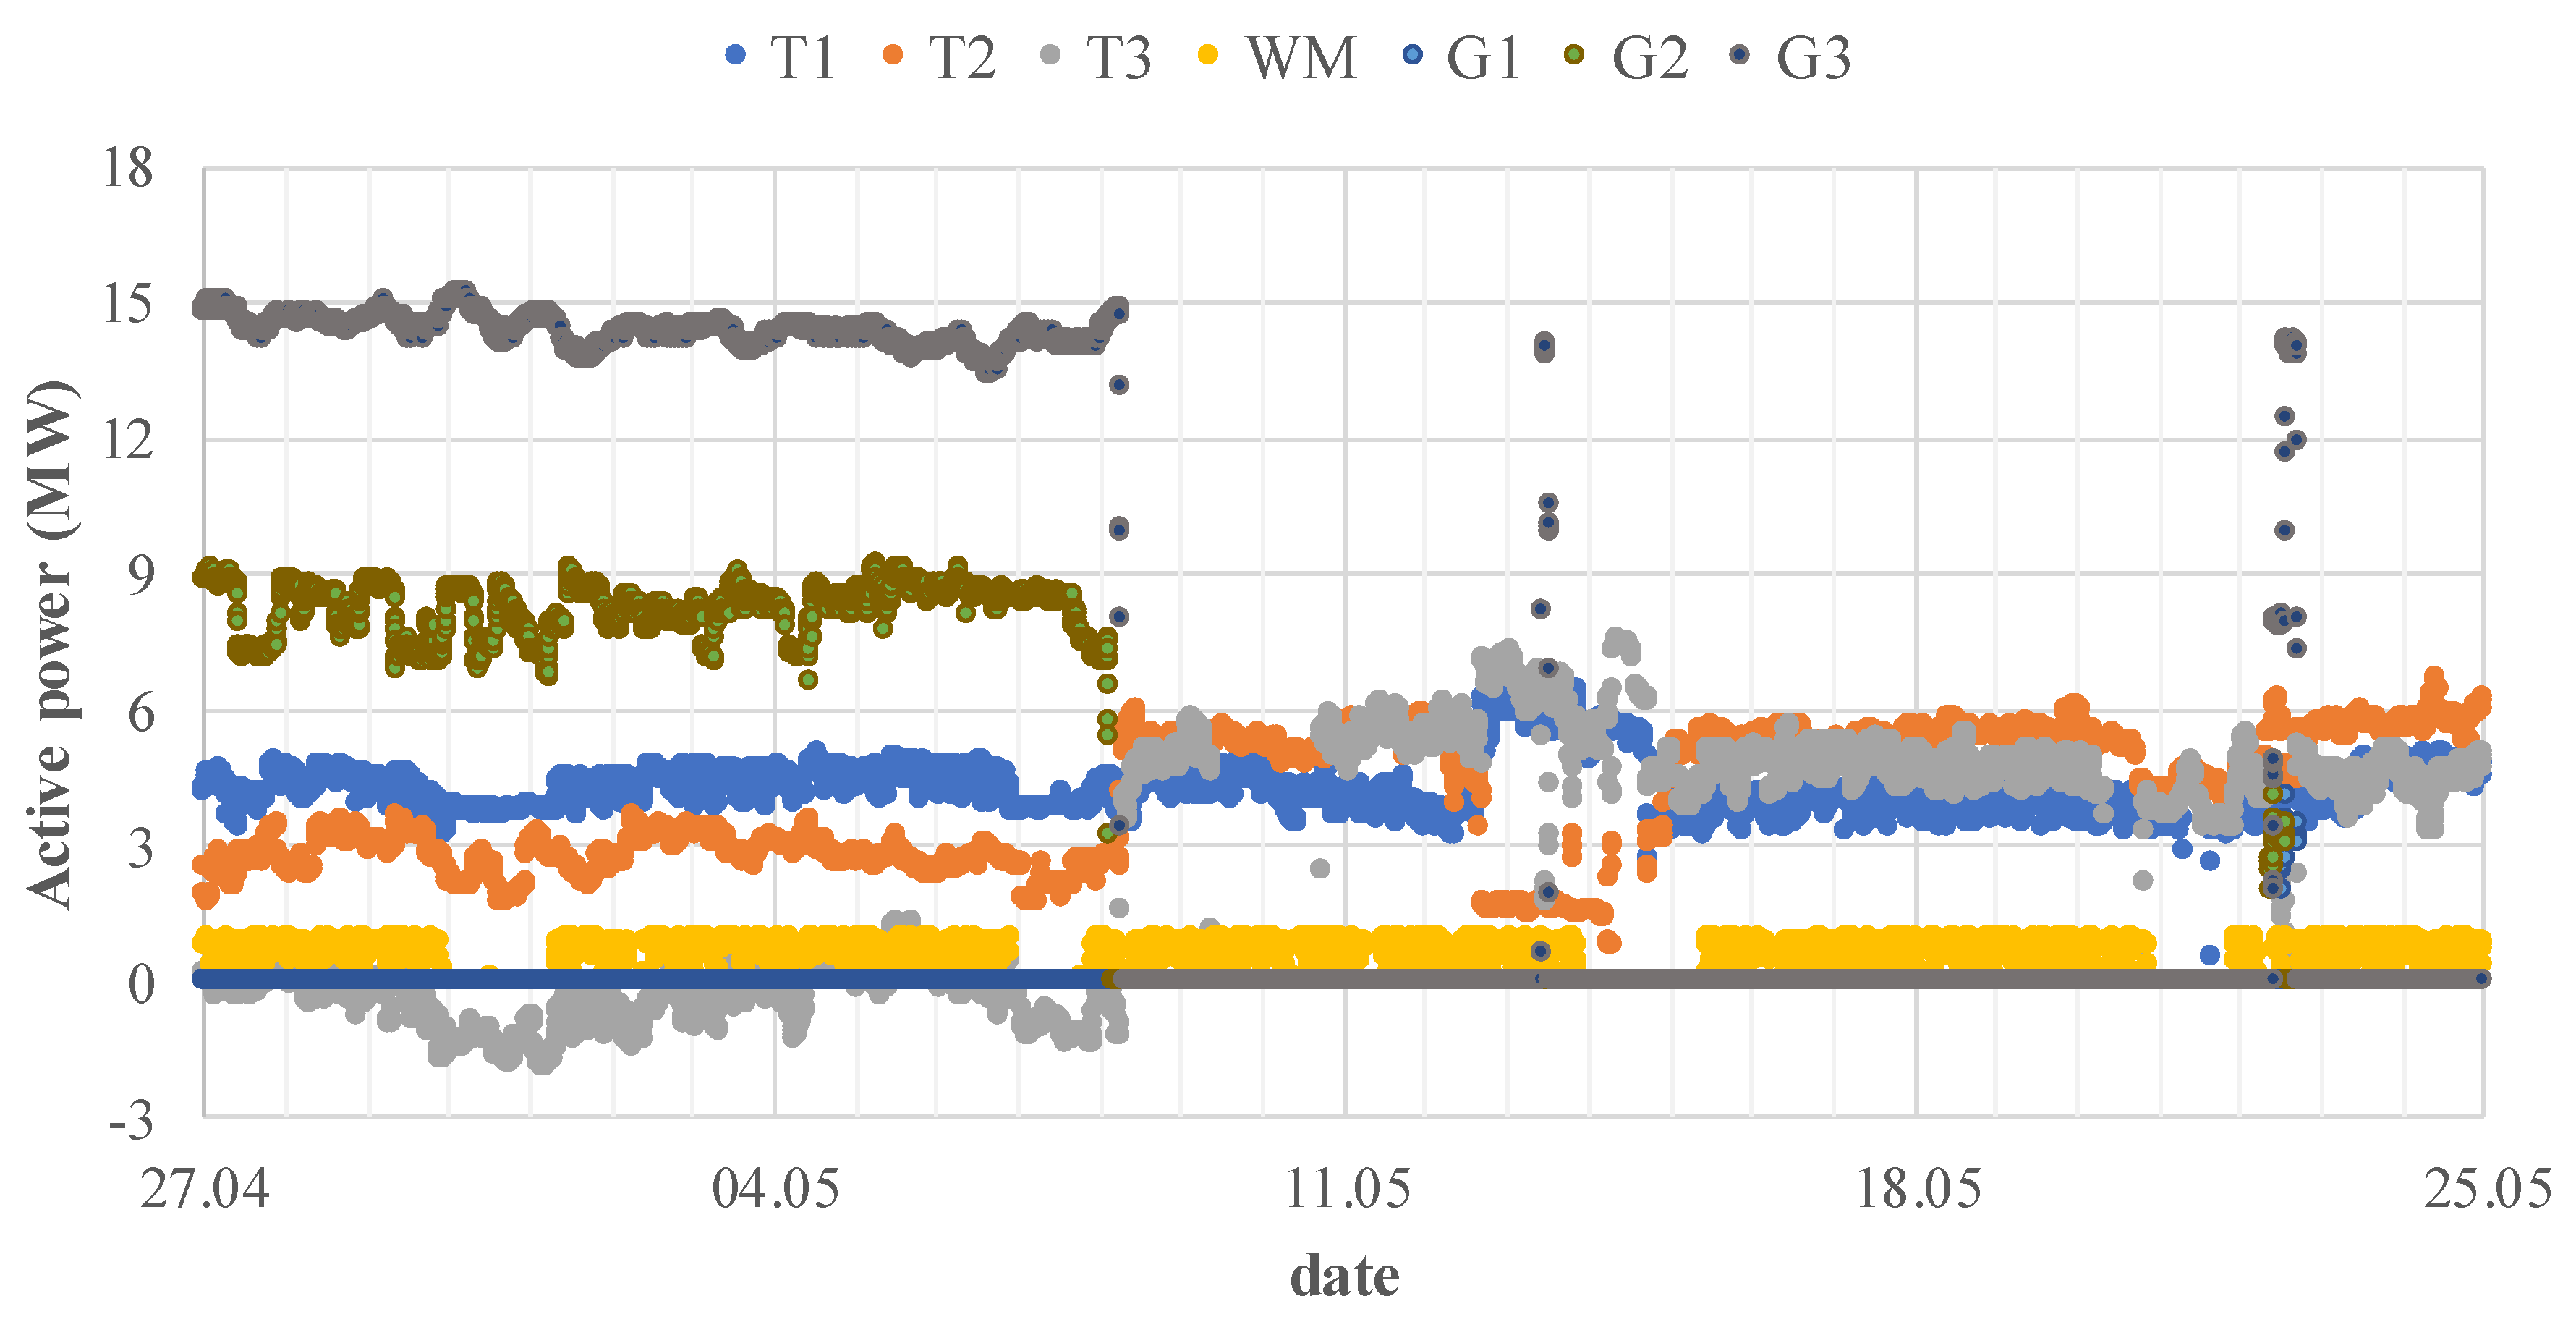
- active power level (P)
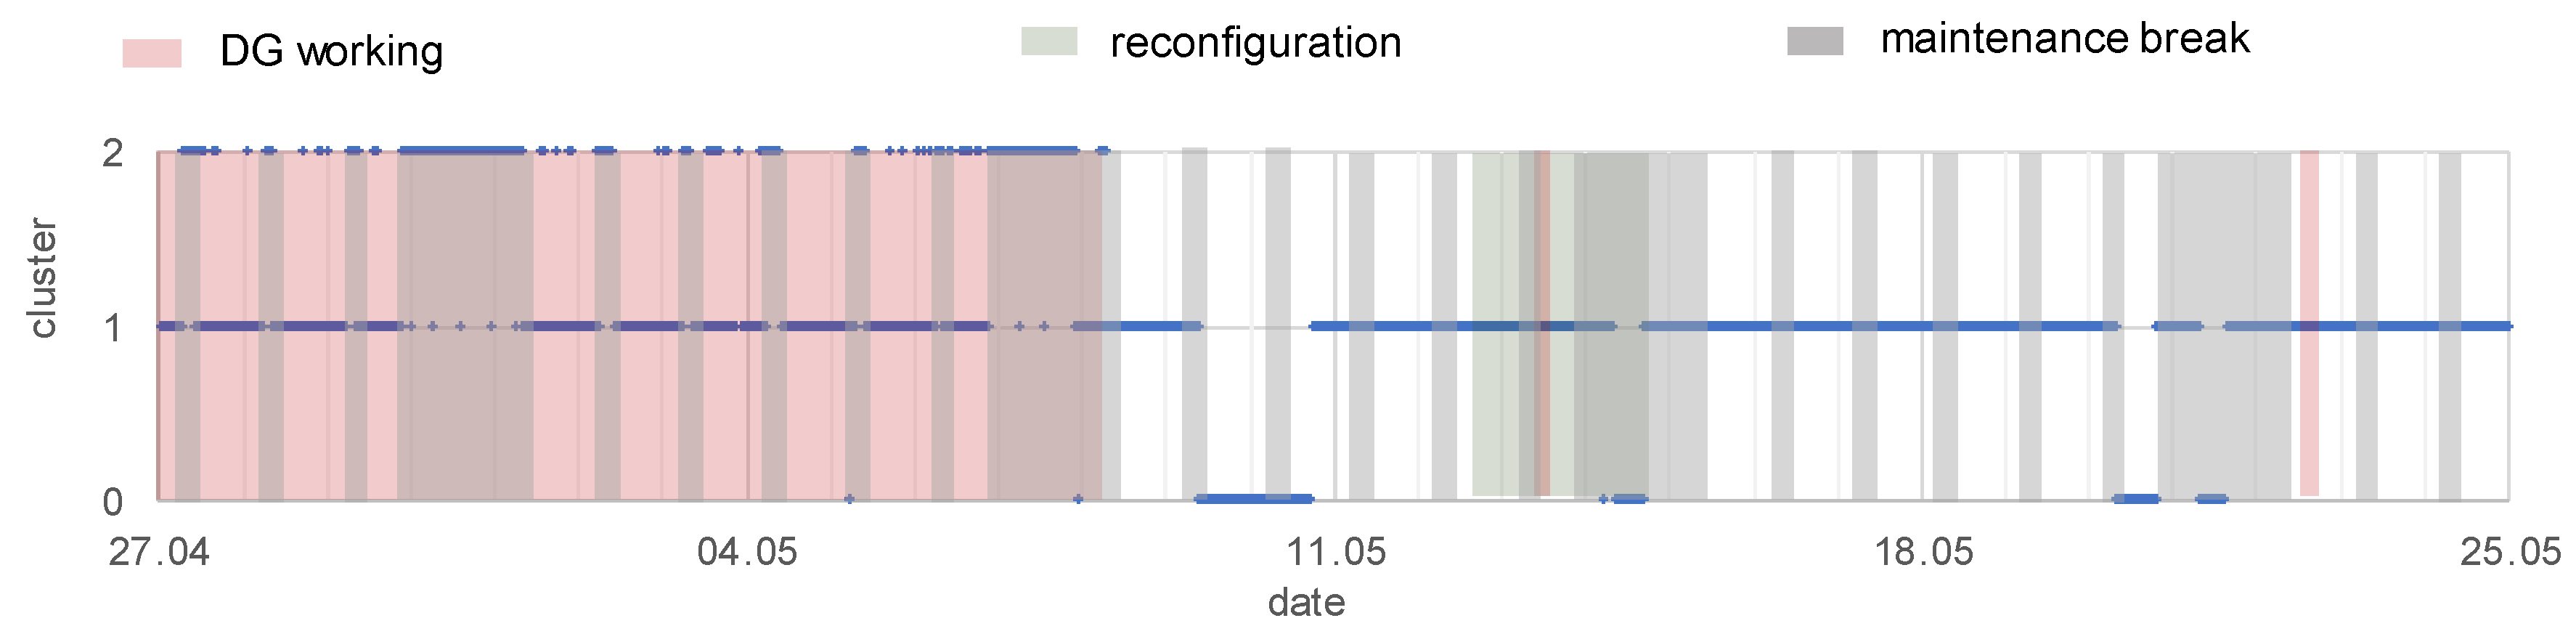
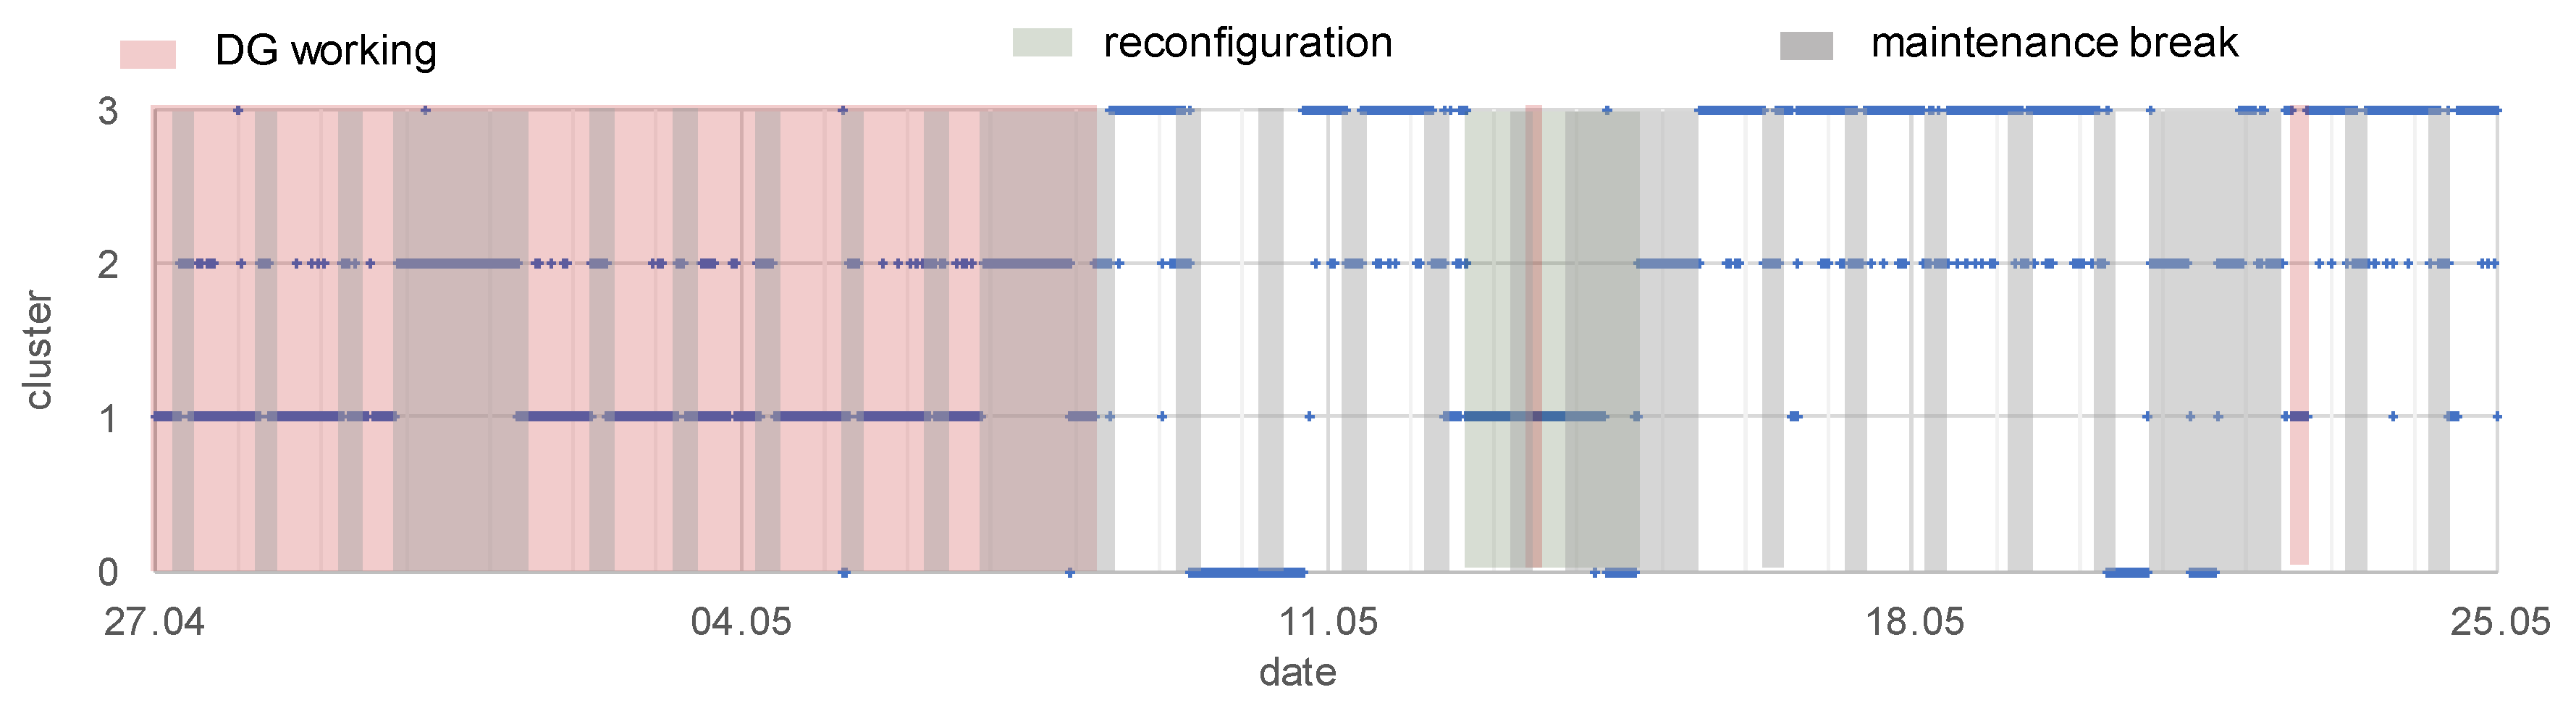
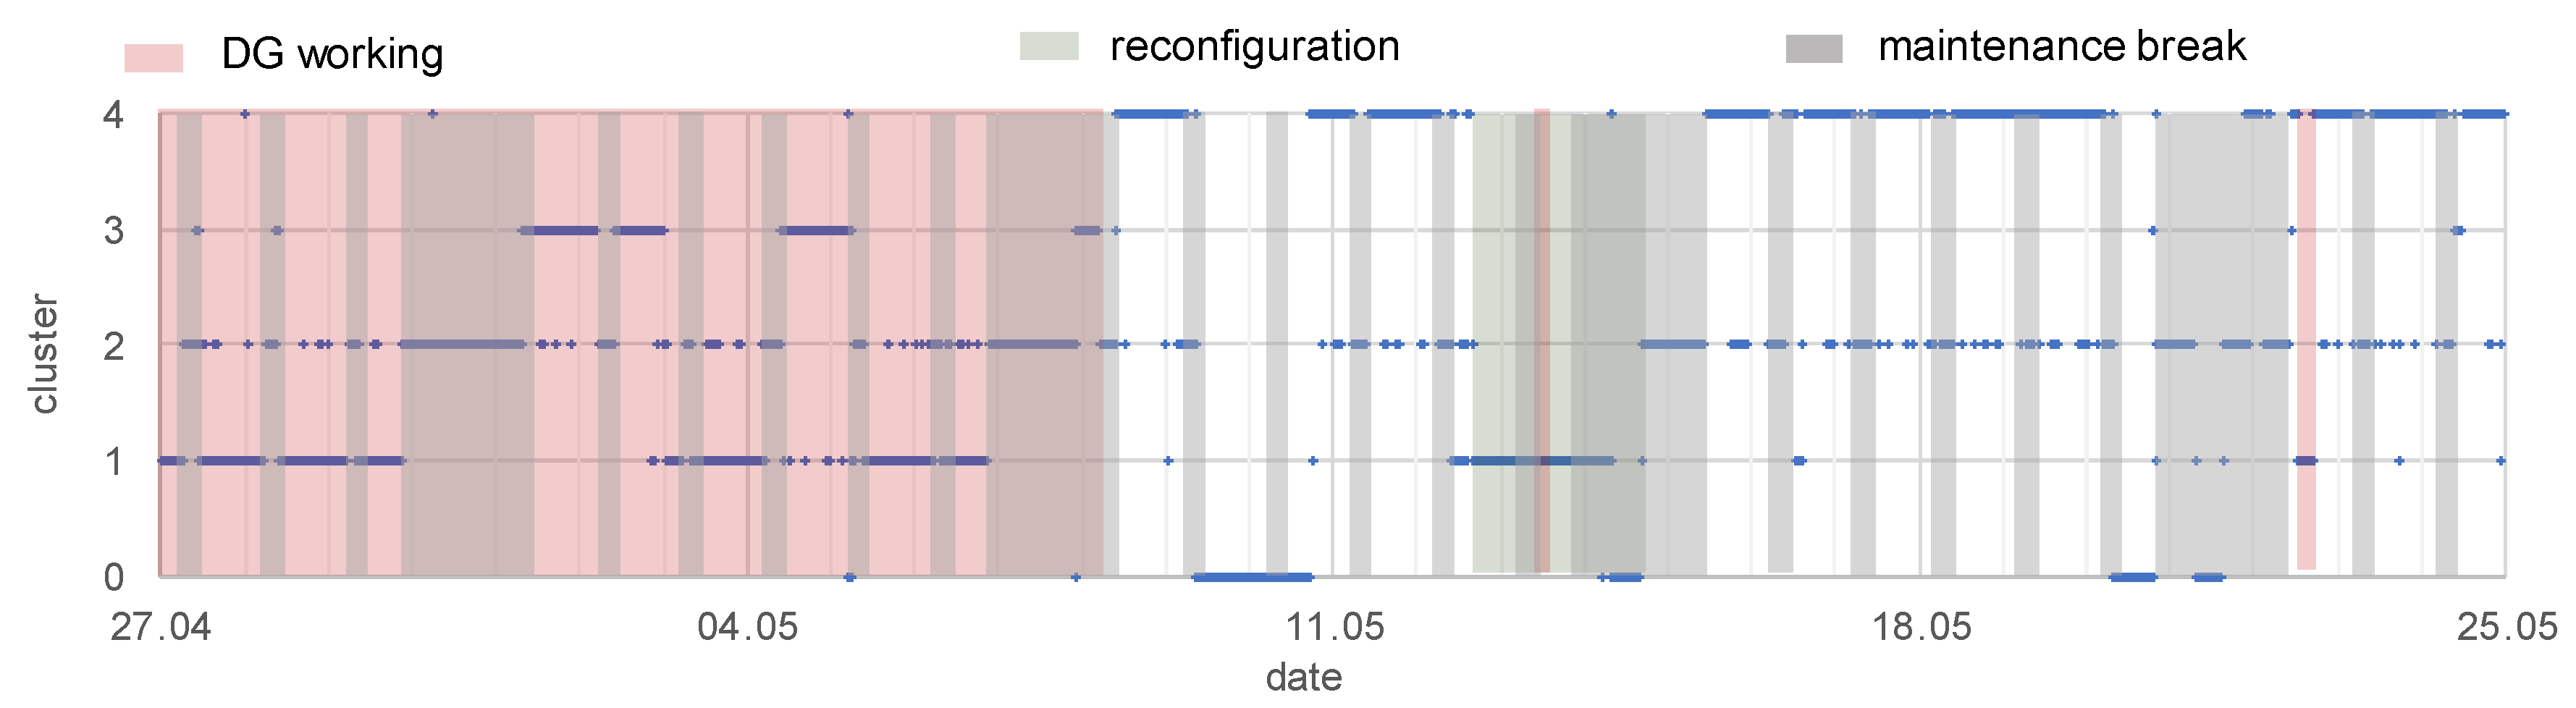
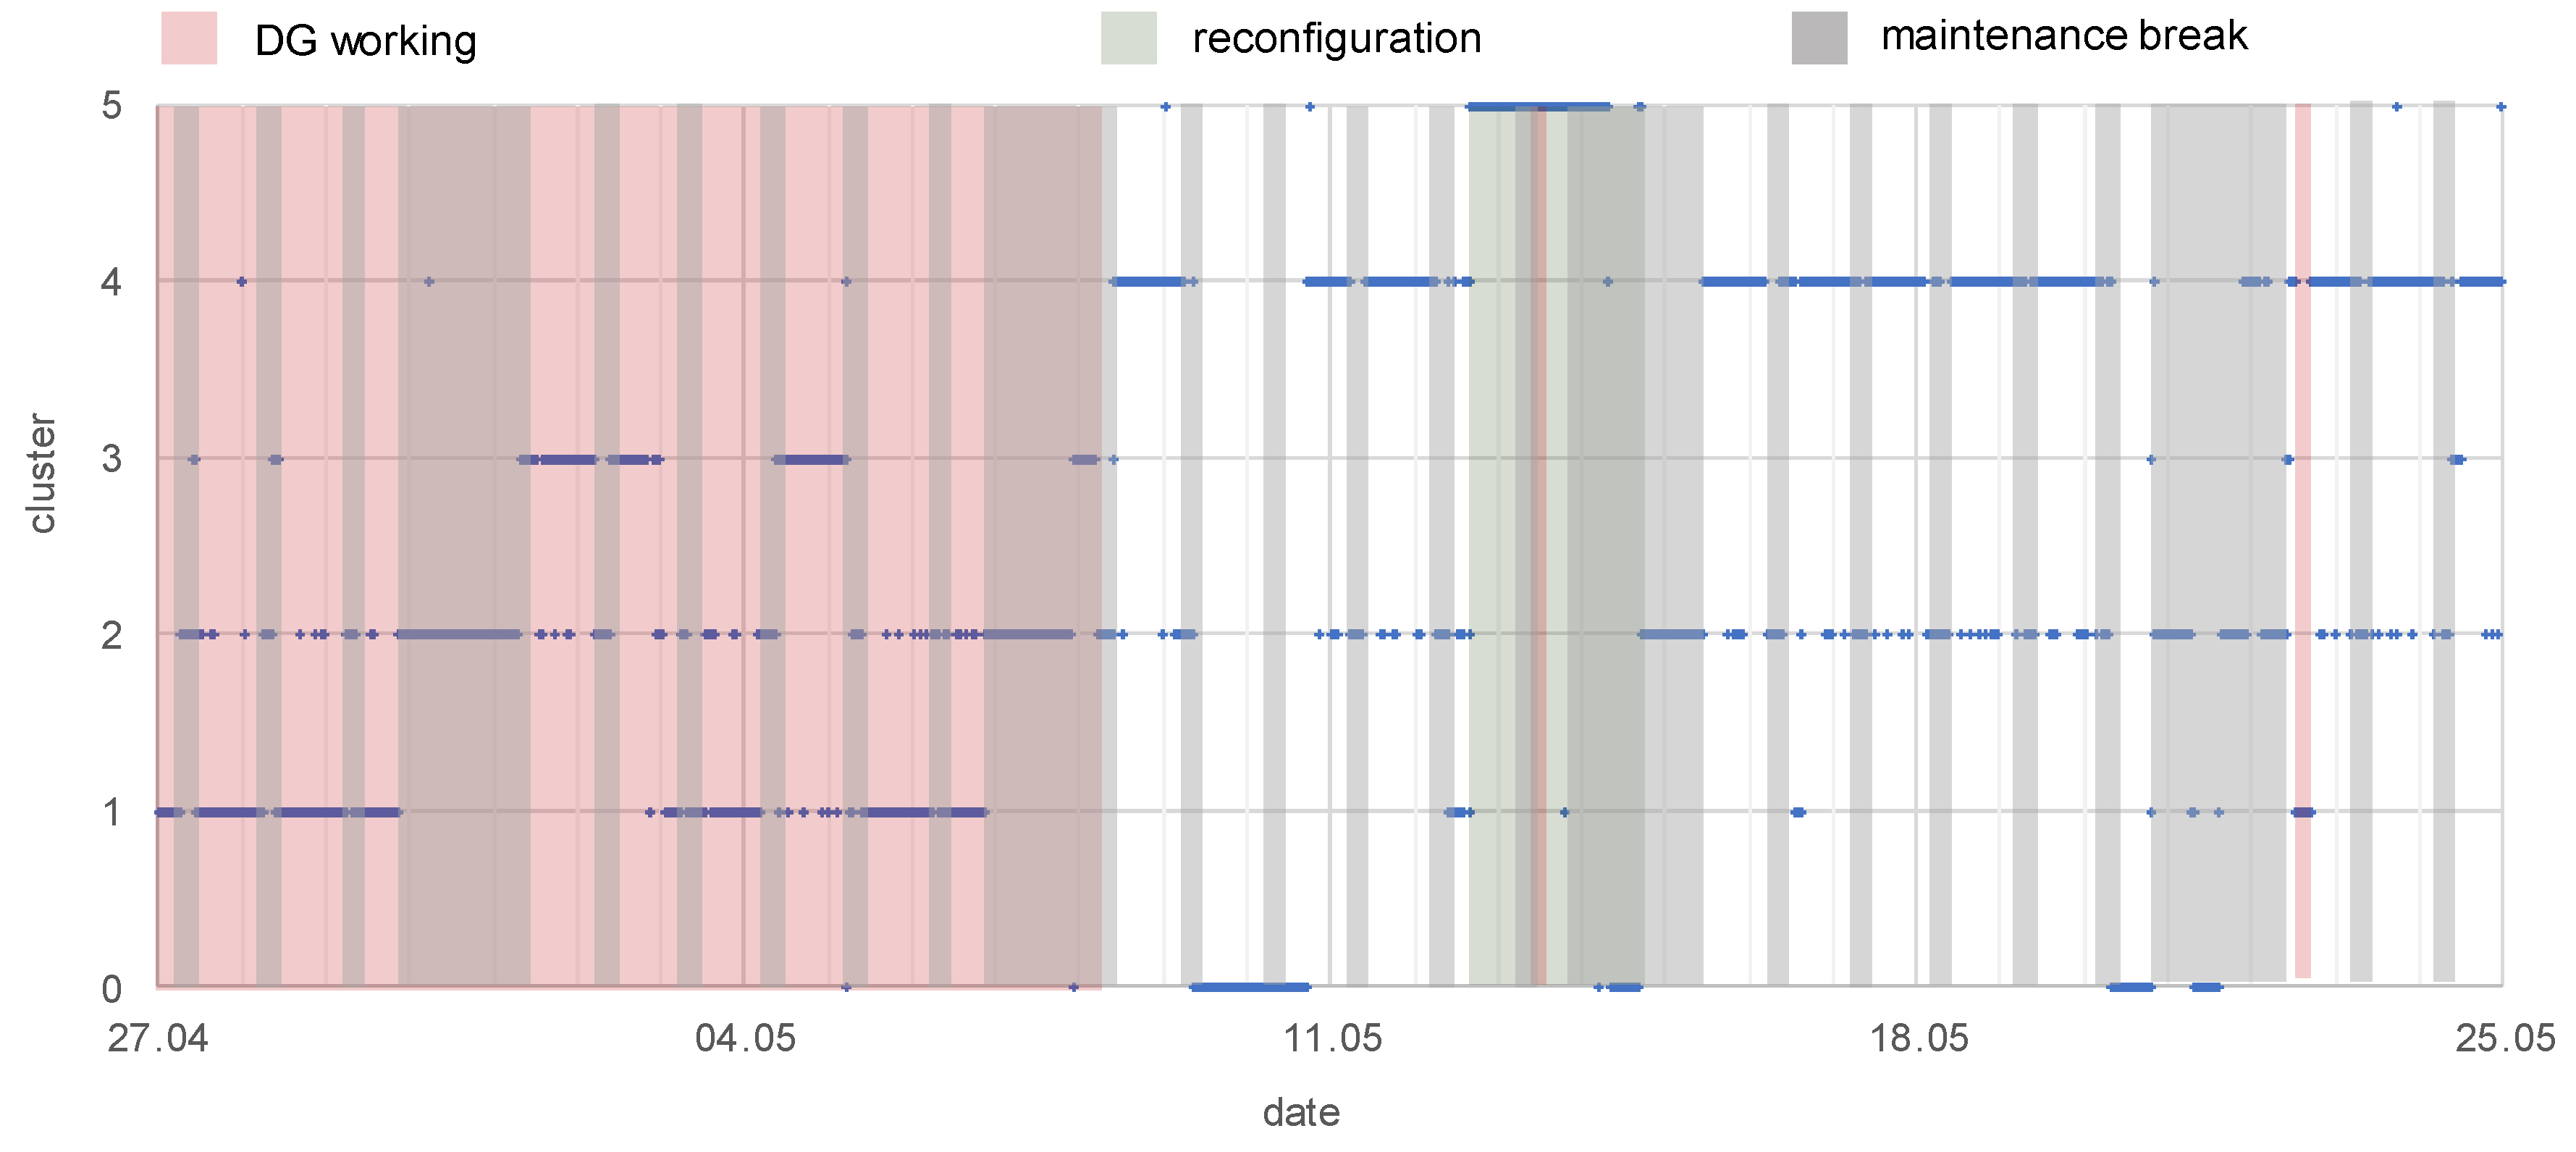
3.3.2. Clustering to Indicate Different Working Conditions of the EPN
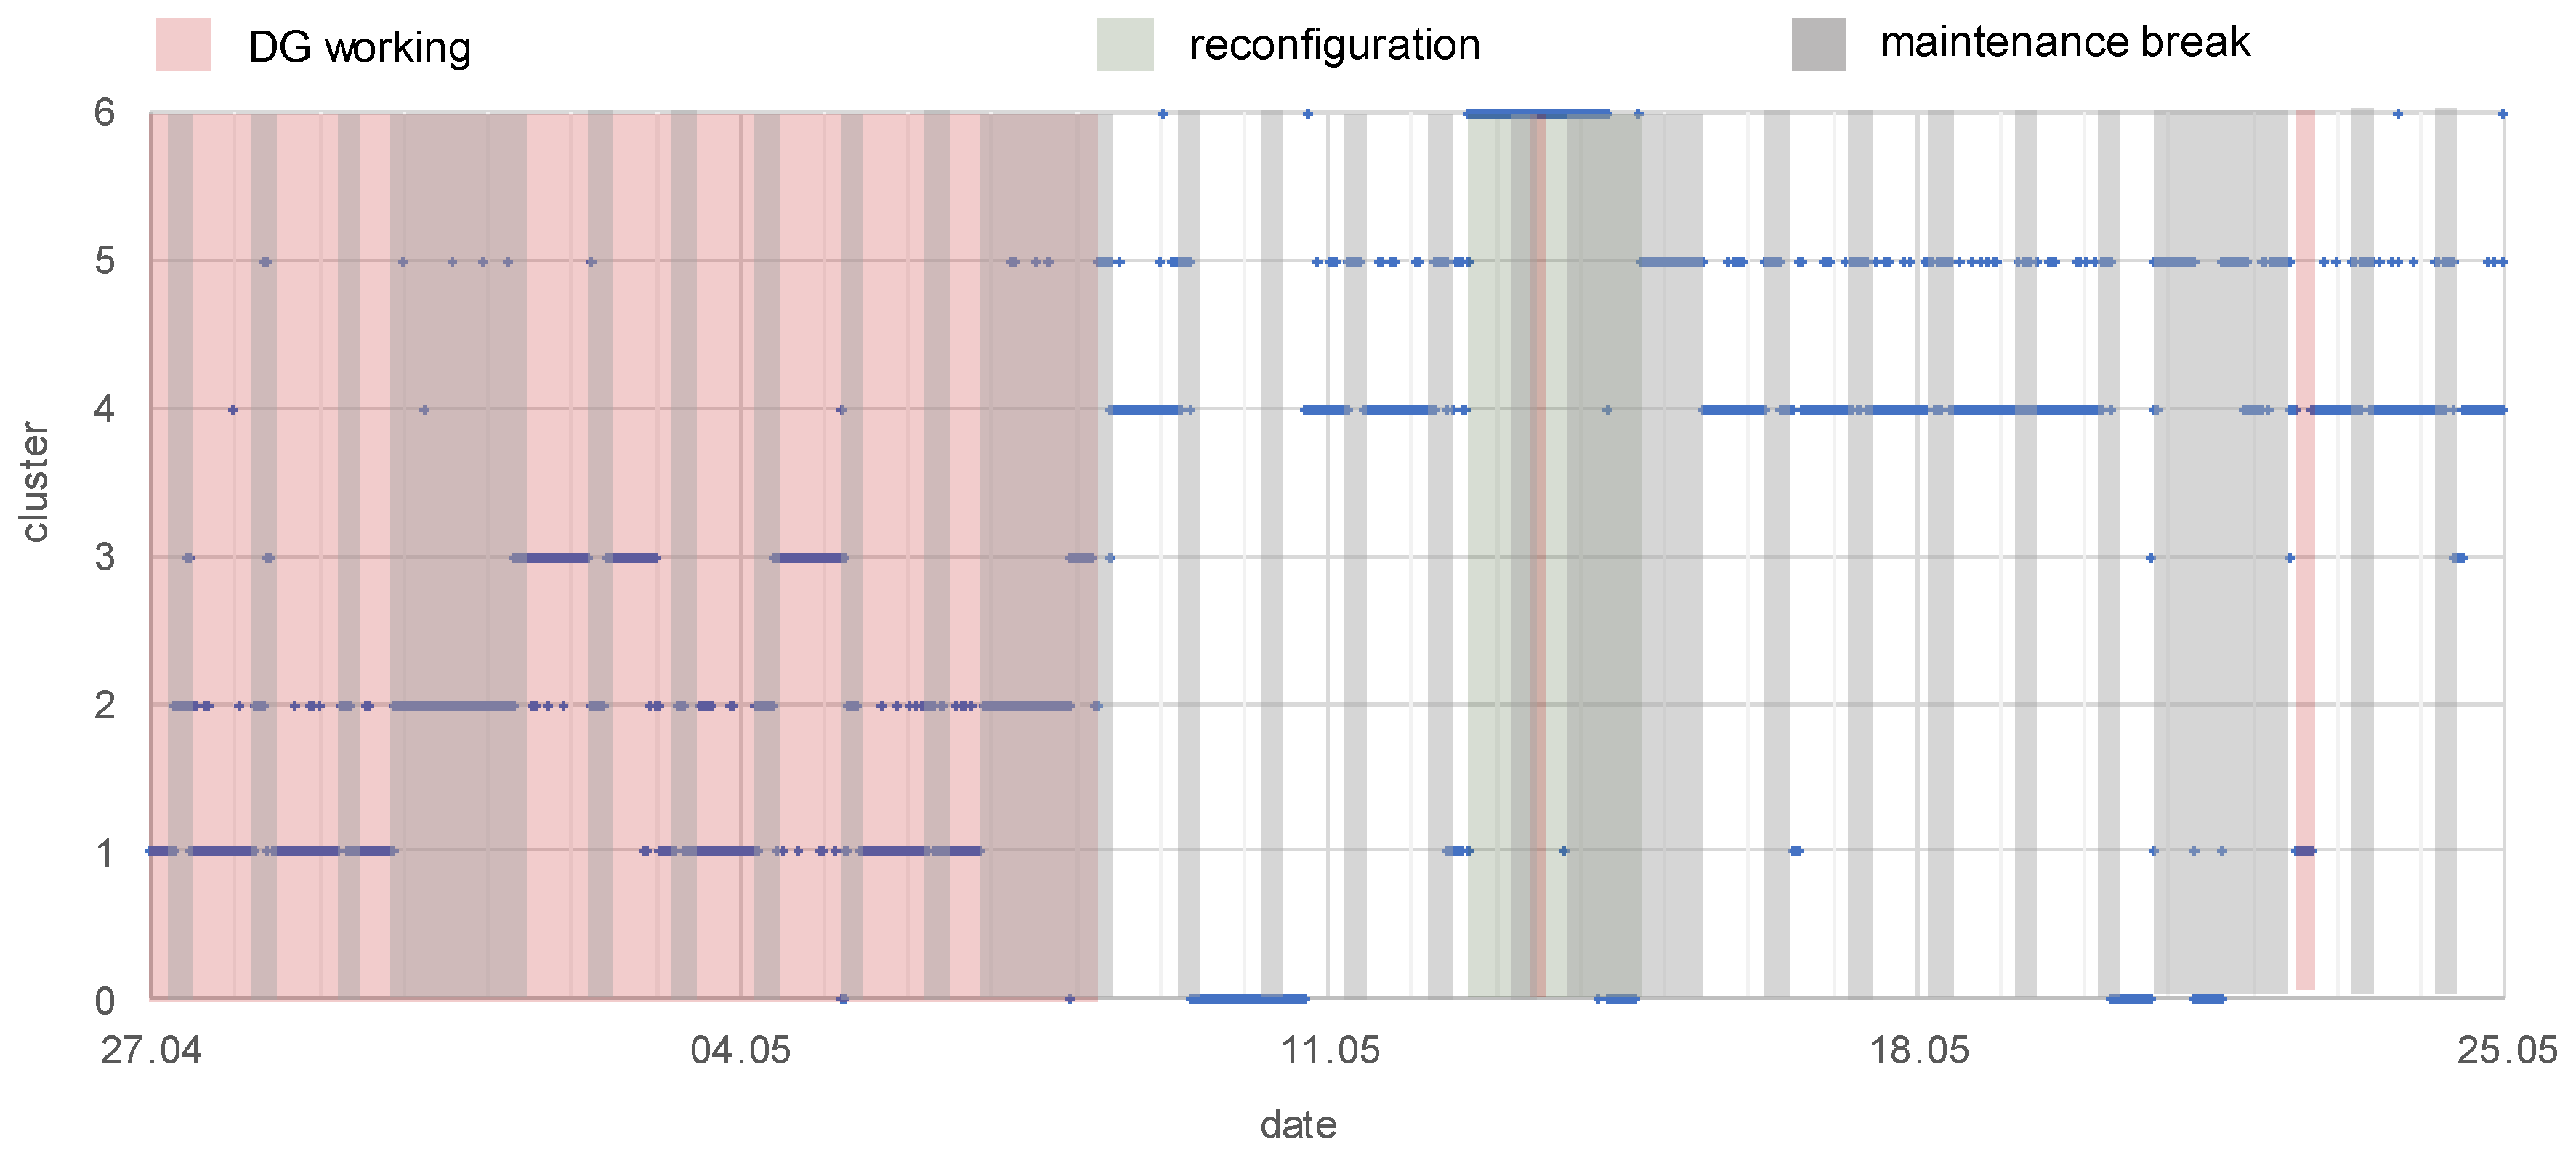
- working or non-working of distributed generation (G2, G3)—the knowledge was obtained from a monitoring system of gas-steam units:
- working of DG: from 27.04, hour 00:00, to 08.05, hour 06:00; day 13.05, hours 11.00–12.00; day 22.05, hours 13.20–16.50
- reconfiguration of the network, the supply of main loads was relocated between substations—the knowledge was obtained from the Supervisory Control And Data Acquisition (SCADA) system:
- from 12.05.2017, hour 16.10 to 14.05.2017, hour 22:20
- maintenance breaks that are connected to the mining industry’s working schedule—checking the technical conditions of machines, a shift timetable, working on weekends:
- each Monday–Saturday, hours 6.00–10.00: maintenance break during the first shift
- each Saturday, hour 22.00 to Monday, hour 6.00: the weekend character of working
- c1: DG is working, exploitation time
- c2: DG is working, maintenance breaks time
- c3: DG is working, unknown working condition
- c4: DG is non-working, exploitation time
- c5: DG is non-working, maintenance breaks time
- c6: DG is non-working, reconfiguration of the network
- the active power level for the transformers T1, T2, and T3
- the total harmonic distortion in the voltage for transformer T3 and the welding machine—WM
- the short-term flicker severity for the transformers T2, T3, and the welding machine—WM
3.3.3. Qualitative Assessment of Clusters
- minimal—the minimal value of the parameter that may be found for the observed cluster
- maximal—the maximal value of the parameter that may be found for the observed cluster
- mean—the mean value calculated from all the data for the observed cluster
- standard deviation—the standard deviation calculated from all the data for the observed cluster.
- (c1 with c2) and (c4 with c5)—> comparison of time with the different characters of the company that iss working (exploitation vs. maintenance break). It could be observed that the mean value of Pst for T3 and WM is lower during the maintenance break. Therefore, in terms of flicker severity, the time of maintenance is better.
- (c1 with c2) and (c4 with c5)—>comparison of time with the different characters of the company that is working (exploitation vs. maintenance break). It could be observed that the mean value of THDu for T3 and WM are lower during the maintenance break. Therefore, in terms of the harmonic content, the time of maintenance is better.
- (c1 with c4) and (c2 with c5)—> comparison of time with the different characters of the working DG. It could be observed that Pst for T3 and WM is lower for the time when the DG is working (c1, c2) compared to when the DG is switched off (c4, c5). Therefore, in terms of flicker severity, the time when the DG is working is better.
- c3 with all other clusters—> this unknown working condition represents the time when the THDu level for T3 and WM is higher than for the other clusters.
- c6 with all other clusters—> the reconfiguration that represents the time when Pst for T2 is very low. This is in agreement with the fact that T2 was underloaded, and therefore, the flicker is small
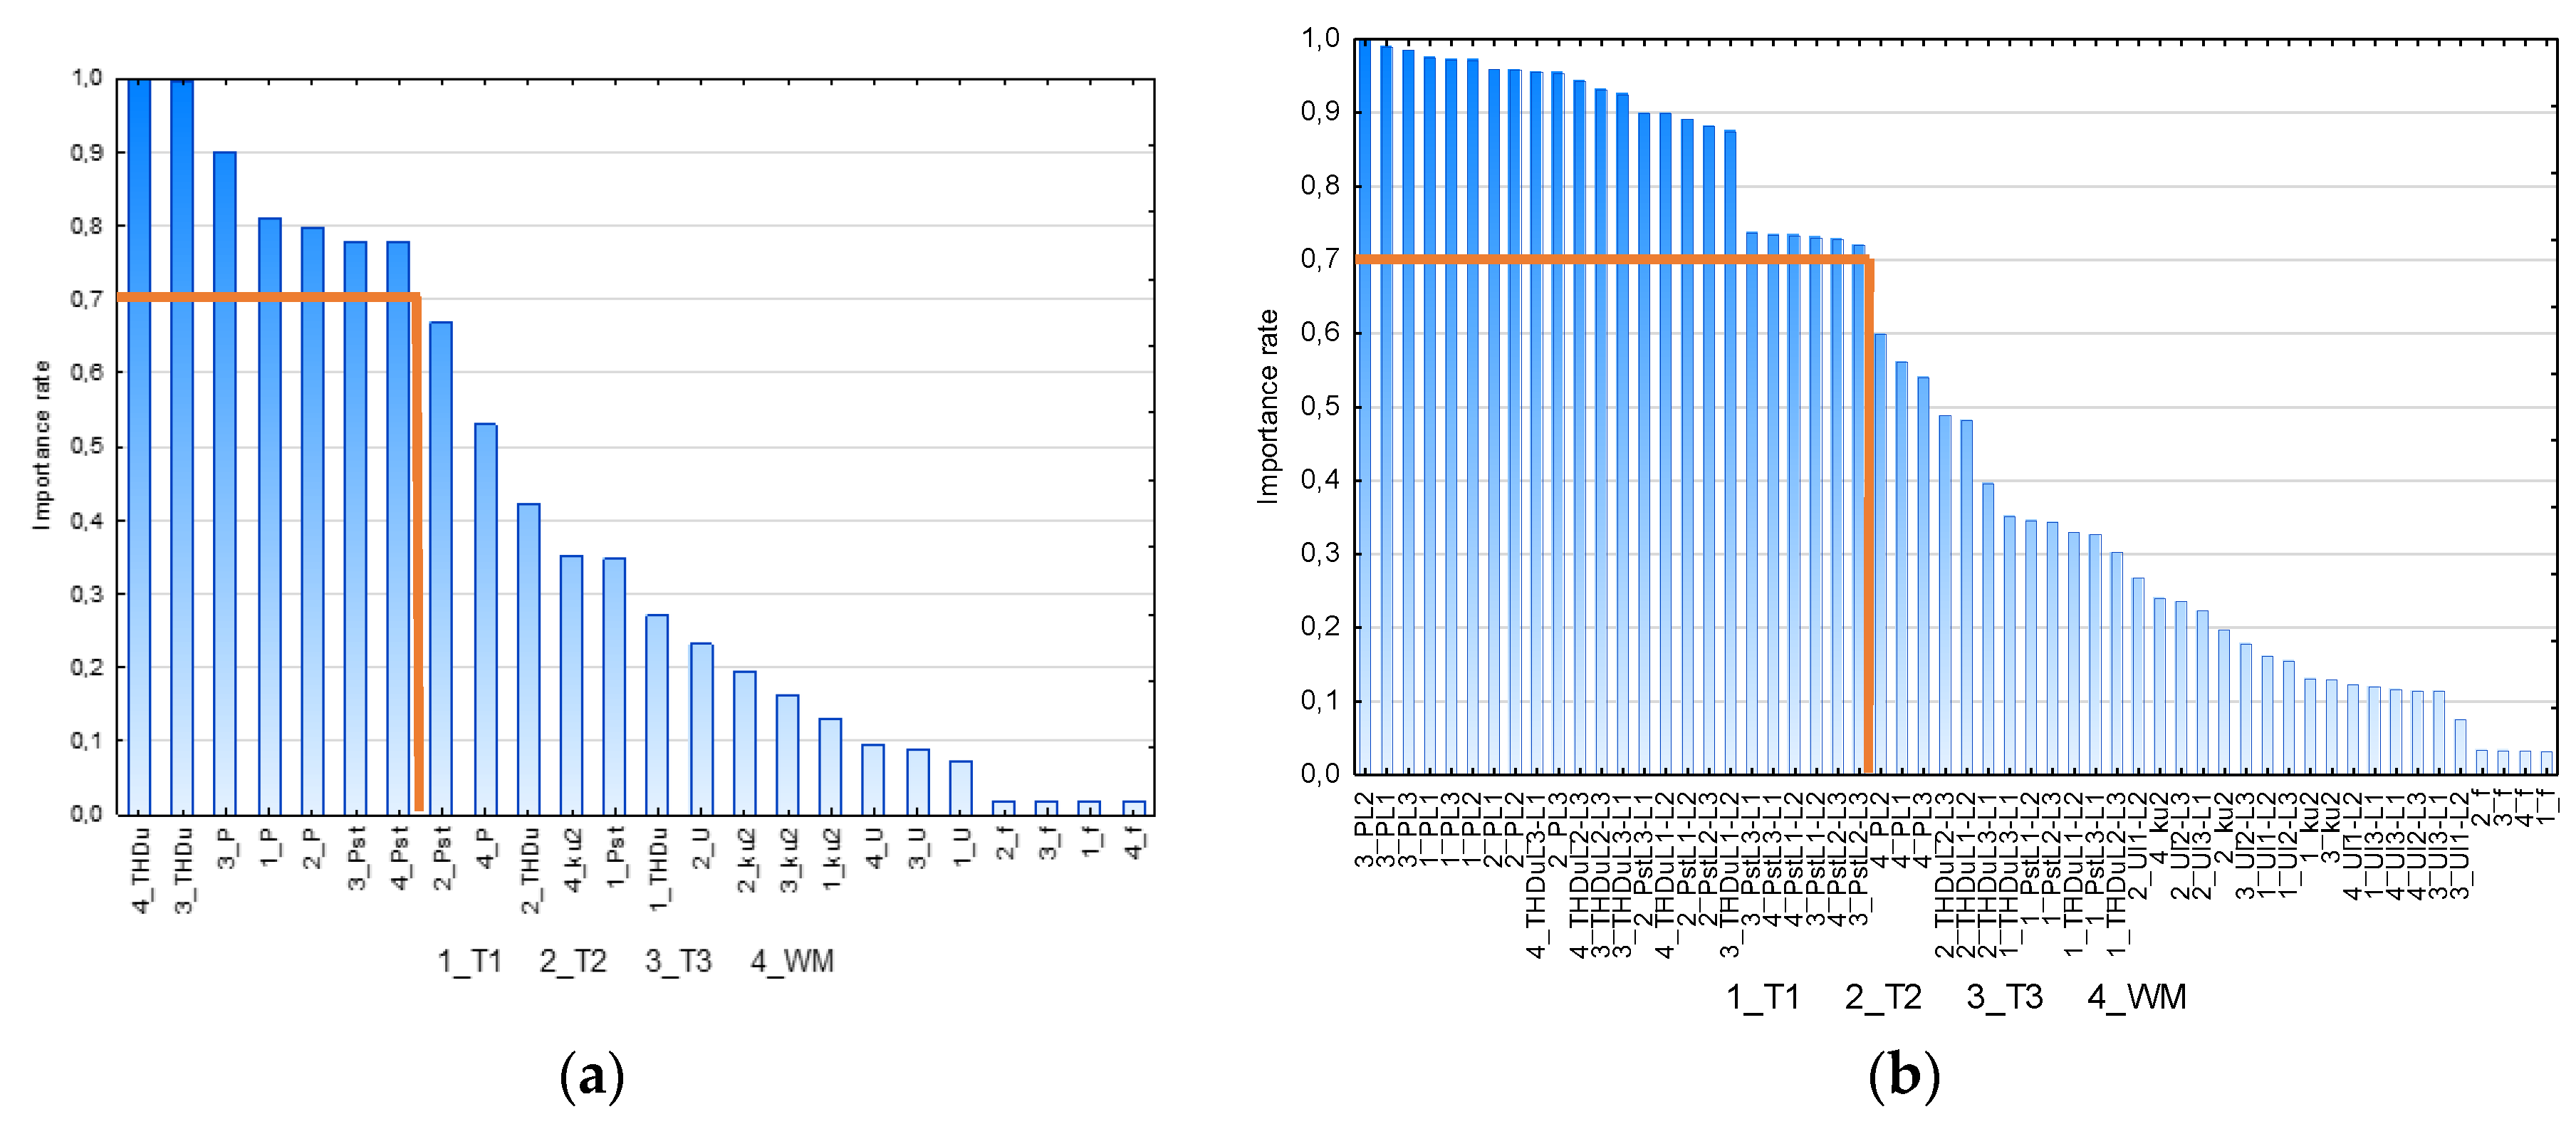
3.3.4. Reduction of the Input Database Size—Case Study
- voltage
- short-term flicker severity
- total harmonic distortion in voltage
- active power
- transformer T1—active power
- transformer T2—active power
- transformer T3—active power, total harmonic distortion in voltage, short-term flicker severity
- welding machine WM—active power, total harmonic distortion in voltage, short-term flicker severity
3.4. Discussion
4. Conclusions
Author Contributions
Funding
Acknowledgments
Conflicts of Interest
References
- Oncioiu, I.; Căpuşneanu, S.; Türkeș, M.; Topor, D.; Constantin, D.-M.; Marin-Pantelescu, A.; Ștefan Hint, M. The Sustainability of Romanian SMEs and Their Involvement in the Circular Economy. Sustainability 2018, 10, 2761. [Google Scholar] [CrossRef]
- Türkeș, M.; Oncioiu, I.; Aslam, H.; Marin-Pantelescu, A.; Topor, D.; Căpușneanu, S. Drivers and Barriers in Using Industry 4.0: A Perspective of SMEs in Romania. Processes 2019, 7, 153. [Google Scholar] [CrossRef]
- Oncioiu, I.; Bunget, O.C.; Türkeș, M.C.; Căpușneanu, S.; Topor, D.I.; Tamaș, A.S.; Rakos, I.-S.; Hint, M.Ș. The Impact of Big Data Analytics on Company Performance in Supply Chain Management. Sustainability 2019, 11, 4864. [Google Scholar] [CrossRef]
- Salkuti, S.R. A survey of big data and machine learning. Int. J. Electr. Comput. Eng. 2020, 10, 575. [Google Scholar] [CrossRef][Green Version]
- Ghorbanian, M.; Dolatabadi, S.H.; Siano, P. Big Data Issues in Smart Grids: A Survey. IEEE Syst. J. 2019, 13, 4158–4168. [Google Scholar] [CrossRef]
- Dhupia, B.; Usha Rani, M.; Alameen, A. The role of big data analytics in smart grid management. In Proceedings of the 2nd International Conference on Computing, Communications Data Engineering CCODE 2019, Tirupati, India, 1–2 February 2019; Volume 1054, pp. 403–412. [Google Scholar]
- Ding, Y. Analysis of Operation and Maintenance of Power Distribution Network Management Technology Under the Background of Big Data Era. In International Conference on Big Data Analytics for Cyber-Physical-Systems; Springer: Singapore, 2020; pp. 610–615. [Google Scholar]
- Jasiński, M.; Sikorski, T.; Borkowski, K. Clustering as a tool to support the assessment of power quality in electrical power networks with distributed generation in the mining industry. Electr. Power Syst. Res. 2019, 166, 52–60. [Google Scholar] [CrossRef]
- Jasiński, M.; Sikorski, T.; Kostyła, P.; Leonowicz, Z.; Borkowski, K. Combined Cluster Analysis and Global Power Quality Indices for the Qualitative Assessment of the Time-Varying Condition of Power Quality in an Electrical Power Network with Distributed Generation. Energies 2020, 13, 2050. [Google Scholar] [CrossRef]
- Strack, J.L.; Carugati, I.; Orallo, C.M.; Maestri, S.O.; Donato, P.G.; Funes, M.A. Three-phase voltage events classification algorithm based on an adaptive threshold. Electr. Power Syst. Res. 2019, 172, 167–176. [Google Scholar] [CrossRef]
- Shikhin, V.A.; Kochengin, A.E.; Pavliuk, G.P. Significant Events Detection and Identification through Electrical Grid Load Profile. In Proceedings of the 2018 IEEE Renewable Energies, Power Systems & Green Inclusive Economy (REPS-GIE), Casablanca, Morocco, 23–24 April 2018; pp. 1–5. [Google Scholar]
- Ucar, F.; Alcin, O.F.; Dandil, B.; Ata, F. Power quality event detection using a fast extreme learning machine. Energies 2018, 11, 145. [Google Scholar] [CrossRef]
- Biswal, B.; Biswal, M.; Mishra, S.; Jalaja, R. Automatic classification of power quality events using balanced neural tree. IEEE Trans. Ind. Electron. 2014, 61, 521–530. [Google Scholar] [CrossRef]
- Jasiński, M.; Sikorski, T.; Borkowski, K. Application of cluster analysis to identification flagged power quality measurements in area-related approach. Zastosowanie eksploracji danych do identyfikacji oznaczonych wyników pomiaru jakosci energii elektrycznej w ujeciu obszarowym. Prz. Elektrotechniczny 2020, 3, 9–12. [Google Scholar]
- Balouji, E.; Salor, O. Classification of power quality events using deep learning on event images. In Proceedings of the 3rd International Conference on Pattern Analysis Image Analysis IPRIA 2017, Shahrekord, Iran, 19–20 April 2017. [Google Scholar]
- Dangar, B.; Josh, S.K. Interpretation of Urban Power Consumers Behaviors to Predict Power Loss in Summer. Int. J. Eng. Adv. Technol. 2019, 9, 563–565. [Google Scholar]
- Yun, Z.; Mengting, Y.; Junjie, L.; Ji, C.; Penghui, H. Line loss calculation of low-voltage districts based on improved K-Means. In Proceedings of the 2018 IEEE International Conference on Power System Technology (POWERCON), Beijing, China, 24–26 October 2018; pp. 4578–4583. [Google Scholar]
- Yao, M.; Zhu, Y.; Li, J.; Wei, H.; He, P. Research on Predicting Line Loss Rate in Low Voltage Distribution Network Based on Gradient Boosting Decision Tree. Energies 2019, 12, 2522. [Google Scholar] [CrossRef]
- Menezes, A.G.C.; Almeida, O.M.; Barbosa, F.R. Use of decision tree algorithms to diagnose incipient faults in power transformers. In Proceedings of the 2018 IEEE Simposio Brasileiro de Sistemas Eletricos (SBSE), Niteroi, Brazil, 12–16 May 2018; pp. 1–6. [Google Scholar]
- Liu, C.H.; Chen, T.L.; Yao, L.T.; Wang, S.Y. Using data mining to dissolved gas analysis for power transformer fault diagnosis. In Proceedings of the 2012 IEEE International Conference on Machine Learning and Cybernetics, Xian, China, 15–17 July 2012; pp. 1952–1957. [Google Scholar]
- Basuki, A. Suwarno Online Dissolved Gas Analysis of Power Transformers Based on Decision Tree Model. In Proceedings of the 2018 IEEE Conference on Power Engineering and Renewable Energy (ICPERE), Solo, Indonesia, 29–31 October 2018; pp. 1–6. [Google Scholar]
- Ren, F.; Si, S.; Cai, Z.; Zhang, S. Transformer fault analysis based on Bayesian networks and importance measures. J. Shanghai Jiaotong Univ. 2015, 20, 353–357. [Google Scholar] [CrossRef]
- Cheng, L.; Yu, T. Dissolved Gas Analysis Principle-Based Intelligent Approaches to Fault Diagnosis and Decision Making for Large Oil-Immersed Power Transformers: A Survey. Energies 2018, 11, 913. [Google Scholar] [CrossRef]
- Almeida, V.A.; Pessanha, J.F.M.; Caloba, L.P. Load data cleaning with data mining techniques. In Proceedings of the 2018 IEEE Simposio Brasileiro de Sistemas Eletricos (SBSE), Niteroi, Brazil, 12–16 May 2018; pp. 1–6. [Google Scholar]
- Kotriwala, A.M.; Hernandez-Leal, P.; Kaisers, M. Load Classification and Forecasting for Temporary Power Installations. In Proceedings of the 2018 IEEE PES Innovative Smart Grid Technologies Conference Europe (ISGT-Europe), Sarajevo, Bosnia, 21–25 October 2018; pp. 1–6. [Google Scholar]
- Cerne, G.; Dovzan, D.; Skrjanc, I. Short-Term Load Forecasting by Separating Daily Profiles and Using a Single Fuzzy Model Across the Entire Domain. IEEE Trans. Ind. Electron. 2018, 65, 7406–7415. [Google Scholar] [CrossRef]
- Lei, J.; Jin, T.; Hao, J.; Li, F. Short-term load forecasting with clustering–regression model in distributed cluster. Clust. Comput. 2019, 22, 10163–10173. [Google Scholar] [CrossRef]
- Fahiman, F.; Erfani, S.M.; Leckie, C. Robust and Accurate Short-Term Load Forecasting: A Cluster Oriented Ensemble Learning Approach. In Proceedings of the 2019 IEEE International Joint Conference on Neural Networks (IJCNN), Budapest, Hungary, 14–19 July 2019; pp. 1–8. [Google Scholar]
- Arun Jees, S.; Gomathi, V. Load forecasting for smart grid using non-linear model in Hadoop distributed file system. Clust. Comput. 2019, 22, 13533–13545. [Google Scholar] [CrossRef]
- Rajabi, A.; Eskandari, M.; Ghadi, M.J.; Li, L.; Zhang, J.; Siano, P. A comparative study of clustering techniques for electrical load pattern segmentation. Renew. Sustain. Energy Rev. 2019, 120, 109628. [Google Scholar] [CrossRef]
- Verdu, S.V.; Garcia, M.O.; Senabre, C.; Marin, A.G.; Franco, F.J.G. Classification, Filtering, and Identification of Electrical Customer Load Patterns Through the Use of Self-Organizing Maps. IEEE Trans. Power Syst. 2006, 21, 1672–1682. [Google Scholar] [CrossRef]
- Le Ray, G.; Pinson, P. Online adaptive clustering algorithm for load profiling. Sustain. Energy Grids Netw. 2019, 17, 100181. [Google Scholar] [CrossRef]
- Chicco, G. Overview and performance assessment of the clustering methods for electrical load pattern grouping. Energy 2012, 42, 68–80. [Google Scholar] [CrossRef]
- Ramdasi, A.P.; Mehata, K.M. Improved Text Mining Algorithm for Fault Detection using Combined D-Matrix. Int. J. Recent Technol. Eng. 2019, 8, 1376–1379. [Google Scholar]
- Gao, T.; Boguslawski, B.; Marié, S.; Béguery, P.; Thebault, S.; Lecoeuche, S. Data mining and data-driven modelling for Air Handling Unit fault detection. In E3S Web of Conferences; EDP Sciences: Jules, France, 2019; Volume 111. [Google Scholar]
- Chen, L.; Xu, G.; Zhang, Q.; Zhang, X. Learning deep representation of imbalanced SCADA data for fault detection of wind turbines. Measurement 2019, 139, 370–379. [Google Scholar] [CrossRef]
- Ranjbar, S.; Jamali, S. Fault detection in microgrids using combined classification algorithms and feature selection methods. In Proceedings of the 13th International Conference on Protection and Automation of Power System, IPAPS 2019, Tehran, Iran, 31 December 2019–1 January 2020; Institute of Electrical and Electronics Engineers Inc., School of Electrical Engineering, Iran University of Science and Technology (IUST): Tehran, Iran, 2019; pp. 17–21. [Google Scholar]
- Silva, S.; Costa, P.; Gouvea, M.; Lacerda, A.; Alves, F.; Leite, D. High impedance fault detection in power distribution systems using wavelet transform and evolving neural network. Electr. Power Syst. Res. 2018, 154, 474–483. [Google Scholar] [CrossRef]
- Sun, C.; Wang, X.; Zheng, Y.; Zhang, F. A framework for dynamic prediction of reliability weaknesses in power transmission systems based on imbalanced data. Int. J. Electr. Power Energy Syst. 2020, 117, 105718. [Google Scholar] [CrossRef]
- Sun, C.; Wang, X.; Zheng, Y. Data-driven approach for spatiotemporal distribution prediction of fault events in power transmission systems. Int. J. Electr. Power Energy Syst. 2019, 113, 726–738. [Google Scholar] [CrossRef]
- Pal, A.; Kumar, M. DLME: Distributed Log Mining Using Ensemble Learning for Fault Prediction. IEEE Syst. J. 2019, 13, 3639–3650. [Google Scholar] [CrossRef]
- Cynthia, S.T.; Ripon, S.H. Predicting and Classifying Software Faults. In Proceedings of the 2019 7th International Conference on Computer and Communications Management—ICCCM 2019, Bangkok, Thailand, 27–29 July 2019; ACM Press: New York, NY, USA, 2019; pp. 143–147. [Google Scholar]
- Rathod, R.R.; Garg, R.D. Regional electricity consumption analysis for consumers using data mining techniques and consumer meter reading data. Int. J. Electr. Power Energy Syst. 2016, 78, 368–374. [Google Scholar] [CrossRef]
- Benítez, I.; Quijano, A.; Díez, J.-L.; Delgado, I. Dynamic clustering segmentation applied to load profiles of energy consumption from Spanish customers. Int. J. Electr. Power Energy Syst. 2014, 55, 437–448. [Google Scholar] [CrossRef]
- Cil, I. Consumption universes based supermarket layout through association rule mining and multidimensional scaling. Expert Syst. Appl. 2012, 39, 8611–8625. [Google Scholar] [CrossRef]
- Zhang, G.; Wang, G.G.; Farhangi, H.; Palizban, A. Data mining of smart meters for load category based disaggregation of residential power consumption. Sustain. Energy Grids Netw. 2017, 10, 92–103. [Google Scholar] [CrossRef]
- Jain, P.K.; Quamer, W.; Pamula, R. Electricity Consumption Forecasting Using Time Series Analysis BT—Advances in Computing and Data Sciences; Singh, M., Gupta, P.K., Tyagi, V., Flusser, J., Ören, T., Eds.; Springer: Singapore, 2018; pp. 327–335. [Google Scholar]
- Yildiz, B.; Bilbao, J.I.; Dore, J.; Sproul, A.B. Recent advances in the analysis of residential electricity consumption and applications of smart meter data. Appl. Energy 2017, 208, 402–427. [Google Scholar] [CrossRef]
- Sheng, H.; Xiao, J.; Cheng, Y.; Ni, Q.; Wang, S. Short-Term Solar Power Forecasting Based on Weighted Gaussian Process Regression. IEEE Trans. Ind. Electron. 2018, 65, 300–308. [Google Scholar] [CrossRef]
- Anderson, W.W.; Yakimenko, O.A. Using neural networks to model and forecast solar PV power generation at Isle of Eigg. In Proceedings of the 2018 IEEE 12th International Conference on Compatibility, Power Electronics and Power Engineering (CPE-POWERENG 2018), Doha, Qatar, 10–12 April 2018; pp. 1–8. [Google Scholar]
- Yao, S.; Pan, L.; Yu, Z.; Kang, Q.; Zhou, M. Hierarchically Non-continuous Regression Prediction for Short-Term Photovoltaic Power Output. In Proceedings of the 2019 IEEE 16th International Conference on Networking, Sensing and Control (ICNSC), Banff, AB, Canada, 9–11 May 2019; pp. 379–384. [Google Scholar]
- Monfared, M.; Fazeli, M.; Lewis, R.; Searle, J. Fuzzy Predictor with Additive Learning for Very Short-Term PV Power Generation. IEEE Access 2019, 7, 91183–91192. [Google Scholar] [CrossRef]
- Su, C.; Hu, Z. Reliability assessment for Chinese domestic wind turbines based on data mining techniques. Wind Energy 2018, 21, 198–209. [Google Scholar] [CrossRef]
- Aikhuele, D.O. Intuitionistic fuzzy model for reliability management in wind turbine system. Appl. Comput. Inform. 2018. [Google Scholar] [CrossRef]
- Uma, J.; Muniraj, C.; Sathya, N. Diagnosis of Photovoltaic (PV) Panel Defects Based on Testing and Evaluation of Thermal Image. J. Test. Eval. 2019, 47, 4249–4262. [Google Scholar] [CrossRef]
- Harrou, F.; Dairi, A.; Taghezouit, B.; Sun, Y. An unsupervised monitoring procedure for detecting anomalies in photovoltaic systems using a one-class Support Vector Machine. Sol. Energy 2019, 179, 48–58. [Google Scholar] [CrossRef]
- Du, S.; Li, M.; Han, S.; Shi, J.; Li, H. Multi-Pattern Data Mining and Recognition of Primary Electric Appliances from Single Non-Intrusive Load Monitoring Data. Energies 2019, 12, 992. [Google Scholar] [CrossRef]
- Parvizimosaed, M.; Farmani, F.; Rahimi-Kian, A.; Monsef, H. A multi-objective optimization for energy management in a renewable micro-grid system: A data mining approach. J. Renew. Sustain. Energy 2014, 6. [Google Scholar] [CrossRef]
- Ai, S.; Chakravorty, A.; Rong, C. Household Power Demand Prediction Using Evolutionary Ensemble Neural Network Pool with Multiple Network Structures. Sensors 2019, 19, 721. [Google Scholar] [CrossRef] [PubMed]
- Singh, S.; Yassine, A. Mining Energy Consumption Behavior Patterns for Households in Smart Grid. IEEE Trans. Emerg. Top. Comput. 2019, 7, 404–419. [Google Scholar] [CrossRef]
- El Mrabet, Z.; El Ghazi, H.; Kaabouch, N. A Performance Comparison of Data Mining Algorithms Based Intrusion Detection System for Smart Grid. In Proceedings of the 2019 IEEE International Conference on Electro Information Technology (EIT), Brookings, SD, USA, 20–22 May 2019; pp. 298–303. [Google Scholar]
- Gupta, S.; Sabitha, A.S.; Punhani, R. Cyber Security Threat Intelligence using Data Mining Techniques and Artificial Intelligence. Int. J. Recent Technol. Eng. 2019, 8, 6133–6140. [Google Scholar]
- Zuo, X.; Chen, Z.; Dong, L.; Chang, J.; Hou, B. Power information network intrusion detection based on data mining algorithm. J. Supercomput. 2019. [Google Scholar] [CrossRef]
- Ahmad, T.; Chen, H.; Wang, J.; Guo, Y. Review of various modeling techniques for the detection of electricity theft in smart grid environment. Renew. Sustain. Energy Rev. 2018, 82, 2916–2933. [Google Scholar] [CrossRef]
- Razavi, R.; Gharipour, A.; Fleury, M.; Akpan, I.J. A practical feature-engineering framework for electricity theft detection in smart grids. Appl. Energy 2019, 238, 481–494. [Google Scholar] [CrossRef]
- Maamar, A.; Benahmed, K. Machine learning Techniques for Energy Theft Detection in AMI. In Proceedings of the 2018 International Conference on Software Engineering and Information Management—ICSIM2018, Casablanca, Morocco, 4–6 January 2018; ACM Press: New York, NY, USA, 2018; pp. 57–62. [Google Scholar]
- Jindal, A.; Dua, A.; Kaur, K.; Singh, M.; Kumar, N.; Mishra, S. Decision Tree and SVM-Based Data Analytics for Theft Detection in Smart Grid. IEEE Trans. Ind. Inform. 2016, 12, 1005–1016. [Google Scholar] [CrossRef]
- Han, J.; Kamber, M. Data Mining: Concepts and Techniques; Elsevier: Amsterdam, The Netherlands, 2011; Volume 12, ISBN 978-3-642-19720-8. [Google Scholar]
- Larose, D. Discovering Knowledge in Data. An Introduction to Data Mining; John Wiley & Sons: Hoboken, NJ, USA, 2005; pp. 1–35. ISBN 9786468600. [Google Scholar]
- Kantardzic, M. Data Mining: Concepts, Models, Methods, and Algorithms, 2nd ed.; John Wiley & Sons: Hoboken, NJ, USA, 2011; ISBN 9780470890455. [Google Scholar]
- CIGRE. Broshure 292: Data Mining Techniques and Applications in the Power Transmission Field; CIGRE: Paris, France, 2006. [Google Scholar]
- Olson, D.L.; Delen, D. Advanced Data Mining Techniques; Springer: Berlin/Heidelberg, Germany, 2008; ISBN 978-3-540-76916-3. [Google Scholar]
- Wierzchoń, S.; Kłopotek, M. Algorithms of Cluster Analysis; Institute of Computer Science Polish Academy of Sciences: Warszaw, Poland, 2015; Volume 3, ISBN 9789638759627. [Google Scholar]
- Witten, I.H.; Frank, E. Data Mining: Practical Machine Learning Tools and Techniques; Morgan Kaufmann Publishers: San Francisco, CA, USA, 2011; ISBN 0080890369. [Google Scholar]
- Wu, X.; Kumar, V.; Ross, Q.J.; Ghosh, J.; Yang, Q.; Motoda, H.; McLachlan, G.J.; Ng, A.; Liu, B.; Yu, P.S.; et al. Top 10 algorithms in data mining. Knowl. Inf. Syst. 2008, 14, 1–37. [Google Scholar] [CrossRef]
- Sneath, P.H.; Sokal, R.R. Numerical Texonomy; Freeman: Lanzhou, China, 1973; ISBN 9780716706977. [Google Scholar]
- Jasiński, M.; Borkowski, K.; Sikorski, T.; Kostyla, P. Cluster Analysis for Long-Term Power Quality Data in Mining Electrical Power Network. In Proceedings of the 2018 IEEE Progress in Applied Electrical Engineering (PAEE), Koscielisko, Poland, 18–22 June 2018; pp. 1–5. [Google Scholar]
- Statsoft Polska StatSoft Electronic Statistic Textbook. Available online: http.:/www.statsoft.pl/textbook/stathome.html (accessed on 15 February 2020).
- Aggarwal, C.C. Data Mining; Springer: Cham, Switzerland, 2015; ISBN 978-3-319-14141-1. [Google Scholar]
- International Electrotechnical Commission, IEC 61000 4-30 Electromagnetic Compatibility (EMC)—Part 4-30: Testing and Measurement Techniques—Power Quality Measurement Methods; International Electrotechnical Commission: Geneva, Switzerland, 2015.
- British Standards Institution, EN 50160: Voltage Characteristics of Electricity Supplied by Public Distribution Network; British Standards Institution: UK, 2010.
- Jasiński, M.; Sikorski, T.; Kostyła, P.; Kaczorowska, D.; Leonowicz, Z.; Rezmer, J.; Szymańda, J.; Janik, P.; Bejmert, D.; Rybiański, M.; et al. Influence of Measurement Aggregation Algorithms on Power Quality Assessment and Correlation Analysis in Electrical Power Network with PV Power Plant. Energies 2019, 12, 3547. [Google Scholar] [CrossRef]
- Jasiński, M.; Rezmer, J.; Sikorski, T.; Szymańda, J. Integration Monitoring of On-grid Photovoltaic System: Case Study. Period. Polytech. Electr. Eng. Comput. Sci. 2019, 63, 99–105. [Google Scholar] [CrossRef]
- Breiman, L.; Friedman, J.; Stone, C.J.; Olshen, R.A. Classification and Regression Trees; CRC Press: Boca Raton, FL, USA, 1984. [Google Scholar]


| Condition | Final Number of Cluster | ||||
|---|---|---|---|---|---|
| 2 | 3 | 4 | 5 | 6 | |
| DG working | x | x | x | x | x |
| reconfiguration | x | x | |||
| maintenance breaks | x | x | x | x | x |
| other unknown condition | x | x | x | ||
| Measurement Point | Parameter | Value | c1 | c2 | c3 | c4 | c5 | c6 |
|---|---|---|---|---|---|---|---|---|
| T2 | Pst L1-L2 | minimal | 0.16 | 0.13 | 0.12 | 0.14 | 0.09 | 0.08 |
| maximal | 0.50 | 0.30 | 0.54 | 1.42 | 0.74 | 0.57 | ||
| mean | 0.22 | 0.21 | 0.18 | 0.24 | 0.26 | 0.11 | ||
| standard deviation | 0.03 | 0.03 | 0.04 | 0.05 | 0.07 | 0.05 | ||
| Pst L2-L3 | minimal | 0.16 | 0.12 | 0.12 | 0.14 | 0.09 | 0.08 | |
| maximal | 0.50 | 0.29 | 0.53 | 2.07 | 0.73 | 0.38 | ||
| mean | 0.22 | 0.21 | 0.18 | 0.24 | 0.26 | 0.11 | ||
| standard deviation | 0.03 | 0.03 | 0.04 | 0.08 | 0.08 | 0.05 | ||
| Pst L3-L1 | minimal | 0.17 | 0.13 | 0.13 | 0.14 | 0.10 | 0.08 | |
| maximal | 0.50 | 0.30 | 0.52 | 3.54 | 1.06 | 0.53 | ||
| mean | 0.23 | 0.21 | 0.19 | 0.25 | 0.27 | 0.11 | ||
| standard deviation | 0.03 | 0.03 | 0.04 | 0.11 | 0.08 | 0.05 | ||
| T3 | Pst L1-L2 | minimal | 0.13 | 0.13 | 0.15 | 0.14 | 0.13 | 0.18 |
| maximal | 0.47 | 0.52 | 0.74 | 0.86 | 0.60 | 0.53 | ||
| mean | 0.30 | 0.18 | 0.30 | 0.39 | 0.29 | 0.33 | ||
| standard deviation | 0.03 | 0.05 | 0.05 | 0.06 | 0.08 | 0.06 | ||
| Pst L2-L3 | minimal | 0.14 | 0.14 | 0.16 | 0.15 | 0.14 | 0.19 | |
| maximal | 0.45 | 0.49 | 0.80 | 2.01 | 0.74 | 0.56 | ||
| mean | 0.31 | 0.19 | 0.31 | 0.43 | 0.32 | 0.35 | ||
| standard deviation | 0.03 | 0.05 | 0.05 | 0.09 | 0.09 | 0.07 | ||
| Pst L3-L1 | minimal | 0.13 | 0.13 | 0.16 | 0.15 | 0.14 | 0.20 | |
| maximal | 0.46 | 0.48 | 0.81 | 1.93 | 1.10 | 0.70 | ||
| mean | 0.32 | 0.19 | 0.33 | 0.44 | 0.32 | 0.37 | ||
| standard deviation | 0.04 | 0.06 | 0.05 | 0.08 | 0.09 | 0.07 | ||
| THDu L1-L2 | minimal | 0.48 | 0.39 | 0.87 | 0.47 | 0.41 | 0.57 | |
| maximal | 1.20 | 0.99 | 4.99 | 1.50 | 1.11 | 1.38 | ||
| mean | 0.67 | 0.56 | 1.53 | 0.83 | 0.64 | 0.80 | ||
| standard deviation | 0.07 | 0.08 | 0.27 | 0.08 | 0.12 | 0.09 | ||
| THDu L2-L3 | minimal | 0.49 | 0.39 | 0.89 | 0.48 | 0.45 | 0.62 | |
| maximal | 1.23 | 0.99 | 5.23 | 1.56 | 1.13 | 1.44 | ||
| mean | 0.68 | 0.55 | 1.57 | 0.86 | 0.68 | 0.84 | ||
| standard deviation | 0.07 | 0.08 | 0.29 | 0.08 | 0.12 | 0.09 | ||
| THDu L3-L1 | minimal | 0.49 | 0.38 | 0.91 | 0.49 | 0.41 | 0.58 | |
| maximal | 1.28 | 1.02 | 4.87 | 1.63 | 1.18 | 1.50 | ||
| mean | 0.70 | 0.55 | 1.63 | 0.89 | 0.67 | 0.87 | ||
| standard deviation | 0.08 | 0.08 | 0.29 | 0.09 | 0.14 | 0.10 | ||
| WM | Pst L1-L2 | minimal | 0.14 | 0.14 | 0.16 | 0.15 | 0.14 | 0.19 |
| maximal | 0.47 | 0.54 | 0.78 | 6.84 | 0.64 | 0.56 | ||
| mean | 0.31 | 0.19 | 0.32 | 0.43 | 0.31 | 0.35 | ||
| standard deviation | 0.03 | 0.05 | 0.05 | 0.20 | 0.08 | 0.07 | ||
| Pst L2-L3 | minimal | 0.13 | 0.13 | 0.16 | 0.15 | 0.14 | 0.19 | |
| maximal | 0.45 | 0.49 | 0.79 | 6.89 | 0.72 | 0.57 | ||
| mean | 0.31 | 0.19 | 0.32 | 0.43 | 0.31 | 0.35 | ||
| standard deviation | 0.03 | 0.06 | 0.05 | 0.20 | 0.08 | 0.07 | ||
| Pst L3-L1 | minimal | 0.14 | 0.13 | 0.16 | 0.15 | 0.14 | 0.19 | |
| maximal | 0.46 | 0.46 | 0.78 | 6.84 | 1.12 | 0.66 | ||
| mean | 0.31 | 0.18 | 0.31 | 0.43 | 0.31 | 0.35 | ||
| standard deviation | 0.03 | 0.05 | 0.05 | 0.20 | 0.09 | 0.07 | ||
| THDu L1-L2 | minimal | 0.46 | 0.36 | 0.55 | 0.48 | 0.40 | 0.56 | |
| maximal | 1.23 | 0.99 | 2.40 | 1.54 | 1.16 | 1.42 | ||
| mean | 0.67 | 0.53 | 1.56 | 0.85 | 0.65 | 0.81 | ||
| standard deviation | 0.08 | 0.08 | 0.22 | 0.08 | 0.13 | 0.10 | ||
| THDu L2-L3 | minimal | 0.45 | 0.36 | 0.59 | 0.49 | 0.43 | 0.59 | |
| maximal | 1.23 | 0.96 | 2.40 | 1.55 | 1.13 | 1.44 | ||
| mean | 0.65 | 0.52 | 1.54 | 0.85 | 0.67 | 0.84 | ||
| standard deviation | 0.08 | 0.08 | 0.23 | 0.08 | 0.13 | 0.10 | ||
| THDu L3-L1 | minimal | 0.45 | 0.36 | 0.58 | 0.49 | 0.42 | 0.59 | |
| maximal | 1.22 | 0.94 | 2.37 | 1.53 | 1.12 | 1.42 | ||
| mean | 0.65 | 0.52 | 1.50 | 0.86 | 0.67 | 0.85 | ||
| standard deviation | 0.08 | 0.08 | 0.22 | 0.08 | 0.13 | 0.10 |
| Final Number of Clusters | Do Results Indicate the Same Working Conditions? | Percent of the Data Assigned to the Same Cluster |
|---|---|---|
| 2 | no * | − |
| 3 | yes | 95.7 |
| 4 | yes | 95.1 |
| 5 | yes | 95.0 |
| 6 | yes | 94.9 |
© 2020 by the authors. Licensee MDPI, Basel, Switzerland. This article is an open access article distributed under the terms and conditions of the Creative Commons Attribution (CC BY) license (http://creativecommons.org/licenses/by/4.0/).
Share and Cite
Jasiński, M.; Sikorski, T.; Leonowicz, Z.; Borkowski, K.; Jasińska, E. The Application of Hierarchical Clustering to Power Quality Measurements in an Electrical Power Network with Distributed Generation. Energies 2020, 13, 2407. https://doi.org/10.3390/en13092407
Jasiński M, Sikorski T, Leonowicz Z, Borkowski K, Jasińska E. The Application of Hierarchical Clustering to Power Quality Measurements in an Electrical Power Network with Distributed Generation. Energies. 2020; 13(9):2407. https://doi.org/10.3390/en13092407
Chicago/Turabian StyleJasiński, Michał, Tomasz Sikorski, Zbigniew Leonowicz, Klaudiusz Borkowski, and Elżbieta Jasińska. 2020. "The Application of Hierarchical Clustering to Power Quality Measurements in an Electrical Power Network with Distributed Generation" Energies 13, no. 9: 2407. https://doi.org/10.3390/en13092407
APA StyleJasiński, M., Sikorski, T., Leonowicz, Z., Borkowski, K., & Jasińska, E. (2020). The Application of Hierarchical Clustering to Power Quality Measurements in an Electrical Power Network with Distributed Generation. Energies, 13(9), 2407. https://doi.org/10.3390/en13092407