Effect of Existing Façade’s Construction and Orientation on the Performance of Low-E-Based Retrofit Double Glazing in Tropical Climate


Abstract
1. Introduction
2. Façade Types and Characteristics
3. Novelty and Knowledge Gap Addressed
4. Methodology
4.1. Description of Test-Bedding
4.2. Description of Simulation Model
5. Data Collection and Assessment
6. Results and Discussion
7. Conclusions
Author Contributions
Funding
Acknowledgments
Conflicts of Interest
References
- Energy Market Authority. Singapore Energy Statistics (SES) Report; Energy Market Authority: Singapore, 2018.
- Building and Construction Authority. BCA Building Energy Benchmarking Report; Energy Market Authority: Singapore, 2014.
- Thangavelu, S.R.; Myat, A.; Khambadkone, A. Energy Optimization Methodology of Multi-Chiller Plant in Commercial Buildings. Energy 2017, 123, 64–76. [Google Scholar] [CrossRef]
- Quesada, G.; Rousse, D.; Dutil, Y.; Badache, M.; Hallé, S. A Comprehensive Review of Solar Facades. Opaque Solar Facades A Comprehensive Review of Solar Facades. Opaque Solar Facades. Renew. Sustain. Energy Rev. 2012, 16, 2820–2832. [Google Scholar] [CrossRef]
- Quesada, G.; Rousse, D.; Dutil, Y.; Badache, M.; Hallé, S. A Comprehensive Review of Solar Facades. Transparent and Translucent Solar Facades. Renew. Sustain. Energy Rev. 2012, 16, 2643–2651. [Google Scholar] [CrossRef]
- Hien, W.N.; Liping, W.; Chandra, A.N.; Pandey, A.R.; Xiaolin, W. Effects of Double Glazed Facade on Energy Consumption, Thermal Comfort and Condensation for a Typical Office Building in Singapore. Energy Build. 2005, 37, 563–572. [Google Scholar] [CrossRef]
- Pérez-Grande, I.; Meseguer, J.; Alonso, G. Influence of Glass Properties on the Performance of Double-Glazed Facades. Appl. Therm. Eng. 2005, 25, 3163–3175. [Google Scholar] [CrossRef]
- Planas, C.; Clemente, R.; Escalona, V.; Torres, M.; Alavedra, P.; Guzmán, A.; Cuerva, E. Headquarters of the Comisión Nacional Del Mercado de Valores. Double Façade Simulation Study. In Proceedings of the IBPSA 2007-International Building Performance Simulation Association, Bejing, China, 3–6 September 2007; pp. 156–160. [Google Scholar]
- Valentín, D.; Guardo, A.; Egusquiza, E.; Valero, C.; Alavedra, P. Assessment of the Economic and Environmental Impact of Double Glazed Façade Ventilation Systems in Mediterranean Climates. Energies 2013, 6, 5069–5087. [Google Scholar] [CrossRef]
- Fan, Y.; Xia, X. Energy-Efficiency Building Retrofit Planning for Green Building Compliance. Build. Environ. 2018, 136, 312–321. [Google Scholar] [CrossRef]
- Luddeni, G.; Krarti, M.; Pernigotto, G.; Gasparella, A. An Analysis Methodology for Large-Scale Deep Energy Retrofits of Existing Building Stocks: Case Study of the Italian Office Building. Sustain. Cities Soc. 2018, 41, 296–311. [Google Scholar] [CrossRef]
- Synnefa, A.; Vasilakopoulou, K.; De Masi, R.F.; Kyriakodis, G.E.; Londorfos, V.; Mastrapostoli, E.; Karlessi, T.; Santamouris, M. Transformation through Renovation: An Energy Efficient Retrofit of an Apartment Building in Athens. Procedia Eng. 2017, 180, 1003–1014. [Google Scholar] [CrossRef]
- Michaelidou, M.; Dimitriou, S.; Christofi, M.; Katafygiotou, M.; Serghides, D.K. Energy Refurbishment Towards Nearly Zero Energy Multi-Family Houses, for Cyprus. Procedia Environ. Sci. 2017, 38, 11–19. [Google Scholar] [CrossRef]
- van den Brom, P.; Meijer, A.; Visscher, H. Actual Energy Saving Effects of Thermal Renovations in Dwellings—Longitudinal Data Analysis Including Building and Occupant Characteristics. Energy Build. 2019, 182, 251–263. [Google Scholar] [CrossRef]
- Rakhshan, K.; Friess, W.A. Effectiveness and Viability of Residential Building Energy Retrofits in Dubai. J. Build. Eng. 2017, 13, 116–126. [Google Scholar] [CrossRef]
- Edeisy, M.; Cecere, C. Envelope Retrofit in Hot Arid Climates. Procedia Environ. Sci. 2017, 38, 264–273. [Google Scholar] [CrossRef]
- Smith, N.; Isaacs, N.; Burgess, J.; Cox-Smith, I. Thermal Performance of Secondary Glazing as a Retrofit Alternative for Single-Glazed Windows. Energy Build. 2012, 54, 47–51. [Google Scholar] [CrossRef]
- Somasundaram, S.; Chong, A.; Wei, Z.; Thangavelu, S.R. Energy Saving Potential of Low E-Coating Based Retrofit Double Glazing for Tropical Climate. Energy Build. 2019. [Google Scholar] [CrossRef]
- Somasundaram, S.; Raj Thangavelu, S.; Chong, A. Improving building efficiency using low-e coating based retrofit double glazing with solar films. Appl. Therm. Eng. 2020. [Google Scholar] [CrossRef]
- Singapore Standard Council, S. Code of Practice for Air-Conditioning and Mechanical Ventilation in Buildings; Singapore Standard Council, S: Singapore, 2016; Volume 2017, p. 62. [Google Scholar]
- Singapore Standard. SS 531: Code of Practice for Lighting of Work Places-Part 1: Indoor; Singapore Standard: Singapore, 2006.


| Properties | Values |
|---|---|
| Total transmission | 9% |
| Solar energy | |
| Reflection | 20% |
| Absorption | 71% |
| Visible light | |
| Transmission | 15% |
| Reflection | 11% |
| Infra-red rejection | 75% |
| Shading coefficient | 0.25 |
| Heat transmission (W/m2K) | 5.7 |
| Glass Properties | Clear Glass 10 mm at SE and SW Façade | Clear Glass 15 mm at NW Façade | Sunergy Grey (8 mm with Low-E Hard Coat at Position 2) | |
|---|---|---|---|---|
| Visible light (%) | Transmittance | 87 | 84 | 26 |
| Internal Reflection | - | - | 4.9 | |
| External Reflection | 8 | 8 | 8.3 | |
| Solar energy (%) | Transmittance | 72 | 58 | 23.2 |
| Reflectance | 7 | 7 | 5.7 (int), 9.4 (ext) | |
| U value W/m2 K | 4.96 | 4.88 | 4.1 | |
| Shading coefficient | 0.89 | 0.85 | 0.41 |
| Sensor Type | Measured Variables | Accuracy |
|---|---|---|
| Outdoor Environmental Conditions | ||
| Pyranometer | Global (Total) solar irradiance Diffuse solar irradiance | ±5% ± 10 W/m2 (hourly) ±8% ± 10 W/m2 (individual) |
| Outdoor Temperature/ Humidity sensor | Dry bulb temperature Relative humidity | ±0.25 °C ±1.5% |
| Rain detector | Rain detector (rain=1/no rain=0) | |
| Outdoor illuminance sensor | Outdoor illuminance | ±3% |
| Room Conditions | ||
| Indoor Temperature/ Humidity sensor | Room temperature Room humidity | ±0.2 °C ±1.7% |
| Globe temperature sensor (Pt-100 sensor) | Mean radiant temperature | ±0.1 °C |
| lux sensor | Room lux | 1.5% ± 2 lux |
| CO2 sensor | Room CO2 levels | ±20 ppm ± 1% |
| Pyranometer tilted by 90° | Indoor normal solar irradiance near façade | 1.5% |
| Heat flux sensors | Measure the total heat flux through the façade | ±3% |
| T-type Thermocouple | Façade surface temperatures at existing and new panel | 0.75% |
| Bare junction T type thermocouple | Temperature in the air gap between the panels | 0.75% |
| Air-conditioning operation details | ||
| Digital power meters | Instantaneous and cumulative power consumption of VRF outdoor unit | 0.2% |
| VRF air-conditioning system (In-built sensors) | System status, Air flow speed, direction of return air temperature and temperature setpoint | - |
| Aim | Configuration Reference No | Configuration Tested | Testing Date (Start–End) |
|---|---|---|---|
| To study effect of double glazing in SE façade (no solar film no sunshade) | DG | Double glazing in SE + block NW and SW using temporary wall | 4-April to 11-April, 2018 |
| Baseline | Existing glass (single glazing) in SE + block NW and SW using temporary wall | 13-April to 26-April, 2018 | |
| To study effect of double glazing in SW façade (has sunshade but no solar film) | Baseline | Existing glass (single glazing) in SW + block SE and NW using temporary wall | 27-April to 9-May, 2018 |
| DG | Double glazing in SW + block SE and NW using temporary wall | 10-May to 31-May, 2018 | |
| To study effect of double glazing in NW direction for a glass with solar film and sunshade | DG | Double glazing in NW (with solar film on base glass) + block SE and SW using temporary wall | 2-June to 12-June, 2018 |
| Baseline | Existing glass (single glazing with solar film) in NW + block SE and SW using temporary wall | 13-June to 27-June, 2018 |
| Configuration | SE Façade 9 a.m.–12 p.m. | SW Façade 12 p.m.–3 p.m. | NW Façade 3 p.m.–6 p.m. | |||
|---|---|---|---|---|---|---|
| Time Period (Dominant) | Baseline | DG * | Baseline | DG * | Baseline | DG * |
| Room illuminance (lux) | 1454 | 486 | 867 | 112 | 189 | 82 |
| Indoor Normal Irradiance (W/m2) | 125 | 29 | 40 | 10 | 12 | 8 |
| Façade heat flux into room (W/m2) | 60 | 130 | 49 | 58 | 120 | 60 |
| Room panel Temperature (°C) | 26.7 | 37.7 | 30 | 32.5 | 32 | 35.8 |
| Mean Radiant Temperature (°C) | 31.7 | 30.8 | 31.5 | 30.7 | 31 | 31.2 |
| Outdoor Illuminance (klux) | 53.6 | 54 | 66 | 45 | 22 | 39 |
| Ambient Temperature (°C) | 30.4 | 30.4 | 31.1 | 29.5 | 28.8 | 31.3 |
| Global Solar Irradiance (W/m2) | 517 | 527 | 603 | 428 | 205 | 386 |
| Configuration Type/Name | Performance | Average Air-Con Power | |||
|---|---|---|---|---|---|
| 9 a.m. to 12 p.m. | 12 p.m. to 3 p.m. | 3 p.m. to 6 p.m. | Whole Day | ||
| SE façade (no shade + clear SE façade) | Baseline | 1.00 kW | N.A* | N.A * | N.A * |
| DG | 1.05 kW | - | - | - | |
| Savings | –5% | N.A * | N.A * | N.A * | |
| SW façade (shade + clear SW façade) | Baseline | 1.14 kW | 1.29 kW | 1.49 kW | 11.76 kWh |
| DG | 1.07 kW | 1.23 kW | 1.27 kW | 10.69 kWh | |
| Savings | 6%–7% | 4%–5% | 15% | 9%–10% | |
| NW façade (shade + solar film in NW façade) | Baseline | 0.91 kW | 1.09 kW | 1.05 kW | 9.15 kWh |
| DG | 0.9 kW | 1.02 kW | 0.96 kW | 8.66 kWh | |
| Savings | 1% | 6% | 8%–9% | 5%–6% | |
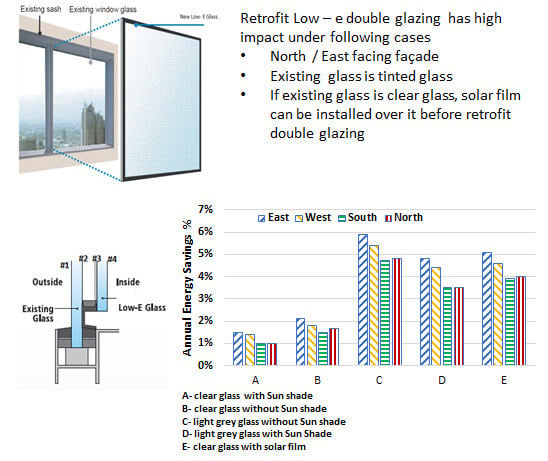
| Orientation of Façade | Performance | Annual Air-Con Energy Consumption (kWh) | ||||
|---|---|---|---|---|---|---|
| Clear Glass + Shade | Clear Glass + No Shade | Light Grey Glass + No Shade | Light Grey Glass + Shade | Clear Glass+Solar Film | ||
| East | Baseline | 4901 | 5214 | 4933 | 4686 | 4441 |
| DG | 4826 | 5104 | 4644 | 4461 | 4215 | |
| Savings | 1.5% | 2.1% | 5.9% | 4.8% | 5.1% | |
| West | Baseline | 4854 | 5139 | 4869 | 4647 | 4408 |
| DG | 4787 | 5046 | 4606 | 4441 | 4205 | |
| Savings | 1.4% | 1.8% | 5.4% | 4.4% | 4.6% | |
| South | Baseline | 4563 | 4838 | 4622 | 4403 | 4247 |
| DG | 4518 | 4766 | 4407 | 4248 | 4080 | |
| Savings | 0.98% | 1.5% | 4.7% | 3.5% | 3.9% | |
| North | Baseline | 4554 | 4857 | 4636 | 4397 | 4253 |
| DG | 4510 | 4777 | 4414 | 4242 | 4083 | |
| Savings | 0.98% | 1.65% | 4.8% | 3.5% | 4% | |
© 2020 by the authors. Licensee MDPI, Basel, Switzerland. This article is an open access article distributed under the terms and conditions of the Creative Commons Attribution (CC BY) license (http://creativecommons.org/licenses/by/4.0/).
Share and Cite
Somasundaram, S.; Thangavelu, S.R.; Chong, A. Effect of Existing Façade’s Construction and Orientation on the Performance of Low-E-Based Retrofit Double Glazing in Tropical Climate. Energies 2020, 13, 2016. https://doi.org/10.3390/en13082016
Somasundaram S, Thangavelu SR, Chong A. Effect of Existing Façade’s Construction and Orientation on the Performance of Low-E-Based Retrofit Double Glazing in Tropical Climate. Energies. 2020; 13(8):2016. https://doi.org/10.3390/en13082016
Chicago/Turabian StyleSomasundaram, Sivanand, Sundar Raj Thangavelu, and Alex Chong. 2020. "Effect of Existing Façade’s Construction and Orientation on the Performance of Low-E-Based Retrofit Double Glazing in Tropical Climate" Energies 13, no. 8: 2016. https://doi.org/10.3390/en13082016
APA StyleSomasundaram, S., Thangavelu, S. R., & Chong, A. (2020). Effect of Existing Façade’s Construction and Orientation on the Performance of Low-E-Based Retrofit Double Glazing in Tropical Climate. Energies, 13(8), 2016. https://doi.org/10.3390/en13082016