Article

Phosphoric Acid-Doped Ion-Pair Coordinated PEMs with Broad Relative Humidity Tolerance

1
Department of Chemistry and Chemical Biology, Rensselaer Polytechnic Institute, Troy, NY 12180, USA
2
Xergy Inc., 299 Cluckey Dr Suite A, Harrington, DE 19952, USA
3
Department of Chemical and Biological Engineering, Rensselaer Polytechnic Institute, Troy, NY 12180, USA
*
Author to whom correspondence should be addressed.
Energies 2020, 13(8), 1924; https://doi.org/10.3390/en13081924
Submission received: 9 March 2020 / Revised: 3 April 2020 / Accepted: 7 April 2020 / Published: 14 April 2020
(This article belongs to the Special Issue Polymer Electrolyte Membrane Fuel Cells and Electrolyzers)

Abstract

:
Proton exchange membrane (PEM) capable of working over a broad operating condition window is critical for successful adoption of PEM-based electrochemical devices. In this work, phosphoric acid (PA)-doped biphenyl-backbone ion-pair coordinated PEMs were prepared by quaternization of BPBr-100, a precursor polymer, with three different tertiary amines including trimethylamine, 1-methylpiperidine, and 1,2-dimethylimidazole followed by membrane casting, ion exchange reaction to hydroxide ion, and doping with PA. The resulting PA-doped ion-pair PEMs were characterized in terms of PA doping level, proton conductivity, relative humidity (RH) tolerance, thermal stability, and mechanical properties. PA doping levels were between six and eight according to acid-base titration. The size and structure of the cation group of ion-pair polymers were found to affect the PA doping level and water uptake. Proton conductivity was studied as a function of RH over a wide range of 5% to 95% RH. Stable conductivity at 80 °C was observed up to 70% RH for 10 h. Mechanical property characterization indicates that the PA doping process resulted in more ductile membranes with significantly increased elongation at break due to the plasticization effect of PA. A combination of high proton conductivity at low RH conditions, and good humidity tolerance makes this new class of PEMs great potential candidates for use in electrochemical devices such as proton exchange membrane fuel cells and electrochemical hydrogen compressors.

Graphical Abstract

1. Introduction

Due to the growing concerns over our society’s heavy energy dependence on fossil fuels, ever-increasing energy demand and CO2 emissions, and accelerated global warming, the identification and development of clean energy technologies have gained significant attention recently [1,2,3,4,5,6,7,8,9,10,11,12]. Among alternative energy solutions, hydrogen (H2) has been recognized as an attractive clean fuel because of its high gravimetric energy density (33.3 kW·h/kg) and zero CO2 emission capability [13]. Although hydrogen is currently produced mostly from fossil fuel sources, water electrolysis using electricity generated from renewable energy sources is the most desirable approach of hydrogen production. For example, when renewable energy generation from intermittent solar or wind power is greater than energy consumption, the excess of electricity can be used for hydrogen production via water electrolysis and stored as the chemical bond of hydrogen molecules. When electricity demand is greater than renewable energy generation, the stored hydrogen can be used to produce electricity (i.e., electrification) using fuel cells, such as the proton exchange membrane fuel cells (PEMFCs). Due to its low density (0.08988 g/L at STP), once hydrogen is produced from water electrolysis, it needs to be pressurized for storage in high-pressure tanks. Among compression technologies of hydrogen, electrochemical hydrogen compression (EHC) is considered to be better choice than traditional mechanical compression because of its high efficiency, ultrapure hydrogen generation (e.g., no contamination), low maintenance, quiet operation, and flexible scalability [14,15,16,17,18].
All aforementioned electrochemical devices (water electrolysis, PEMFCs, EHC) currently use a proton exchange membrane (PEM) as a crucial component. The PEM permits proton transport between two electrodes while preventing diffusion of hydrogen. For use in PEMFC and EHC, commercial PEMs such as Nafion® operate only at high relative humidity (RH) with temperatures below 100 °C, requiring humidified hydrogen feed. This is because the perfluorosulfonic acid group needs to be solvated by water to provide high proton conductivity. Therefore, the development of highly conductive PEM materials that do not need external humidification is highly desirable as they can significantly simplify the water management of such electrochemical devices. Phosphoric acid-doped polybenzimidazole (PA-PBI) membranes have been reported to offer good proton conductivity without external humidification at high temperatures (in the range of 140–180 °C) [19,20,21]. However, PA-PBI PEMs maintain good proton conductivity only under anhydrous conditions (less than 10% RH). If moisture is present to the above level, severe performance degradation can take place as a consequence of the leaching of the doped phosphoric acid (PA) from the membrane. In other words, PA-PBI PEMs have very narrow RH tolerance. PA-PBI composite membranes containing inorganic fillers, such as SiO2, ZrO2, TiO2, and zirconium hydrogen phosphate, have been reported to display better RH tolerance [22,23]. However, the formation of non-uniform membrane structures and additive aggregation have remained as challenges.
To fill the operational gap between Nafion® (low temperature and high RH: below 100 °C and above 80% RH) and PA-PBI (high temperature and anhydrous: at 140–180 °C and less than 10% RH), a PA-doped polyphenylene-based ion-pair coordinated PEM, QAPOH, has been reported to show stable proton conductivity up to 40% RH at 80 °C [24]. The enhanced RH tolerance of QAPOH was attributed to the strong ion-pair interaction between positively charged quaternary ammonium (QA) cations and negatively charged dihydrogen phosphate anions. The electrostatic force of QA-phosphate ion-pair interaction was calculated to be eight times stronger than the acid-base interaction between PA and PBI. This strong interaction impeded leaching of doped PA from the membrane at high RH. So far, the ion-pair concept has not been applied to other PEM materials with different polymer backbones and cation structures. Herein, PA-doped ion-pair coordinated biphenyl backbone PEMs and their membrane properties are reported. Three different QA groups, trimethylalkylammonium (TMA), 1-methylpiperidium (Pip), and 1,2-dimethylimidazolium (DMIm), were incorporated to the sidechain of biphenyl precursor polymer (BPBr-100, Figure 1) to study the effect of ion-pair structures on membrane properties. Proton conductivity was measured at 80 °C with four ramps of 5% to 95% RH to evaluate the RH tolerance of PEMs. These newly developed ion-pair PEMs outperformed Nafion® in terms of proton conductivity especially at low RH and demonstrated good humidity tolerance up to 70% RH at 80 °C. Mechanical property characterization of these membranes indicated that they became quite ductile after doping with PA. This new class of low RH PEMs exhibits the great potential for use in PEMFCs and EHC by allowing flexible operating conditions.

2. Materials and Methods

2.1. Materials

Biphenyl, trifluoromethanesulfonic (triflic) acid, trimethylamine (33 wt.% ethanol solution), phosphoric acid (85 wt.%, aq), anhydrous dichloromethane (DCM), N,N-dimethylacetamide (DMAc), dimethyl sulfoxide (DMSO), tetrahydrofuran (THF), hexane, and methanol were purchased from Acros Organics (Scranton, PA, USA). Phenolphthalein (1% w/v in alcohol), 1-methylpiperidine, and 1,2-dimethylimidazole were purchased from Alfa Aesar (Haverhill, MA, USA). Sodium hydroxide (NaOH) was purchased from MilliporeSigma (Burlington, MA, USA). Chloroform-d (CDCl3) and dimethyl sulfoxide-d6 (DMSO-d6) were purchased from Cambridge Isotope Laboratories (Tewksbury, MA, USA). All reagents and solvents were used as received without further purification.

2.2. Instrumentation

1H nuclear magnetic resonance (NMR) spectra were obtained using a Varian Unity 500 MHz spectrometer, and chemical shifts were referenced to the residual solvent peaks of CDCl3 (7.26 ppm) or DMSO-d6 (2.50 ppm). The average molecular weight and dispersity of the precursor polymer BPBr-100 were determined by gel permeation chromatography (GPC) with a Viscotek GPC max model and TDA302 detector using THF (0.8 mL/min) as an eluent and polystyrene standards. Mechanical properties were studied by tensile test using TA Instruments Q800 dynamic mechanical analysis (DMA) with controlled force as 0.5 N/min. The specimen size was 2 × 0.5 cm. Thermogravimetric analysis (TGA) was carried out using TA Instruments TGA Q50 under nitrogen atmosphere from 25 to 1000 °C with an increasing rate of 10 °C per minute.

2.3. Preparation of BPBr-100

To a 1-L round-bottom flask equipped with a mechanical stirrer, biphenyl (42.26 g, 0.27 mol), 7-bromo-1,1,1-trifluoroheptan-2-one (74.47 g, 0.3 mol), and DCM (240 mL) were added under nitrogen atmosphere. The flask was placed in an ice-water bath and triflic acid (329 g, 2.19 mol) was added to the flask dropwise. After completion of the acid addition and removal of the ice-water bath, the reaction mixture was stirred at room temperature under nitrogen for 13 h until it became highly viscous indicating formation of a high molecular weight polymer. The reaction mixture was diluted with DCM (240 mL) and kept stirring for an additional 2 h. The polymer was precipitated by slowly adding the reaction mixture to methanol (2 L). After washing with methanol overnight, the precipitated polymer was filtered, air-dried, and dissolved in THF (500 mL). The solution was added to methanol (2 L) dropwise to reprecipitate polymer. After filtration and air-dry for 24 h, biphenyl alkyl bromide-bearing precursor polymer, BPBr-100, was obtained as an off-white fiber-like solid.

2.4. Preparation of BPN1-QA(Br)

Three examples of biphenyl-based QA-bearing ionic polymers, BPN1-QA(Br), with different QA structures (TMA, Pip, DMIm) were synthesized using a similar method. The following is a representative synthetic procedure for BPN1-TMA(Br). To a 250-mL round-bottom flask equipped with a magnetic stirring bar, BPBr-100 (10 g, 0.026 mol repeating unit) was dissolved in DMAc (100 mL). After the precursor polymer was completely dissolved, trimethylamine in 33 wt.% ethanol solution (14.0 g, 0.078 mol) was added to the flask. The reaction mixture was stirred at room temperature for 24 h and slowly added to THF (700 mL) to precipitate QA polymer. The collected polymer was washed with acetone for 4 h, filtered, and rinsed with hexane. After air-dry for 24 h, BPN1-TMA(Br) was obtained as a pale yellowish powder.
BPN1-Pip(Br) and BPN1-DMIm(Br) were synthesized by treating BPBr-100 with 1-methylpiperidine and 1,2-dimethylimidazole, respectively, following the same procedure above, except 50 °C was used for the reaction temperature.

2.5. Membrane Preparation

Self-supporting polymer membranes were prepared by casting DMSO (ca. 5 wt.%) solution of BPN1-QA(Br) onto a glass plate. The plate was slowly dried in an oven with slightly positive air flow. The oven temperature was gradually increased to 80 °C over a period of 12 h and kept at 80 °C for 36 h. The polymer membranes were peeled off by immersing the glass plate into a water bath. A typical membrane size was 10 × 10 cm (l × w) with approximately 50 μm thickness.

2.6. PA Doping

The following procedure was performed inside an argon-filled glovebox to avoid CO2 contamination. As shown in Figure 1, BPN1-QA(Br) membranes were immersed in 1M NaOH (aq) for 24 h to ion-exchange Br to OH form. The resulting BPN1-QA(OH) membranes were washed with argon-bubbled distilled water several times to remove any residual NaOH on the surface. Then, they were immersed in PA solution (85 wt.%) for 12 h for PA doping. After carefully removing the membranes from the PA bath, excessive PA on the membrane surface was removed by gently blotting using Kimwipe. The resulting PA-doped membranes (PA-BPN1-QA) were left alone for 72 h to let additional free PA molecules leach out, during which the membranes were gently blotted by Kimwipe every 12 h. Finally, PA-BPN1-QA membranes were sandwiched between weighing papers and stored in a sealed Ziploc bag.

2.7. PA Doping Level and Water Content of PA-BPN1-QA

PA doping level is defined as an average number of PA molecules per QA cation group. It was obtained by acid-base titration using phenolphthalein (1% w/v in alcohol) as an indicator. PA-BPN1-QA membrane was cut into ca. 3 × 3 cm and weighed. Then it was immersed in distilled water (ca. 60 mL) in a beaker and kept stirring for 10 min. A few drops of phenolphthalein indicator were added, and the released acid amount was titrated with 0.1M NaOH solution. Afterwards, the membrane was thoroughly washed with distilled water and dried under reduced pressure at 70 °C for 12 h. Dry mass was recorded immediately. The PA doping level was calculated using the equation below:
PA   doping   level = C N a O H × V N a O H 2 × W M r e p t
where CNaOH (mol/L) is the molar concentration of titrant NaOH solution which is 0.1 mol/L in this case; VNaOH (L) is the volume of titrant NaOH solution added to reach the endpoint of titration; W (g) is the mass of dry membrane after titration; Mrept (g/mol) is the molecular weight of one repeating unit of the corresponding BPN1-QA(Br) polymers.
As PA-doping was conducted with 85 wt.% PA aqueous solution, the PA-BPN1-QA membranes unavoidably contain a small amount of water. Water content, the percentage of water amount imbibed in PA-doped membrane, was calculated using the equation below:
Water   content   ( wt .   % ) = W 0 W 0.5 × 98 × C N a O H × V N a O H   W 0   ×   100 %
where W0 (g) is the mass of the corresponding PA-BPN1-QA membrane before titration; W (g) is the mass of dry membrane after titration; CNaOH (mol/L) is the molar concentration of titrant NaOH solution which is 0.1 mol/L in this case; VNaOH (L) is the volume of titrant NaOH solution added to reach the endpoint of titration; 98 (g/mol) is the molecular weight of phosphoric acid.

2.8. Water Uptake (WU) and Hydration Number (λ)

BPN1-QA(Br) membranes were dried under reduced pressure at 70 °C for 24 h. Dry mass was recorded immediately. To avoid CO2 contamination, the following steps were performed inside an argon-filled glovebox. Dry BPN1-QA(Br) membrane was immersed in 1M NaOH solution for 24 h. The resulting BPN1-QA(OH) membrane was thoroughly washed with argon-bubbled distilled water. After carefully blotting the membrane surface with Kimwipe, wet mass was recorded quickly. Water uptake was calculated using the equation below:
WU   ( wt . % ) = W w e t W d r y   W d r y × 100 %
where Wdry is the calculated dry mass of the corresponding BPN1-QA(OH) membrane based on BPN1-QA(Br); Wwet is the measured wet mass of BPN1-QA(OH) membrane in its fully hydrated form.
Hydration number is an average number of water molecules per QA cation group. It was calculated using the equation below:
λ = W U × 1000 18 × I E C
where WU (wt.%) and IEC (mmol/g) are the water uptake and ion exchange capacity of the corresponding BPN1-QA(OH) membranes, respectively; 18 (g/mol) is the molar mass of water.

2.9. Proton Conductivity

In-plane proton conductivity was determined using a four-point method with Scribner 740 membrane test system and Newton 4th impedance analyzer. The specimen size was ca. 3 × 0.5 cm. Four successive RH ramps from 5% to 95% at 80 °C were applied. Each cycle started from conditioning at 5% RH for 2 h followed by a 10% RH increase from 10% to 90% RH. At each RH step, the membrane was equilibrated for 0.5 h before conductivity measurement. Proton conductivity (σ in mS/cm) was obtained using the equation below:
σ = L R × W × T   ×   1000
where R (Ω) is the measured sample resistance, L (cm) is the distance between two inner electrodes, W (cm) is the sample width, and T (cm) is the sample thickness.

3. Results and Discussion

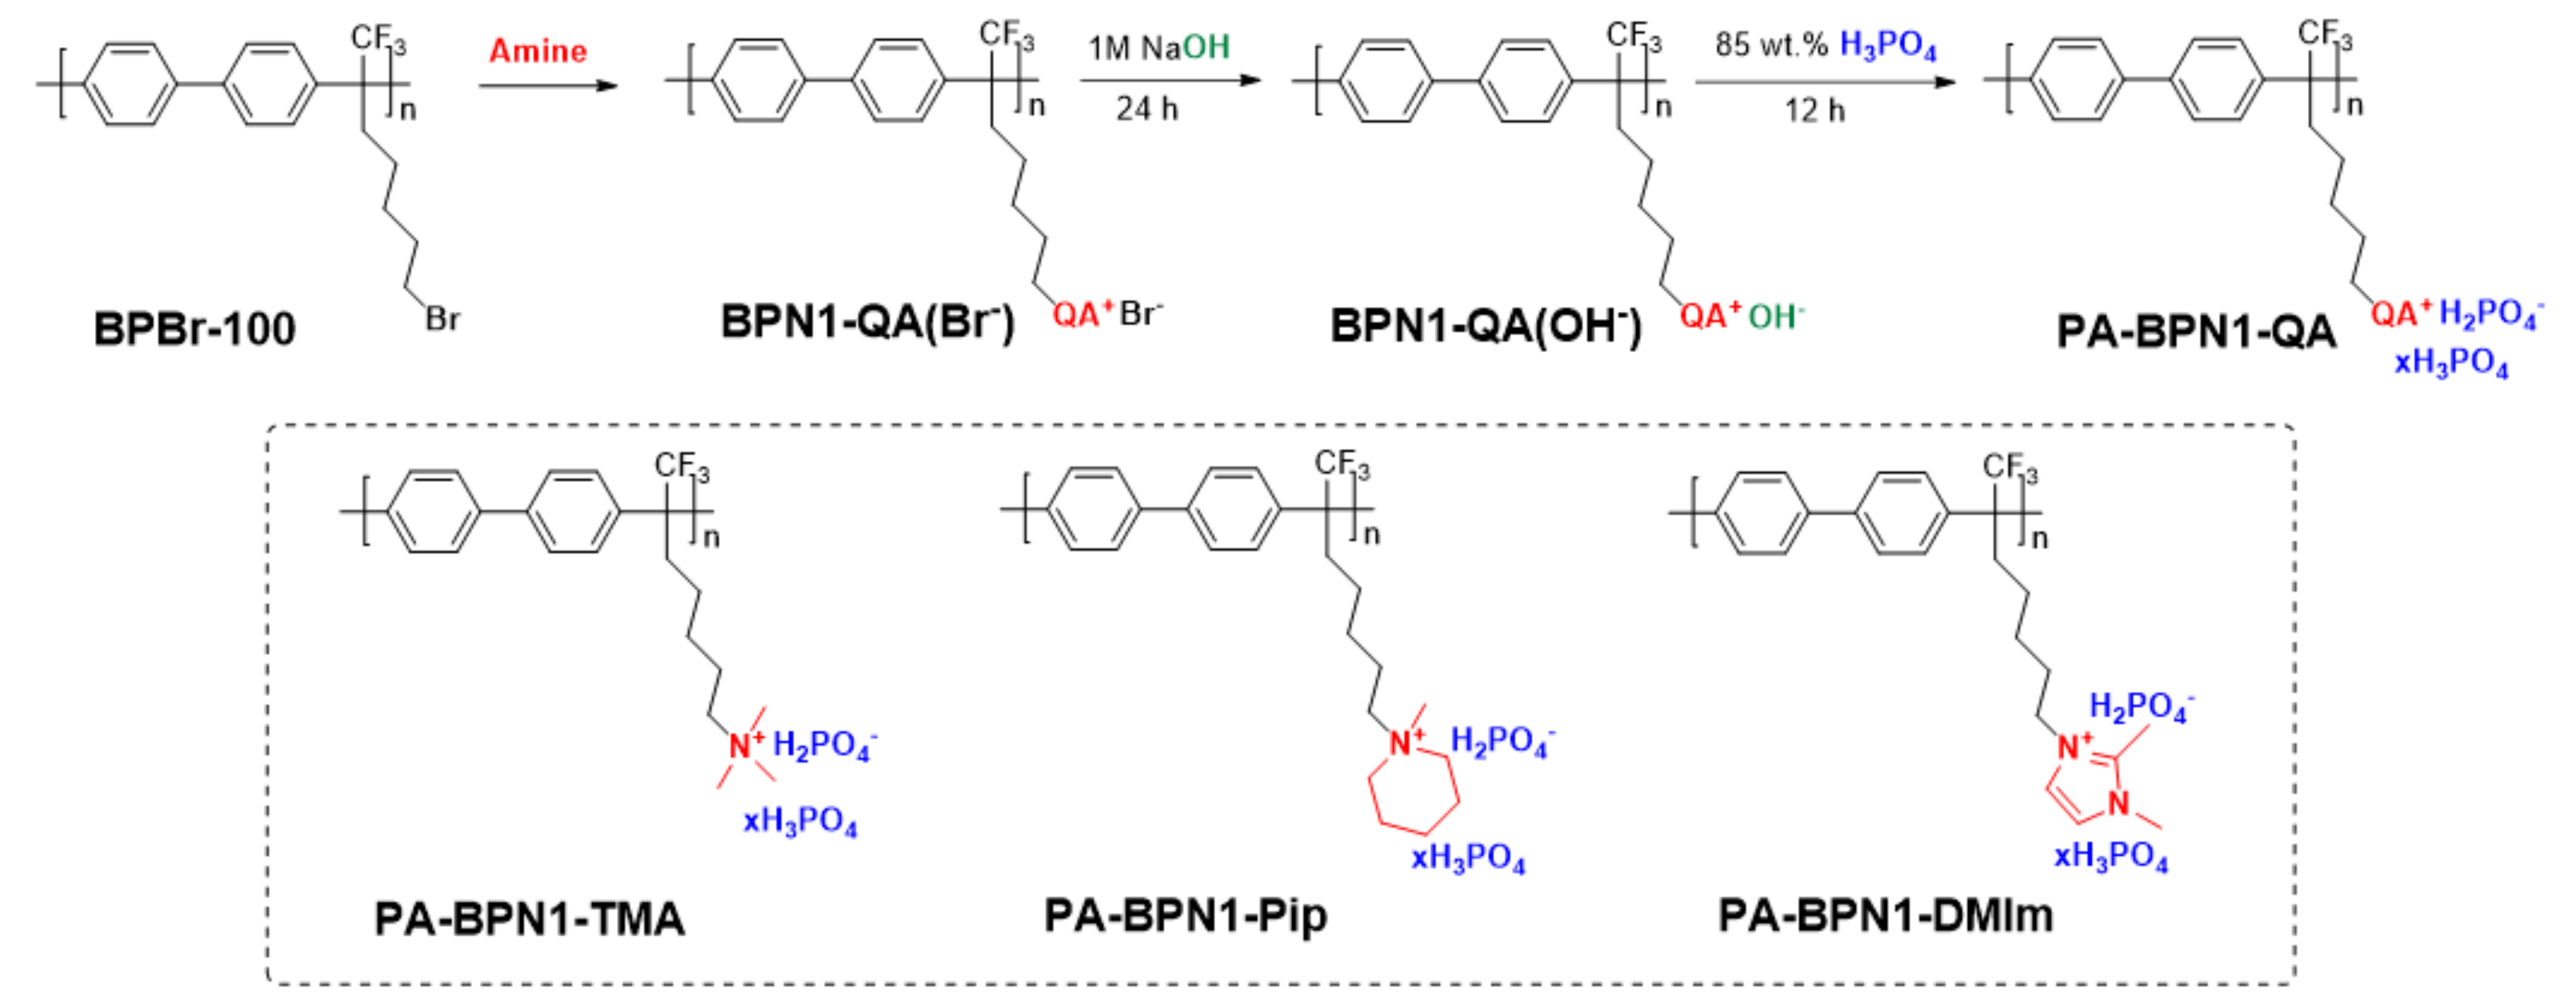
3.1. Polymer Synthesis

BPBr-100 with a weight-average molecular weight (Mw) of 90 kg/mol was chosen as the base material platform because of (i) excellent intrinsic chemical stability (attributed to all carbon-carbon backbone structure); (ii) good mechanical strength (ascribed to an outcome of high molecular weight and rigid aromatic polymer backbone); (iii) good solubility in common organic solvents (including chloroform, THF, and DMAc) at room temperature; and (iv) the potential to form well-connected ionic channels after quaternization (through self-aggregation of the QA groups tethered to a flexible alkyl side chain). BPBr-100 was synthesized using acid-catalyzed Friedel-Crafts polycondensation according to the procedures previously reported [25]. As shown in Figure 1, BPBr-100 underwent quaternization reaction with different tertiary amines including trimethylamine, 1-methylpiperidine, and 1,2-dimethylimidazole via SN2 reaction to afford three QA-bearing ionic polymers named as BPN1-TMA(Br), BPN1-Pip(Br), and BPN1-DMIm(Br), respectively. The successful synthesis of BPN1-QA(Br) was confirmed by 1H NMR spectroscopy. As shown in Figure 2, peak c at 3.34 ppm of CH2Br on the side chain of BPBr-100 (Figure 2a) disappeared completely after quaternization reactions; corresponding proton signals of QA groups emerged accordingly (Figure 2b–d). All assigned proton peaks are in good agreement with expected chemical structures. For example, the 1H NMR signal of TMA protons appeared at 3.02 ppm, and the ratio of their integral area to those of two aromatic proton peaks at 7.38 and 7.74 ppm confirmed that the conversion was quantitative (Figure 2b).

3.2. PA Doping Level

Flexible and transparent self-supporting membranes were prepared from 5 wt.% BPN1-QA(Br) solution in DMSO, which were then ion-exchanged with 1M NaOH (aq) and doped with PA following the procedures discussed in Section 2.5 and 2.6. Previous studies of PA-PBI PEMs suggested that concentrated PA solution and relatively long immersion time induce a higher PA doping level and greater proton conductivity [26,27]; hence, 85 wt.% PA solution and 12 h immersion time were employed for the present work. When BPN1-QA(OH) membranes were placed in a PA bath, a portion of PA molecules were first deprotonated by hydroxide ion generating dihydrogen phosphate anion. Subsequently, dihydrogen phosphate anion formed ion pairs with QA cations, and extra PA molecules were held within the membrane via OH hydrogen bond networks. After the PA doping process, the obtained PA-BPN1-QA membranes were left alone for 72 h to let any unbound acid molecules on the surface leach out.
The amount of doped PAs per QA group (PA doping level) was measured by acid-base titration. Table 1 shows that the PA doping levels of all three PA-BPN1-QA polymers are within a range of 6–8, which are comparable to the stabilized doping level of 8.5 for previously reported QAPOH [24]. Since 85 wt.% PA solution was used for the doping process, the resulting PA doped membranes also contain some water (Table 1). As all three PA-BPN1-QA polymers were prepared from the same batch of BPBr-100 precursor polymer, the difference in PA doping levels is ascribable to the outcome of different structures and sizes of QA groups rather than polymer backbone. As Pip cation is bulkier than TMA, the formation of hydrogen bond network among PA molecules surrounding Pip will be less effective compared to that of TMA. It is possible that the presence of hydrophobic moiety in the cyclic structure of Pip cation could, to some extent, expel PA molecules, while TMA cation is able to hold PA clusters closer to its cationic center due to smaller size. The water content in PA-BPN1-QA follows the same trend of the PA doping level (Table 1).
It is interesting to note that although both BPN1-Pip and BPN1-DMIm have almost the same ion exchange capacities (IECs; see Table 2), the DMIm cation polymer tends to retain more PA molecules than the Pip cation polymer (Table 1). This is believed to be due to a unique characteristic of DMIm cation. Two nitrogen atoms in the imidazolium ring are equivalent and the lone pair electron of the methyl-substituted nitrogen in the imidazolium is not basic (i.e., a positive charge is delocalized by resonance effect). Thus, the presence of two equivalent nitrogen atoms in the aromatic ring of imidazolium would induce a higher dipole moment than Pip in which the dipole moment of individual bonds around nitrogen would cancel each other (μ ≈ 0). Due to the higher dipole moment, BPN1-DMIm might have higher a PA doping level in Table 1 and hydration number in Table 2 than BPN1-Pip. It is likely that the greater dipole moment of BPN1-DMIm compared to BPN1-Pip may have created a stronger interaction with PA molecules (i.e., higher PA doping level than expected) via dipole-dipole force.
To better understand the correlation of QA structure and PA doping level, water absorption behaviors were investigated in terms of hydration number and water uptake (WU) of BPN1-QA(OH) (i.e., the QA polymers in hydroxide form prior to PA doping). Since hydration number is defined as an average number of water molecules per QA cation group when the membrane is fully hydrated, it can be interpreted as a similar analogy of PA doping level except that QA is surrounded by water molecules instead of PA molecules. The hydration number data of Table 2 shows the same trend of PA doping of Table 1; as PA doping level increases for a polymer, it results in a high hydration number. Since the absorbed water molecules in fully hydrated membrane are also maintained by the formation of OH hydrogen bond network, it is logical to think there should be a good correlation between PA doping level of doped polymers in Table 1 and hydration number of QA polymers in Table 2.

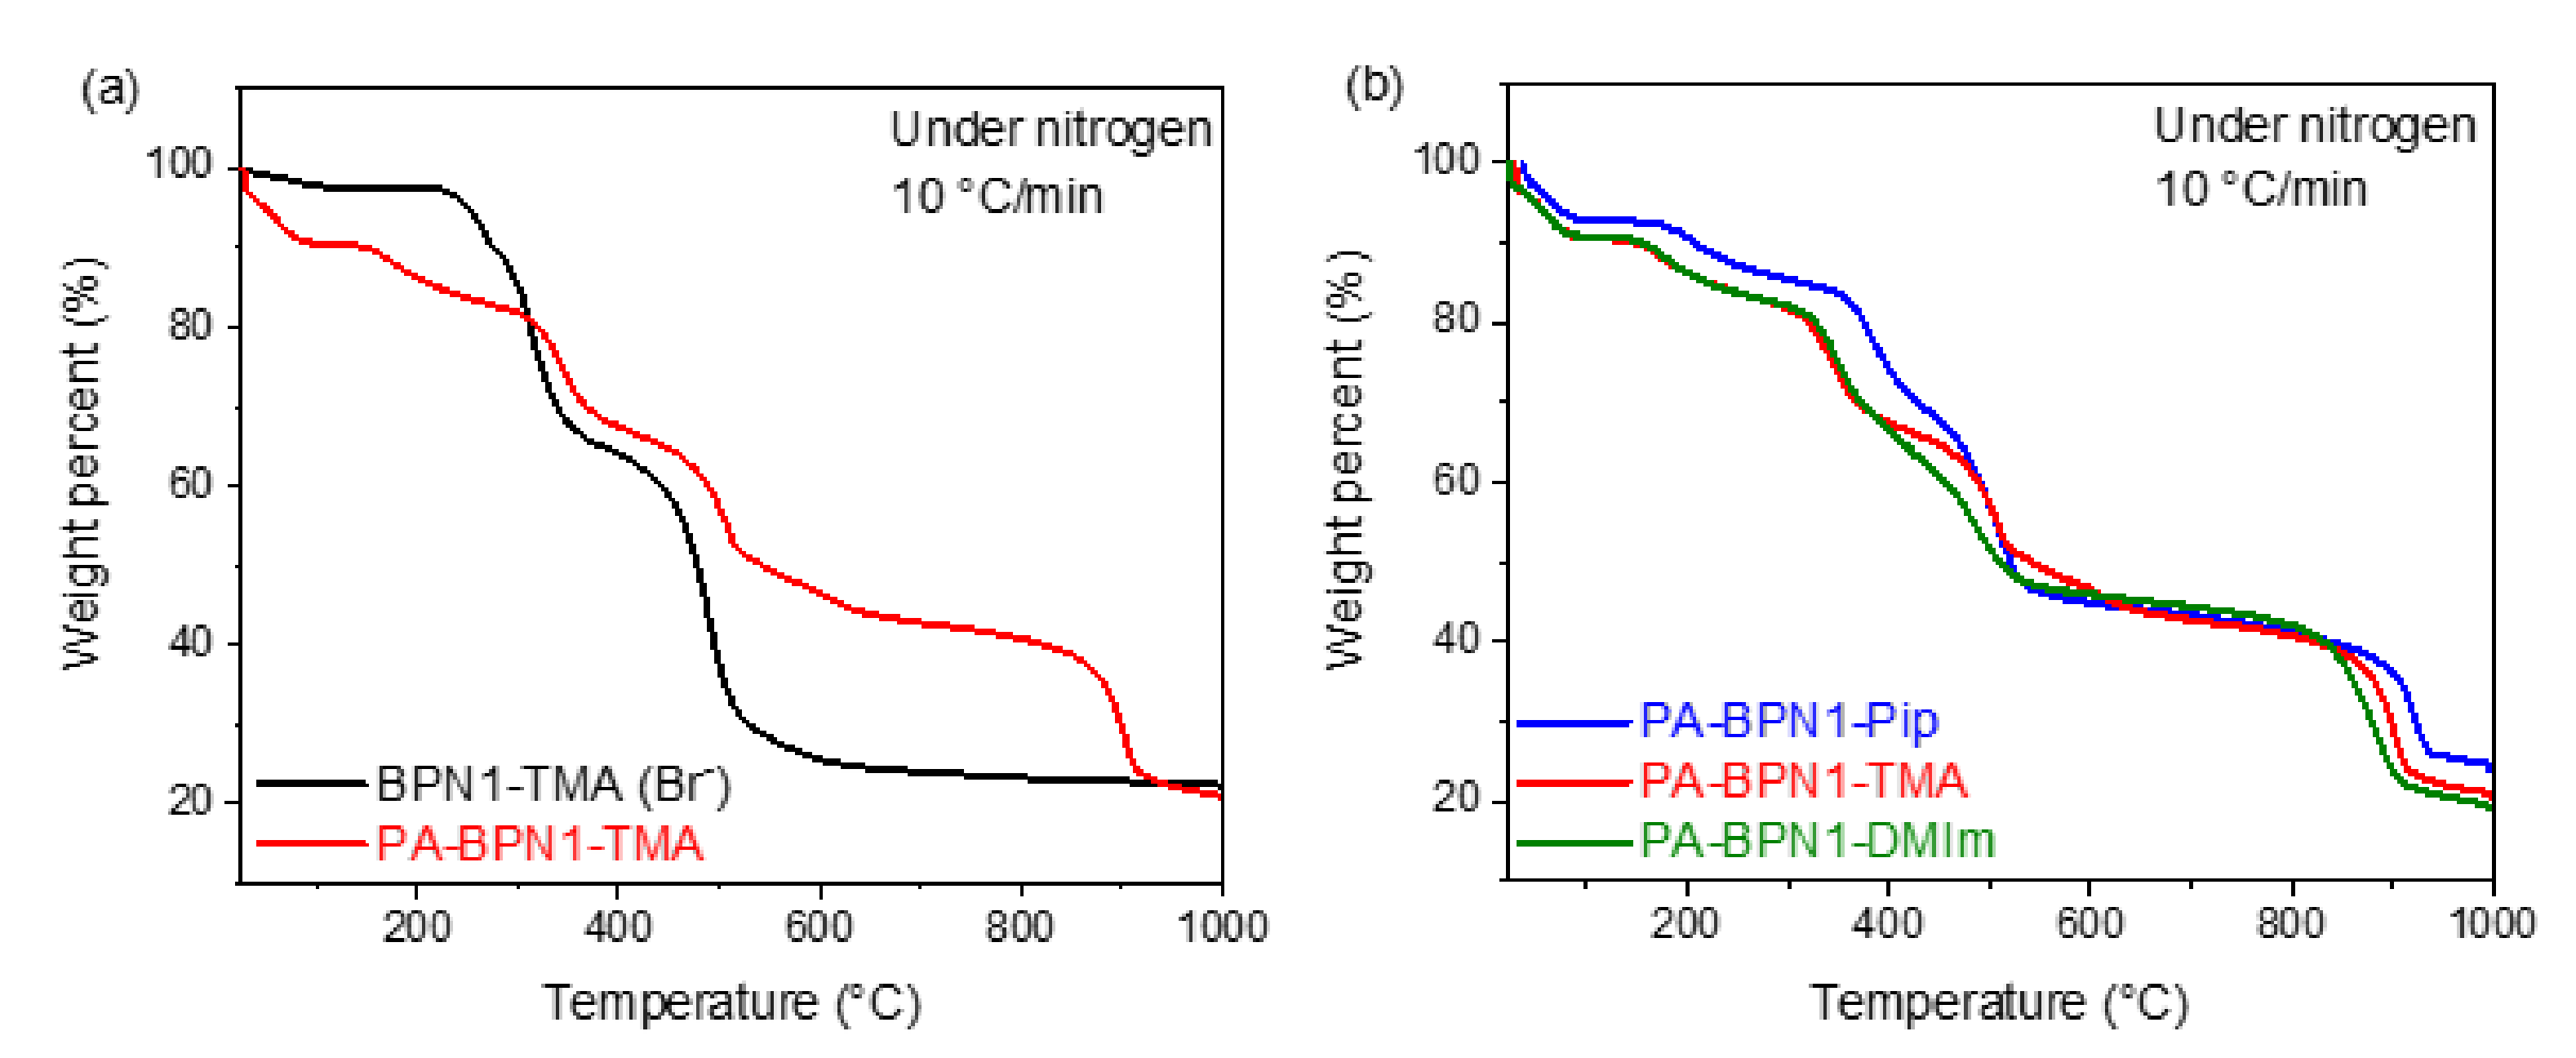
3.3. Thermal Property

Thermal property was investigated by TGA under nitrogen atmosphere from 25 to 1000 °C with a heating rate of 10 °C per minute. The TGA curve of undoped BPN1-TMA(Br) (Figure 3a, black line) reveals the intrinsic thermal stability of the QA polymer. A slight weight loss was observed around 100 °C due to the evaporation of absorbed water. The QA groups started to degrade at 220 °C followed by sidechain degradation at 290 °C and backbone degradation at 420 °C. For PA-BPN1-TMA polymer (Figure 3a, red line), the TGA curve shows ca. 10 wt.% decrease around 100 °C due to the evaporation of imbibed water which is in agreement with the calculated water content of Table 1. The second weight loss took place around 165 °C which is attributed to the escape of water by-product from the condensation of phosphoric acids to form pyrophosphoric acids [28]. The thermal decomposition at 360 °C is associated with the degradation of polymer backbone, and the weight loss around 475 °C is attributed to the further dehydration of pyrophosphoric acids to form polyphosphoric acids. Figure 3b indicates that all three PA-BPN1-QA polymers exhibited similar thermal decomposition behaviors. The degradations of QA groups and polymer sidechains were no longer clearly visible due to their small weight percentage in PA-doped membranes and potential overlap with the water evaporation from PA condensation.

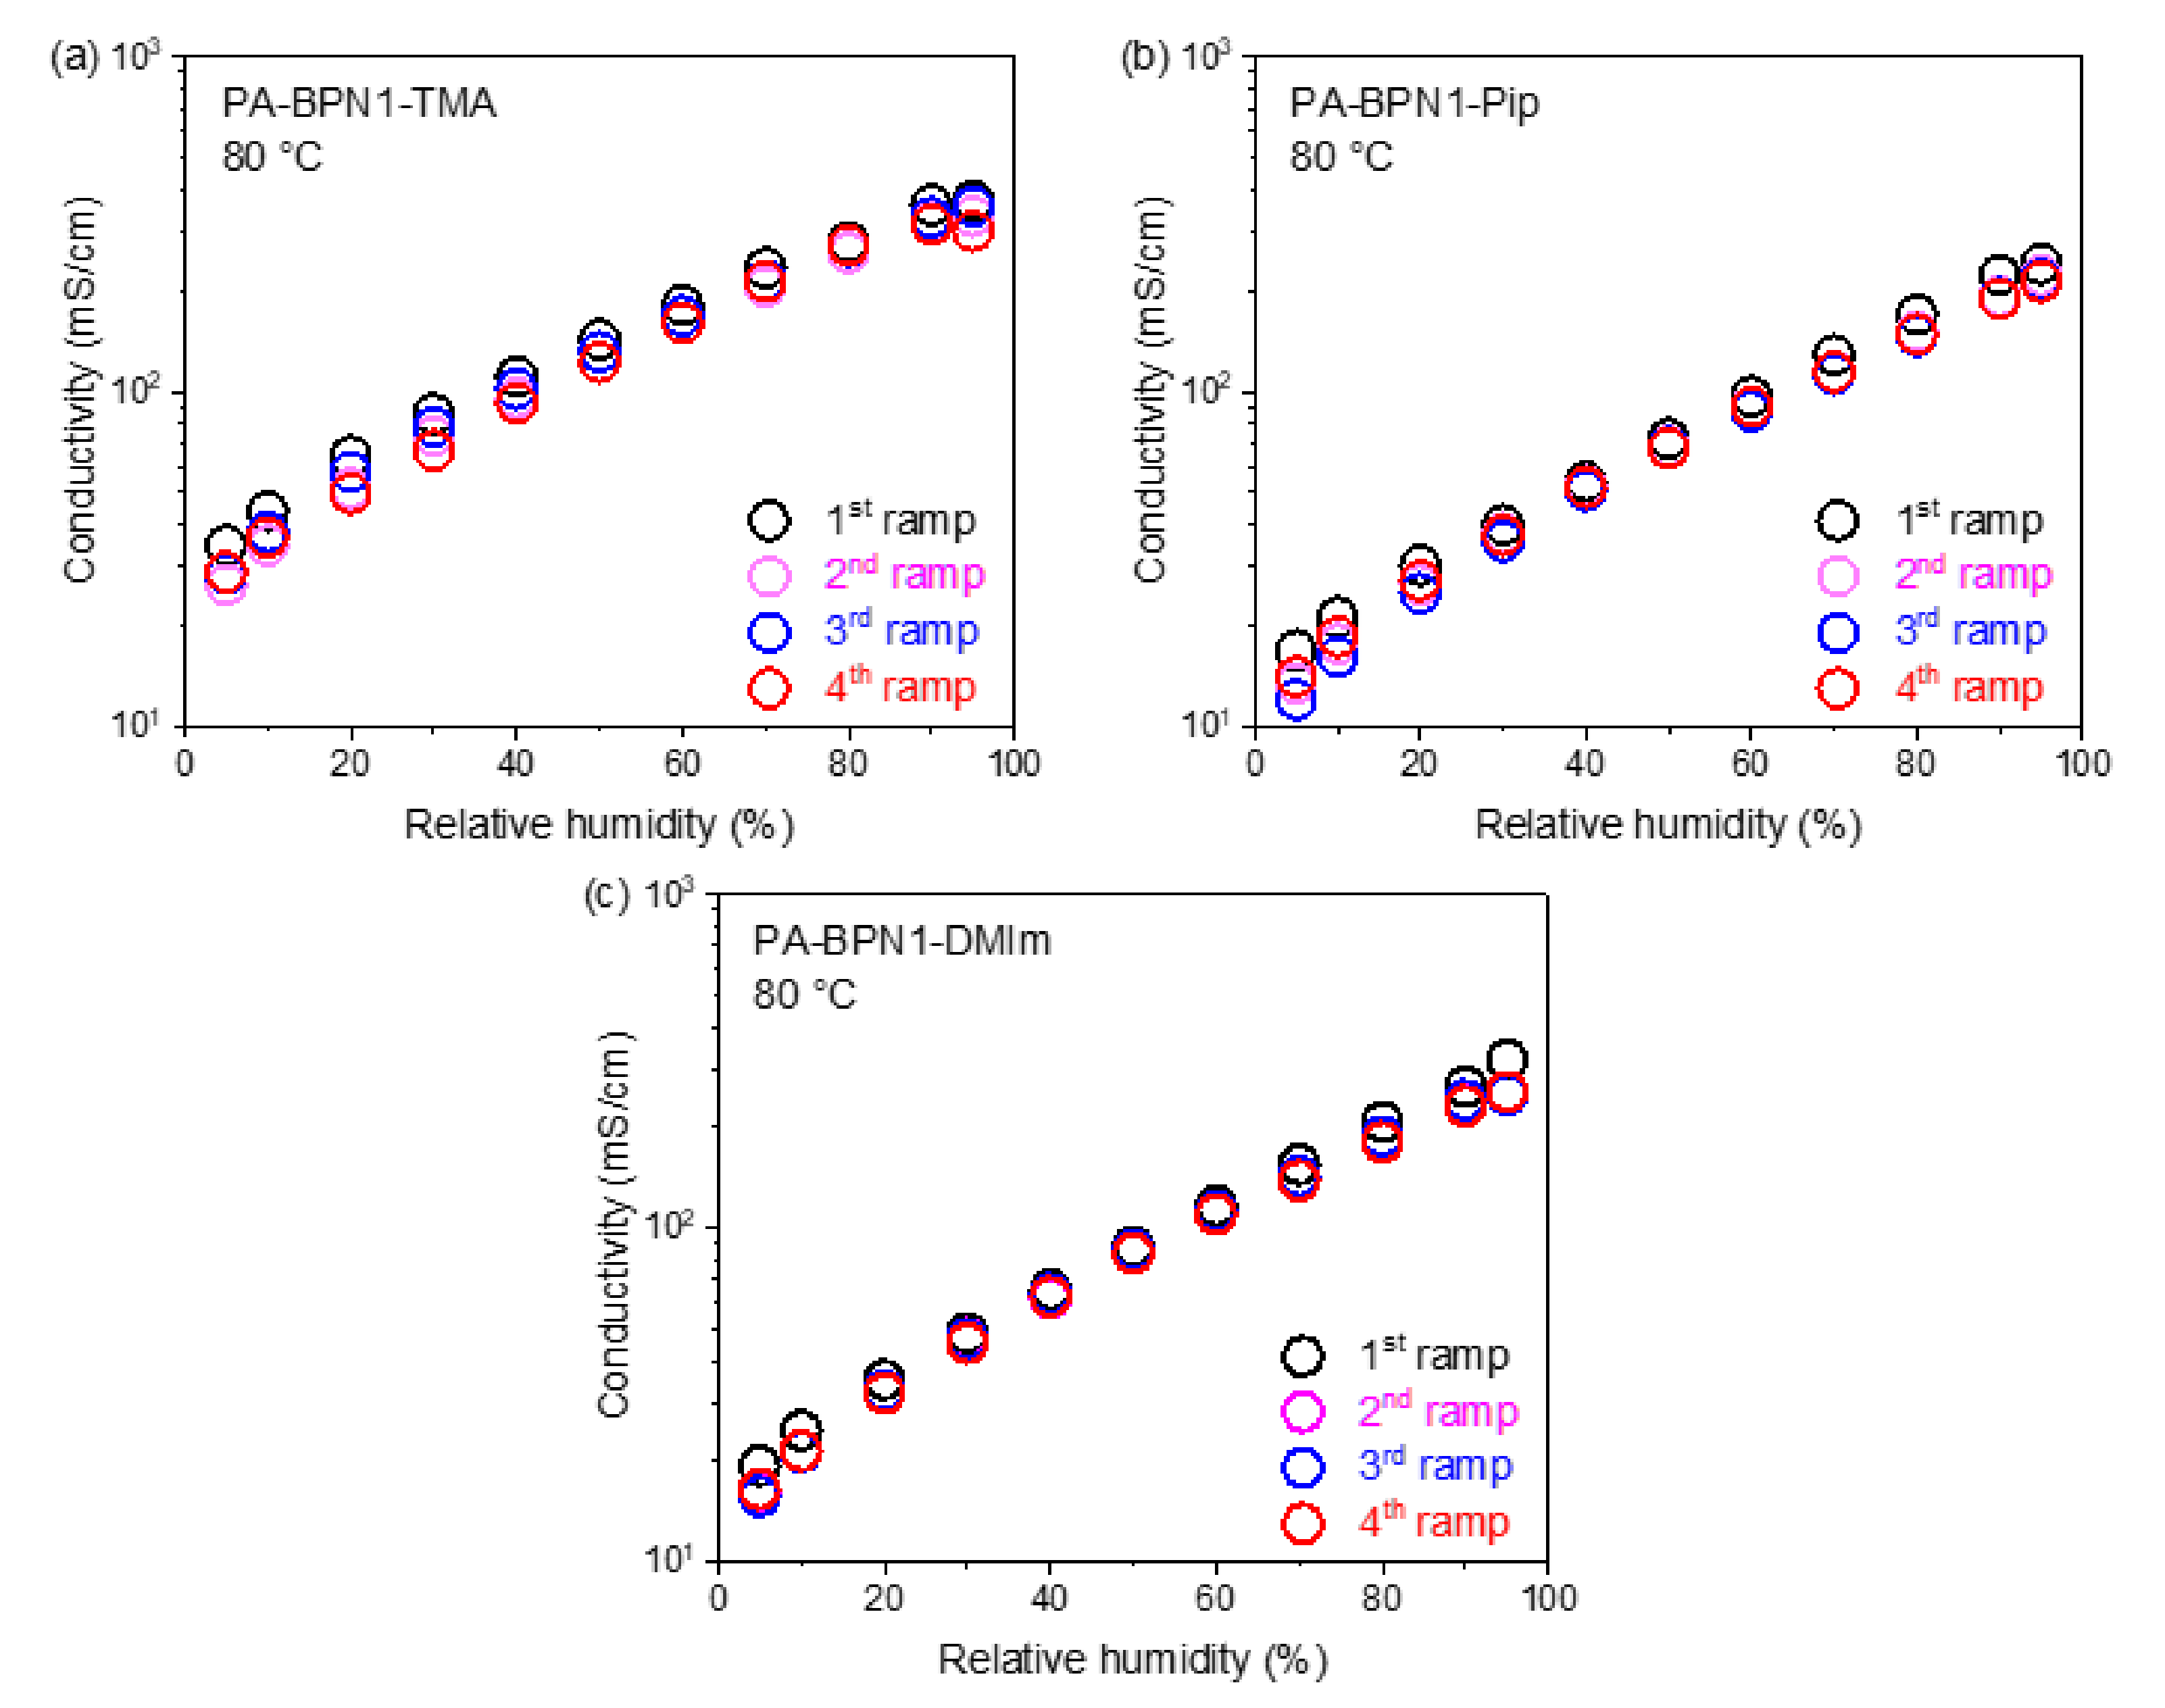
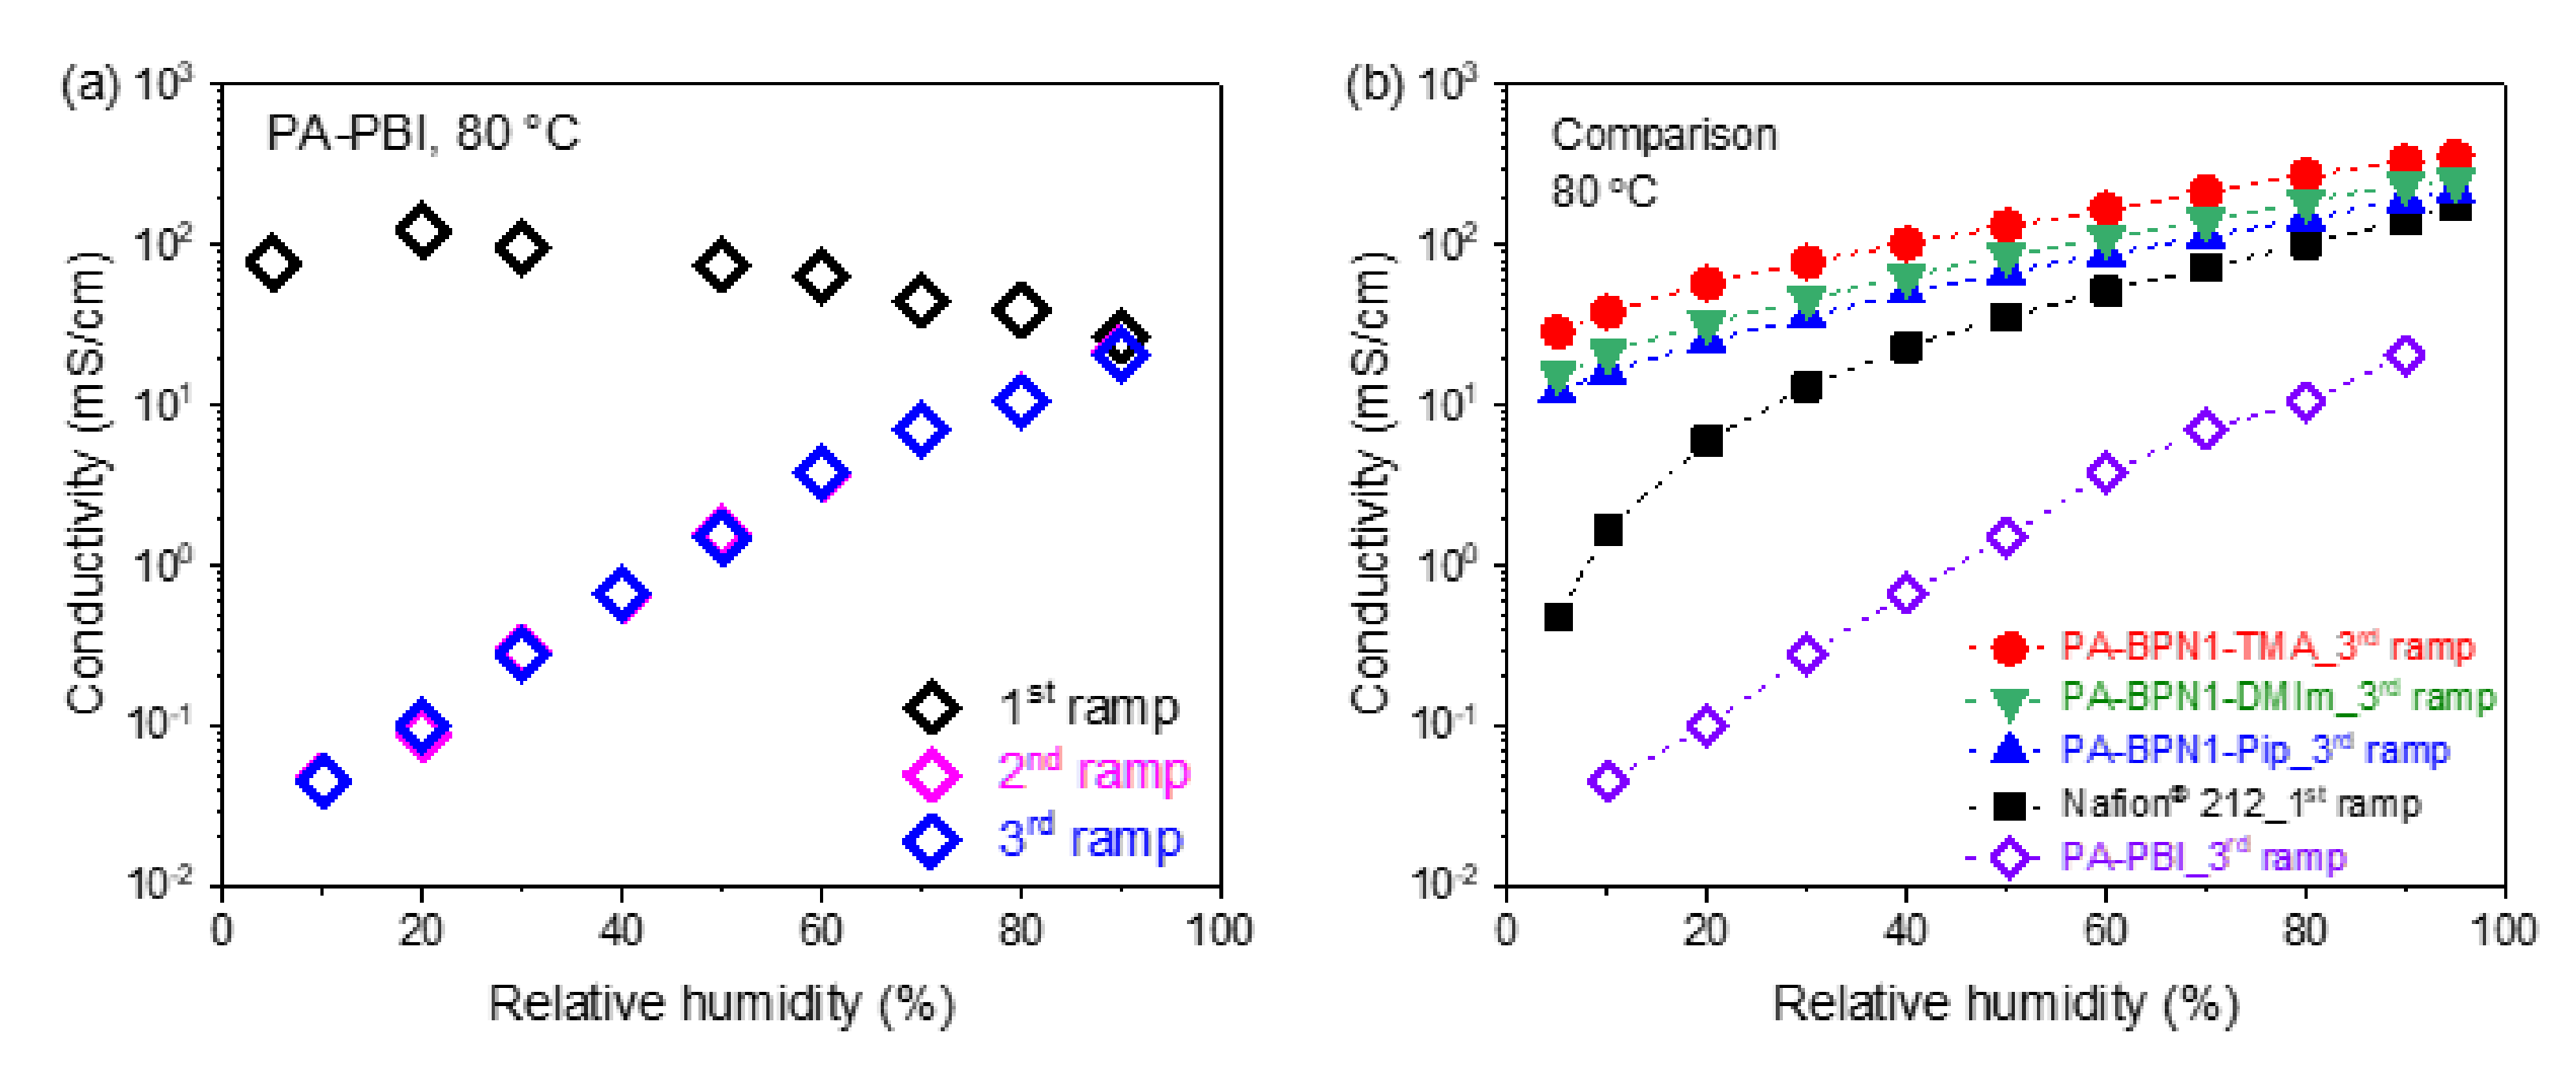
3.4. Proton Conductivity

Proton conductivity is an important property of PEMs which directly affects the efficiency of electrochemical devices. It depends on several factors including the concentration of proton-conducting groups (i.e., IEC), temperature, RH, and membrane morphology. In contrast to sulfonate sidechain PEMs, such as Nafion®, whose proton conductivity heavily relies on the presence of water, PA possesses a unique proton conduction mechanism by self-ionization which enables PA-doped PEMs to conduct protons even under anhydrous conditions [29]. Figure 4 shows in-plane proton conductivity data of PA-BPN1-QA PEMs at 80 °C under four successive RH ramps ranging from 5% to 95%. It is not surprising to see that proton conductivity increased with increasing RH for all three samples; more water molecules not only provide more charge carriers but also decrease the viscosity of doped PAs which synergistically improve proton conductivity [29]. Additionally, the 1st RH ramp always showed slightly higher conductivity compared to the remaining RH ramps; the proton conductivity values of the 2nd, 3rd, and 4th RH ramps were almost identical. The slight conductivity drop after the 1st RH ramp is believed to be the loss of a trace amount of surface free PAs that were washed away during the 1st RH ramp.
The proton conductivity of PA-PBI PEM under the same condition was previously reported in literature [24] and replotted in Figure 5a for a comparison with PA-BPN1-QA PEMs in this work. A sharp drop in conductivity for PA-PBI after the 1st RH ramp indicates that a severe PA loss happened during the conductivity measurement of the 1st RH ramp. Thus, the more consistent proton conductivity value of each RH ramp (including the 1st RH ramp) for all PA-BPN1-QA PEMs in this work confirms that the presence of ion-pair interaction does help to enhance PA retention compared to PA-PBI PEM. Figure 5b plots proton conductivity values from the 3rd RH ramps of PA-BPN1-QA and PA-PBI PEMs and compares them to the conductivity of Nafion® 212. As expected, PA-PBI showed the lowest proton conductivity as most of the doped acids leached out quickly over the course of the 1st RH ramp. While Nafion® 212 provided good conductivity at >80% RH, PA-BPN1-QA PEMs maintained high proton conductivity at entire RH range of 5% to 95%. The difference in proton conductivity values between PA-BPN1-QA and Nafion® 212 grew further as RH was decreased because the PA-doped ion-pair PEMs do not require humidity for proton conduction, thus maintaining high conductivity, while the sulfonate sidechain PEM does require water for proton conduction.
When proton conductivities among different cations of PA-BPN1-QA PEMs were compared, PA-BPN1-Pip showed the lowest conductivity because of the lowest PA doping level (Figure 5b). PA-BPN1-DMIm showed a slightly lower conductivity than PA-BPN1-TMA despite both having a similar doping level (7.7 vs. 7.4). Although both ion-pair PEMs retain comparable PA molecules per QA moiety, since BPN1-DMIm has a lower IEC than BPN1-TMA (2.40 vs. 2.63 mmol/g; see Table 2), the former should contain less PA amount in total which results in lower proton conductivity.

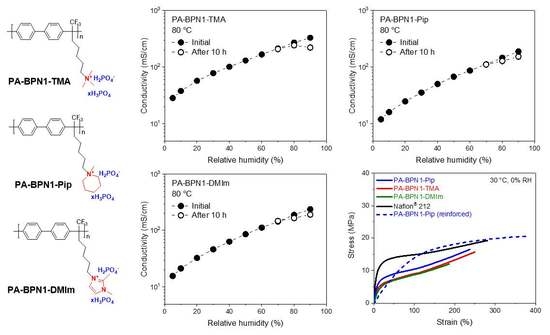
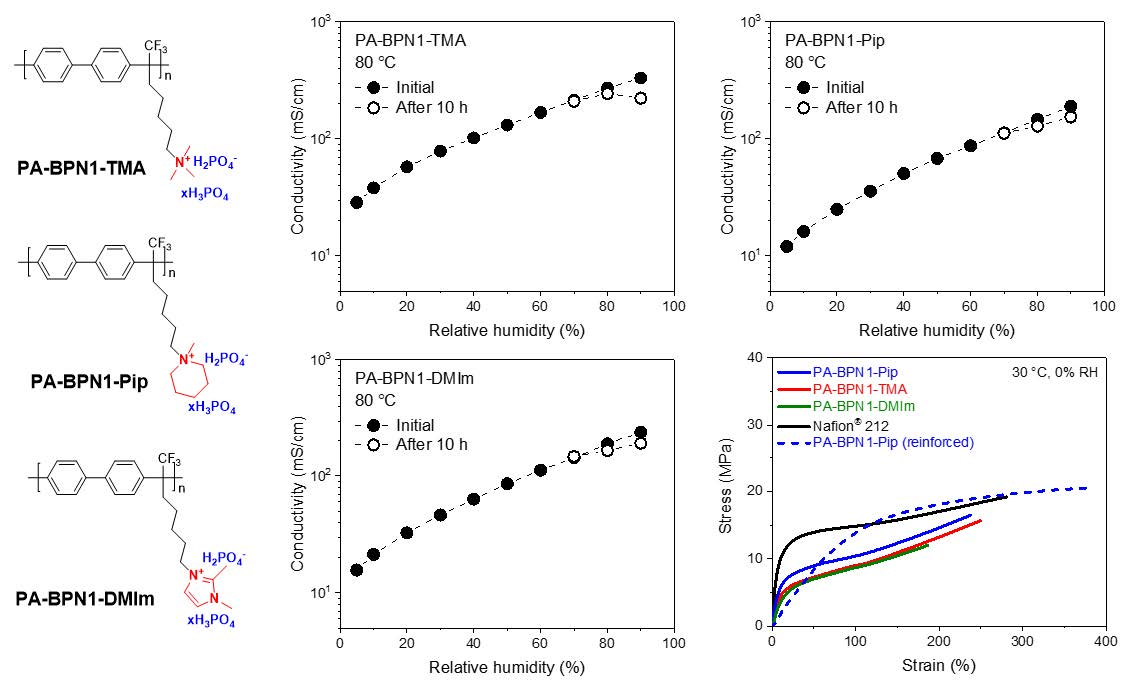
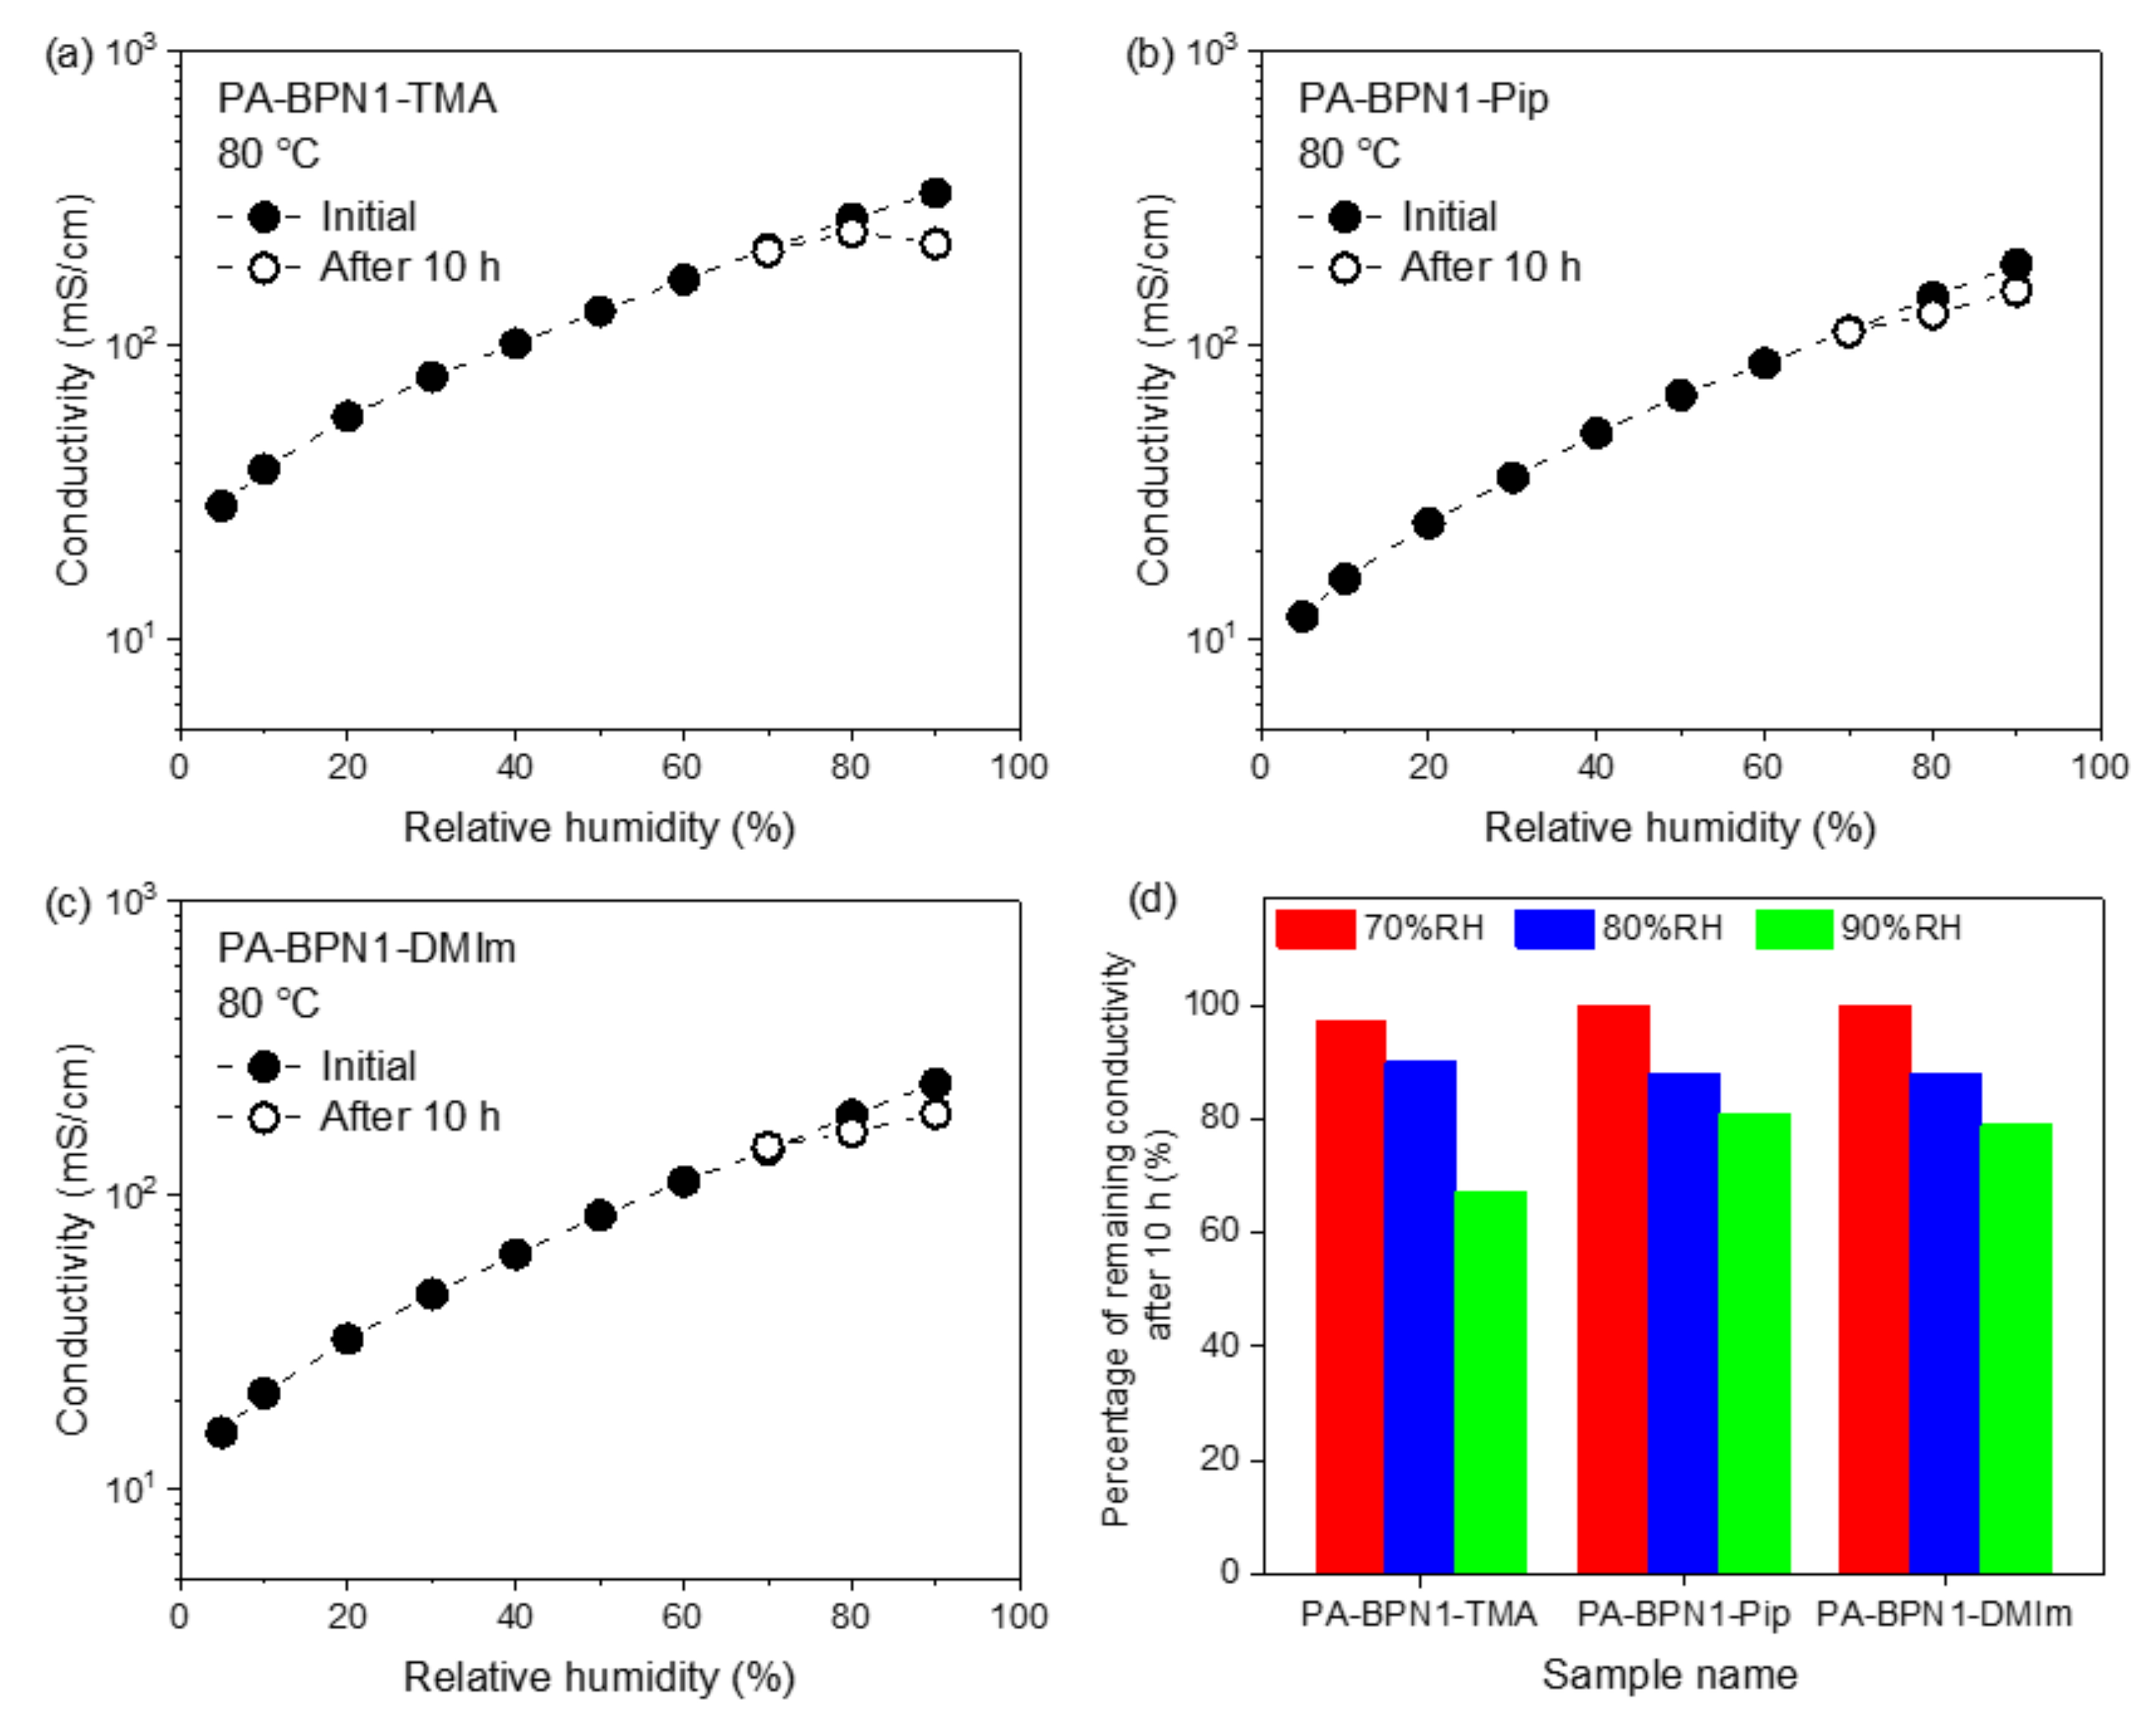
3.5. Relative Humidity Tolerance

To examine the conductivity stability at high RH levels, PA-BPN1-QA PEMs were kept at 80 °C under constant RHs of 70%, 80%, and 90% for 10 h during which conductivity was recorded every 0.5 h. As shown in Figure 6a–c, no obvious conductivity change was observed for 70% RH test of all three samples, while a slight drop in conductivity was observed for 80% RH and 90% RH tests. Figure 6d summarizes the extent of conductivity retention at 80% RH and 90% RH after the 10 h test. For PA-BPN1-TMA, 90% and 67% of initial conductivity were retained at 80% RH and 90% RH, respectively. Similarly, 88% and 81% of initial conductivity for PA-BPN1-Pip and 88% and 79% of initial conductivity for PA-BPN1-DMIm were retained under the same conditions. Those results confirm that the proton conductivities of PA-BPN1-QA PEMs are able to tolerate up to 70% RH at 80 °C without losing doped PA molecules, which is higher than 40% RH tolerance at 80 °C of QAPOH previously reported [24]. The difference in observed RH tolerance behavior is presumably a result of different initial PA doping levels. For example, the PA-BPN1-TMA membrane sample used in this study had a PA doping level of 7.4, while QAPOH was reported to have a doping level of 14.4. Please note that a long period (i.e., 72 h) of PA leaching out process was employed in this study after PA doping to remove most of the free PA molecules, which could have resulted in a lower PA doping level than the PA-doped QAPOH. Energetics study of the ion-pair polymer membrane system has suggested that the interaction energy of ion-pair decreases with increasing PA molecules [30]. Therefore, the removal of unbound PAs from the PA-BPN1-TMA sample could induce greater ion-pair interaction leading to enhanced RH tolerance. Although QAPOH had a higher PA doping level initially, the proton conductivity kept decreasing until the 5th RH ramp due to gradual loss of excess free PAs. Once the proton conductivity was stabilized in the 5th RH ramp, the PA doping level of QAPOH was found to be 8.5 which is comparable to this study [24].

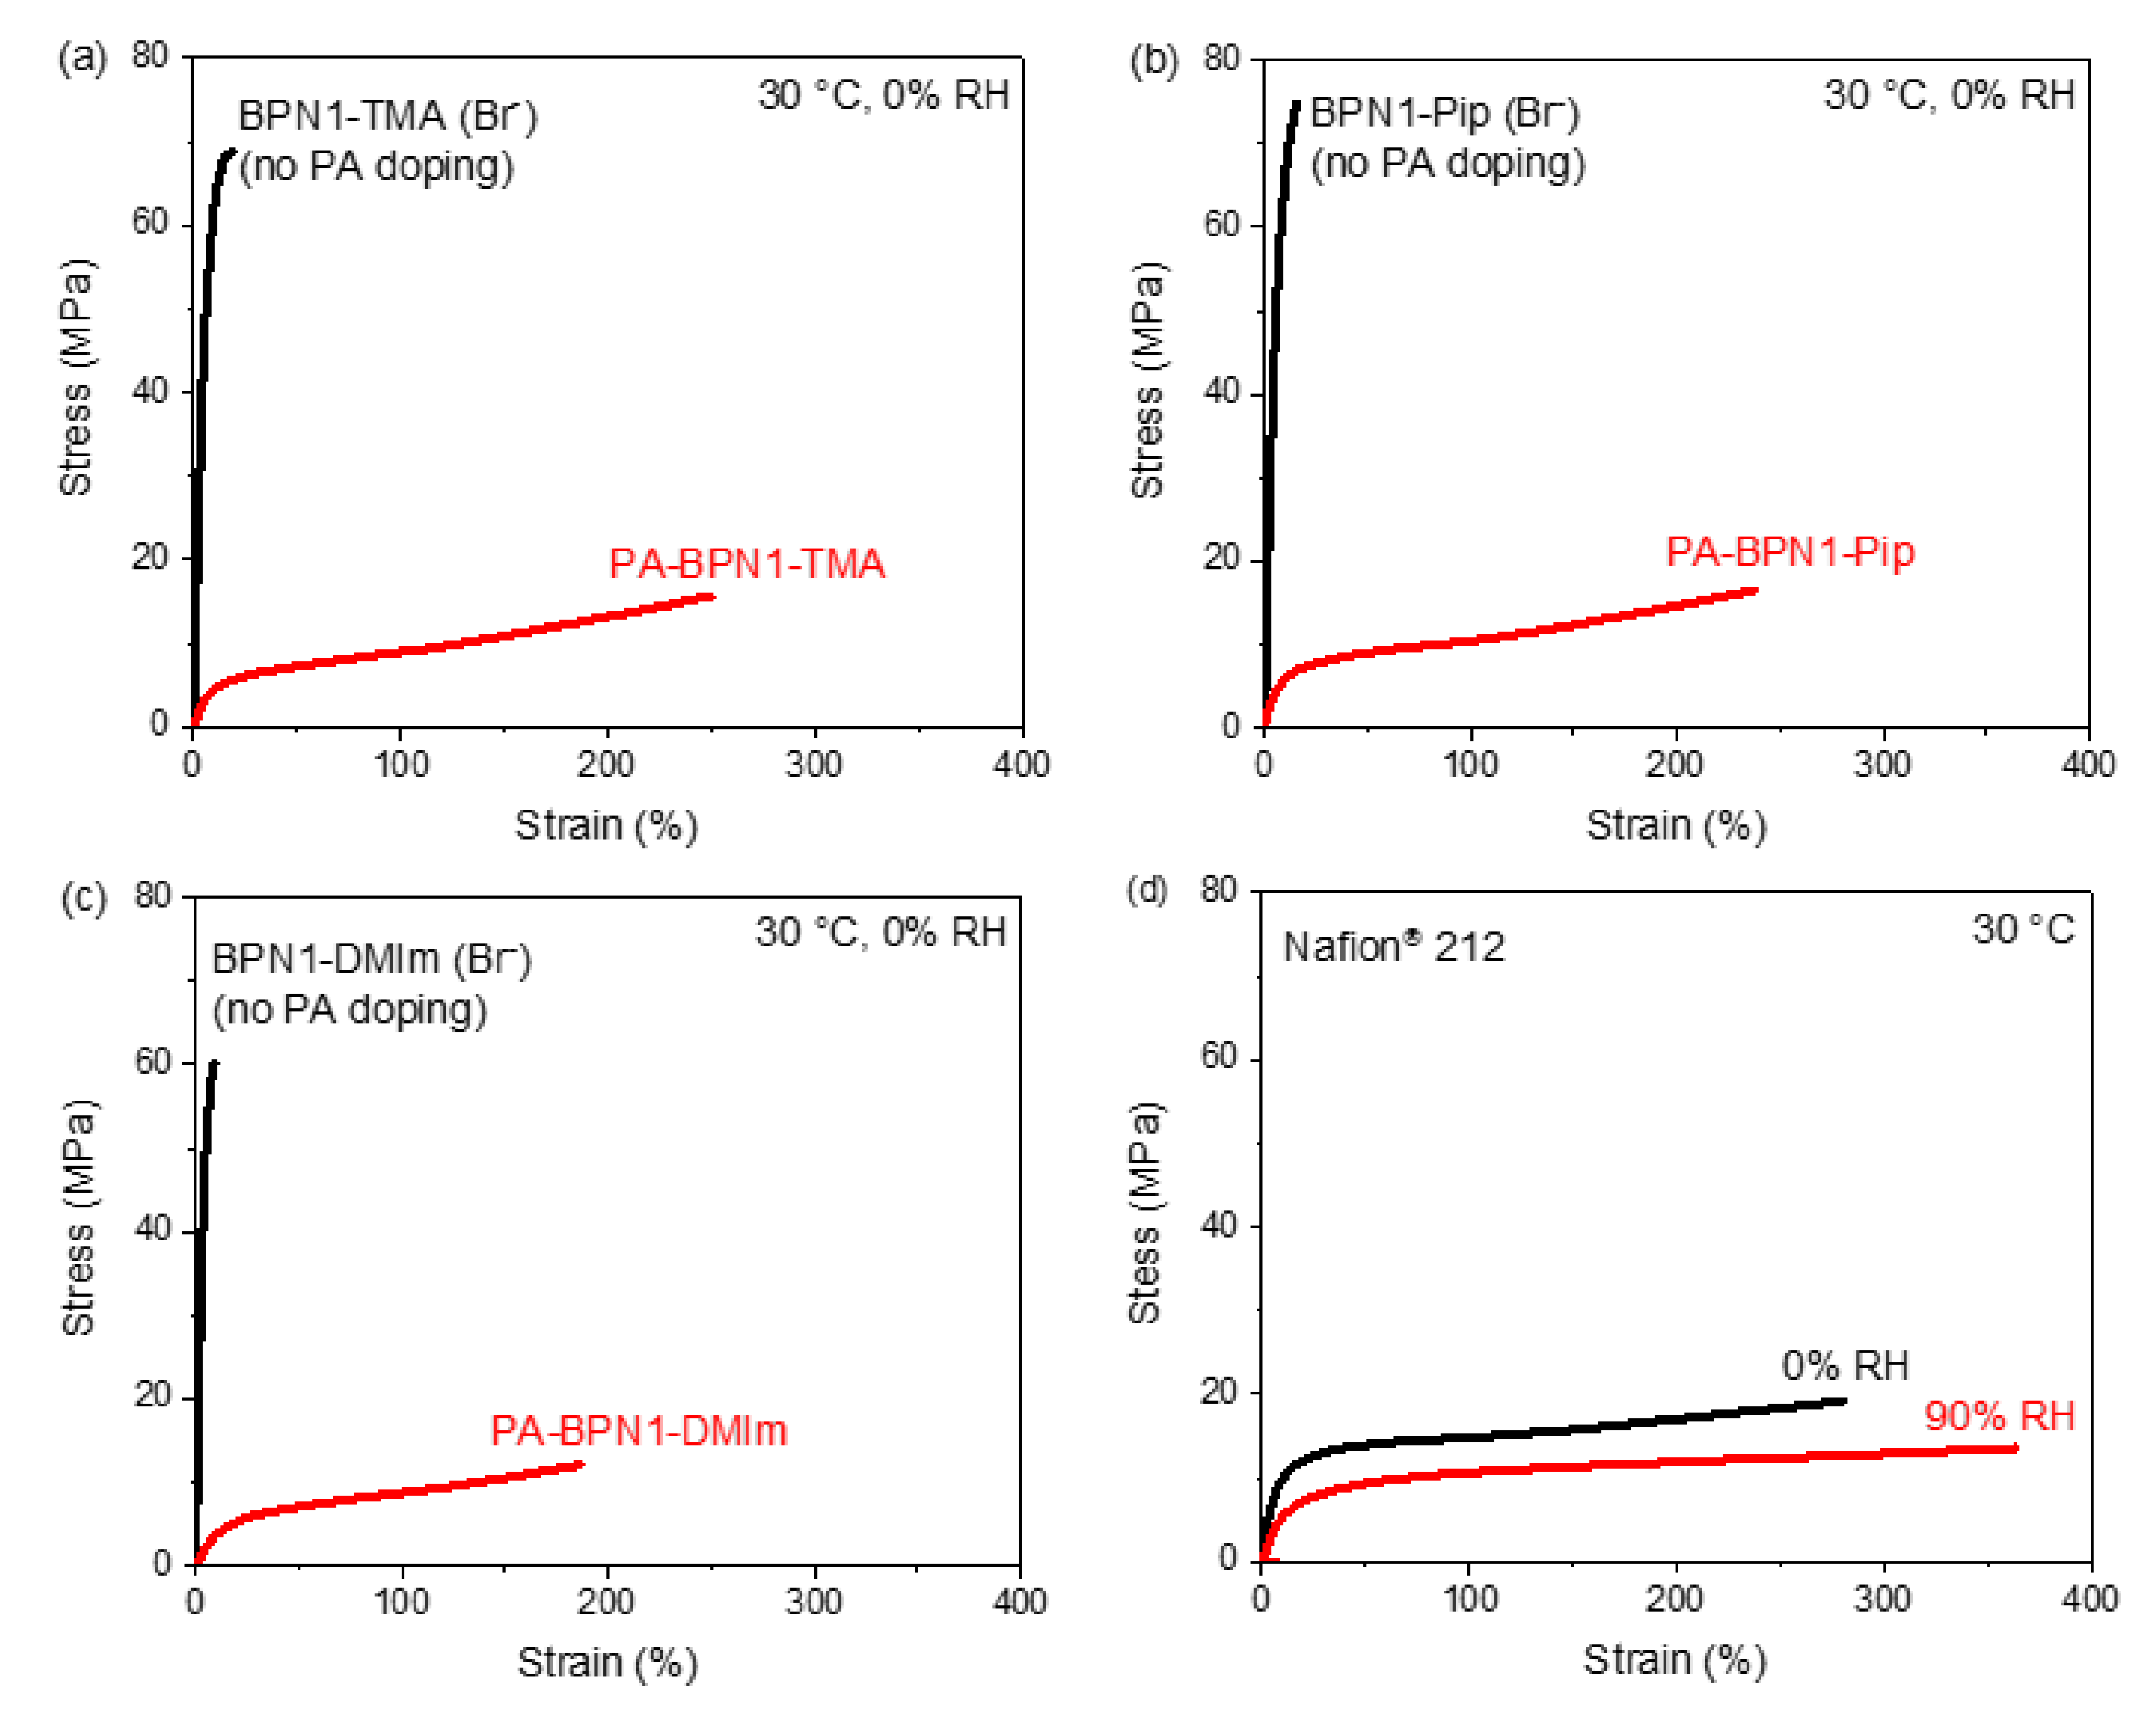
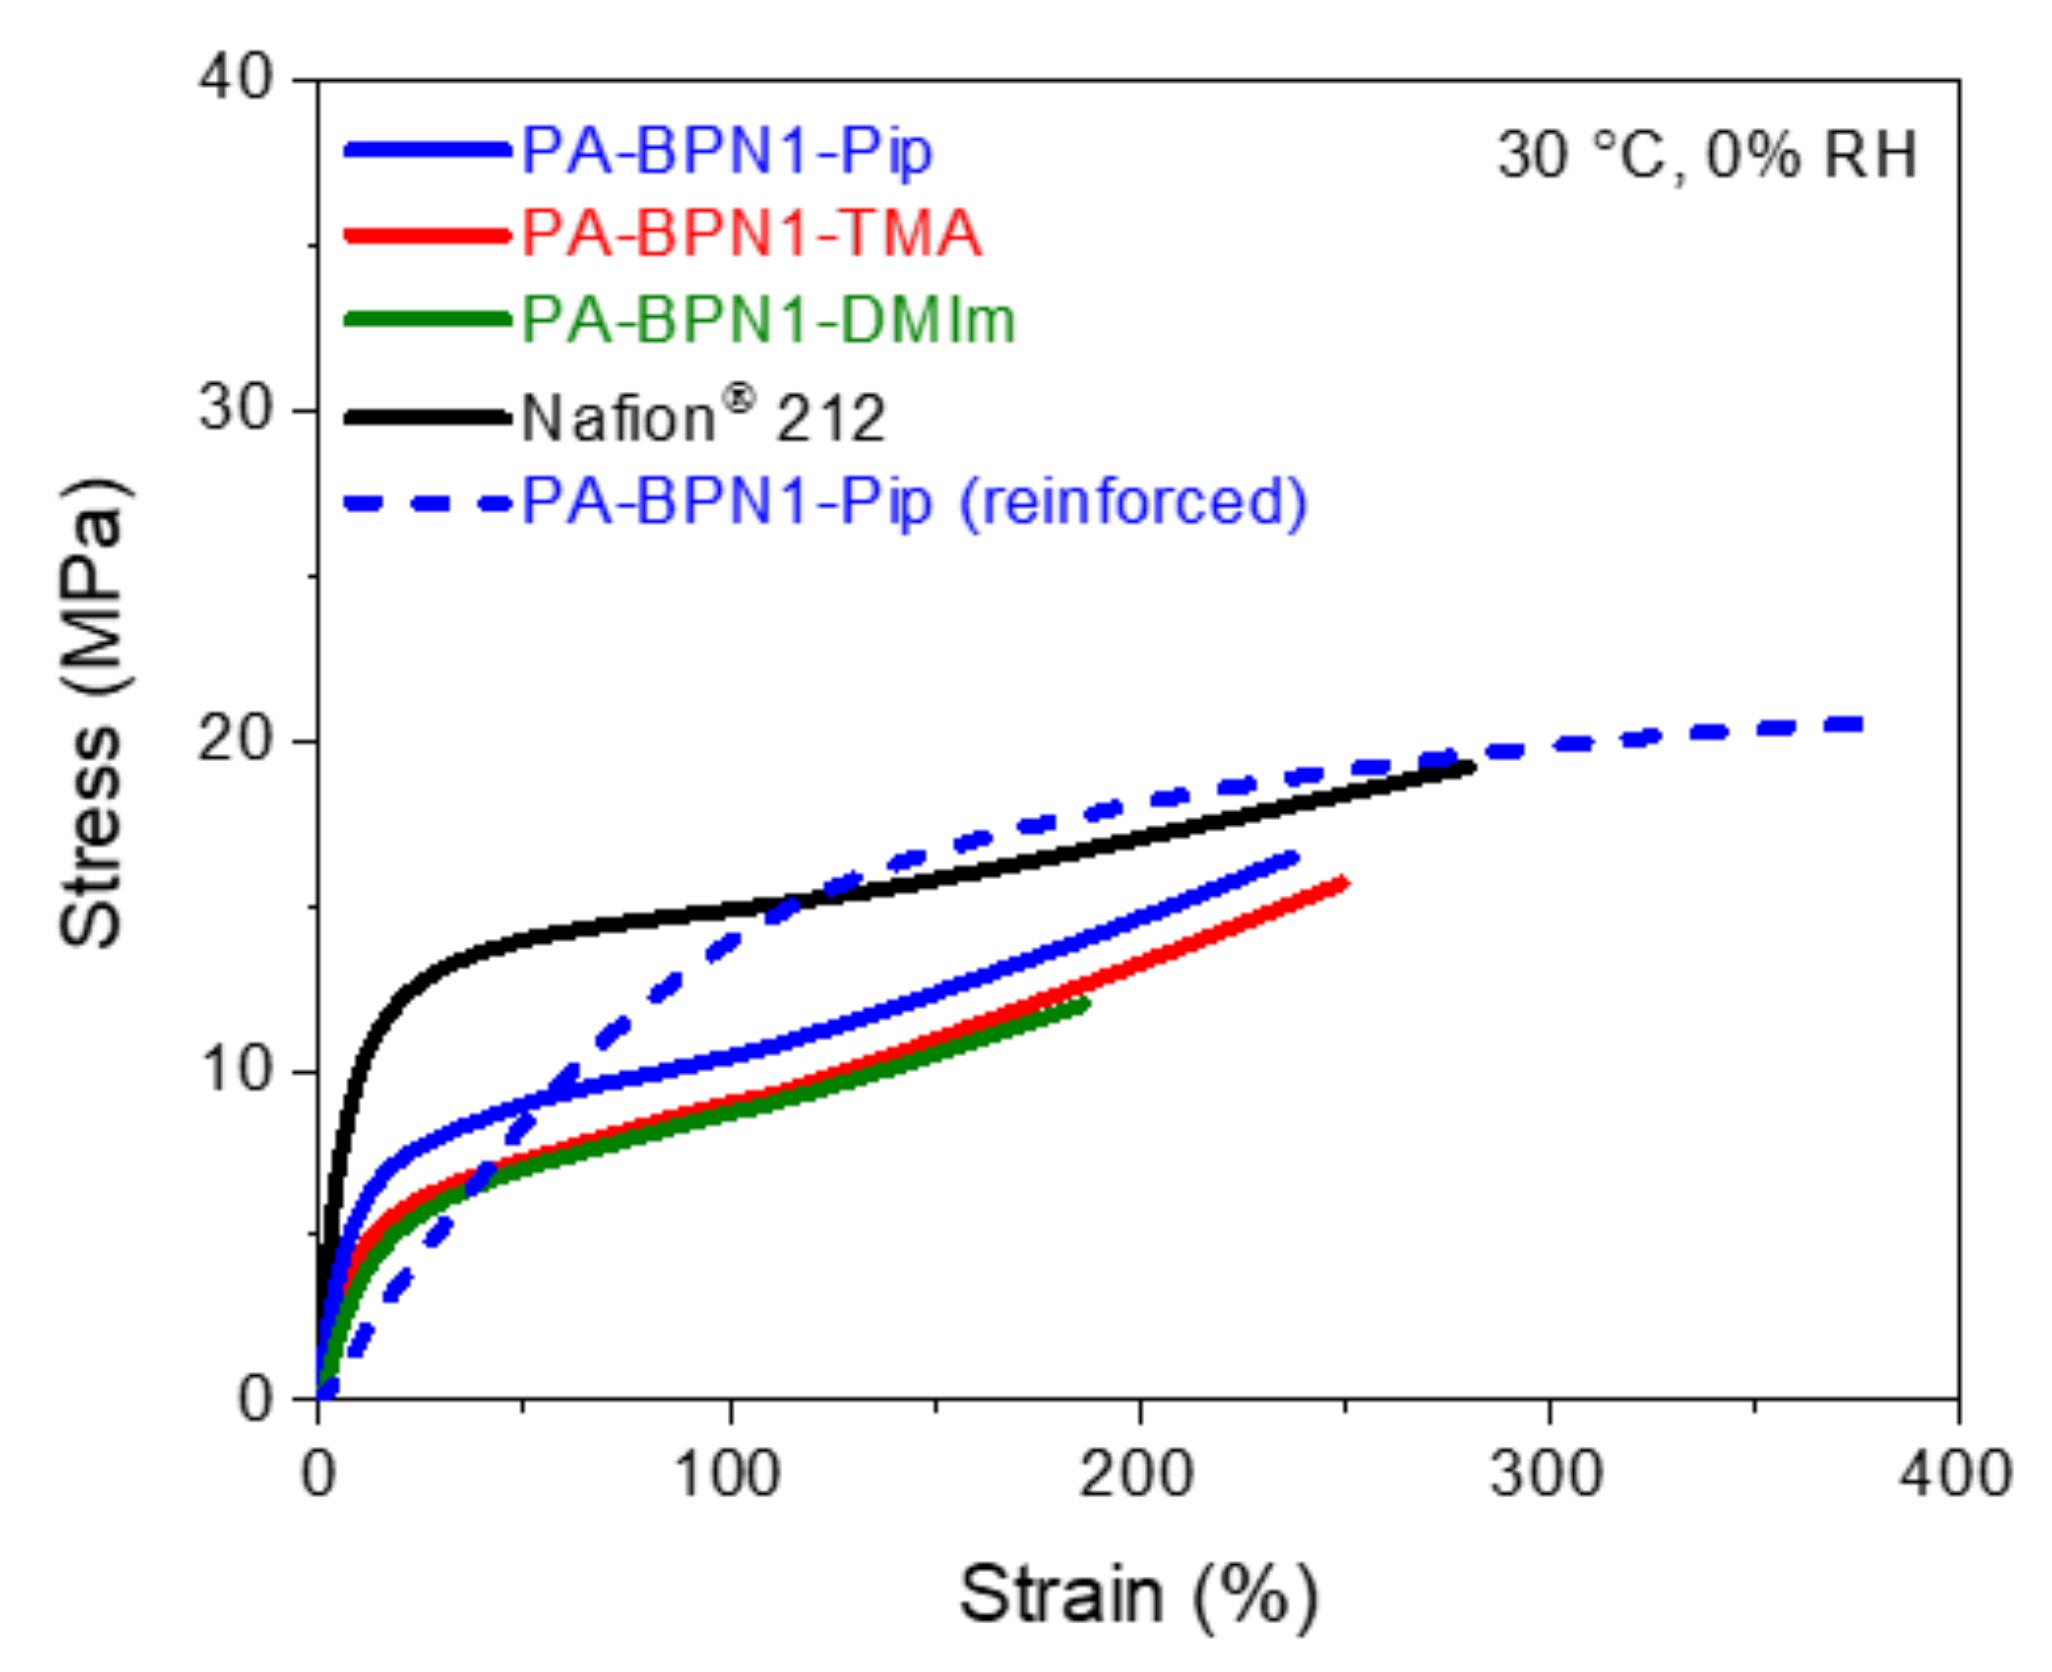
3.6. Mechanical Property

A desired PEM should maintain good mechanical properties especially when its device involves high pressure-gradient operation such as EHC. Many factors could influence a material’s mechanical property behaviors, including molecular weight, temperature, RH, plasticizers, etc. Since all polymer membranes in this work were prepared from the same BPBr-100 precursor polymer, the effect of polymer molecular weight should be excluded when comparing their mechanical properties. To evaluate mechanical property of our PEM materials, a stress-strain test was carried out at 30 °C and 0% RH for all PA-doped BPN1-QA membranes (Figure 7). For comparison, the stress-strain test results of undoped polymer membranes were plotted together. As shown in Figure 7a–c, the undoped BPN1-QA(Br) samples exhibited very high tensile strength with small elongation at break. This result is attributed to a combination of the rigid aromatic polymer backbone, high molecular weight, and anhydrous testing condition. Upon PA doping, however, those membranes became much more flexible. For example, PA-BPN1-Pip showed 16 times higher elongation at break than undoped BPN1-Pip(Br) (240% vs. 15%, Figure 7b), while its tensile strength decreased from 75 to 17 MPa. The dramatic change in stress-strain behaviors before and after PA doping is a typical phenomenon of plasticization caused by the doped PA molecules. By acting as a small molecule plasticizer, the doped PA molecules inside the membranes allow polymer chains to move more freely. Hence, PA doping not only greatly enhances proton conductivity but also dramatically changes the mechanical properties of PEMs. Please note that as water molecules can also function as a plasticizer, the stress-strain curves of Figure 7a–c under 0% RH condition solely reflect the plasticization effect of doped PAs. Figure 7d illustrates the stress-strain curves of commercial PEM Nafion® 212 under 0% and 90% RH at 30 °C. As Nafion® 212 has a flexible polymer backbone, it is ductile even at 0% RH. Due to well-interconnected nano-structure morphology where water molecules are confined within hydrophilic domains, Nafion® 212 did not show a significant plasticization effect even at 90% RH. As shown in Figure 8, PA-BPN1-QA PEMs exhibited comparable stress-strain behaviors with Nafion® 212. When PA-BPN1-Pip was reinforced with a microporous polyethylene mesh, the pore-filled composite membrane showed much higher elongation at break (nearly 400%; dashed line in Figure 8), suggesting that reinforcement technology can be used to further enhance material toughness, when necessary, to better fulfill the requirement of electrochemical devices.

4. Conclusions

Biphenyl-based ionic polymers bearing three different QA cations (i.e., TMA, Pip, DMIm) were synthesized, ion-exchanged, and doped with PA to prepare ion-pair coordinated PEMs. The resulting PA-BPN1-QA PEMs were systematically characterized in terms of chemical structure, PA doping level, thermal stability, proton conductivity, RH tolerance, and mechanical properties. The PA doping levels of PA-BPN1-QA polymers were within a range of 6–8. The size and structure of QA groups were found to affect the final PA doping levels by a mechanism similar to dictating the water uptake of QA polymer membranes. Proton conductivity was studied at 80 °C as a function of RH from 5% to 95% with four successive ramps. Unlike PA-PBI PEM, whose conductivity dropped dramatically after the 1st RH ramp, PA-BPN1-QA PEMs demonstrated more consistent conductivity at each ramp due to the strong ion-pair interaction. A 10-h conductivity stability test indicates that they are capable of tolerating moisture as high as 70% RH at 80 °C without loss of ion-paired PAs and drop in proton conductivity. PA doping significantly changed the mechanical properties of polymer membranes and made them more ductile as a result of the plasticization effect. Membrane toughness can be further enhanced by means of reinforcement. The research advance in this new class of ion-pair coordinated PEMs suggests that they offer a great potential for use as low RH PEMs in electrochemical energy conversion applications such as PEMFCs and EHC. Future work focused on the study of membrane properties (e.g., proton conductivity, RH tolerance, stress–strain behaviors, etc.) at higher temperatures (e.g., 120–180 °C) and different RHs and their performance as PEMs in electrochemical devices will be published elsewhere.

Author Contributions

Conceptualization, D.T., T.G. and C.B.; methodology, D.T., T.G. and C.B.; investigation, D.T. and S.N.Y.; formal analysis, D.T. and C.B.; resources, T.G. and C.B.; data collection, D.T. and S.N.Y.; writing—original draft preparation, D.T.; writing—review and editing, T.G. and C.B.; visualization, D.T.; supervision, T.G. and C.B.; funding acquisition, T.G. and C.B. All authors have read and agreed to the published version of the manuscript.

Funding

This research was funded by US Department of Energy SBIR-STTR program, DE-SC0018456.

Conflicts of Interest

The authors declare no conflict of interest.

References

  1. Abas, N.; Kalair, A.; Khan, N. Review of fossil fuels and future energy technologies. Futures 2015, 69, 31–49. [Google Scholar] [CrossRef]
  2. Panwar, N.L.; Kaushik, S.C.; Kothari, S. Role of renewable energy sources in environmental protection: A review. Renew. Sustain. Energy Rev. 2011, 15, 1513–1524. [Google Scholar] [CrossRef]
  3. Moriarty, P.; Honnery, D. What is the global potential for renewable energy? Renew. Sustain. Energy Rev. 2012, 16, 244–252. [Google Scholar] [CrossRef]
  4. Lund, H. Renewable energy strategies for sustainable development. Energy 2007, 32, 912–919. [Google Scholar] [CrossRef] [Green Version]
  5. Amrouche, S.O.; Rekioua, D.; Rekioua, T.; Bacha, S. Overview of energy storage in renewable energy systems. Int. J. Hydrogen Energy 2016, 41, 20914–20927. [Google Scholar] [CrossRef]
  6. Gottesfeld, S.; Dekel, D.R.; Page, M.; Bae, C.; Yan, Y.S.; Zelenay, P.; Kim, Y.S. Anion exchange membrane fuel cells: Current status and remaining challenges. J. Power Sources 2018, 375, 170–184. [Google Scholar] [CrossRef]
  7. Kraytsberg, A.; Ein-Eli, Y. Review of advanced materials for proton exchange membrane fuel cells. Energy Fuels 2014, 28, 7303–7330. [Google Scholar] [CrossRef]
  8. Chalk, S.G.; Miller, J.E. Key challenges and recent progress in batteries, fuel cells, and hydrogen storage for clean energy systems. J. Power Sources 2006, 159, 73–80. [Google Scholar] [CrossRef]
  9. Wang, R.; Mujahid, M.; Duan, Y.; Wang, Z.K.; Xue, J.J.; Yang, Y. A review of perovskites solar cell stability. Adv. Funct. Mater. 2019, 29, 1808843. [Google Scholar] [CrossRef]
  10. Lee, T.D.; Ebong, A.U. A review of thin film solar cell technologies and challenges. Renew. Sustain. Energy Rev. 2017, 70, 1286–1297. [Google Scholar] [CrossRef]
  11. Mustapa, M.A.; Yaakob, O.B.; Ahmed, Y.M.; Rheem, C.K.; Koh, K.K.; Adnan, F.A. Wave energy device and breakwater integration: A review. Renew. Sustain. Energy Rev. 2017, 77, 43–58. [Google Scholar] [CrossRef]
  12. Kumar, Y.; Ringenberg, J.; Depuru, S.S.; Devabhaktuni, V.K.; Lee, J.W.; Nikolaidis, E.; Andersen, B.; Afjeh, A. Wind energy: Trends and enabling technologies. Renew. Sustain. Energy Rev. 2016, 53, 209–224. [Google Scholar] [CrossRef]
  13. Eppinger, J.; Huang, K.-W. Formic acid as a hydrogen energy carrier. ACS Energy Lett. 2016, 2, 188–195. [Google Scholar] [CrossRef] [Green Version]
  14. Grigoriev, S.A.; Shtatniy, I.G.; Millet, P.; Porembsky, V.I.; Fateev, V.N. Description and characterization of an electrochemical hydrogen compressor/concentrator based on solid polymer electrolyte technology. Int. J. Hydrogen Energy 2011, 36, 4148–4155. [Google Scholar] [CrossRef]
  15. Rohland, B.; Eberle, K.; Strobel, R.; Scholta, J.; Garche, J. Electrochemical hydrogen compressor. Electrochim. Acta 1998, 43, 3841–3846. [Google Scholar] [CrossRef]
  16. Nordio, M.; Rizzi, F.; Manzolini, G.; Mulder, M.; Raymakers, L.; Annaland, M.V.; Gallucci, F. Experimental and modelling study of an electrochemical hydrogen compressor. Chem. Eng. J. 2019, 369, 432–442. [Google Scholar] [CrossRef]
  17. Strobel, R.; Oszcipok, M.; Fasil, M.; Rohland, B.; Jorissen, L.; Garche, J. The compression of hydrogen in an electrochemical cell based on a PE fuel cell design. J. Power Sources 2002, 105, 208–215. [Google Scholar] [CrossRef]
  18. Bouwman, P. Electrochemical hydrogen compression (EHC) solutions for hydrogen infrastructure. Fuel Cells Bull. 2014, 2014, 12–16. [Google Scholar] [CrossRef]
  19. Wainright, J.; Wang, J.T.; Weng, D.; Savinell, R.; Litt, M. Acid-doped polybenzimidazoles: A new polymer electrolyte. J. Electrochem. Soc. 1995, 142, L121–L123. [Google Scholar] [CrossRef]
  20. Qingfeng, L.; Hjuler, H.A.; Bjerrum, N. Phosphoric acid doped polybenzimidazole membranes: Physiochemical characterization and fuel cell applications. J. Appl. Electrochem. 2001, 31, 773–779. [Google Scholar] [CrossRef]
  21. Xiao, L.X.; Zhang, H.F.; Scanlon, E.; Ramanathan, L.S.; Choe, E.W.; Rogers, D.; Apple, T.; Benicewicz, B.C. High-temperature polybenzimidazole fuel cell membranes via a sol-gel process. Chem. Mater. 2005, 17, 5328–5333. [Google Scholar] [CrossRef]
  22. Özdemir, Y.; Üregen, N.; Devrim, Y. Polybenzimidazole based nanocomposite membranes with enhanced proton conductivity for high temperature PEM fuel cells. Int. J. Hydrogen Energy 2017, 42, 2648–2657. [Google Scholar] [CrossRef]
  23. Mustarelli, P.; Quartarone, E.; Grandi, S.; Carollo, A.; Magistris, A. Polybenzimidazole-based membranes as a real alternative to nafion for fuel cells operating at low temperature. Adv. Mater. 2008, 20, 1339–1343. [Google Scholar] [CrossRef]
  24. Lee, K.S.; Spendelow, J.S.; Choe, Y.K.; Fujimoto, C.; Kim, Y.S. An operationally flexible fuel cell based on quaternary ammonium-biphosphate ion pairs. Nat. Energy 2016, 1, 16120. [Google Scholar] [CrossRef]
  25. Lee, W.H.; Kim, Y.S.; Bae, C. Robust hydroxide ion conducting poly (biphenyl alkylene) s for alkaline fuel cell membranes. Acs Macro. Lett. 2015, 4, 814–818. [Google Scholar] [CrossRef]
  26. Li, Q.; He, R.; Jensen, J.O.; Bjerrum, N.J. PBI-based polymer membranes for high temperature fuel cells-preparation, characterization and fuel cell demonstration. Fuel Cells 2004, 4, 147–159. [Google Scholar] [CrossRef]
  27. Mack, F.; Heissler, S.; Laukenmann, R.; Zeis, R. Phosphoric acid distribution and its impact on the performance of polybenzimidazole membranes. J. Power Sources 2014, 270, 627–633. [Google Scholar] [CrossRef]
  28. Escorihuela, J.; Sahuquillo, Ó.; García-Bernabé, A.; Giménez, E.; Compañ, V. Phosphoric acid doped polybenzimidazole (PBI)/zeolitic imidazolate framework composite membranes with significantly enhanced proton conductivity under low humidity conditions. Nanomaterials 2018, 8, 775. [Google Scholar] [CrossRef] [Green Version]
  29. He, R.; Li, Q.; Xiao, G.; Bjerrum, N.J. Proton conductivity of phosphoric acid doped polybenzimidazole and its composites with inorganic proton conductors. J. Membr. Sci. 2003, 226, 169–184. [Google Scholar] [CrossRef]
  30. Lee, A.S.; Choe, Y.K.; Matanovic, I.; Kim, Y.S. The energetics of phosphoric acid interactions reveals a new acid loss mechanism. J. Mater Chem. A 2019, 7, 9867–9876. [Google Scholar] [CrossRef]
Figure 1. Synthetic scheme of PA-doped QA-phosphate ion-pair polymers (PA-BPN1-QA): PA-BPN1-TMA, PA-BPN1-Pip, and PA-BPN1-DMIm.
Energies 13 01924 g001
Figure 2. 1H NMR spectra of (a) BPBr-100; (b) BPN1-TMA(Br); (c) BPN1-Pip(Br); and (d) BPN1-DMIm(Br).
Energies 13 01924 g002
Figure 3. Thermogravimetric analysis (TGA) curves of (a) BPN1-TMA(Br) and PA-BPN1-TMA; and (b) PA-BPN1-TMA, PA-BPN1-Pip and PA-BPN1-DMIm.
Energies 13 01924 g003
Figure 4. In-plane proton conductivity of (a) PA-BPN1-TMA; (b) PA-BPN1-Pip; and (c) PA-BPN1-DMIm at 80 °C under four successive relative humidity (RH) ramps ranging from 5% to 95%.
Energies 13 01924 g004
Figure 5. (a) Literature reported proton conductivity data of phosphoric acid-doped polybenzimidazole (PA-PBI) under successive RH ramps at 80 °C [24]; and (b) comparison of proton conductivities of the 3rd RH ramps of PA-BPN1-TMA, PA-BPN1-Pip, PA-BPN1-DMIm, PA-PBI, and the 1st RH ramp of Nafion® 212 as a function of RH at 80 °C.
Energies 13 01924 g005
Figure 6. Conductivity durability tests of (a) PA-BPN1-TMA; (b) PA-BPN1-Pip; (c) PA-BPN1-DMIm; and (d) the percentage of remaining conductivity after holding samples at 80 °C under 70% RH, 80% RH and 90% RH, respectively, for 10 h.
Energies 13 01924 g006
Figure 7. Stress-strain curves of (a) BPN1-TMA; (b) BPN1-Pip; (c) BPN1-DMIm; and (d) Nafion®212.
Energies 13 01924 g007
Figure 8. Comparison of stress-strain curves of PA-BPN1-TMA, PA-BPN1-Pip, PA-BPN1-DMIm, Nafion® 212, and polyethylene-reinforced PA-BPN1-Pip obtained at 30 °C and 0% RH.
Energies 13 01924 g008
Table 1. PA doping level and water content of PA-BPN1-QA polymers.
Polymer NamePA Doping Level 1Water Content (wt. %) 2
PA-BPN1-TMA7.4 ± 0.211.4 ± 1.9
PA-BPN1-Pip6.0 ± 1.08.5 ± 1.5
PA-BPN1-DMIm7.7 ± 0.512.9 ± 2.4
1 PA doping level is defined as an average number of PA molecules per QA cation group in PA-BPN1-QA polymers. Error bars were generated by 95% confidence level of t-test. 2 Water content is the weight percent of water in PA-BPN1-QA polymers. Error bars were generated by 95% confidence level of t-test.
Table 2. Ion exchange capacity (IEC), hydration number, and water uptake of BPN1-QA(OH) polymers.
Polymer NameIon Exchange Capacity (IEC, in mmol/g) 1Hydration Number 2Water Uptake
(wt.%) 3
BPN1-TMA(OH)2.6319 ± 189 ± 6
BPN1-Pip(OH)2.3915 ± 164 ± 4
BPN1-DMIm(OH)2.4023 ± 198 ± 5
1 Experimental IEC measured by 1H NMR spectra of polymers. 2 Hydration number is defined as an average number of water molecules per QA cation group for fully hydrated membrane. Error bars were generated by 95% confidence level of t-test. 3 Water uptake is defined as the weight percent of water absorbed compared to the dry membrane mass. The measurement was done using membrane in hydroxide form at room temperature. Error bars were generated by 95% confidence level of t-test.

