Article

Life Cycle Sustainability Assessment of the Spanish Electricity: Past, Present and Future Projections

by
Guillermo San Miguel
* and
María Cerrato
Department of Chemical and Environmental Engineering, ETSII, Grupo de Agroenergética, C/José Gutiérrez Abascal, 2, Universidad Politécnica de Madrid, 28006 Madrid, Spain
*
Author to whom correspondence should be addressed.
Energies 2020, 13(8), 1896; https://doi.org/10.3390/en13081896
Submission received: 4 March 2020 / Revised: 6 April 2020 / Accepted: 10 April 2020 / Published: 13 April 2020
(This article belongs to the Special Issue Life Cycle Assessment of Energy Systems)

Abstract

:
This paper provides an investigation into the sustainability of the electrical system in Spain. The analysis covers historic inventories of power generation, installed capacity and technology mix since 1990 and also contemplates four alternative projections for 2030 and 2050. The sustainability is evaluated using eight indicators that provide objective information about the environmental (climate change, fossil depletion, ozone layer depletion, terrestrial acidification, human toxicity and photochemical smog), economic (levelized cost of electricity) and socio-economic (direct employment) performance of the system. The results show an increase in the magnitude of the environmental impacts between 1990 and 2008, due to a growing power demand triggered by economic expansion. After 2008, the environmental performance improves due to the economic recession and the penetration of renewable energies. Overall, the cost of power generation remains rather stable as rising expenses generated by renewables are compensated by a progressive reduction in the cost of fossil technologies. Direct employment generation has been strongly stimulated by the upsurge in renewables that has taken place in Spain after 2008. Regarding future scenarios, the results evidence that the most ambitious projections in terms of renewable penetration perform best in terms of environmental performance, employment generation and reduced costs (€/MWh). The significance of these benefits was particularly clear in the 2050 scenario. In the long term, the scenario considering higher fossil fuel contributions (ST) performed worst in all sustainability indicators.

1. Introduction

Electricity is regarded as a fundamental commodity in modern societies. The availability of this energy vector is inextricably associated with economic prosperity, social progress and human development [1]. It is in this spirit that access to electricity has been incorporated into the Sustainable Development Goals (SDGs) (see Goal 7: Affordable and clean energy) defined under the much-acclaimed United Nations (UN) Agenda 2030 [2].
However, the deployment, operation and decommissioning of the infrastructures required to provide this essential service may generate substantial impacts (both positive or negative) on the sustainability of the natural and human environment. For instance, the industrial and commercial activity associated with the life cycle of a power plant (construction, operation, extraction and processing of fuels, decommissioning) will surely contribute to economic growth and job creation [3,4]. These actions will also be responsible for the deterioration of the surrounding environment, the magnitude of which would depend primarily on the generation technologies employed and the overall demand. These detrimental effects would be observed in impact categories such as global warming, acidification, toxicity and consumption of natural resources, to name a few. The nature and extent of these types of impact largely depend on the type of generation technology and energy source utilized [5,6,7].
Most countries around the world are currently involved in a profound transformation of their electricity systems. Over the last decade, Spain has been adapting to the requirements set by the European Union (EU) under the Renewable Energy Directive 2009/28/EC [8] and also to the responsibilities agreed to in the ongoing EU climate action plans [9]. In this context, the targets set under the 2020 Climate And Energy Package have given way to the more ambitious 2030 Climate and Energy Framework whose objectives include a 40% cut in greenhouse gas emissions (from 1990 levels), a 32% share for renewable energy and a 32.5% improvement in energy efficiency. The long-term European strategy for this transition is gradually starting to come to light in documents like A Clean Planet for All [10].
This transition towards a reduction in the use of fossil fuels and the promotion of local renewable energy sources has environmental, economic and geostrategic roots. The main environmental driver is the need to reduce greenhouse gas emissions (GHG) so as to avoid irreversible changes in the Earth’s climate [11]. The uncertainty associated with the volatility of fossil fuel prices and the benefits from the opportunities generated by a progressive reduction in the cost of renewable energies are the two main economic drivers of such plan. This is reinforced by political instability of major producers of fossil resources (e.g., Venezuela, Persian Gulf and Arabian Peninsula, etc.) and the strategic inconveniences of energy dependency [12].
These changes in the total output and configuration of the electricity systems determine not only their environmental sustainability but also their socio-economic and economic performance. All these aspects need to be evaluated in order to understand the true consequences that these changes may bring about, so that positive aspects may be maximized while negative impacts may be prevented, attenuated or compensated. Historic assessments provide a perspective on time as to the evolution of indicators, identifying trends which contextualize the present situation and the future scenarios.
The sustainability of electricity sectors has been carried out in other countries including Mexico [13], United Kingdom [14], Australia [15], Mauritius [16] and Turkey [17]. These investigations vary in terms of the scope considered when evaluating sustainability (only environmental or including economic and social components) and also in terms of the time extension (past, present and future projections).
The main objective of this paper was to evaluate the sustainability of Spain’s electricity system. This assessment includes an investigation of historic data (since 1990) and future projections (2030 and 2050), which set a framework in which the current situation may be more adequately appraised. This transformation is evaluated on the basis of a series of indicators that describe the environmental, economic and socio-economic dimensions of the sustainability.

2. Methodology

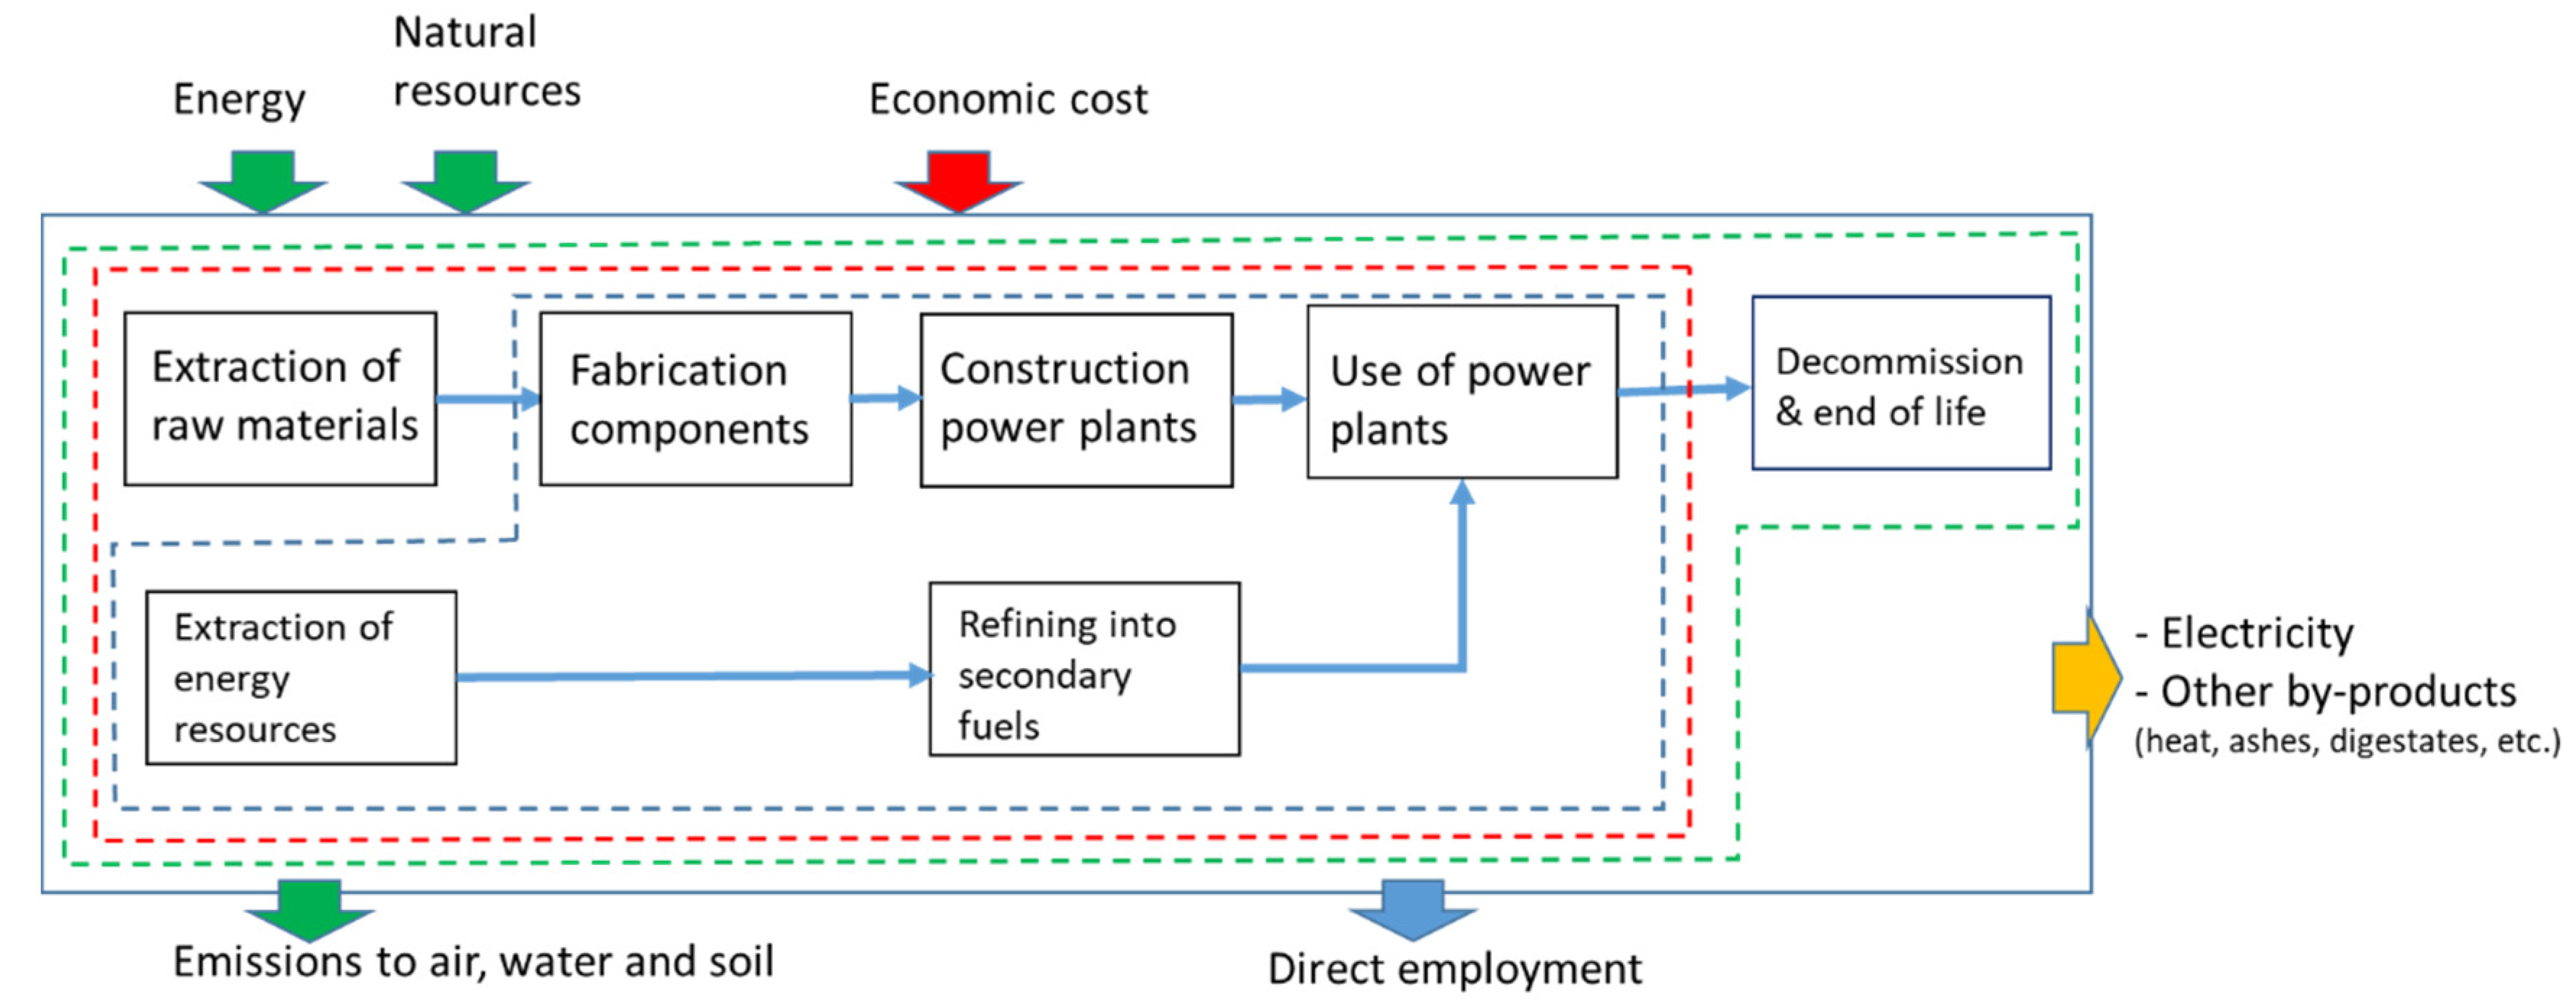
2.1. Life Cycle Assessment Methodology

The sustainability of the Spanish electricity system has been calculated using three methodologies based on a life cycle approach: attributional life cycle assessment (LCA) for the environmental dimension, levelized cost of electricity (LCOE) for the economic dimension and direct life cycle employment generation for the socio-economic dimension. Figure 1 illustrates the scope and system boundaries applied in each one of these methodologies, which varied primarily depending on the availability of inventory data. Thus, the boundaries considered for the environmental dimension included the whole life cycle of the system, as included in the ecoinvent datasets employed [18]. The boundaries for the economic dimension considered all direct costs except decommissioning and the end of life phase [19,20]. The boundaries for direct employment generation only considered fuel generation (where necessary), manufacture and power plant construction and operation [21].

2.2. Inventory Data of Installed Capacity, Electricity Generation and Technology Mix

The sustainability assessment of the electricity system was based on the quantification of indicators describing its life cycle performance on the environmental, economic and socio-economic dimensions. This required the collection of official information regarding installed capacity, power generation and technology mix for the time periods considered in the investigation (1990–2015 for historic analysis, and 2030 and 2050 for future projections).

2.2.1. Historic Electricity Data

The core of historic data for electricity generation, installed capacity and technology mix, covering the period 1990–2016, was extracted from La Energía en España, the official yearly report published by the Spanish Ministry for Energy, Tourism and Digital Agenda [22]. This information was validated and supplemented with additional data for 1960, 1970, 1980 and 1990 using updated statistics from Red Eléctrica Española (REE, the Spanish electricity system operator) and the International Energy Agency (IEA) [23,24]. Owing to the higher uncertainty associated with older generation technologies and their environmental, economic and socio-economic impacts, only the period 2000–2016 was evaluated for sustainability. Figure 2 illustrates this historic transformation in the Spanish electricity system in terms of electricity generation (GWh), generation per capita (MWh/capita) and technology mix for the period 1960–2016, and Figure 3 shows the same information for installed capacity for the period 2000–2016 (this parameter was not available for earlier years). The power generation technologies considered in this investigation are those listed in REE [23] and IEA [24] statistics as follows: Concentration Solar Power (CSP), Photovoltaic (PV), Wind, Hydropower (Hydro), Biomass, Nuclear, Oil, Natural gas and Coal. When different technological varieties are available for a given energy resource (e.g., natural gas in the form of combined cycles or CHP gas turbine, or wind in the form of off-shore and on-shore), the analysis is based on a weighted representation of the Spanish situation during the time period considered.
Generation values refer to gross power output, including electricity losses due to power transmission, distribution and other system inefficiencies. Due to its limited contribution, this investigation does not consider electricity imports and exports from Spain, which for the periods considered, accounted for between 2–3% of the power consumed nationally [22]. This investigation covers only power generation systems, overlooking other elements (e.g., storage, transformation, transmission, grid control) that may be essential in future electricity systems, particularly those with a strong dependence on renewables.
As shown in Figure 2, the commercial electrification of Spain commenced in the 1950s and 1960s with the development of the first large-scale hydroelectric projects. This was followed by a rapid expansion in the electricity sector between 1960 (18,615 GWh) and 2000 (300,777 GW/h), which was supported by the incorporation of oil, coal and also nuclear power to the technology mix. This electrification period was driven by the economic growth that followed the political transition into democracy in 1975 and the opening of the national markets that was culminated with the incorporation of Spain into the European Union in 1986. During this period, Spain developed most of its hydroelectric and nuclear capacity, which has remained rather stable up until the present (19.5 GW and 7.8 GW respectively by 2016).
After the year 2000, two different phases may be discerned. The first stage, between 2000 and 2008, is characterized by a progressive growth in power generation (35% increase from 225,000 GWh to 305,000 GWh) and, more notably, in installed capacity (91% increase from 51,000 MW to 97,500 MW) which aimed to provide stability to the national network. During this period, the technology mix was reinforced with a strong contribution of natural gas (both in terms of capacity and generation) and an incipient incorporation of renewables. The second stage, between 2008 and 2016, describes a less expansive and modernized economy where the power demand was rather stable or slightly decreasing due to the increase of sharing tertiary sector activities and the offshoring of energy intensive industrial activities. In terms of technology mix, that period sees a progressive expansion in the installed capacity and generation of renewables, primarily wind power (35% increase from 31,800 GWh to 48,900 GWh) and to a lesser extent PV (68.6% increase from 2500 GWh to 8000 GWh), CSP and biomass. Nuclear, oil and hydropower generation remained stable during that period, while coal and natural gas fluctuated to adapt to national strategies aimed at the promotion of national fuels (coal) and international commitments expected to tackle global warming [25,26].

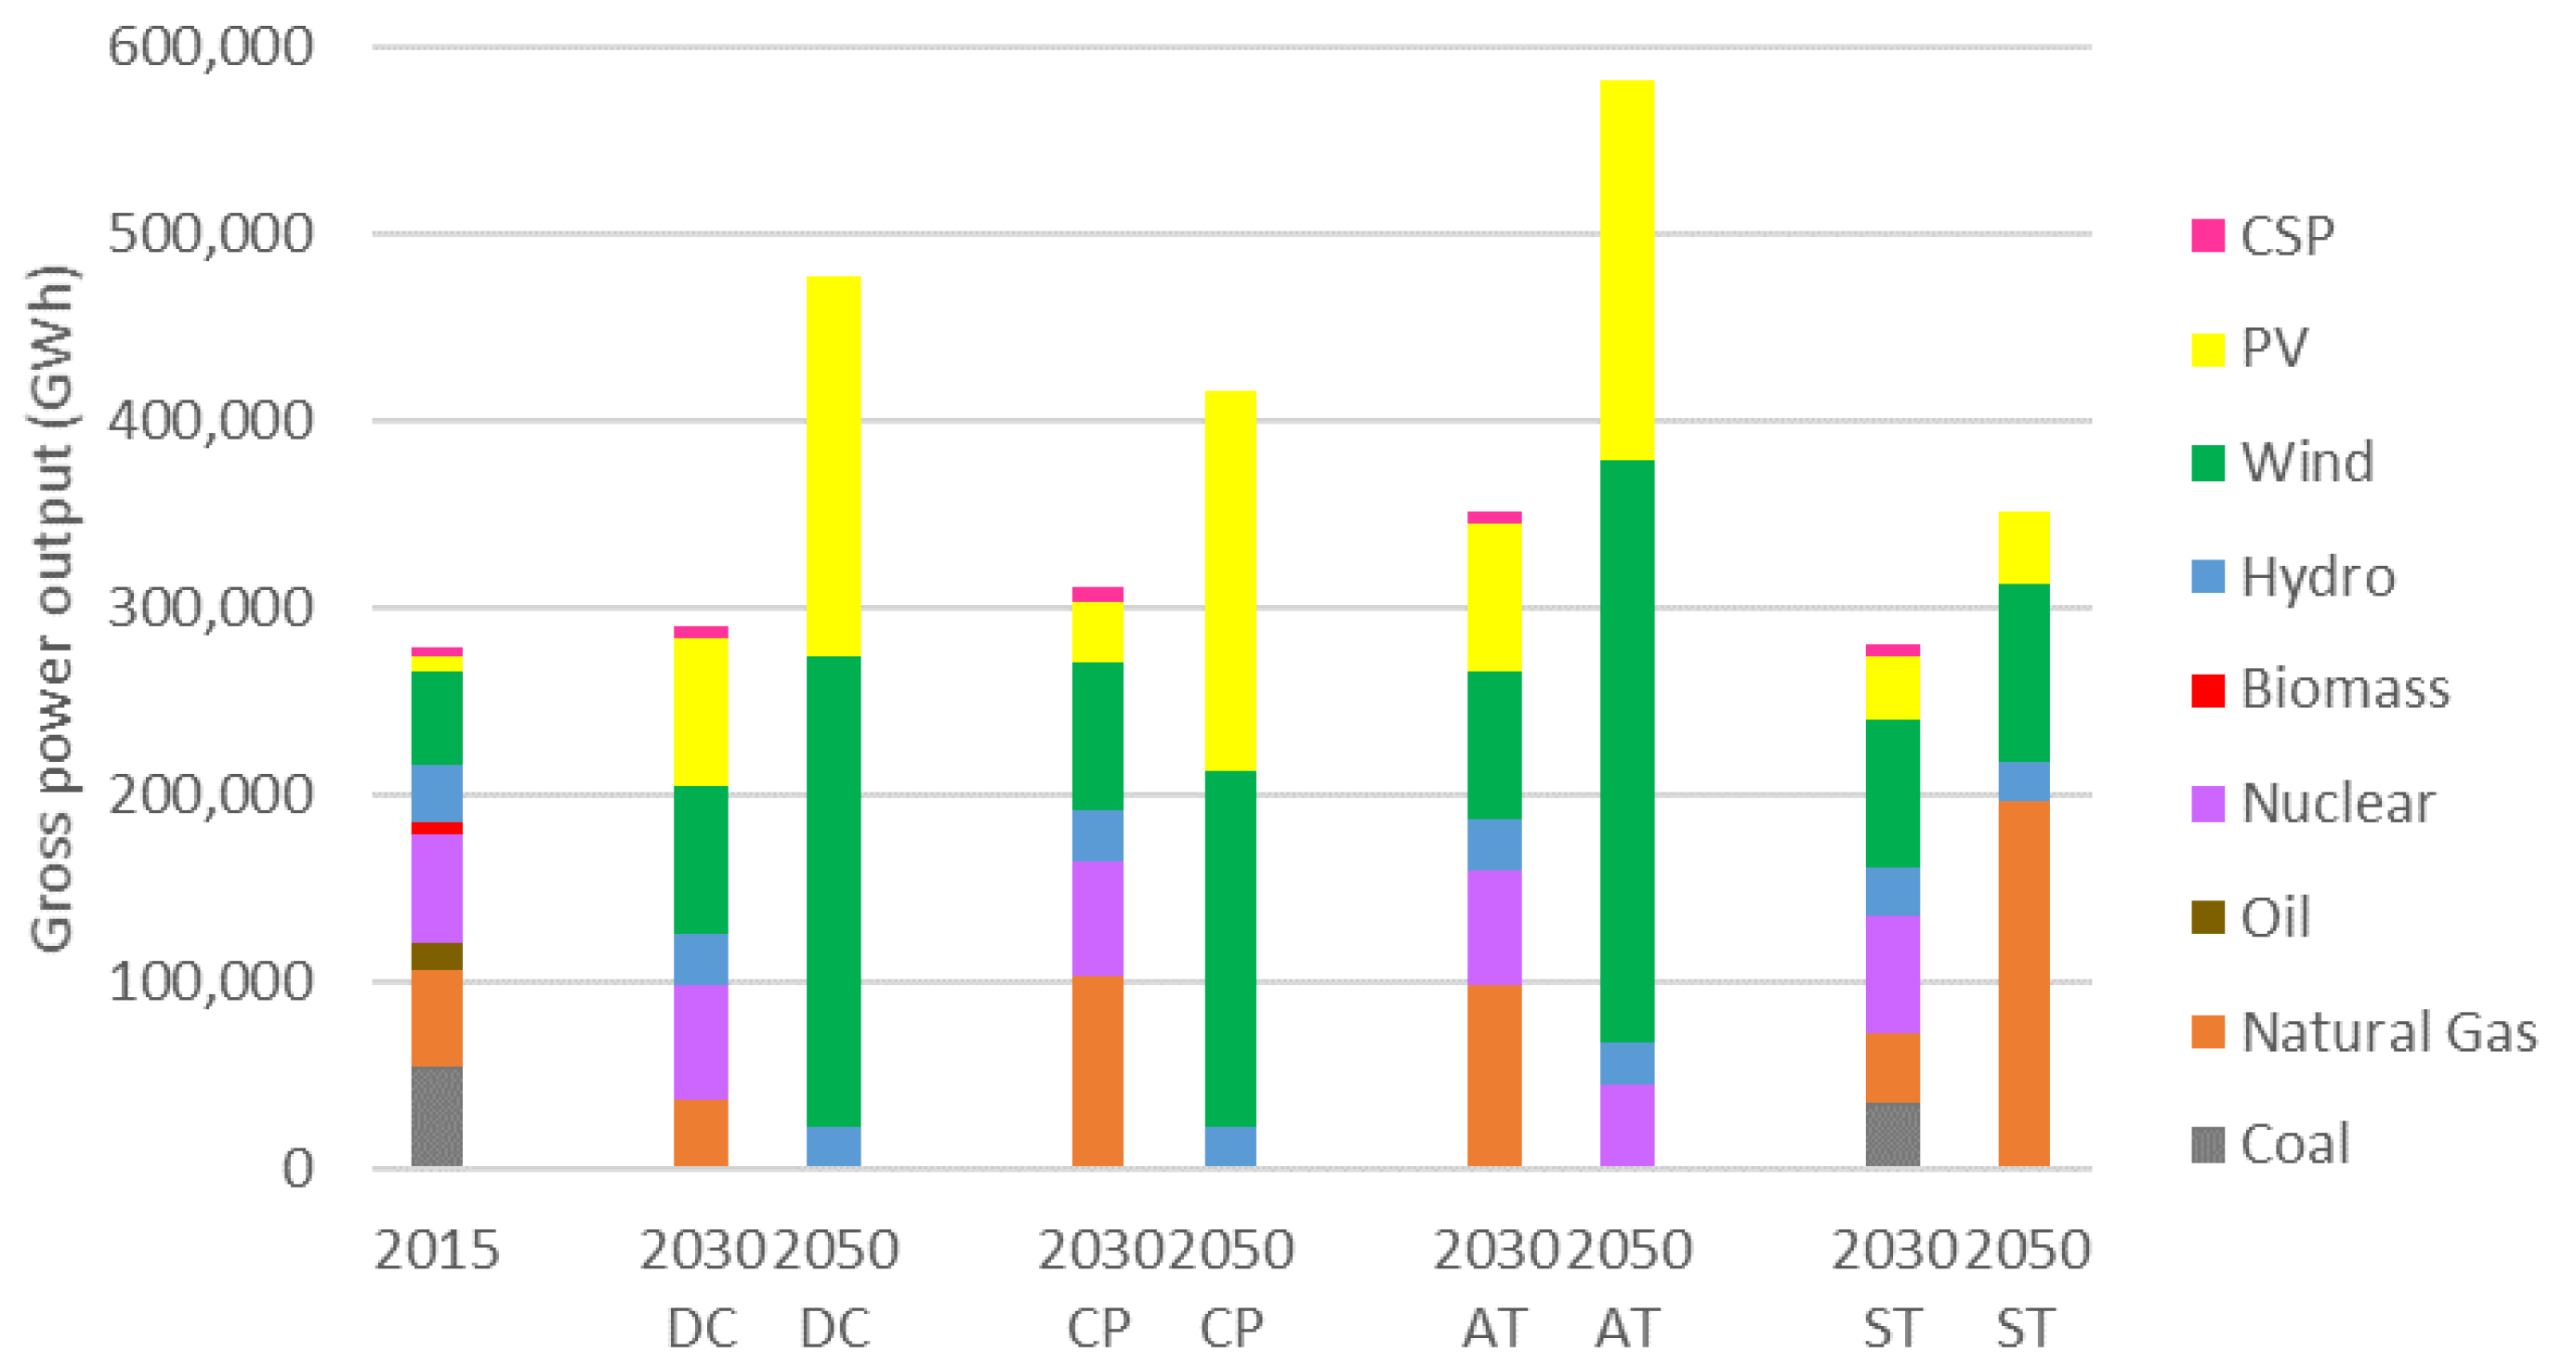
2.2.2. Future Projections

The electricity projections investigated in this paper were defined by the think tank Economics for Energy and published in a document titled Scenarios for the Energy Sector in Spain 2030–2050 [27]. This data was revised and validated in a subsequent document titled Analysis and Proposals for Decarbonisation, commissioned by the Spanish Government and produced by the Commission of Experts on Energy Transition [28] The scenarios proposed incorporated the national objectives set under the Spanish Renewable Energy Action Plan 2020 [29], the international commitments assimilated in the ensuing European 2030 Climate and Energy Framework and the European 2050 long-term strategy [9,10].
Table 1 describes the scenarios analysed for sustainability, which are cited throughout the paper as follows: decarbonisation (DC), current policies (CP), accelerated technical advance (AT) and stagnation (ST). Figure 4 and Figure 5 provides a graphical account in terms of power generation, installed capacity and technology mix.
The decarbonisation (DC) scenario assumes the implementation of ambitious strategies to confront climate change and achieve a 40% reduction in GHG by 2030 and a 95% one by 2050, according to the objectives set by Member States of the European Union [9,10]. As shown in Figure 4, the DC scenario assumes a small increase in overall power consumption by 2030, as well as a complete elimination of coal and oil, a continuation of nuclear power and a slight reduction of natural gas from the electricity mix. This scenario also considers a significant increase in power demand by 2050, which is covered entirely by renewable sources, primarily PV and wind (hydropower remains stable due to limitations in the availability of additional hydroelectric resources in Spain).
The current policies (CP) scenario assumes a linear evolution of international geopolitics concerning the use of renewables and restraints in the emission of GHG. This scenario considers complete elimination of coal and oil from the electricity mix by 2030, assuming that this is largely replaced by natural gas, which absorbs 33% of the demand. By 2050, the CP scenario describes complete coverage of power demand from renewables, for an overall generation that is 15% lower than that in the DC scenario. The CP scenario would not accomplish the 95% GHG cuts proposed by the European Commission by 2050 [10].
The accelerated technology advance (AT) scenario presumes a rapid reduction in the cost of technologies related to renewable energies, energy storage and electricity consumption, including a fast transition into the electrification of transport. As shown in Figure 2, this would result in higher power demands than observed in the other scenarios and higher penetration of renewables as well as an achievement of the targets set by the European Commission for emission of greenhouse gases. The projections for this scenario consider elimination of coal and oil by 2030, which is compensated by a sustenance of nuclear power and a notable growth in natural gas and renewables that represent 54.5% of the mix. The predicted high power demands require a large penetration of PV and wind, and the continuation of nuclear energy in 2050.
The stagnation (ST) scenario considers a limited economic growth throughout this period and a limited development of new energy technologies leading to a time extension in fossil fuel dependence. In this scenario, overall demand remains fairly stable up until 2030, with a limited penetration of renewables and a strong presence of fossil fuels. The ST scenario assumes a prevalence of natural gas in the electricity mix by 2050 and a limited expansion of renewables in the long term.

2.3. Sustainability Factors of Power Generation Technologies

The sustainability assessment carried out in this investigation relies on a series of emission, economic and employment factors defined for the life cycle of each of the generation technologies that compose the national electricity mix. This section describes the methodologies followed to define these factors.

2.3.1. Environmental Dimension

Environmental emissions associated with individual power generation technologies were extracted from Ecoinvent v3.1 [30]. The inventory data in these datasets cover the following life cycle stages: (i) extraction and processing of raw materials employed in the construction of power generation infrastructures, (ii) construction of power plants, end of life of construction materials, extraction and processing of fuels (where required); and (iii) operation of power plants and power transmission. When more than one dataset was available for any given technology, a weighted combination of the situation describing the Spanish electricity system was employed. Since no background data was available for CSP plants, and due to the fact that its contribution to the Spanish electricity system is limited (4.0% in 2015), the emissions associated with this technology were not considered.
Environmental impact assessment calculations were carried out using the ILCD 2011 Midpoint+ method [31], except for the human toxicity category for which the ReCiPe 2016 Midpoint (H) v1.03 method [18] was used. This latter method was favoured over ILCD in the human toxicity category as it provided an aggregated approach that included both cancerous and non-cancerous effects.
The environmental categories and the impact units considered in this investigation include the global impacts: climate change (kg CO2 eq), fossil depletion (kg oil eq) and ozone layer depletion (g CFC-11 eq), and the more locally focused human toxicity (kg 1.4 DB eq), terrestrial acidification (kg SO2 eq) and photochemical ozone formation (kg NMVOC eq).

2.3.2. Economic Dimension

The levelized cost of electricity (LCOE) was employed to evaluate the economic sustainability of the Spanish electricity. This indicator has a life cycle approach that is calculated by dividing the discounted cost of power generation (including investment, operation and maintenance, fuel expenditures and decommissioning) by the discounted rate of power generation, as shown in Equation (1):
L C O E   ( M W h )   =   d i s c o u n t e d   l i f e t i m e   c o s t s d i s c o u n t e d   p o w e r   g e n e r a t i o n   =   t   =   1 n I t   +   M t   +   F t ( 1   +   r ) t t   =   1 n E t ( 1   +   r ) t
where It, Mt and Ft represent investment, operations and maintenance and fuel expenditures in the year t, and Et represents the power generated in the same year t. The value r represents the discount rate assumed for the power generation project and n its expected lifetime.
The LCOE considered for each of the technologies considered in the Spanish electricity mix were obtained from the International Energy Agency [20] for scenarios prior to 2016. LCOE values were calculated assuming a discount rate of 7.0% and had a national specificity. In cases where this information was not available for Spain (e.g., coal, natural gas combined cycle and nuclear), the cost values were calculated as the average of those applicable to countries within the European Union. Additional information about other key parameters (e.g., technology type and lifetime, average capacity factors) employed to calculate the LCOE may be found in [20].
The future cost of power generation technologies is a matter of debate [32,33,34,35,36,37]. For the purpose of this investigation, a dynamic approach has been applied based on a series of factors applicable to the reference costs proposed by the International Energy Agency [20]. The transformation factors used for the period 2015–2030 were those proposed by [33] as follows: coal (−5.43%); natural gas (+46.02%); nuclear (+9.51%); hydro (−27.49%); wind (−54.30%); PV (−55.28%) and CSP (−56.95%). Reliable transformation factors for the period 2015–2050 were only available for wind (−69.93%) [34] and PV (−64.22%) [35], which are the most dominant technologies in all the 2050 scenarios (except for ST, which incorporates a high proportion of natural gas). In the absence of dependable data for other technologies, the costs assumed for nuclear, natural gas and hydro in 2050 were the same as in 2030. In view of past trends (increasing costs of fossil resources and reduced costs for renewables), these assumptions are likely to represent an underestimation in the cost of natural gas and nuclear power.
Figure 6 shows the LCOE applied to different power generation technologies in Spain, according to the procedures described in [20]. The figures show that CSP, waste incineration and biomass have the highest costs. The cost of renewables (wind, PV and hydro) is comparable to conventional fossil fuels and nuclear energy, with coal power being the cheapest. The cost of fossil technologies is dominated by the operation phase, due to the expenses associated with the extraction and processing of fuels, while the cost of renewables is dominated by the construction of the infrastructures allocated to the capital costs. Certain technologies (biomass, CHP, biogas) benefit from heat credits due to the combined generation of power and thermal energy. To avoid the results being affected by international currency policies, a fixed exchange rate was used to convert monetary data published by IEA from USD to Euro. The exchange rate considered was the average value for the core assessment dates (2010–2015) as reported by the European Central Bank at 1 USD = 0.77 €.
This economic analysis does not take into consideration external costs in the form of carbon taxes or carbon emission credits. The incorporation of these levies would be particularly detrimental to the economic interest of the scenarios with a higher contribution of fossil technologies.

2.3.3. Socio-Economic Dimension

The socio-economic performance of the power system in Spain was evaluated using the direct employment generated by the technologies participating in the electricity mix as the indicator. The methodology employed was published by the Institute for Sustainable Futures at the University of Technology Sydney (ISF-UTS) and follows a life cycle approach that takes into consideration four stages: extraction of raw materials and manufacturing of components; construction and installation of additional capacity; operation and maintenance of power plants; and extraction and refining of fuels (where necessary).
Data from the original report published in 2010 [38] was used to quantify employment in the Spanish electricity sector prior to 2010, data published in a subsequent update from 2012 [39] was used to quantify the period 2012–2013 and data from the latest report of 2016 was used to quantify the period 2014–2016. As technology becomes more mature, employment requirements decrease. The employment reduction factors proposed by [21] were used to quantify the situation in the projected scenarios of 2030 and 2050. This methodology takes into consideration the geographic location of the energy projects and time factors that account for expected deviations in future scenarios (due to learning curves and economy of scale). Figure 7 shows the employment factors used for the calculation of jobs in the Spanish electricity systems, as extracted from the references cited above.
The construction periods selected for different technologies in these calculations were as follows: 10 years for nuclear power plants, five years for coal, two years for natural gas, oil, biomass, hydroelectric, wind, CSP and combined heat and power (CHP), and one year for PV, as reported by [21].

3. Results and Discussion

This section describes the evolution in the sustainability indicators as calculated for the Spanish electricity system since 1990 and also for the alternative scenarios projected for 2030 and 2050. The year 2015 has been used as a reference for the current situation. As described above, the sustainability indicators cover three dimensions (environment, economic and socio-economic), which are structured into the following three sub-sections.

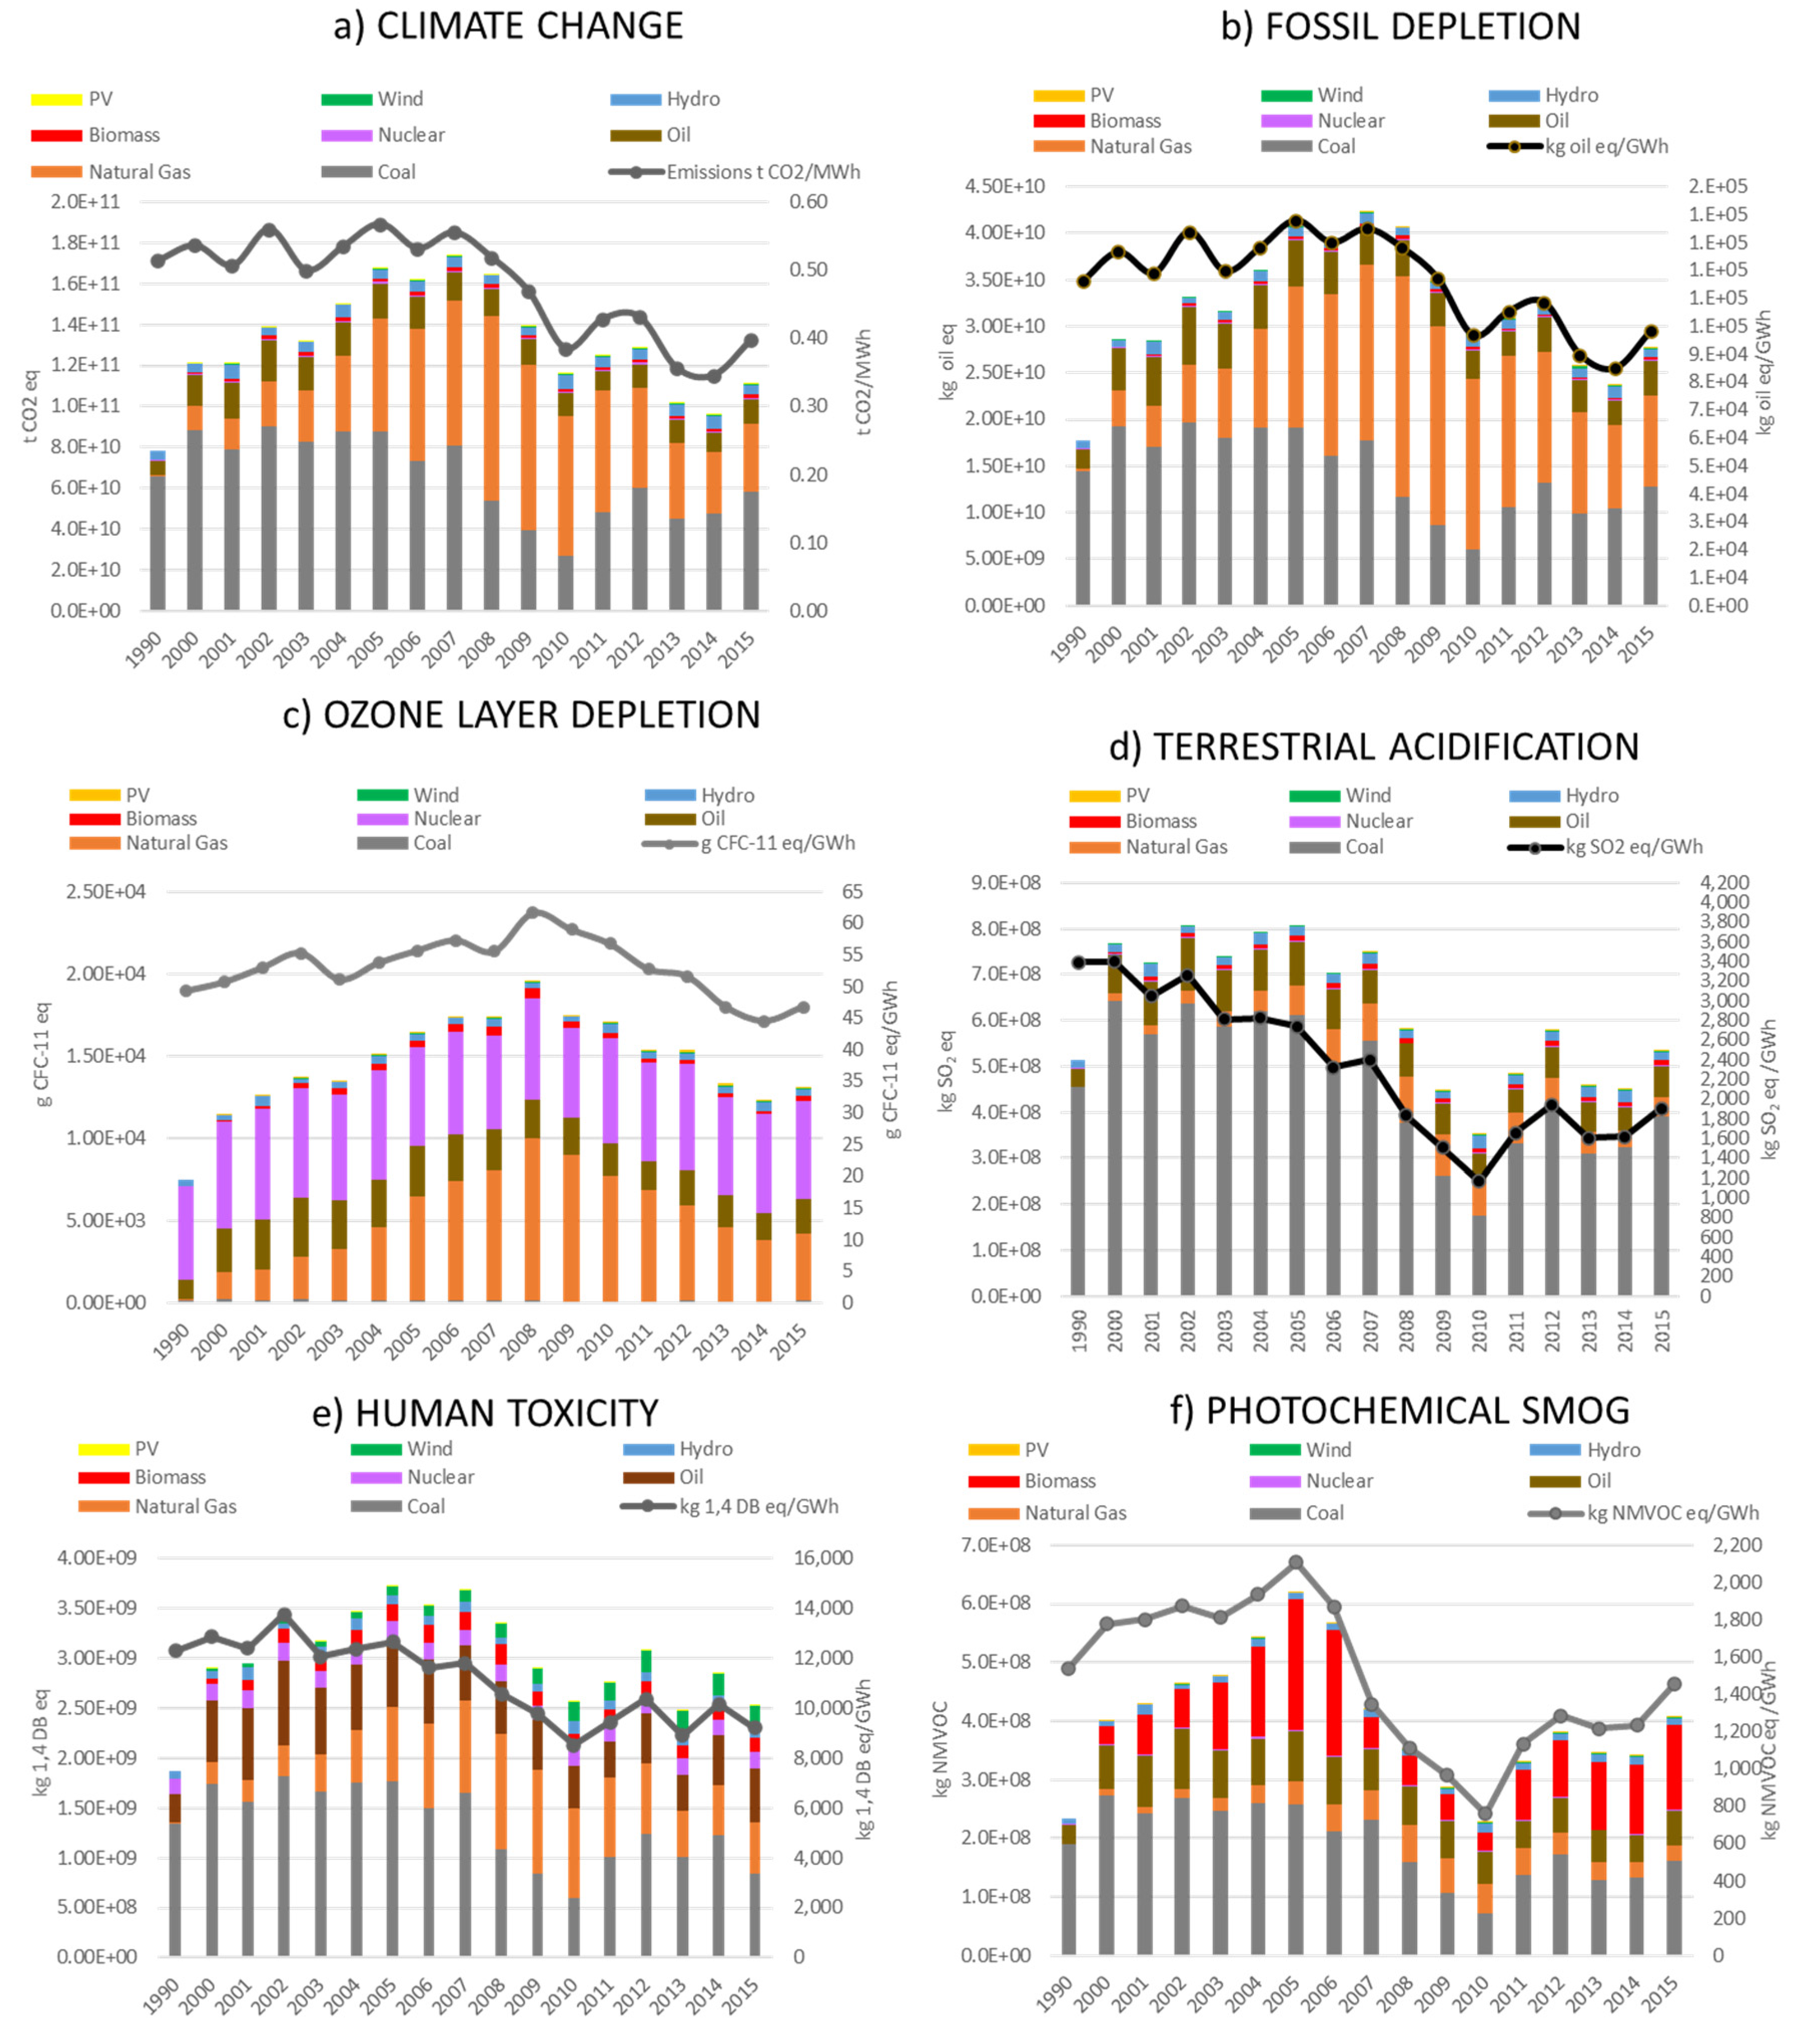
3.1. Environmental Sustainability Assessment

Figure 8 illustrates the evolution in the environmental sustainability of the Spanish electricity system in six categories. The analysis of the global warming category (top left) shows a rapid increase in total GHG emissions since 1990 (7.9 × 10¹⁰ t CO2/year) to reach a maximum in 2007 of 1.72 × 10¹¹ t CO2/year. This is caused primarily by the progressive growth in the economic activity of the country which demands increasing consumptions of electricity for industrial and domestic applications, as illustrated in Figure 2. During this period, the carbon intensity of the electricity system (GHG emissions per unit of power generated) remains rather stable at values between 0.50–0.57 t CO2/MWh, due to the strong contribution of fossil fuels, primarily coal and oil.
The carbon footprint of the power system is progressively reduced after 2008 reaching a minimum of 9.6 t CO2/year in 2014. This situation may be associated with the economic recession that the Spanish economy suffered between 2011 and 2013 due to the global financial crisis. By looking at the carbon intensity, the results evidence a progressive reduction in the emissions per unit of power between 2007 (0.56 t CO2/MWh) and 2014 (0.38 t CO2/MWh). This is attributable to the implementation of the national strategy endorsing the use of natural gas (burnt in higher efficiency and lower carbon intensity combined cycles) and the onset of ambitious national plans for the promotion of renewables. These two approaches progressively relegated the use of the more carbon intensive coal and oil power plants. A detailed description of the aggressive policies implemented by the Spanish Government in that period to favour the deployment of renewables may be revised in [40,41]. The progressive recovery of the Spanish economy and a renewed interest in the use of national coal for power generation explains the gradual upturn in GHG emissions after 2014, despite the increasing contribution of renewables.
A similar approach may be used to evaluate the evolution in the environmental performance of the Spanish electricity system on the other five categories considered in this investigation. In all cases, this performance may be related to changes in the overall demand and technology mix of the system. As explained in Figure 2 and Figure 3, this is conditioned by the economic and political situation of the county, with a rapid economic growth and electrification based on fossil fuels between 1990 and 2000, and a more progressive increase in demand (typical of a more mature economic situation) based primarily on natural gas from 2008. From this date until the present, there is a gradual reduction in power generation partially attributable to the global economic crisis and also to the reinforcement of the tertiary sector and delocalization of more energy intensive economic activities. This period is also characterized by a progressive but strong public support for renewables. In order to avoid extending this section excessively, the discussion on the remaining environmental categories is more restrained, focusing primarily on general trends and key issues.
Thus, in the category describing the depletion of fossil resources (top middle), the results show a profile very similar to that of fossil fuel utilization. The small contribution of hydropower to this category is related to fossil fuel utilization and the consumption of other natural resources during the construction phase of the plants (mainly reservoirs). Regarding the ozone layer depletion category, the emissions follow a pattern strongly affected by the use of nuclear and natural gas power. This is due to the emission of halogenated hydrocarbons (Freon, Halon, CFCs, HCFCs, etc.) used as refrigerating and fire suppressing agents.
The results show a solid correlation between terrestrial acidification (bottom left) and fossil fuel utilization, primarily coal. Thus, the progressive reduction in coal contribution between 1990 and 2010 results in lower impact values in this category. Changes in the Spanish policies regarding the promotion of national coal or its substitution for natural gas and renewables, due to European commitments related to climate change, are responsible for the fluctuations in the acidification impact observed after 2010.
In terms of human toxicity, the assessment of the Spanish electricity system illustrates a progressive reduction in the emissions of 1.4 DB eq per unit of power between 1990 and 2010, later followed by a certain degree of stabilization. The first period may be explained by a progressive penetration of natural gas (at the expense of coal and oil) and the second by the significant contribution of renewables to this category. Regarding the photochemical smog category, the results evidence the strong contribution of coal and biomass plants, or rather, the comparatively smaller contribution to this category of all other power generation technologies. Therefore, the results show an increase in NMVOC emissions per unit of power generated between 1990 and 2005 due to the incorporation of biomass power plants. This is followed by a rapid reduction between 2006 and 2011 due to the smaller contribution of biomass and coal to the power mix, followed by an upturn after 2012 due to an increase in power demand and the incorporation of additional biomass capacity.
Figure 9 describes the same environmental profiles generated by the Spanish electricity system as determined in the four scenarios of 2030 and 2050. Regarding the climate change category, the results evidence a reduction in GHG emission in all cases, which is less marked in the stagnation (ST) scenario due to the prevalence of fossil fuels in the electricity mix.
On the opposite side of the spectrum, the decarbonisation scenario (DC) shows a very significant reduction (78%) in GHG emissions by 2030 due to complete elimination of coal and oil from the mix, and the strong contribution of renewables. This trend continues up until 2050 where all the power is generated by renewables (mainly PV and wind, with a small contribution from hydropower), resulting in a very reduced overall GHG output, both in total terms (2.4 × 10¹⁰ t CO2 eq) and per unit of power generated (0.037 t CO2 eq/MWh).
The other two scenarios (CP and AT) show similar patterns to each other in terms of overall GHG emissions. The impact on climate change generated in 2030 is expected to be less severe than that calculated in the DC scenario, due to the comparatively higher contribution of natural gas, which is used to smooth the transition towards the elimination of fossil fuels. In the longer term (2050), the three scenarios (DC, CP, AT) generate a similar impact in the climate change category. However, since the AT assumes a higher power demand, this results in a smaller impact per unit of power (0.033 t CO2 eq/MWh), which is achieved by permitting a certain contribution of nuclear up until 2050.
A simplified analysis of the situation regarding the other five impact categories and the four projected scenarios is provided below. Regarding the fossil depletion category, the results show a reduction in each scenario, except for ST, due to the substitution of fossil fuels for renewables. The benefits are more markedly observed in 2030 in the DC scenario, due to the more ambitious stance on renewables, compared to CP and AT. In 2050, the impact generated on this category was insignificant in the three scenarios that opted for renewables (DC, CP and AT), but even higher than the present situation in the ST scenario, due to its strong dependence on natural gas.
With regards to ozone layer depletion, the results show a strong dependence on the use of nuclear power and natural gas. These technologies are favoured in all four future scenarios in 2030, which is why impact values on these categories are not reduced in this time horizon. However, in the longer term (2050), the results evidence a significant reduction in the scenarios that assume the closure of nuclear power and the elimination of natural gas (DC and CP). In contrast, the stagnation (ST) scenario maintains a very high impact due to its reliance on natural gas.
Regarding terrestrial acidification, the results show a strong alleviation in this impact category in each scenario, except ST, due to elimination of coal from the mix. This effect is more marked in the DC scenario due to the more decisive penetration of renewables and elimination of sulphur containing fuels (mainly coal but also oil and natural gas). In terms of human toxicity, the results show a notable reduction both in gross emissions and per unit of power generated. These benefits are less marked in the ST scenarios due to the strong contribution of coal in 2030 and natural gas in 2050. The reduced impact in this category observed in 2030 in the DC scenario (compared against CP and AT) is due to the limited contribution of natural gas. The total impact on this category is still noticeable in 2050 due to toxic emissions associated with the life cycle of renewables, primarily in their fabrication stage.
Finally, the impact generated in the photochemical smog category is significantly reduced in each scenario due to the elimination of biomass and coal power plants (except ST in 2030). The use of natural gas to smooth the transition into renewables in the CP and AT scenarios is responsible for the higher impact on this category in 2030 and that is also why ST scenario shows a higher impact in this category of the ST scenario, compared to the other three. Of the other three, AT showed the lowest impact per unit of power in 2050 due to the higher power demand assumed and the utilization of nuclear stations.
The economic sustainability of the Spanish electricity system has been evaluated using the LCOE as the indicator. This analysis only covers the period 2010–2016 due to lack of information regarding the installation of additional capacity in earlier years. Figure 10 shows that the total cost of power generation in Spain in 2010 is dominated by fossil and nuclear technologies. The generation of renewables grows progressively in this period and so does their economic contribution to the electricity system. Overall, the total cost of electricity in Spain during this period (2010–2016) does not change significantly, due to the fact that the renewables with a higher contribution (wind and PV) are attributed similar costs to fossil technologies, while the contribution of higher cost renewables (CSP, biomass and biogas) is still marginal (see Figure 6).

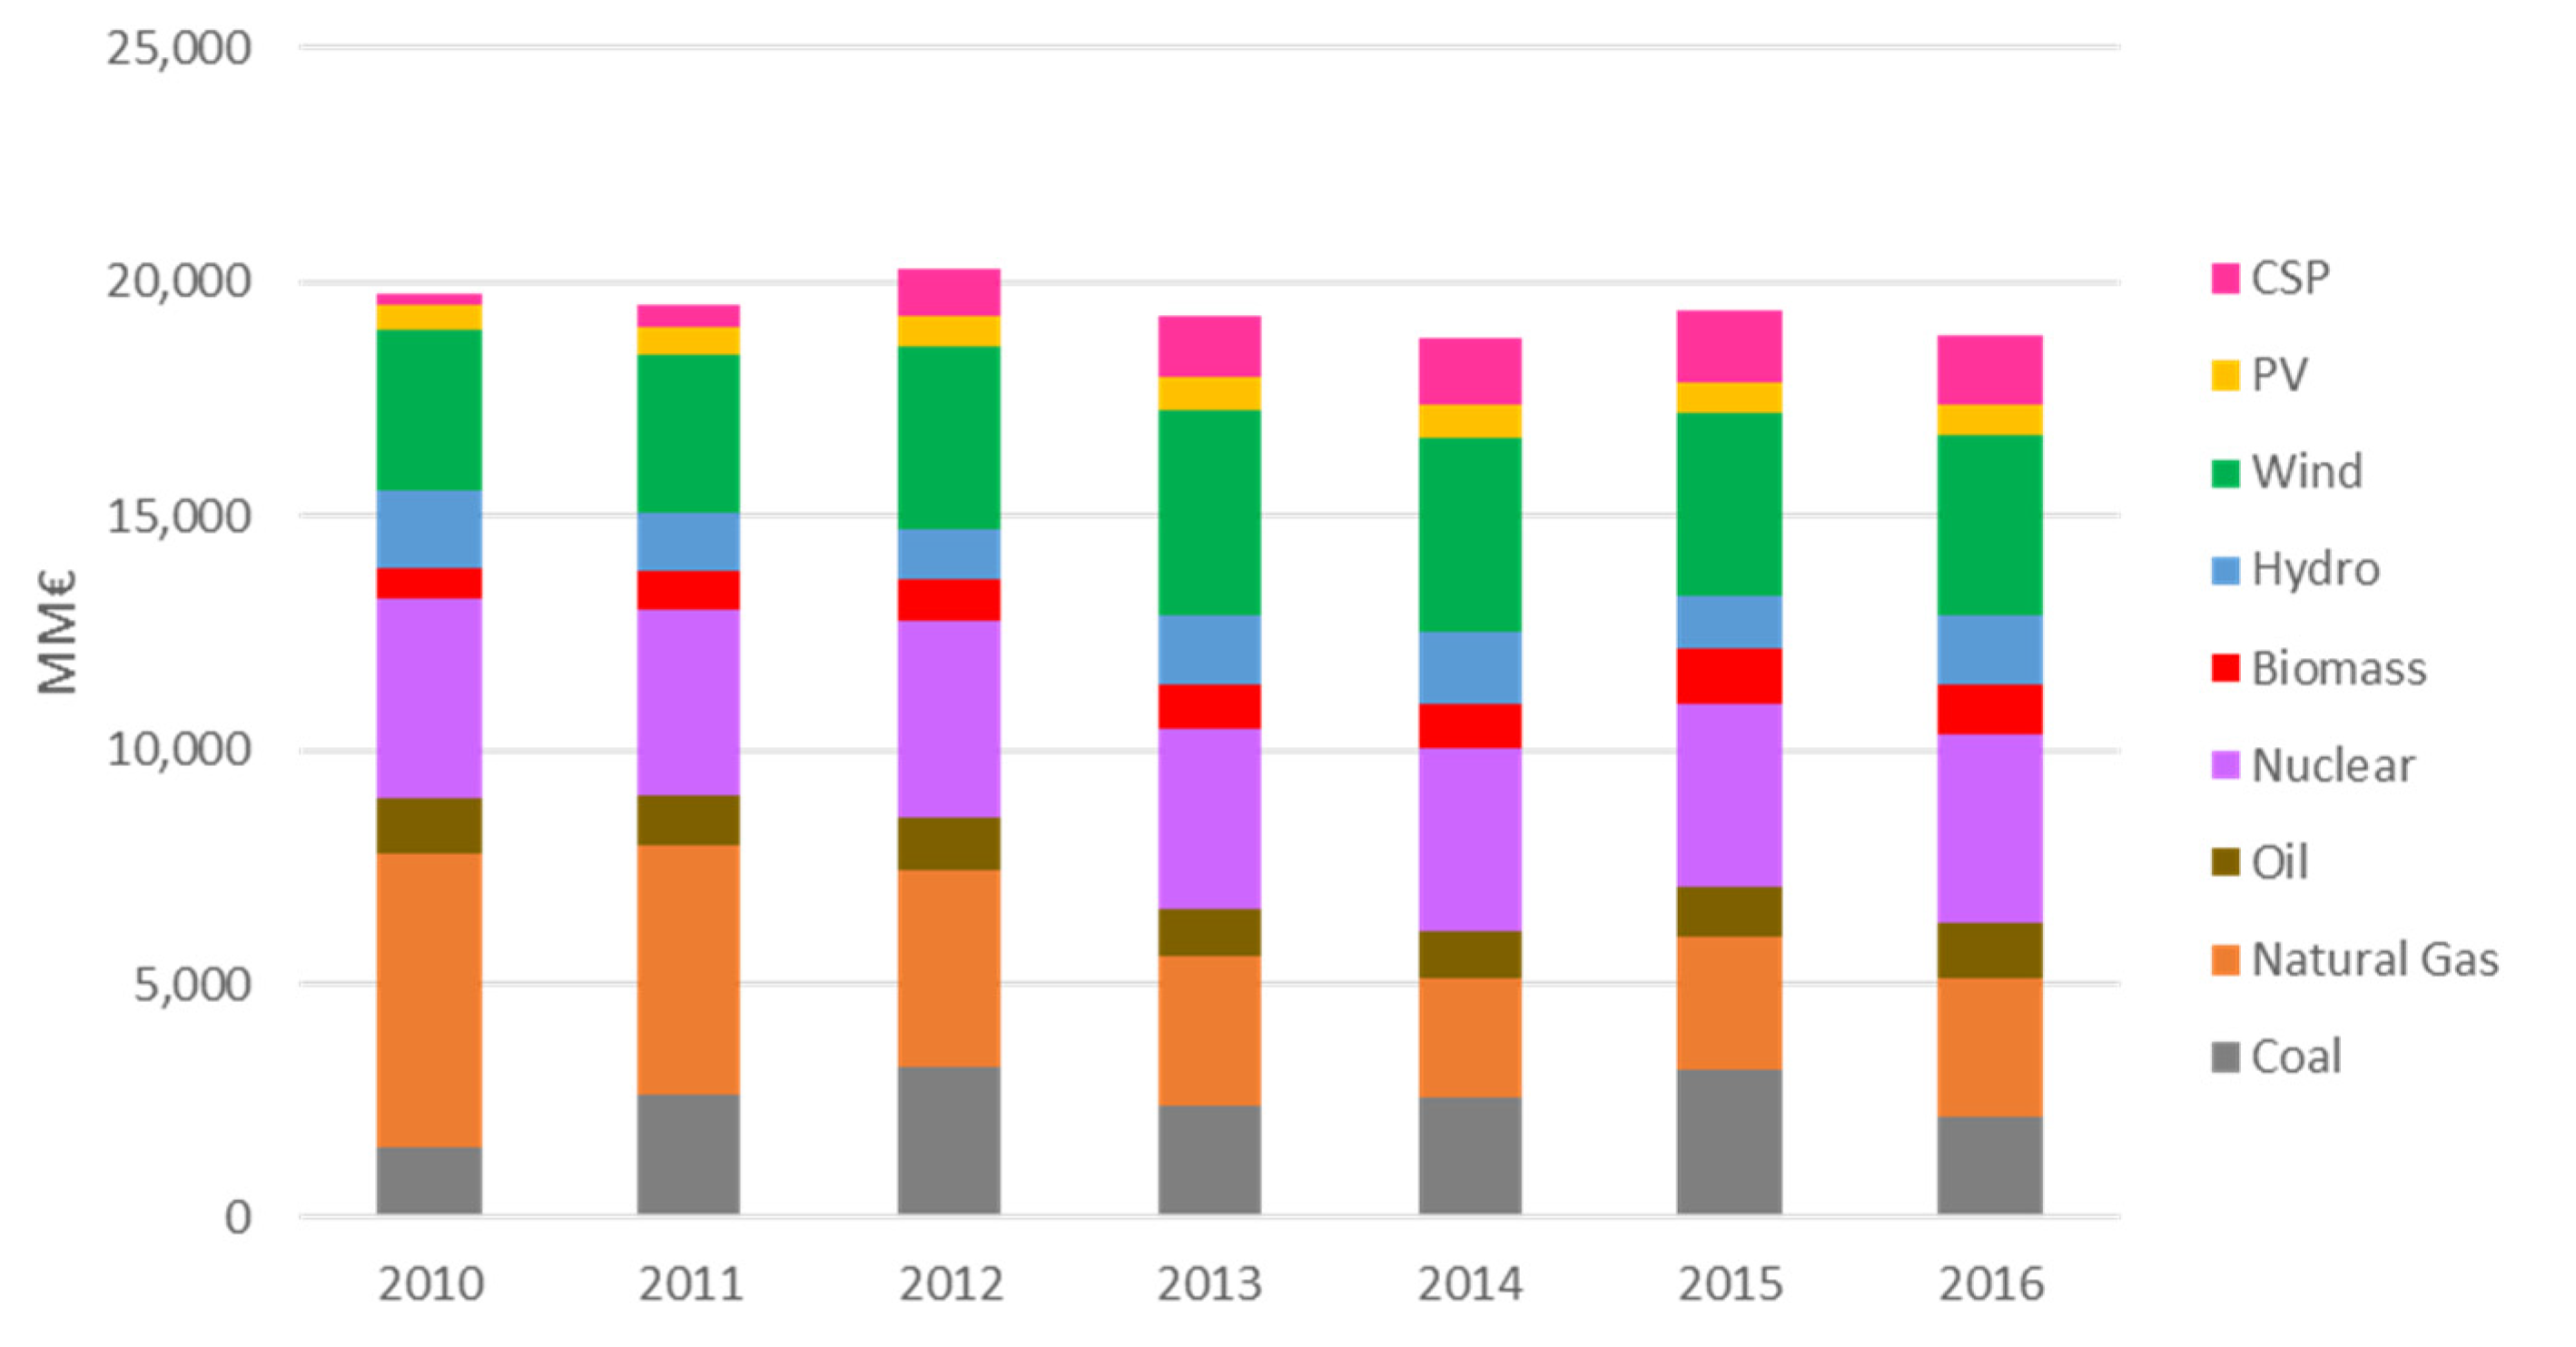
3.1.1. Electricity Costs in Historic and Present Data

Figure 11 shows a breakdown of the total cost of power generation in Spain during the reference year 2015, indicating the contribution of different technologies and life cycle stages.
The results show that most of the LCOE in the Spanish electricity system correspond to the capital cost of building the infrastructures (52%), followed by fuel costs (37%) and to a lesser extent the operation and management of the plants (11.1%). The main contributors to the capital costs are the nuclear energy and the renewable technologies (primarily wind). It is also remarkable the relatively high contribution of CSP to overall power costs, despite its limited generation share. Regarding fuel costs for 2015, the results show a large contribution of natural gas and a smaller proportion of coal, oil and nuclear. The contribution of biomass costs is very limited but still far greater than what should correspond to its limited generation capacity. The contribution of other renewables to this life cycle stage is obviously null.

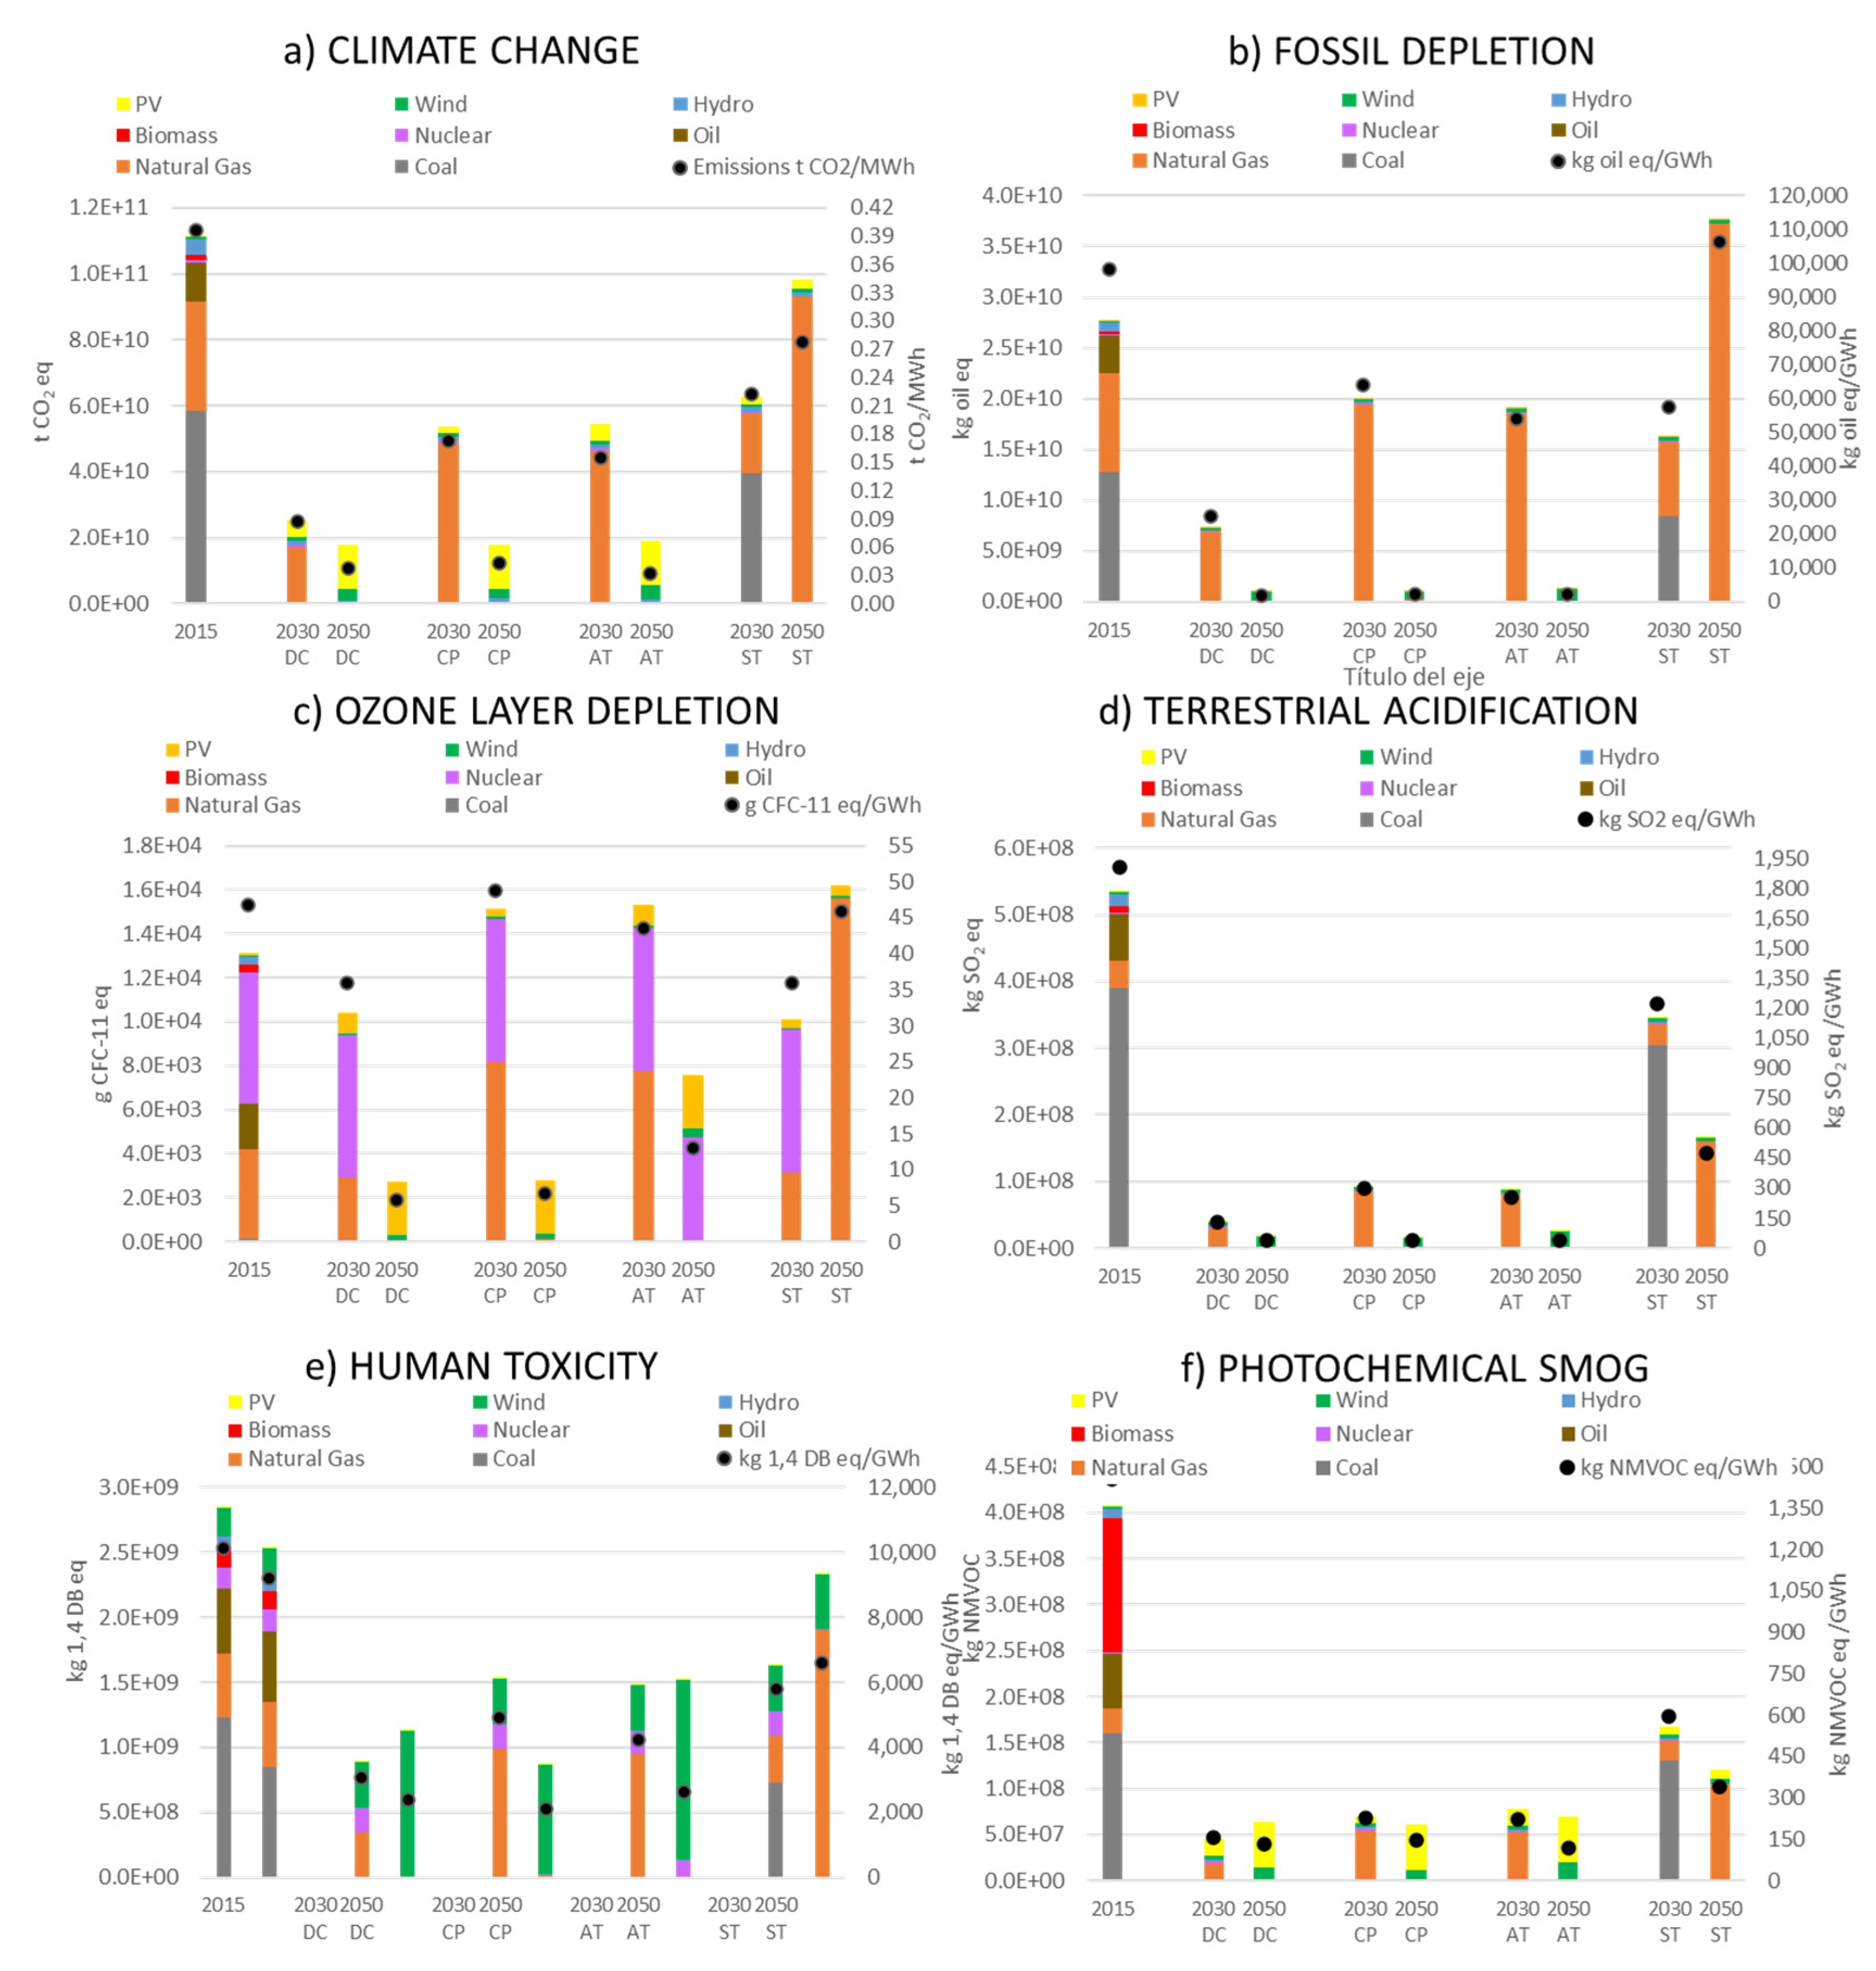
3.1.2. Electricity Costs in Future Projections

Figure 12 illustrates the cost of power generated in the four scenarios projected for 2030 and 2050. The results show a cost reduction per unit of energy generated (€/MWh) in each projected scenario when compared to the reference year of 2015 (69.12 €/MWh). Cost cuts grow larger between 2030 and 2050 in each scenario. These cuts are greater in the scenarios dominated by renewables (DC = 29.76 €/MWh; CP = 30.63 €/MWh; AT = 39.77 €/MWh in 2050) due to the cost reductions envisaged for wind and PV. The cost differences between the scenarios dominated by renewables and fossil technologies are less marked in the short term (2030) but become remarkable in the long term (2050) scenarios. Despite being slightly lower than that of 2015, the cost per unit of power of the scenarios with the strongest contribution of renewables (ST) is by far the highest of all in the long run (57.74 €/MWh in 2050).
Comparing the overall cost of the electricity systems is less apparent due to differences in the power demand considered in each scenario (see Figure 4). The results evidence a progressive cost reduction in the decarbonization (DC) and current policy (CP) scenarios when compared to the situation in 2015. This is so despite the significantly higher generation values considered in the future scenarios (DC = 477,073 GWh and CP = 416,698 GWh in 2050, compared to the 279,600 GWh for 2015). This is due to the strong penetration of renewables and the cost reductions envisaged for wind and solar. The higher overall cost generated by the AT scenario is due to the strong power demand associated with this case (581,930 GWh in 2050, almost double of that in 2015). Despite assuming the lowest generation values (ST = 352,507 GWh in 2050) the overall cost of the stagnation scenario was one of the highest due to the high economic intensity of fossil fuels and the limited contribution of renewables.

3.2. Socio-Economic Sustainability Assessment

This section revises the evolution of direct employment generation in the Spanish electricity system over the last decades and the projections for the future scenarios of 2030 and 2050. Figure 13 shows employment generation in the Spanish electricity system between 2010 and 2016. As explained for the economic assessment, the employment evaluation only covers the period 2010–2016 due to lack of information regarding the installation of additional capacity in earlier years.

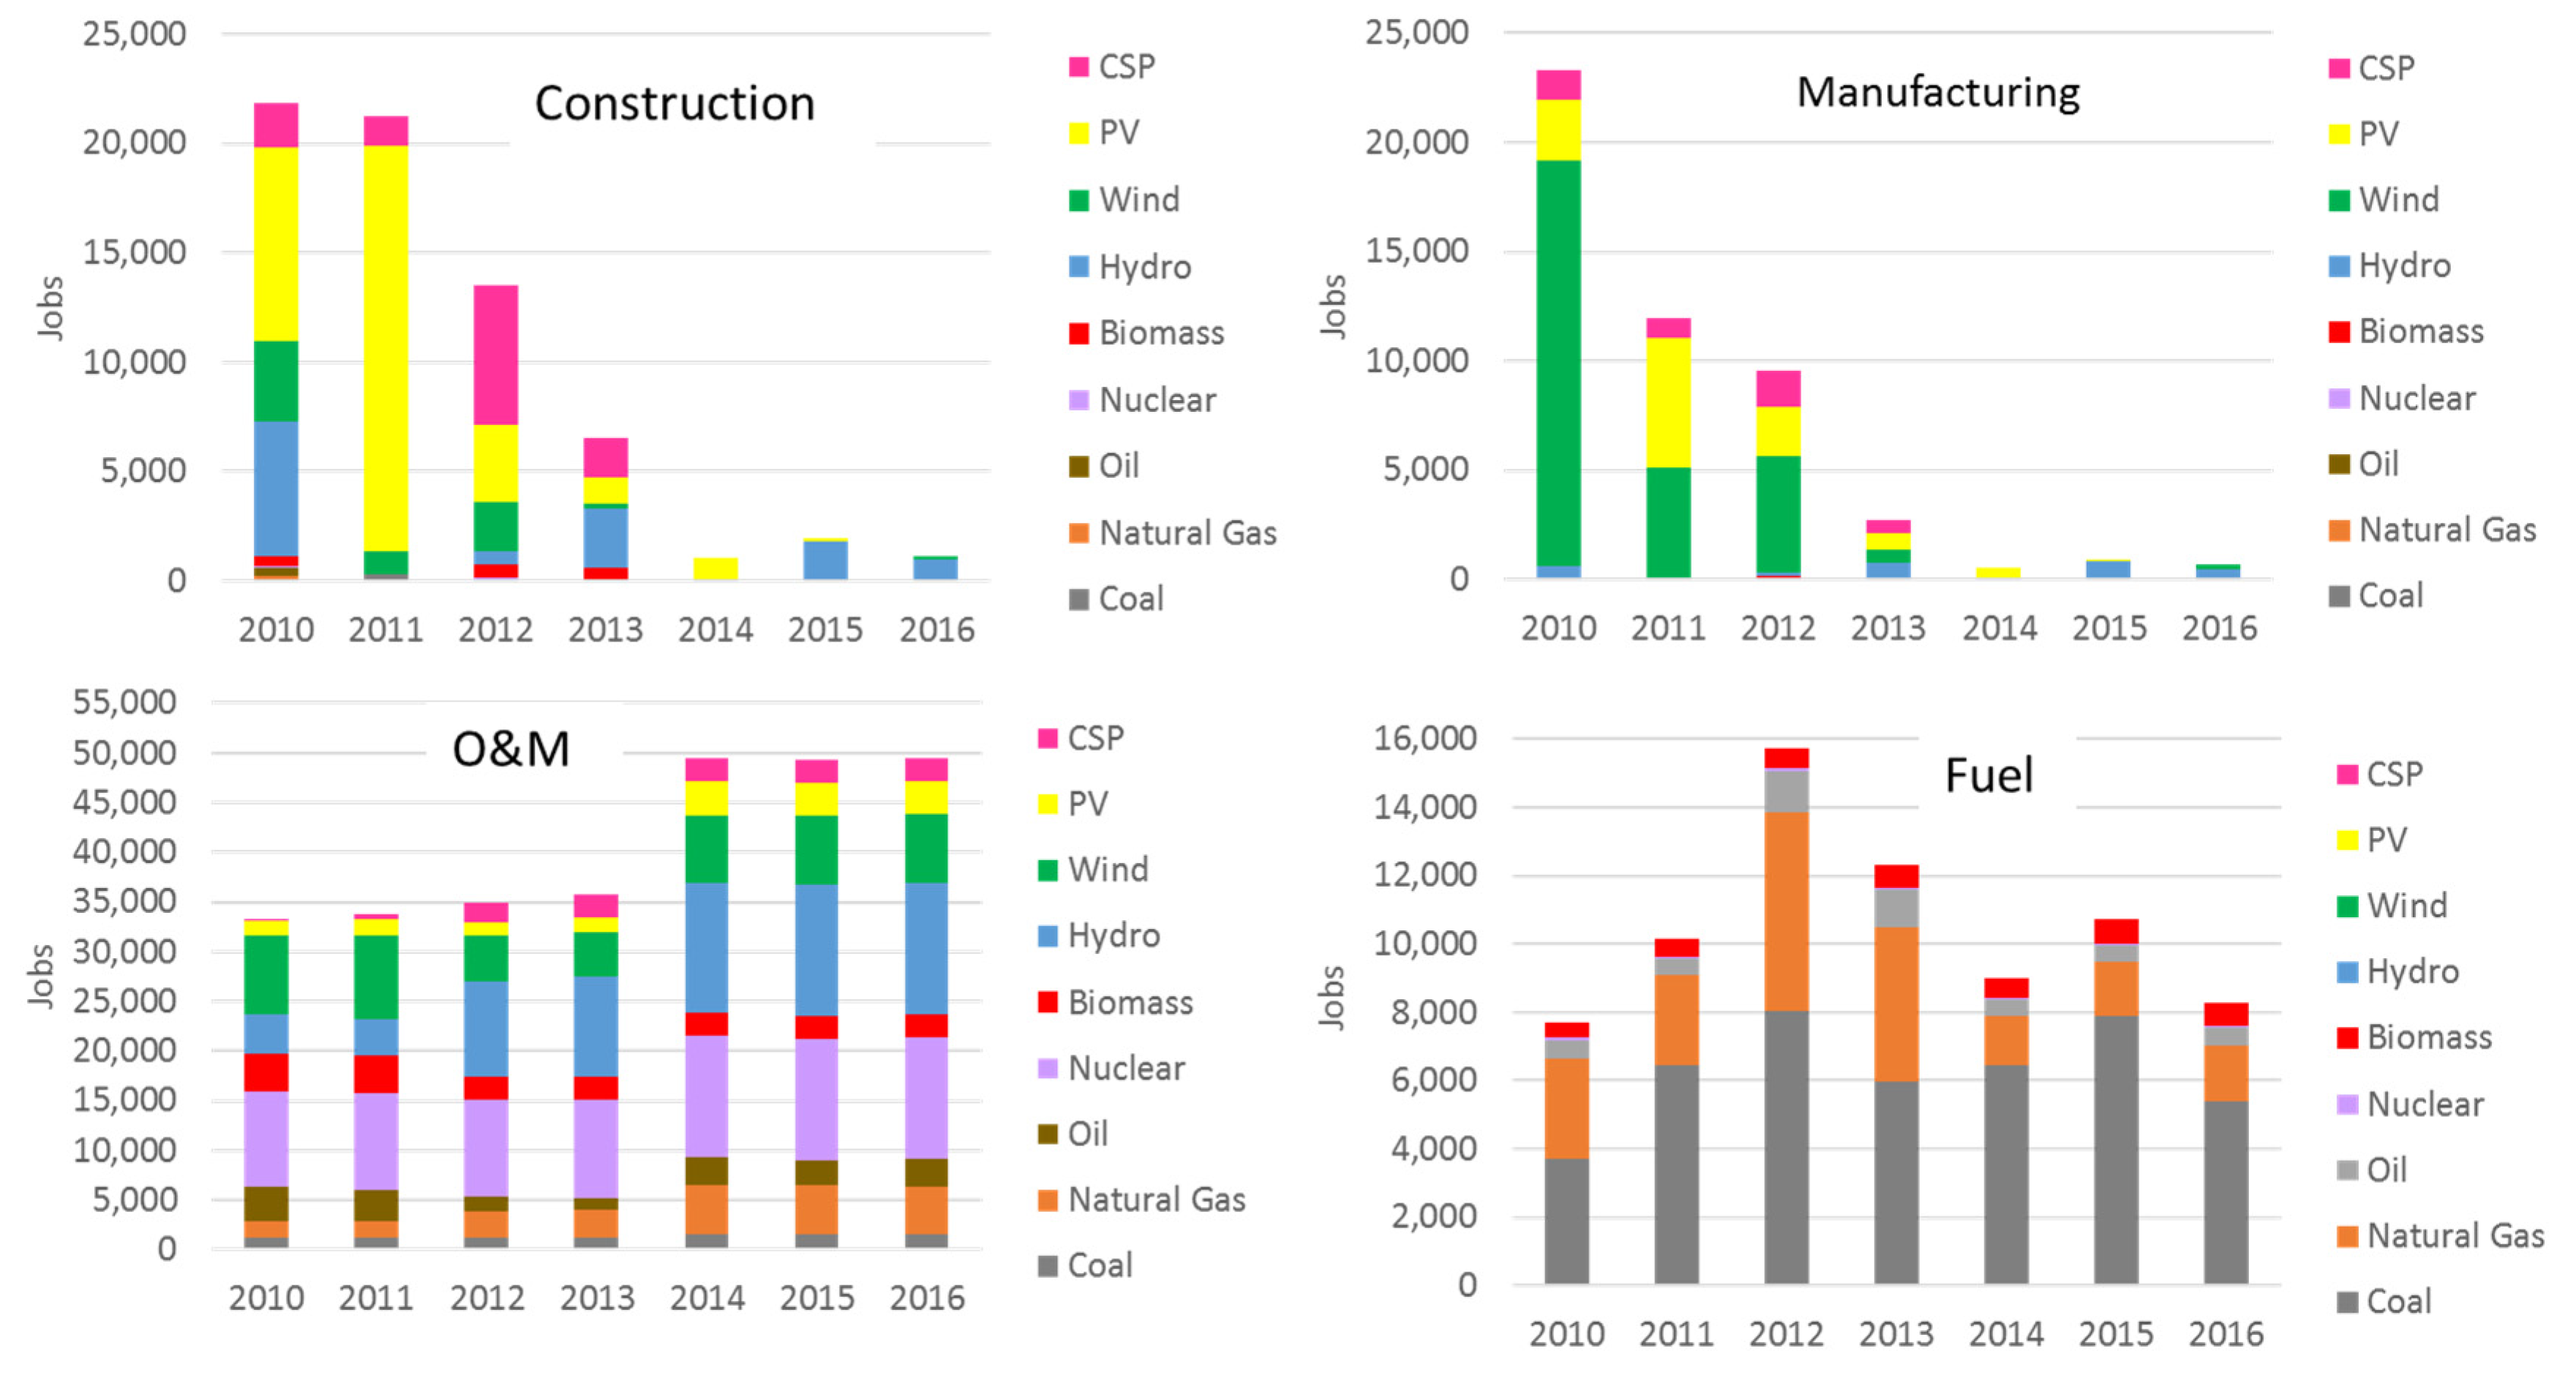
3.2.1. Employment Generation in Historic and Present Situation

The results in Figure 13 and Figure 14 show high employment generation rates (86,000 jobs) in 2010, with a very strong contribution of renewables, primarily in the manufacturing and construction stage. This reflects the rapid expansion in the installed capacity of renewable energies (primarily wind and PV, but also CSP) that occurred in Spain during the first years of the 2010 decade [42,43]. Most of the jobs generated by the PV sector are associated with the installation (construction) of the plants while most of the jobs generated by wind are related to the manufacturing of components.
The results show a progressive reduction in the generation of jobs between 2010 and 2013 in the manufacturing and construction phases, due to the progressive stagnation of the renewable sector and the stoppage in the deployment of additionally installed capacity. The exception to this trend is CSP, which peaks in employment generation during 2012 and 2013 due to the installation of new plants. The inactivity in the construction of new renewable plants extends until 2016, incorporating CSP after 2013.
Regarding the operation and management, the costs remain rather stable between 2010 and 2013. Then there is a jump between 2013 and 2014 and then they are stable again until 2016. In this life cycle stage, most jobs go to nuclear and hydroelectric (around 10,000 jobs each). It should be noted that jobs in operation and management are more stable than those in the construction stage, which are temporary as they last as long as the construction of the plant takes.
In contrast, the number of jobs attributable to the extraction and processing of fuels follows the trail marked by fossil technologies, with a relative maximum in 2012 which is the year with the highest contribution of coal power. Biomass is also a highly employment intensive technology, although its contribution to the Spanish electricity mix is very limited. Despite the lower contribution to power generation, most of the jobs in this category are attributable to coal, followed by natural gas, depending on its contribution to the mix.
Figure 15 illustrates the total number of direct jobs generated by the electricity system in Spain in the reference year of 2015. The power costs in this time are strongly dominated by the operation and management phase (78.43%), due to the very limited additional capacity projected for this year and the already strong contribution of nuclear power and renewables.

3.2.2. Employment in Future Projections

Figure 16 shows a comparative analysis of employment generation in the four future scenarios considered in this investigation. The results represent accumulated employment for each of the evaluated periods (2015–2030 and 2030–2050), including that associated with the installation of additional capacity (construction and manufacturing), operation and management, and fuel extraction and processing (where necessary). The results show higher employment rates in the three scenarios that assume a stronger penetration of renewable technologies (DC, CP and AT). In all these cases, employment is primarily associated with the deployment of PV and wind energy. This employment is generated earlier (2030) in the scenarios assuming a rapid transformation of the electricity model (DC and AT), and later (2050) in those assuming a more gradual conversion (CP). Overall employment generation is greatest in the scenario that proposes a higher overall power demand (AT). In contrast, the scenario that assumed a strong dependence on fossil fuels (ST) shows the lowest job gains, most of which are still related to the mild deployment of PV and wind power.
As an example, Figure 17 shows the distribution of jobs throughout the life cycle of the technologies contributing to the mix. This exercise has been done for the AT scenario in 2050, although the same discussion may be applicable to describe the situation in the other two scenarios describing a strong dependence on renewables (DC and CP). Thus, the results show most of the jobs that will be generated will be related to the manufacturing of the components and installations, and primarily to the construction of the new power plants. These jobs will be absorbed primarily by the PV technology and, to a lower extent, wind technology. The O&M phase has a significantly lower contribution to employment generation, while the contribution of fuel generation and transformation is negligible.

4. Conclusions

The electricity system of a country has enormous repercussions on its sustainability. This investigation describes the evolution in environmental, economic and socio-economic sustainability of the Spanish electricity system between 1990 and 2015, and also in four future scenarios projected for the years 2030 and 2050.
The results have shown that between 1990 and 2000, there is a strong increase in the impacts generated by the system on most environmental categories. This is due to the fact that this period was characterized by solid economic growth which caused a robust demand for this energy vector, and also a strong dependence on fossil fuels of the technology mix. The total cost of power generation also escalates rapidly and so does the generation of employment.
In the period between 2000 and 2008, the results show a progressive but less rapid increase in power demand which is met using natural gas, while coal electricity reduces its predominance gradually. This results in reduced impact values in global categories like climate change, a limited effect on electricity generation cost and a stabilization in the generation of employment.
The period between 2008 and 2016 combines a strong economic crisis with an ambitious public strategy aimed at promoting renewables. The result is a progressive reduction in the impacts associated with global warming, a slight increase in the generation costs and a notable increase in employment generation.
Regarding the future projections, the results show that the scenarios with a higher contribution of renewables (DC, CP, AT) exhibited reduced GHG emissions per unit of power and achieved higher employment rates, all while having a lower economic cost. These benefits become more noticeable in the longer term (2050). The opposite is observed in the scenarios that assume a higher dependency on fossil technologies (ST).

Author Contributions

Conceptualization, G.S.M.; methodology, G.S.M. and M.C.; formal analysis, M.C.; investigation, G.S.M. and M.C.; data curation, G.S.M. and M.C.; writing—original draft preparation, G.S.M.; writing—review and editing, G.S.M.; visualization, G.S.M. and M.C.; supervision, G.S.M. All authors have read and agreed to the published version of the manuscript.

Funding

This piece of research received no external funding.

Conflicts of Interest

The authors declare no conflict of interest.

References

  1. World Bank. State of Electricity Access Report 2017; World Bank: Washington, DC, USA, 2017; ISBN 1202522262. [Google Scholar]
  2. United Nations. Sustainable Development Report 2019: Transformations to Achieve the Sustainable Development Goals; United Nations: New York, NY, USA, 2019. [Google Scholar]
  3. Nuclear Energy Agency. The Full Costs of Electricity Provision; OECD: Paris, France, 2018; ISBN 9789264303119. [Google Scholar]
  4. IRENA. Renewable Power Generation Costs in 2017; International Renewable Energy Agency: Abu Dhabi, UAE, 2018; ISBN 978-92-9260-040-2. Available online: http://irena.org/publications/2018/Jan/Renewable-power-generation-costs-in-2017 (accessed on 12 February 2020).
  5. Turconi, R.; Boldrin, A.; Astrup, T. Life cycle assessment (LCA) of electricity generation technologies: Overview, comparability and limitations. Renew. Sustain. Energy Rev. 2013, 28, 555–565. [Google Scholar] [CrossRef] [Green Version]
  6. Barros, M.V.; Salvador, R.; Piekarski, C.M.; de Francisco, A.C.; Freire, F.M.C.S. Life cycle assessment of electricity generation: A review of the characteristics of existing literature. Int. J. Life Cycle Assess. 2020, 25, 36–54. [Google Scholar] [CrossRef]
  7. WG Environmental Management & Economics. Eurelectric, Life Cycle Assessment of Electricity Generation. 2011. Available online: http://www.eurelectric.org/media/26740/report-lca-resap-final-2011-420-0001-01-e.pdf (accessed on 15 July 2019).
  8. European Commission. Directive 2009/28/EC of The European Parliament and of the Council of 23 April 2009 on the Promotion of the Use of Energy from Renewable Sources; European Commission: Brussels, Belgium, 2009. [Google Scholar]
  9. European Commission. EU Climate Action. Available online: https://ec.europa.eu/clima/policies/eu-climate-action_en (accessed on 15 February 2020).
  10. European Commission. A Clean Planet for all a European Strategic Long-Term Vision for a Prosperous, Modern, Competitive and Climate Neutral Economy; COM/2018/773 final 2018; European Commission: Brussels, Belgium, 2018. [Google Scholar]
  11. IPCC. Climate Change 2014: Synthesis Report; Contribution of Working Groups I, II and III to the Fifth Assessment Report of the Intergovernmental Panel on Climate Change; Pachauri, R.K., Meyer, L.A., Eds.; IPCC: Geneva, Switzerland, 2014. [Google Scholar]
  12. IRENA. Rethinking Energy 2017; IRENA: Abu Dhabi, UAE, 2017; Volume 55, ISBN 978-92-95111-06-6. [Google Scholar]
  13. Santoyo-Castelazo, E.; Stamford, L.; Azapagic, A. Environmental implications of decarbonising electricity supply in large economies: The case of Mexico. Energy Convers. Manag. 2014, 85, 272–291. [Google Scholar] [CrossRef]
  14. Azapagic, A.; Chalabi, Z.; Fletcher, T.; Grundy, C.; Jones, M.; Leonardi, G.; Osammor, O.; Sharifi, V.; Swithenbank, J.; Tiwary, A.; et al. An integrated approach to assessing the environmental and health impacts of pollution in the urban environment: Methodology and a case study. Process Saf. Environ. Prot. 2013, 91, 508–520. [Google Scholar] [CrossRef]
  15. May, J.R.; Brennan, D.J. Sustainability Assessment of Australian Electricity Generation. Process Saf. Environ. Prot. 2006, 84, 131–142. [Google Scholar] [CrossRef]
  16. Brizmohun, R.; Ramjeawon, T.; Azapagic, A. Life cycle assessment of electricity generation in Mauritius. J. Clean. Prod. 2015, 106, 565–575. [Google Scholar] [CrossRef]
  17. Atilgan, B.; Azapagic, A. An integrated life cycle sustainability assessment of electricity generation in Turkey. Energy Policy 2016, 93, 168–186. [Google Scholar] [CrossRef]
  18. Huijbregts, M.A.J.; Steinmann, Z.; Elshout, P.M.; Stam, G. ReCiPe2016: A harmonised life cycle impact assessment method at midpoint and endpoint level. Int. J. Life Cycle Assess. 2016, 22, 138–147. [Google Scholar] [CrossRef]
  19. IEA. Investment Costs for Power Generation; International Energy Agency: Paris, France, 2017; Available online: http://www.worldenergyoutlook.org/weomodel/investmentcosts/ (accessed on 17 June 2019).
  20. IEA. Projected Cost of Generating Electricity, International Energy Agency (IEA), Organization for Economic Cooperation and Development—Nuclear Energy Agency (OECD-NEA), 2015 edition; IEA: Paris, France, 2015. [Google Scholar]
  21. Rutovitz, J.; Dominish, E.; Downes, J. Calculating Global Energy Sector Jobs: 2015 Methodology; Institute for Sustainable Futures, University of Technology Sydney: Sydney, Australia, 2015. [Google Scholar]
  22. MINETAD. La Energía en España. 2016. Available online: https://energia.gob.es/balances/Balances/LibrosEnergia/energia-espana-2016.pdf (accessed on 16 June 2019).
  23. REE. Series Estadísticas Nacionales. Available online: https://www.ree.es/es/datos/publicaciones/series-estadisticas-nacionales (accessed on 16 June 2019).
  24. IEA. Energy Statistics. 2018. Available online: https://www.iea.org/countries/spain (accessed on 16 June 2019).
  25. Zafrilla, J.E. The mining industry under the thumb of politicians: The environmental consequences of the Spanish Coal Decree. J. Clean. Prod. 2014, 84, 715–722. [Google Scholar] [CrossRef]
  26. Bianco, V.; Driha, O.M.; Sevilla-Jiménez, M. Effects of renewables deployment in the Spanish electricity generation sector. Util. Policy 2019, 56, 72–81. [Google Scholar] [CrossRef]
  27. Linares, P.; Declercq, D. Escenarios Para el Sector Energético en España, 2030–2050. 2018. Available online: https://eforenergy.org/docpublicaciones/informes/informe_2017.pdf (accessed on 16 June 2019).
  28. Government of Spain. Comisión de Expertos de Transición Energética. 2018. Available online: http://www6.mityc.es/aplicaciones/transicionenergetica/informe_cexpertos_20180402_veditado.pdf (accessed on 17 June 2019).
  29. IDEA. Spain’s National Renewable Energy Action Plan (2011–2020), Plan de Energías Renovables, Instituto para la Diversificación y Ahorro Energético (IDAE). 2010. Available online: http://www.minetad.gob.es/energia/desarrollo/EnergiaRenovable/Paginas/paner.aspx (accessed on 17 June 2019).
  30. Wernet, G.; Bauer, C.; Steubing, B.; Reinhard, J.; Moreno-Ruiz, E.; Weidema, B. The ecoinvent database version 3 (part I): Overview and methodology. Int. J. Life Cycle Assess. 2016, 21, 1218–1230. [Google Scholar] [CrossRef]
  31. European Commission. Characterisation Factors of the ILCD Recommended Life Cycle Impact Assessment Methods: Database and Supporting Information, 1st ed.; EUR 25167 2012; European Commission: Brussels, Belgium, 2012. [Google Scholar]
  32. Cole, W.J.; Frew, B.A.; Gagnon, P.J.; Richards, J.; Sun, Y.; Margolis, R.M.; Woodhouse, M.A. SunShot 2030 for Photovoltaics (PV): Envisioning a Low-Cost PV Future; U.S. National Renewable Energy Laboratory: Golden, CO, USA, 2017; pp. 1–69.
  33. Ram, M.; Child, M.; Aghahosseini, A.; Bogdanov, D.; Lohrmann, A.; Breyer, C. A comparative analysis of electricity generation costs from renewable, fossil fuel and nuclear sources in G20 countries for the period 2015–2030. J. Clean. Prod. 2018, 199, 687–704. [Google Scholar] [CrossRef]
  34. IRENA. Fugure of Wind: Technology, Grid Integration and Socio-Economic Aspects; IRENA: Abu Dhabi, UAE, 2019; pp. 1–88. [Google Scholar]
  35. IRENA. Future of Solar Photovoltaic: Deployment, Investment, Technology, Grid Integration and Socio-Economic Aspects; IRENA: Abu Dhabi, UAE, 2019; ISBN 9789292601560. [Google Scholar]
  36. Martikainen, J.P. Response to ‘A comparative analysis of electricity generation costs from renewable, fossil fuel and nuclear sources in G20 countries for the period 2015–2030’. J. Clean. Prod. 2019, 208, 142–143. [Google Scholar] [CrossRef]
  37. EIA Annual Energy Outlook 2020, with Projections to 2050; U.S. Energy Information Administration, U.S. Department of Energy: Washington, DC, USA, 2020.
  38. Rutovitz, J.; Usher, J. Methodology for Calculating Energy Sector Jobs; Prepared for Greenpeace Int. by Institute for Sustainable Future; University Technology Sydney: Sydney, Australia, 2010. [Google Scholar]
  39. Rutovitz, J.; Harris, S. Calculating Global Energy Sector Jobs: 2012 Methodology; Institute for Sustainable Future, University Technology Sydney: Sydney, Australia, 2012. [Google Scholar]
  40. del Río, P.; Gual, M.A. An integrated assessment of the feed-in tariff system in Spain. Energy Policy 2007, 35, 994–1012. [Google Scholar] [CrossRef]
  41. del Río González, P. Ten years of renewable electricity policies in Spain: An analysis of successive feed-in tariff reforms. Energy Policy 2008, 36, 2917–2929. [Google Scholar] [CrossRef]
  42. San Miguel, G.; Corona, B. Economic viability of concentrated solar power under different regulatory frameworks in Spain. Renew. Sustain. Energy Rev. 2018, 91, 205–218. [Google Scholar] [CrossRef]
  43. del Río, P.; Mir-Artigues, P. Combinations of support instruments for renewable electricity in Europe: A review. Renew. Sustain. Energy Rev. 2014, 40, 287–295. [Google Scholar] [CrossRef]
Figure 1. Life cycle diagram, system boundaries and input/output consideration employed to evaluate the environmental (green), economic (red) and socio-economic (blue) sustainability of Spain’s electricity system.
Energies 13 01896 g001
Figure 2. Historic data for electricity generation and technology mix in Spain (1960–2016).
Energies 13 01896 g002
Figure 3. Historic data for installed generation capacity in Spain (2000–2016).
Energies 13 01896 g003
Figure 4. Projections of electricity generation and technology mix in Spain (2030–2050) compared to reference year 2015.
Energies 13 01896 g004
Figure 5. Projections of installed capacity and technology mix in Spain (2030–2050) compared to reference year 2015.
Energies 13 01896 g005
Figure 6. Economic performance of different technologies for power generation, as applicable to Spain in 2015 in terms of LCOE (adapted from [20]).
Energies 13 01896 g006
Figure 7. Employment factors used to quantify direct jobs created from different power generation technologies (adapted from [21,38,39]).
Energies 13 01896 g007
Figure 8. Historic environmental performance of Spain’s electricity system (1990–2015): (a) climate change, (b) fossil depletion, (c) ozone layer depletion, (d) terrestrial acidification, (e) human toxicity, (f) photochemical smog.In the first stage of the ST scenario (2030), the results show a notable reduction (44%) in the emissions per unit of power, due to a decline in the contribution of coal, the complete elimination of oil and the increasing weight of renewables (mainly PV). In the second stage of the ST scenario (2050), the higher impact per unit of power compared with 2030 is associated to the prevalence of natural gas in the power mix and the not so decisive upsurge in the penetration of renewables.
Energies 13 01896 g008
Figure 9. Environmental performance of future projections of Spain’s electricity system: 2030–2050: (a) climate change, (b) fossil depletion, (c) ozone layer depletion, (d) terrestrial acidification, (e) human toxicity, (f) photochemical smog.
Energies 13 01896 g009
Figure 10. Historic values of power generation costs estimated as a summation of LCOE of all contributing technologies.
Energies 13 01896 g010
Figure 11. Contribution of different technologies to the aggregated LCOE of Spain in 2015
Energies 13 01896 g011
Figure 12. Power generation costs (LCOE) and contribution of different technologies in the four scenarios considered for 2030 and 2050 (DC = decarbonization; AP = maintaining current policies; AT = Advanced technologies; ST = stagnation).
Energies 13 01896 g012
Figure 13. Historic data (2010–2016) describing employment generation of Spain’s electricity system per technology.
Energies 13 01896 g013
Figure 14. Employment generation in the Spanish electricity system since 2010 and disaggregated per life cycle phases: construction and installation of power plants (top left), raw materials and manufacturing of components (top right), operation and management of power plants (bottom left) and fuel production (bottom right).
Energies 13 01896 g014
Figure 15. Breakdown of direct employment generation by power generation technology (2015).
Energies 13 01896 g015
Figure 16. Employment generation of Spain’s electricity system: future projections.
Energies 13 01896 g016
Figure 17. Breakdown of direct employment generation by life cycle phase (construction, manufacturing, Operation and Management, and fuel) in 2050 for the AT scenario.
Energies 13 01896 g017
Table 1. Summary of projected electricity scenarios for Spain, as extracted from [27,28].
ScenarioYearGross Generation (GWh)Installed Capacity (MW)Objectives
Current situation2015279,600107,769-
Decarbonization (DC)2030290,653141,968Ambitious reduction of GHG emissions
2050477,073247,324
Current Policies (CP)2030310,997112,757Linear evolution of international geopolitics
2050416,698219,979
Accelerated technology advance (AT)2030352,260153,787Fast penetration of RE
2050581,930290,764
Stagnation (ST)2030281,460108,399High dependency on fossil fuels.
2050352,507108,755

