Article

Combining Biomass Gasification and Solid Oxid Fuel Cell for Heat and Power Generation: An Early-Stage Life Cycle Assessment

1
Copernicus Institute of Sustainable Development, Utrecht University, 3584 CB Utrecht, The Netherlands
2
Division Energy, Transport and Climate Policy, Wuppertal Institute for Climate, Environment and Energy, D-42103 Wuppertal, Germany
3
BIOS BIOENERGIESYSTEME GmbH., A-8020 Graz, Austria
*
Author to whom correspondence should be addressed.
Energies 2020, 13(11), 2773; https://doi.org/10.3390/en13112773
Submission received: 6 May 2020 / Revised: 25 May 2020 / Accepted: 27 May 2020 / Published: 1 June 2020
(This article belongs to the Special Issue Life Cycle Assessment of Energy Systems)

Abstract

:
Biomass-fueled combined heat and power systems (CHPs) can potentially offer environmental benefits compared to conventional separate production technologies. This study presents the first environmental life cycle assessment (LCA) of a novel high-efficiency bio-based power (HBP) technology, which combines biomass gasification with a 199 kW solid oxide fuel cell (SOFC) to produce heat and electricity. The aim is to identify the main sources of environmental impacts and to assess the potential environmental performance compared to benchmark technologies. The use of various biomass fuels and alternative allocation methods were scrutinized. The LCA results reveal that most of the environmental impacts of the energy supplied with the HBP technology are caused by the production of the biomass fuel. This contribution is higher for pelletized than for chipped biomass. Overall, HBP technology shows better environmental performance than heat from natural gas and electricity from the German/European grid. When comparing the HBP technology with the biomass-fueled ORC technology, the former offers significant benefits in terms of particulate matter (about 22 times lower), photochemical ozone formation (11 times lower), acidification (8 times lower) and terrestrial eutrophication (about 26 times lower). The environmental performance was not affected by the allocation parameter (exergy or economic) used. However, the tested substitution approaches showed to be inadequate to model multiple environmental impacts of CHP plants under the investigated context and goal.

Graphical Abstract

1. Introduction

Compared to separate production of heat and electricity from fossil fuels, combined heat and power systems (CHPs) can potentially allow for significant reductions of climate change impact [1,2]. In Europe, coupling heat and electricity generation from renewable sources is also one of the most cost-effective decarbonization strategies [3,4,5]. In particular, solid biomass has attracted increasing interest by policymakers and investors especially due to the high availability of local biomass from forests and wood processing industries in some regions [6]. The environmental performance of biomass-fueled CHPs depends not only on the type of technology but also on the type of biomass, its supply chain, and the environmental impact categories in focus [7,8].
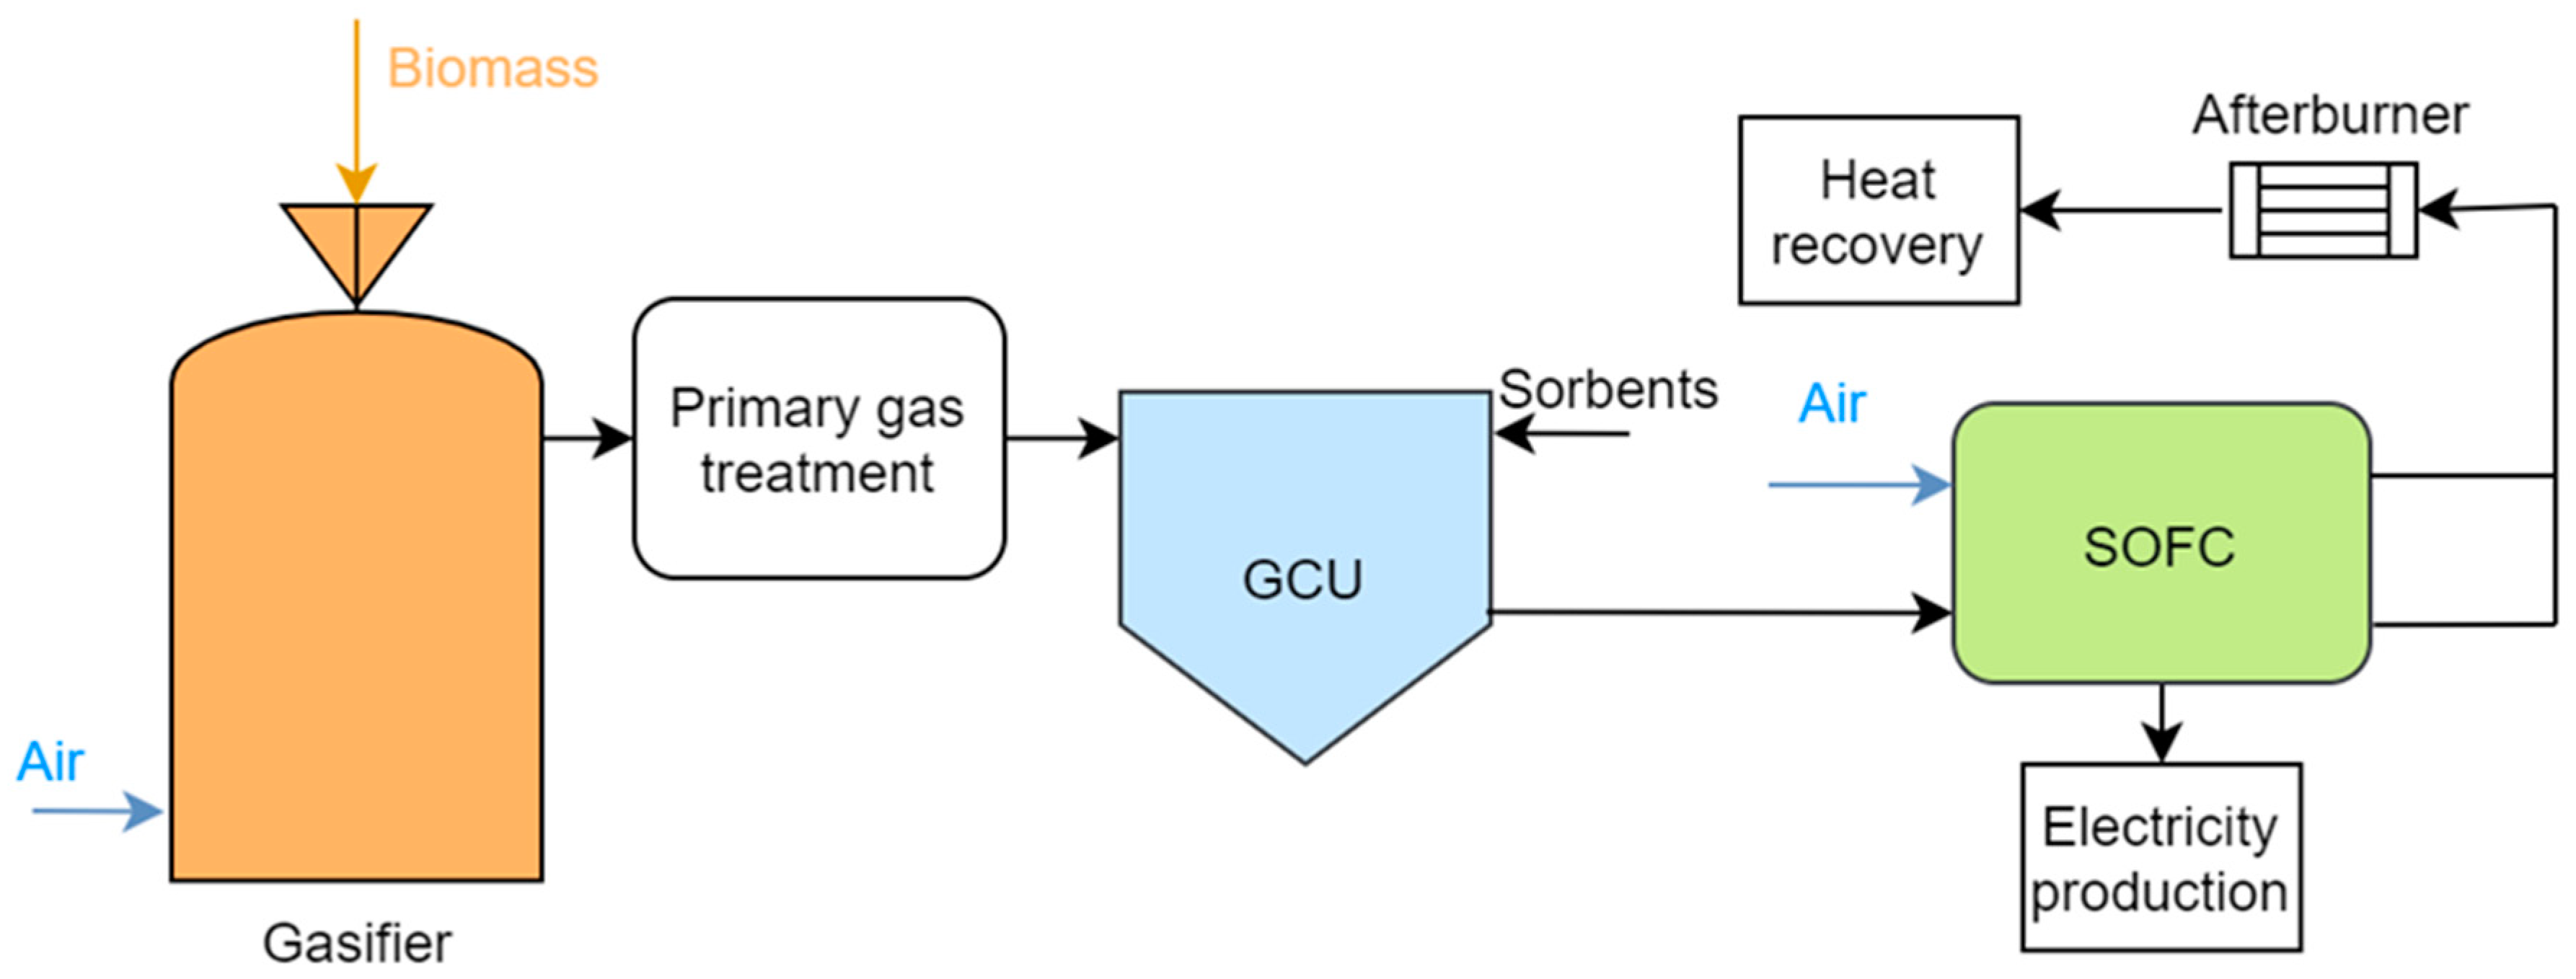
Mature CHP technologies using solid biomass as fuels have often shown restricted fuel flexibility, limited electric efficiencies, and high particulate matter emissions [9]. To overcome these three limitations, a novel technology was developed during the H2020 HiEff-BioPower project [10]. This novel technology (see Figure 1) is based on a fixed-bed updraft gasifier coupled with a novel primary gas treatment zone, a novel gas cleaning unit (GCU), and a solid oxide fuel cell (SOFC). Its current technological readiness level is between 4 and 5 (based on the definition adopted by the European Commission [11]). The biomass fuel is converted into product gas in the gasifier. Syngas derived from biomass (e.g., wood chips) contains HCl, H2S, and tars [12] making it not suitable for direct utilization in fuel cells [13], which require purified gaseous fuels. Therefore, the syngas from the gasifier is first pre-treated in a primary gas treatment unit (first tar reforming step) and then purified in the GCU. The GCU is one of the key innovations of this technology. It combines the use of ceramic filter candles and sorbents [10]. Syngas cleaning is processed in five steps: primary tar reforming, high-temperature particle filtration, HCl sorption (after cooling the product gas), H2S removal by sorbents and tar reforming (after reheating). After re-heating, the product gas is then fed into the SOFC unit to generate electricity. The off-gases from the SOFC unit are then burnt in a catalytic afterburner to recover heat. Most biomass CHPs are suited for medium and large-scale plants (1–100 MWel). The HBP is available also in small size (about 200 kW of electricity output) [9]. Among biomass technologies of this size, one of the main competitors is the organic Rankine cycle (ORC) [14].
At this stage of the Hieff-BioPower project, the assessment of the environmental impacts of the current design configuration can help with minimizing impacts at an early stage of the technical HBP development. In particular, the literature reports a few life cycle assessments (LCAs) of heat and power from SOFC-based CHPs and several ones of CHPs involving biomass gasification processes but no one on their combination (in October 2019, from Scopus database searching in TITLE-ABS-KEY). These studies provided the following main findings: (1) the investigated CHPs present lower impact in terms of climate change compared to conventional technologies [2,15] and (2) the biomass fuel production has the highest contribution to total life cycle impacts [16,17]. These studies also highlighted several methodological uncertainties of LCAs that can lead to significantly different results. Such uncertainties are mainly linked to the multifunctional nature of the CHPs. A CHP is a system producing two products, heat and electricity. Depending on the goal of the LCA, it may be necessary to apportion the overall impact of the system to each of the co-products. Finding the right criterion for the allocation of impacts to each co-product is generally understood as a multifunctionality problem [18]. When a multifunctionality issue is encountered, the practitioner has to properly select the functional units and allocation methods [19,20]. The selected criterion could affect the outcome of the LCA significantly and, for this reason, this selection is broadly discussed in the literature [21,22].
The environmental LCA presented in this study has a twofold aim: (1) to identify the main sources of the environmental impact of this new technology and (2) to assess its ecological competitiveness compared to the separate production of heat and electricity and one of its main competitors, i.e., Organic Rankine Cycles (ORC). Moreover, this case study is used to analytically discuss the influence of the allocation method in the LCA results for CHP plants and provide methodological recommendations for better allocation practices.

2. Materials and Methods

2.1. Goal and Scope Definition

The LCA has been conducted according to ISO 14040:2006 and ISO 14044:2006 [18,23]. The intended audience of this LCA consists of technology developers, researchers involved in the field of bioenergy and LCA practitioners. An attributional LCA (ALCA) approach is followed since the goal of this study is to identify the activities within HBP causing the highest contribution to the environmental impacts, and not the consequences of changes in these activities [21,24].
Two technologies are considered for environmental comparison: (1) a combination of the electricity mix (EMIX) from the German national grid plus heat provided from a natural gas boiler (NG) and (2) biomass-based organic Rankine cycle (ORC) CHP.
As the ORC CHP has a different heat to electricity ratio compared to the HBP, the definition of two functional units was preferred to the definition of a single functional unit with a fixed heat/electricity ratio. Hence, two functional units were defined as follows: 1 kWh of electricity or 1 MJ of heat.
The HBP technology finds one of the main strengths in its fuel flexibility [10] since it can operate with various biomass feedstocks in the forms of chips or pellets. To explore the effect of different feedstocks on the environmental impacts of the HBP CHP technology, this study explored the use of three different types of biomass fuels: wood chips, wood pellets, and Miscanthus pellets. The operation with wood chips was considered as the baseline scenario (WC), while the operation with wood pellets (WP) and the operation with Miscanthus pellets (MP) as alternative scenarios. The baseline scenario with wood chips was also used for comparison with the competing technologies, i.e., the ORC technology (fueled with wood chips as well) and the combination of grid electricity plus natural gas boiler. Additionally, this last competing option was also compared to the WP and MP alternative scenarios.
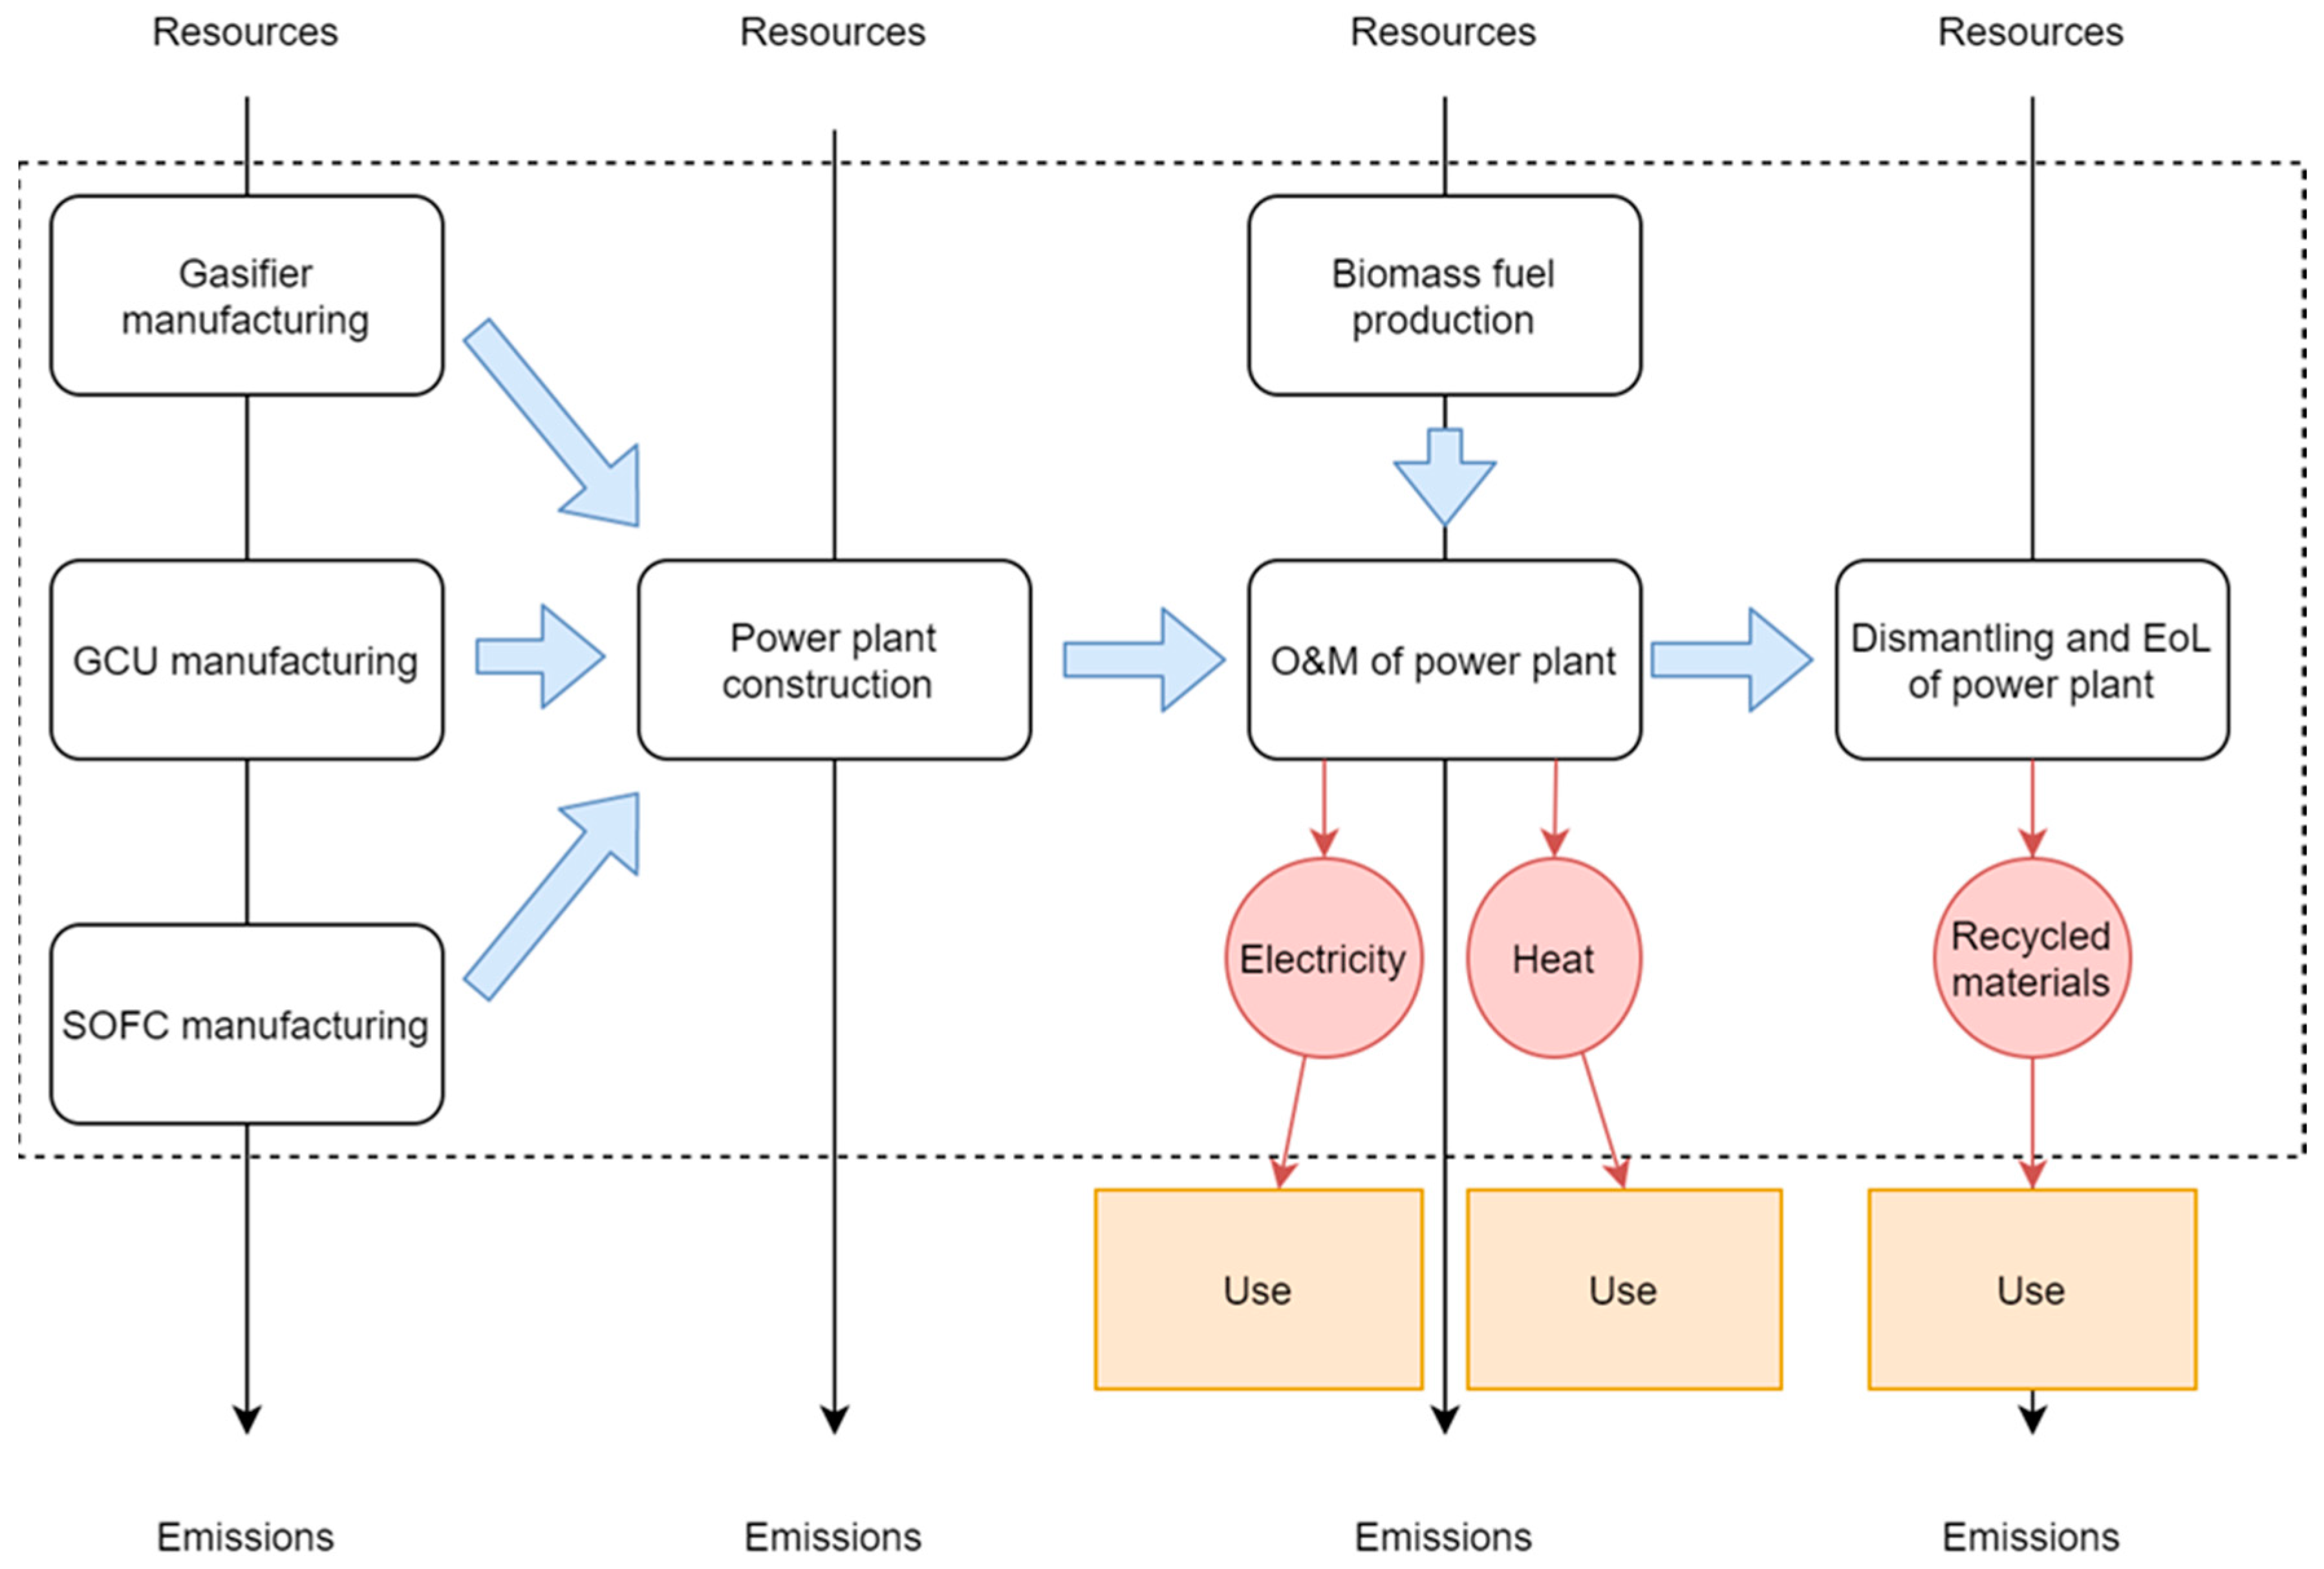
Figure 2 shows the process diagram of the HBP product system. The system boundaries follow a cradle-to-gate approach. As shown in Figure 2, all the life cycle stages from the extraction of the raw materials to the final dismantling and waste treatment are included. The final distribution and consumption of the products, i.e., heat and electricity, are not included in the LCA. After the power plant is dismantled and parts are recycled, the use of the recycled materials is outside of the system boundaries. Biomass transport stages from the forest to the processing plant and from the processing plant to the HBP plant were included in the study. The transportation of plant components (e.g., the gasifier) from the production site to the power plant location and the construction activities of the plant were not included in the analysis. The exclusion of these activities was based on their expected minor contribution to the total environmental impacts, as also found in similar studies, for example [16].
The temporal scope of the study is placed in the near future (the next 5–10 years) when the HBP technology should be commercialized. The HBP is assumed to be installed in Germany, being the country with the maximum potential sales for the HBP technology in Europe [25]. Nevertheless, some components for the HBP (e.g., the gasifier) might also be manufactured outside Germany (in other EU countries).
Seven mid-point impact categories were selected and the adopted impact assessment models for each impact category were selected following the ILCD recommendations [26] (see Table 1). Climate change (CC) and depletion of mineral, fossil, and renewable resources (MFRD) were chosen because they are considered top priorities in the current societal and political challenges [27]. Particulate matter (PM) and photochemical ozone formation (POF) are selected because of their relevance to the energy sector [28]. Acidification (AC), Terrestrial eutrophication (TE), and Water resource depletion (WRD) were selected because of their relevance for agricultural systems, and therefore for biomass production [29].
To assess the robustness of the results, two sensitivity analyses were conducted. As anticipated in the introduction, a comprehensive sensitivity analysis was performed on the allocation choices to explore their influence in the outcome of the LCA (and as recommended by ISO [18]). The second sensitivity analysis was performed to explore parameters that are potentially sensitive for the results and that might environmentally improve or make less attractive the technology in the future.

2.2. Life-Cycle Inventory

2.2.1. Unit Processes, Data, and Assumptions

This study assesses the small scale configuration of the HBP technology, which has a nominal electricity output of the SOFC of 199 kW. Its main characteristics during the average lifetime (assumed 18 years) are reported in Table 2.
For the foreground system, data on the gasifier and the GCU were collected from the industrial partners involved in the H2020 HiEff-BioPower project. For the SOFC, secondary data based on the scientific literature [17] were used due to the unavailability of specific primary data. The background data were largely based on the ecoinvent database (version 3.4). For unavailable data, assumptions were made based on literature (see the following sub-sections for details regarding each phase of the life cycle).
As the system provides two different products (and functional units), it was necessary to determine an allocation key to partition the overall impact to the two functional units. Allocation by physical causality was not applied under the absence of a representative mathematical model (to model the causality relationships) [36,37,38]. Among the possible remaining allocation methods, the exergy key was chosen because it can represent both quantity and quality of both functional outputs, and is common practice for CHPs (e.g., ecoinvent uses such key [39] and is recommended by RED II [40]). Table 2 shows the biomass input, intermediate performance indicators, and energy outputs in terms of their exergy and economic values. The exergetic outputs expressed in percentage reported in Table 2 represent also the allocation factors used for the baseline calculations. The economic values are based on three years (2015–2017) average prices for medium size industries without VAT, in Germany, retrieved from Eurostat [41]. The prices were 0.079 € per kWh of industrial electricity and 0.0086 € per MJ of industrial heat.

2.2.2. Inventory Data for Chips and Pellets

To model the life cycle of wood chips, the ecoinvent 3.4 dataset “Wood chips, wet, measured as dry mass {CH}|market for|APOS” was used. This dataset includes both wood chips from industrial activities and forest management and represents the average Swiss market (assumed to be a good proxy for Germany). In particular, wood chips from forest management represents an 85% share of the modeled Swiss wood chip market.
For wood pellets, the ecoinvent 3.4 dataset “wood pellet, measured as dry mass {RER}|market for wood pellet|APOS” was used.
For Miscanthus pellets, a similar dataset was not available in ecoinvent. Hence, the inventory data from [42] were used together with the best practices reported in [43]. An average dry yield value of 23.5 t Miscanthus (85% dry matter) per hectare was used to estimate the land requirements to provide enough fuel for the HBP plant for one year. The planting rate of 16,000 Miscanthus per ha was taken from [43]. As Miscanthus is a perennial crop, field preparation activities such as herbicide application, harrowing and plantation, occur only during the first year. The lifetime of the crop was assumed to be 18 years [43] and therefore 1/18 of the impact from field preparation activities was apportioned to one year of operation of the HBP plant. Once the Miscanthus is collected from the field, it is necessary to transport it to the pelleting plant. The transport distance to the pelleting plant was assumed to be 10 km by tractor [42]. For the chipping of Miscanthus, the energy consumption of the chipper and the amount of lubricating oil were retrieved from the ecoinvent 3.4 datasets “Wood chips, wet, measured as dry mass {CH}|wood chips production, hardwood, at sawmill|APOS”. For the pelleting of Miscanthus, the amounts of electricity, heat, lubricating oil, and water were retrieved from the ecoinvent 3.4 dataset “Wood pellet, measured as dry mass {RER}|wood pellet production|APOS”. The transportation of Miscanthus pellets to the HBP plant was assumed to occur by truck and with an average distance of 100 km [42].

2.2.3. Inventory Data for the Manufacturing of the Power Plant

The HBP manufacturing consists of three sub-processes: the manufacturing of the gasifier, the manufacturing of the SOFC stack and its balance of plant (BoP), and the manufacturing of the GCU. The data for the manufacturing of the gasifier is based on HBP project data and shown in Table 3.
Concerning the SOFC stack, its production was modeled considering secondary data from scientific literature and, to a lower extent, from ecoinvent database. The literature data was retrieved from studies where the SOFC stacks had a similar power capacity as the HBP technology. The amount of electricity, nickel oxide, solvents, materials for the binder, carbon black, and chromium steel, as well as direct emissions (released during the production of the stack) to the air of carbon dioxide, methyl ethyl ketone, and benzyl alcohol were taken from [17] and adjusted proportionally to the power capacity (factor of 0.793 based on 199 kWe of HBP SOFC versus 250 kWe of SOFC in [17]).
The data for the manufacturing of the anode, cathode, electrolyte, and the required ceramic materials (Lanthanum Strontium Manganite (LSM) and Yittria Stabilised Zirconia (YSZ)) were retrieved from [44].
The other secondary data for the SOFC stack, which were not available in [17,44], were retrieved from the already existing inventory in ecoinvent 3.4 called “Fuel cell, stack solid oxide, 125kW electrical, future {CH}|production APOS” and multiplied times 1.59 to account for the different size (assumption of linear proportionality of materials to the size as before).
For the production of the SOFC’s BoP, data for the inputs of steel and energy were retrieved from [17]. The other data were instead retrieved from ecoinvent 3.4 dataset “Fuel cell, solid oxide, 125 kW electrical, future {CH}|production|APOS”, which was modified as well by multiplying times 1.59.
The materials for manufacturing the cage of the GCU were assumed to be similar to the ones of the cage of the external reformer of the SOFC provided in ecoinvent 3.4. The 96 filter candles which are present in the GCU system at the beginning of the operation were included within the manufacturing stage. These candles are made from calcium-magnesium-silicate high-temperature fiberglass. The processes “Calcium borates {GLO}|market for|APOS”, “Magnesium {GLO}|market for|APOS” and “Silica sand {DE}|production|APOS” from ecoinvent 3.4 were used as a proxy for CaMgO4Si. It was further assumed that 1.1 kg of material input would generate 1 kg of filter candles. The mass of each candle was derived from the technical sheet of the candles [45].

2.2.4. Inventory Data for Operation and Maintenance

The system operation includes all the material and energy inputs needed to operate the plant during one year of service (e.g., gas cleaning sorbents, water), waste outputs (e.g., ash which needs to be disposed of) and direct emissions to the environment (e.g., pollutant gas released to air).
The resulting direct emissions to air from the HBP are summarised in Table 4. Data for such emissions were only available for wood chips and wood pellets. The emissions from the operation with Miscanthus pellets were assumed to be the same as for wood pellets. Data on the ash formation (grate ash and fly ash) was retrieved from [14].
The operation of the gasifier needs 2.36 kg of natural gas for start-up operations and about 80.0 t of tap water per year for gasification air humidification (based on simulations from project data). According to measurements performed downstream the primary gas treatment zone, i.e., at GCU inlet, the syngas composition during utilization of wood chips is as follows (in volume percentage): 15.4% CO, 10.6% CO2, 1.8% CH4, 8.3% H2, 21.8% H2O, 41.1% N2. During the multiple tests performed, such a composition showed to be stable. After the primary treatment unit, the syngas typically shows contaminant concentrations in the range of 30 ppm for sulfur and 20 ppm for chlorine (on wet basis) when wood chips are used as fuel. The tar concentration at the inlet of the GCU was lower than 2.0 g/Nm³ on a dry basis and the particulate matter contents (TSP) of about 200 g/Nm³ on a dry basis were determined.
For the operation of the GCU, about 1.2 t of zinc oxides per year are needed for H2S removal. The GCU also requires 1200 Nm3 of Nitrogen per year for the cleaning of the filter elements. One year of operation of the GCU requires also 4800 kg of dolomite mixed with 900 kg of sodium bicarbonate (from ecoinvent 3.4, Soda ash, dense {GLO}|market for|APOS) as coating materials respectively for Cl-sorption. The GCU has been designed to feed the SOFC with a product gas containing less than 5 ppm of chlorine, less than 1 ppm of sulfur, and less than 100 ppm of particulate matter (TPS < 0.1 mg/Nm3, on wet basis). Since the composition of the syngas is expected to be stable (confirmed also by the first test runs), the uncertainty about the simulated electric power output of the SOFC is expected to be very low.
The maintenance stage includes all the components which are replaced during the lifetime of the HBP plant. The SOFC stack and the GCU have a shorter lifetime than the average lifetime of the HBP CHP plant. Since the SOFC stack currently investigated for the HBP technology has an estimated lifetime of 5 years, the production of 1/5 extra SOFC stack per year was added to the maintenance stage. The GCU used for the HBP technology has a lifetime of 10 years, therefore, the production of 1/10 extra GCU per year was added to the maintenance stage. All other maintenance inputs (steel components and deionized water consumption for start-ups) for the SOFC were retrieved from [17] and scaled for the capacity of the SOFC under investigation. For the filter candles, an average of 30% of candles is estimated to be replaced each year of operation of the HBP technology. Therefore, the production of 29 extra candles per year was included in the maintenance stage.

2.2.5. Inventory Data for End-of-Life Disposal

The main material employed in the components of the HBP is steel and can be recycled at the end of the life of each component. Based on the amount of steel present in the components (and their replacements), it was assumed that about 1900 kg of steel are recycled per average year of operation. The model included the energy for pressing and crushing the steel crap (based on [46]), a recycling efficiency (referred to as RRE in Equation (1)) of 88% [47], and a transportation distance of 100 km from [46]. Such transportation was assumed to occur mainly by 16–32 t lorries Euro 3 [46].
A recycling process is a typical example of a multifunctional process fulfilling two functions i.e., the treatment of waste and the production of a recycled product. Based on our goal, the modeling approach (i.e., attributional), and the recommendations by ISO 14044:2006, mass allocation was applied. This selection is based on the fact that ISO 14044:2006 prioritizes allocating by a physical property for open-loop recycling over the economic value or number of uses (among ISO third level allocations i.e., by other relationships). Additionally, system expansion cannot be applied since we want to isolate the first function (first use of the material which led to its treatment) from the second function (next use or cycle of the material). The impacts arising from transportation (ET), recycling (ERC), and the extraction and processing of the primary material (Ev) were therefore allocated by mass between this life cycle and the following one (see Equation (1) expressing the allocated impact to our functions). The resulting mass allocation factor (1/(1 + RRE)) was 53% (1/1.88). The second part of Equation (1) related to the virgin material takes into account the fact that the primary production was already accounted entirely in the manufacturing phase, and therefore the corresponding burdens (e.g., extraction of raw material) that belong to the following life cycle should be subtracted.
E steel   disposal = RRE ( E T +   E RC ) 1 1 + RRE RRE 1 + RRE   E v
There are some precious metals (e.g., used as catalytic materials) used in the power plant that, depending on the recovery efficiency and initial concentration, might be economically convenient to recover, though e.g., hydrometallurgical treatment [48]. Nevertheless, such specific recovery processes were not modeled because of the unavailability of Life Cycle Inventory data. Materials other than the steel used in the power plant components consist of hazardous waste (24 kg) and inert waste (10 t per year in the chips scenario, and 20 t per year for the pellets scenarios). The treatment of the hazardous waste was modeled through the ecoinvent dataset “Hazardous waste, for underground deposit {DE}|treatment of hazardous waste, underground deposit|APOS”. The inert waste consists mainly of materials for sorbents and was modeled through the ecoinvent 3.4 dataset “Inert waste, for final disposal {CH}|market for inert waste, for final disposal|APOS”.

2.2.6. Inventory Data for the Competing Technologies

For the comparative analysis, the ecoinvent 3.4 datasets “1 MJ Heat, district or industrial, other than natural gas {CH}|heat and power co-generation, wood chips, 2000 kW, state-of-the-art 2014|APOS” and “1 kWh Electricity, high voltage {CH}|heat and power co-generation, wood chips, 2000 kW, state-of-the-art 2014|APOS” were used for the ORC. This dataset represents a state of the art ORC co-generation plant equipped with an electrostatic precipitator for particulate emission reduction and includes the infrastructure. For the separate production of heat and electricity, the ecoinvent 3.4 datasets “1 MJ Heat, central or small-scale, natural gas {CH}|heat production, natural gas, at boiler condensing modulating < 100kW|APOS” and “1 kWh Electricity, medium voltage {DE}|market for|APOS” were used.
Following the description provided in ecoinvent 3.4 for the ORC ecoinvent dataset, the capacity of the ORC plant is 1000 kW thermal, and 200 kW electric (similar to the electric output of the HBP technology). This information was used to estimate the exergy allocation factor of 46% for heat (assumed district heating provided at 90 °C as for HBP) and 54% for electricity. Based on 2015–2017 average prices for Germany, the economic allocation shares for ORC would be 66% for heat and 34% for electricity. As the total power input (as wood chips) is 2000 kW, this ORC plant has an overall energy efficiency of 60%, i.e., 10% electrical efficiency plus 50% thermal efficiency.

3. Results

3.1. Environmental Impact of the HBP Technology

3.1.1. Baseline (Wood Chips)

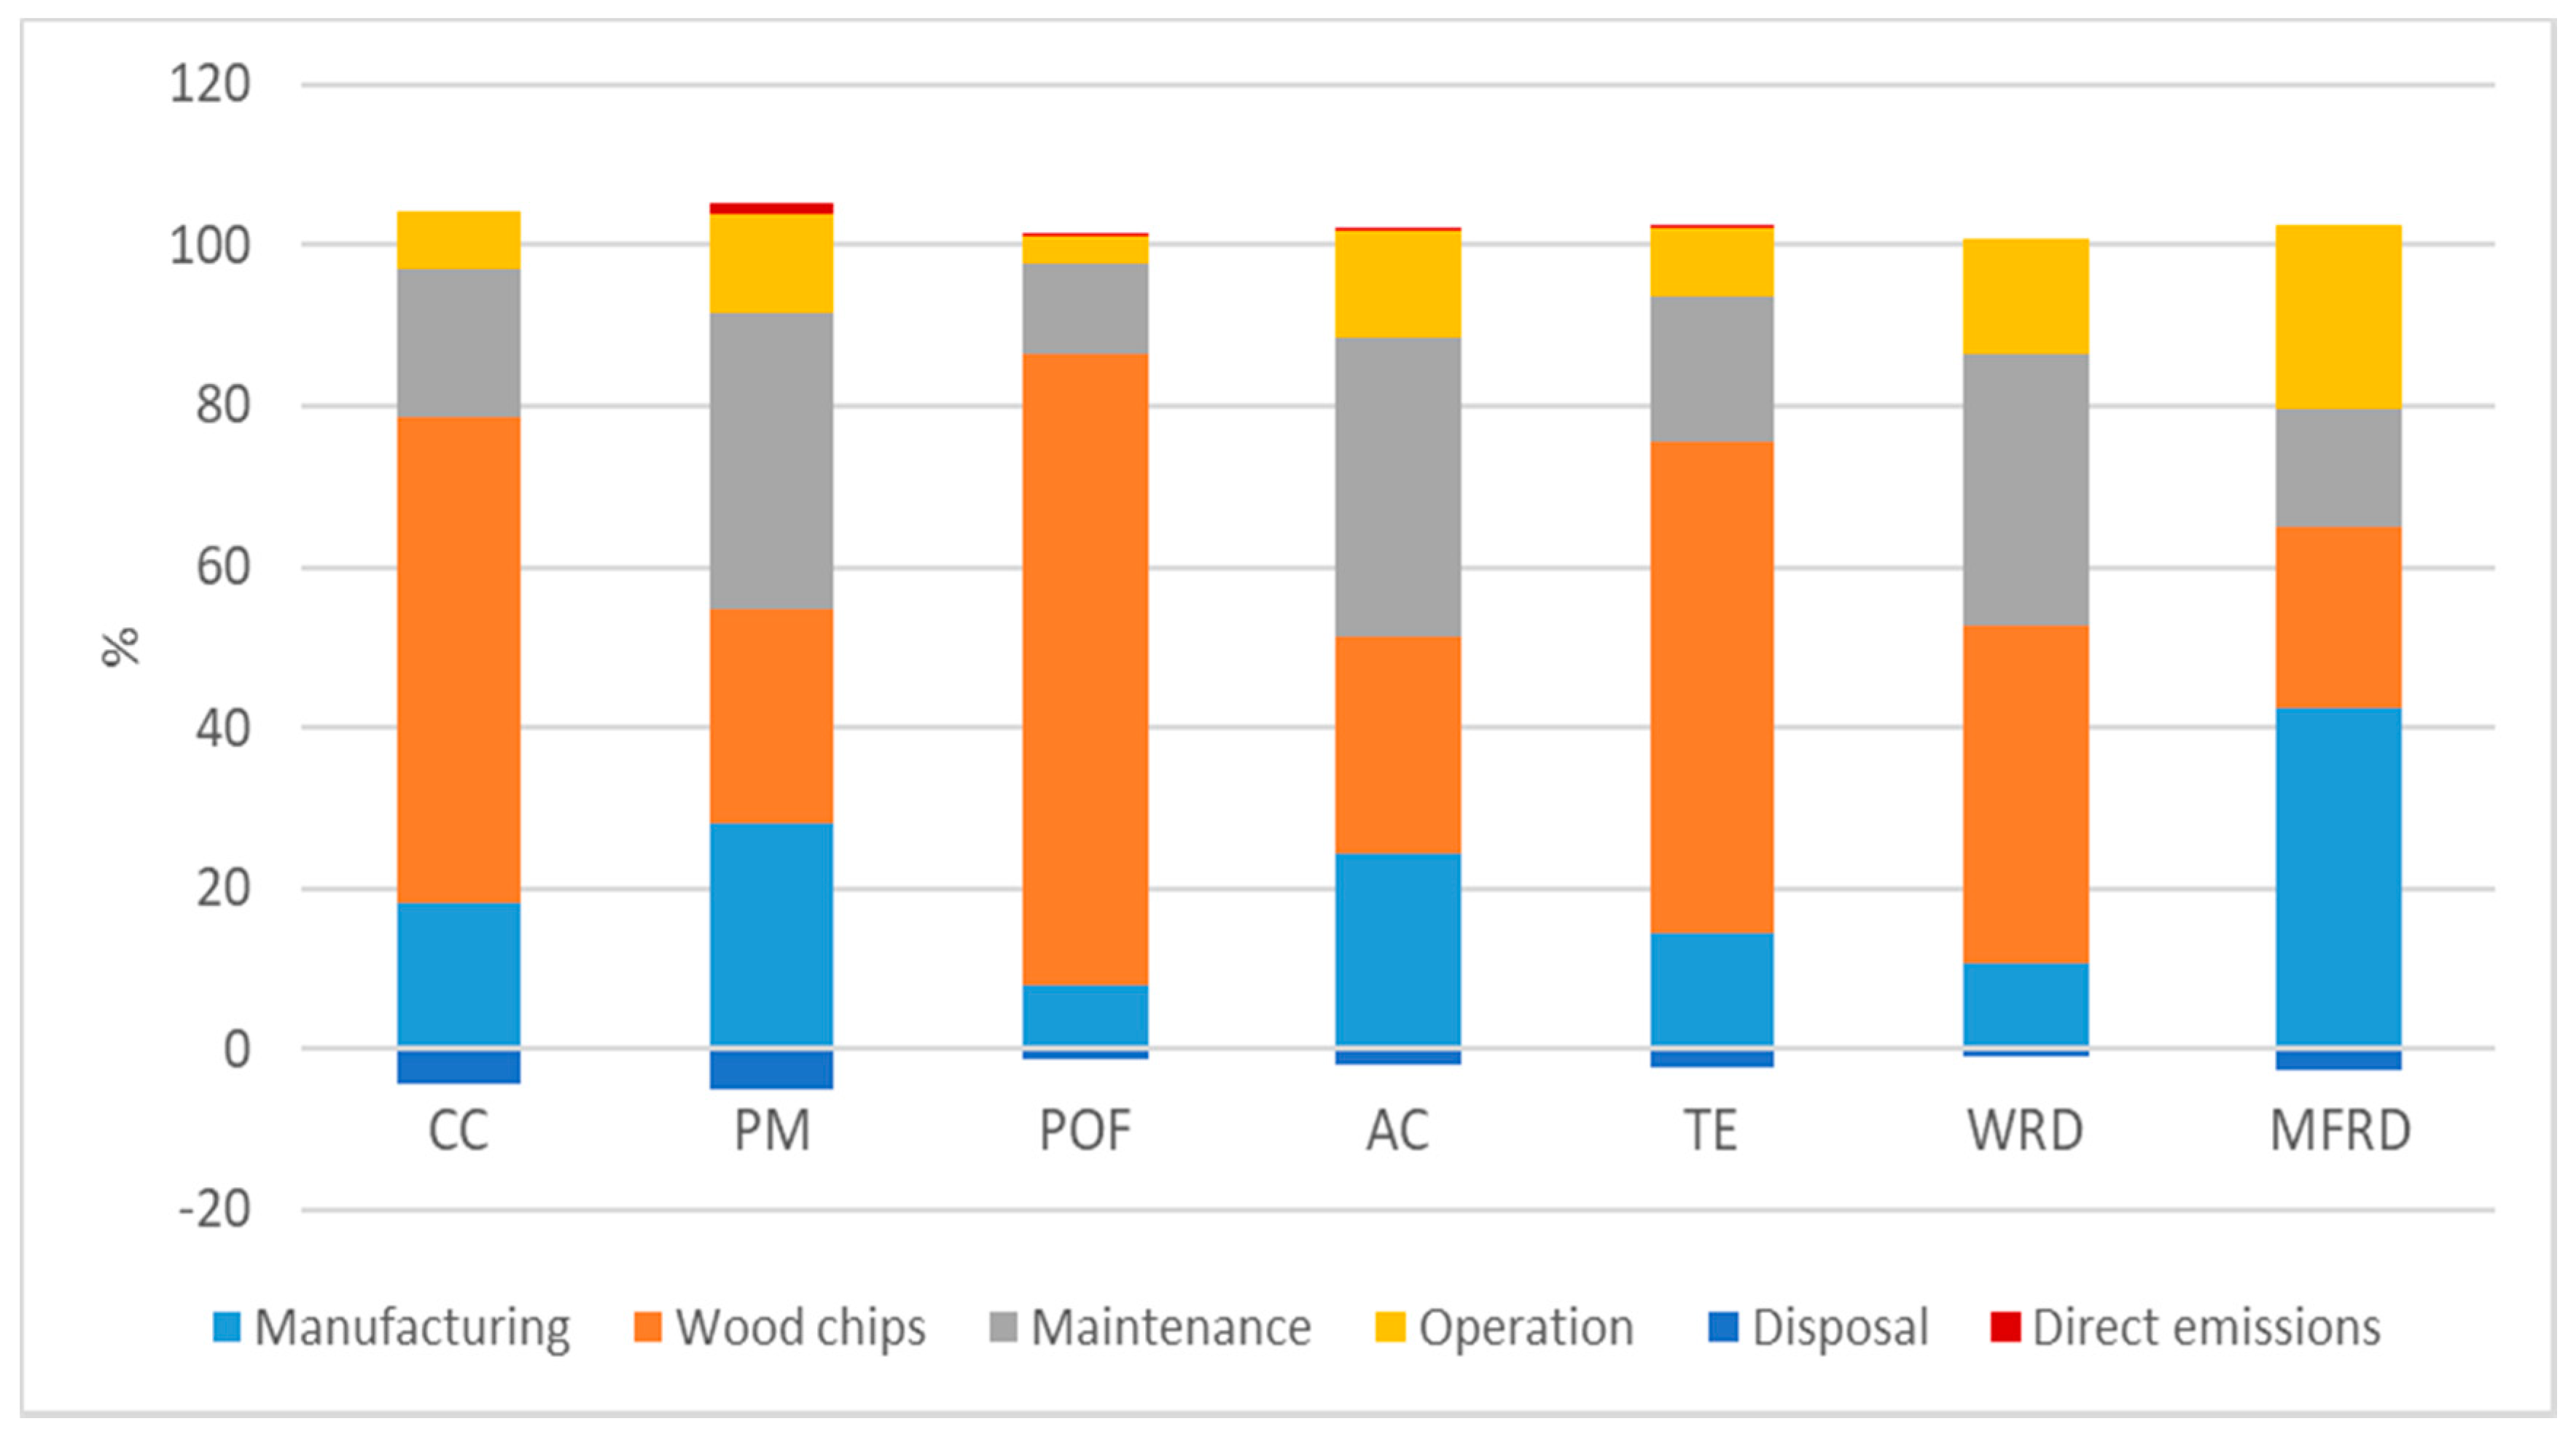
Figure 3 shows the breakdown of the impact of the HBP technology for the seven investigated impact categories (see Appendix A for absolute values).
The main contributions to the cradle to grave environmental impact are the wood chips used, followed by the maintenance phase and manufacturing phase. The impact of wood chips is made of two components i.e., their transportation and their production. The impact of transporting wood chips (based on the Swiss supply chain assumed by the dataset retrieved from ecoinvent) represents 18–27% of the impact of wood chips for all impact categories, except for photochemical ozone formation (9%) and water depletion (2%). In all impact categories, except water depletion, the impact of the production of wood chips is mainly caused by the production and combustion of diesel and petrol (60–80%) used in power sawing machines, skidders, and chippers. The production of the lubricants used in the three processes mentioned above causes about 2–10% of the impact of wood chips production in all impact categories except for water resource depletion for which it represents 80% of the impact. The water depletion impact of wood chips is mainly due to the fraction of vegetable oils used for lubricating the chains during power sawing activities (in absolute terms, this impact is quite low, see figures in Section 3.1.2 and Section 3.2.2).
The main impact of the manufacturing stage is due to the production of the SOFC system, which contributes to 63–100% of the impacts in this stage (depending on the category). Within the SOFC system, the production of the SOFC stack and the inverter are the main sources of impact. This is mainly due to the large electricity consumption during the manufacturing of the stack (as also highlighted by Rillo et al. [17]) and the manufacturing of chromium steel (mainly caused by the production of ferrochrome [17]).
Concerning the maintenance impacts, the maintenance of the SOFC system contributes to 63–100% of the impact depending on the impact category. The major contributor (95–99%) to the impact of the maintenance of the SOFC system is the replacement of the SOFC stack, which requires the production of a new SOFC stack every five years of operations.
The operation phase is dominated by the operation of the GCU (mainly zinc oxide used and sodium bicarbonate) expect for water depletion whose impact is mainly caused by the water used for the operation of the gasifier. The contribution of direct emissions is negligible in all impact categories. The particulate matter caused by the operation of the HBP technology was only 1% of the total particulate matter impact.

3.1.2. Alternative Scenarios (Wood and Miscanthus Pellets)

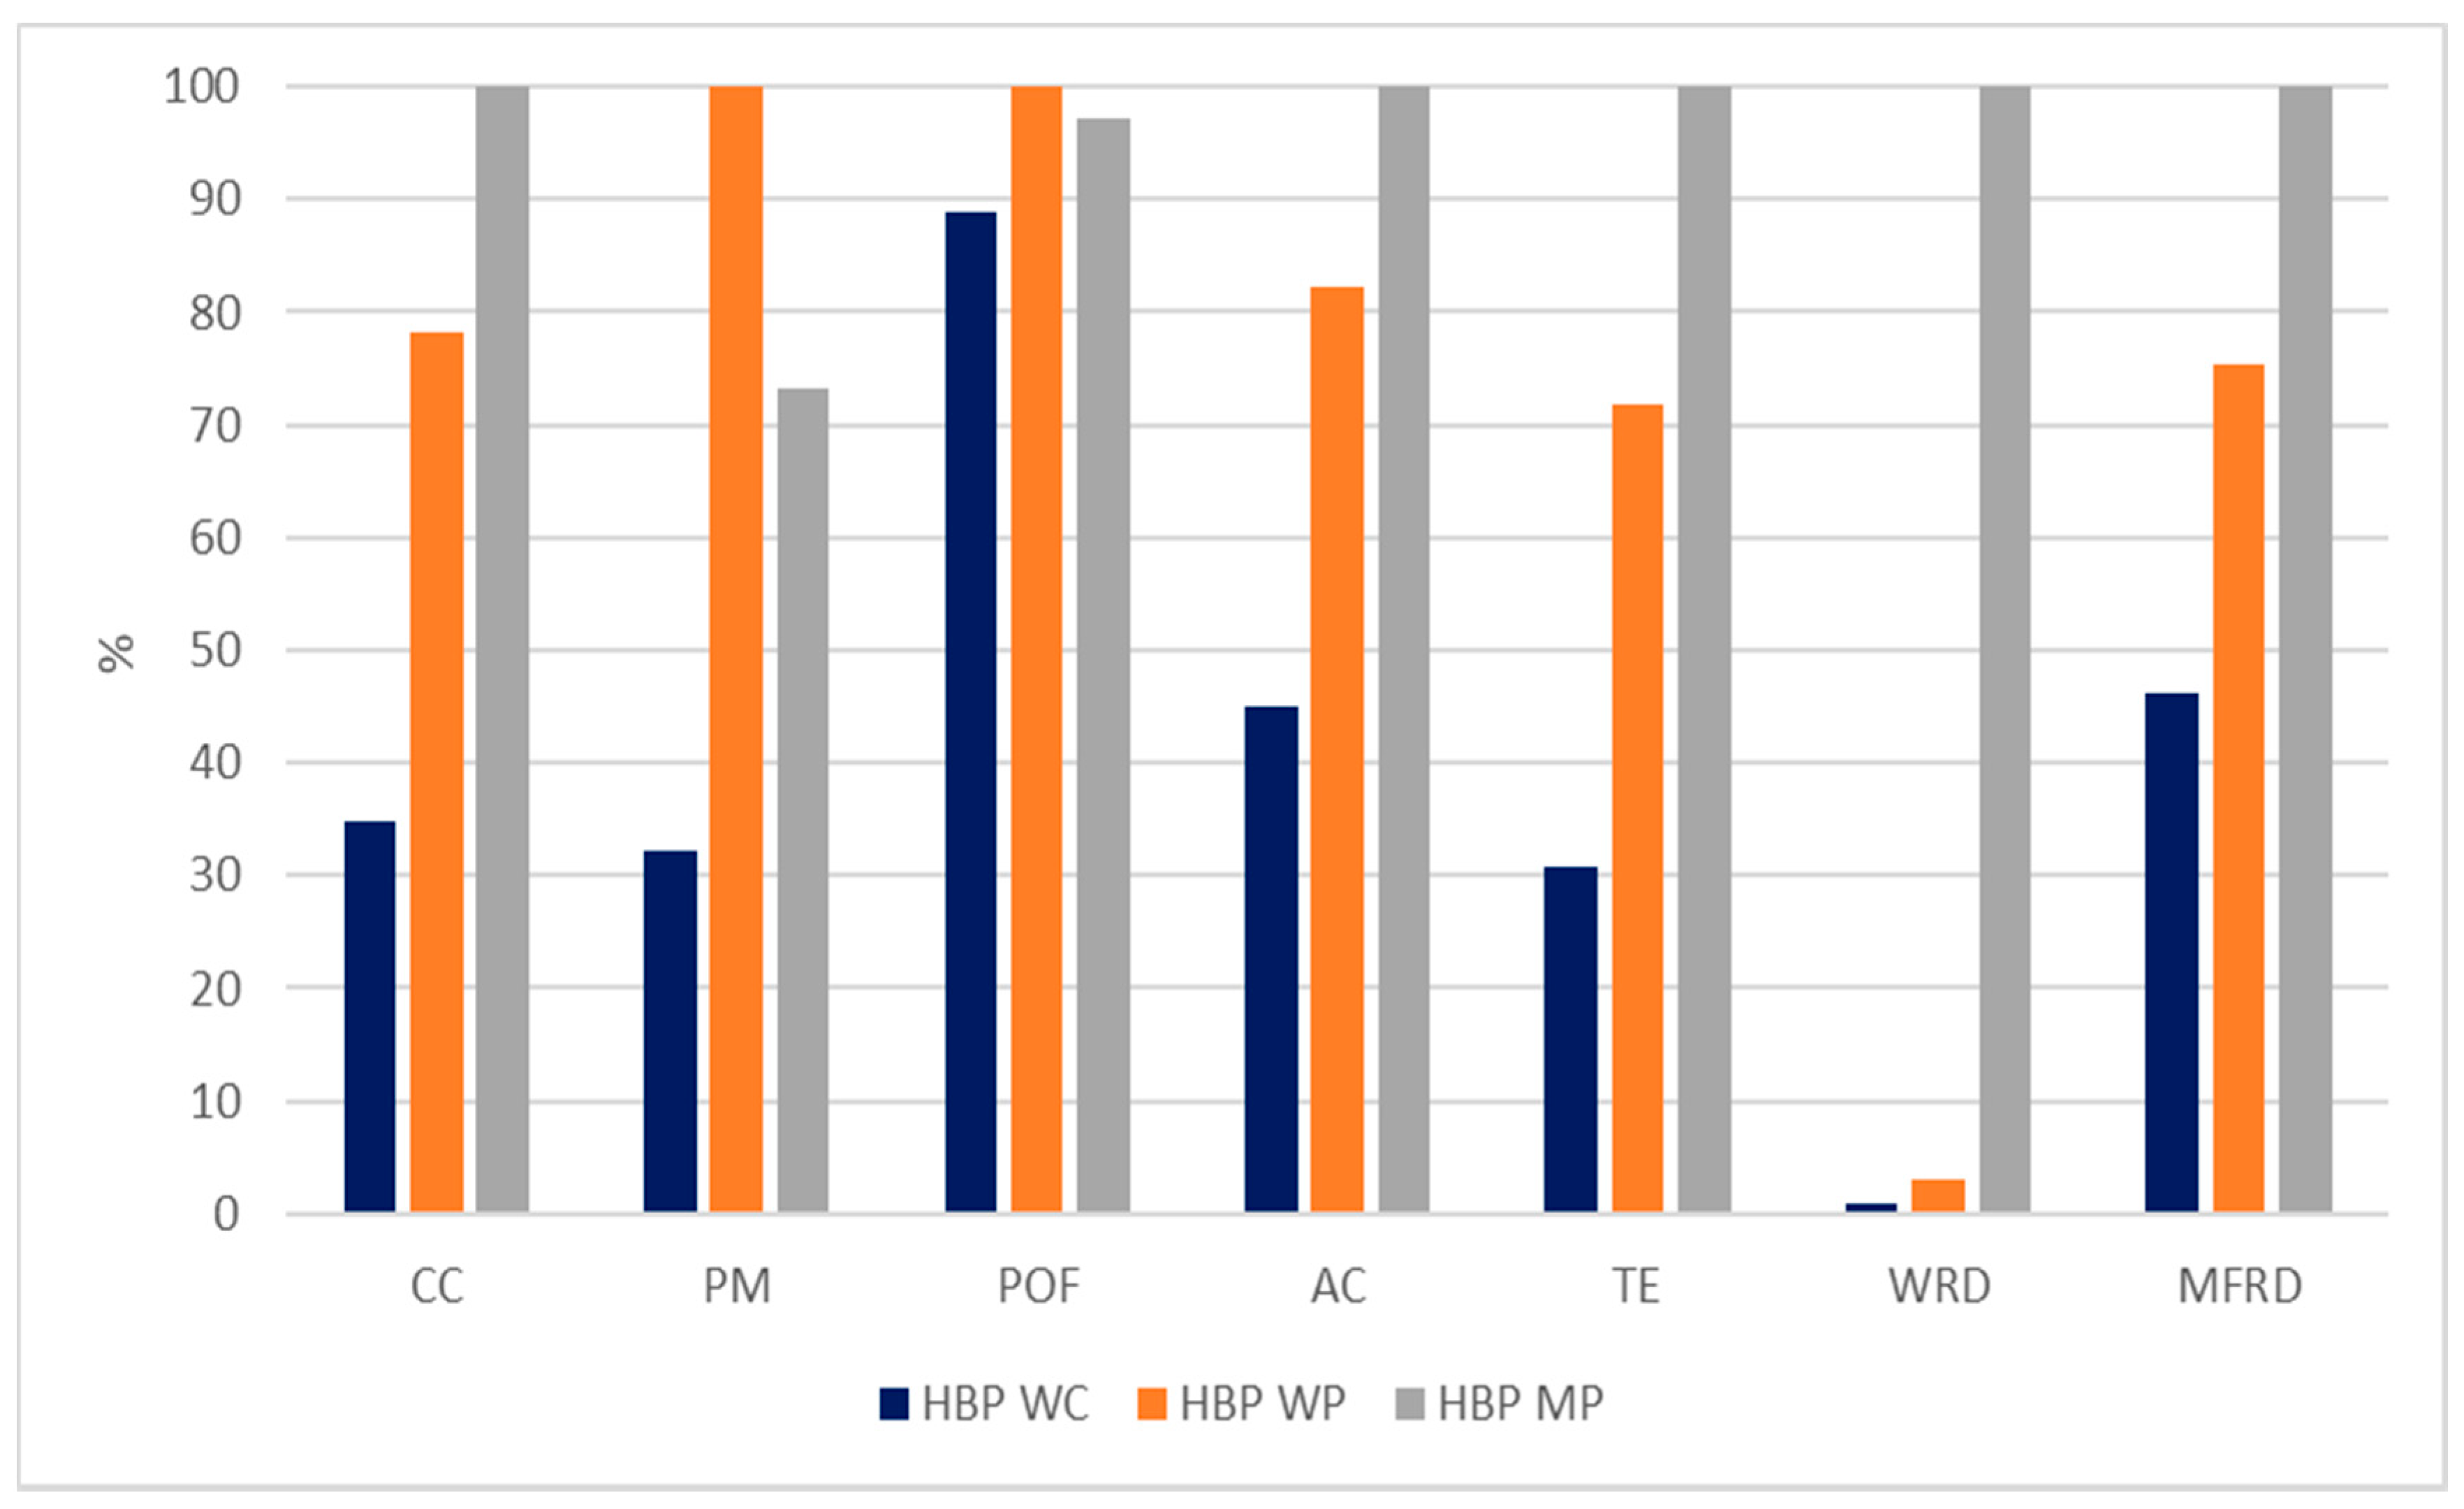
Figure 4 shows the environmental impact of the baseline scenario in comparison to the alternative scenarios.
The results show that, in all impact categories, the total life cycle impact is the lowest for the operation with wood chips compared to the other two biomass scenarios (wood pellets and Miscanthus pellets). Since the inventories for manufacturing and maintenance are the same, the main difference between the three scenarios is the production of the biomass fuel (wood chips have lower environmental impacts than the two pellets).
The impact of the WC scenario is between 10% and 70% lower than for the WP scenario (with the highest impact difference for water depletion and particulate matter). For water depletion, the impact of wood pellets is almost entirely caused by the electricity consumption of the pellet factory. For particulate matter, the shaving process accounts for about 54% of the impact of producing wood pellets. Shaving is, therefore, the main cause of the significantly higher particulate matter impact in the production of wood pellets compared to wood chips. The impact of shaving is mainly caused by its drying process (87%), which leads to high particulate emissions due to the combustion of industrial wood.
Except for particulate matter and photochemical oxidant formation, the Miscanthus scenario presents higher environmental impacts than the wood pellets scenario. The characterized results indicate between 18% and 28% lower impacts for the wood pellets scenario than for the Miscanthus scenario in the categories of acidification, climate change, resource depletion (mineral, fossil, and renewables), and terrestrial eutrophication. The particulate matter impact is lower (−27%) in the case of Miscanthus pellets because the shaving process, which was the main source of impact for wood pellets, is not used to produce Miscanthus pellets.
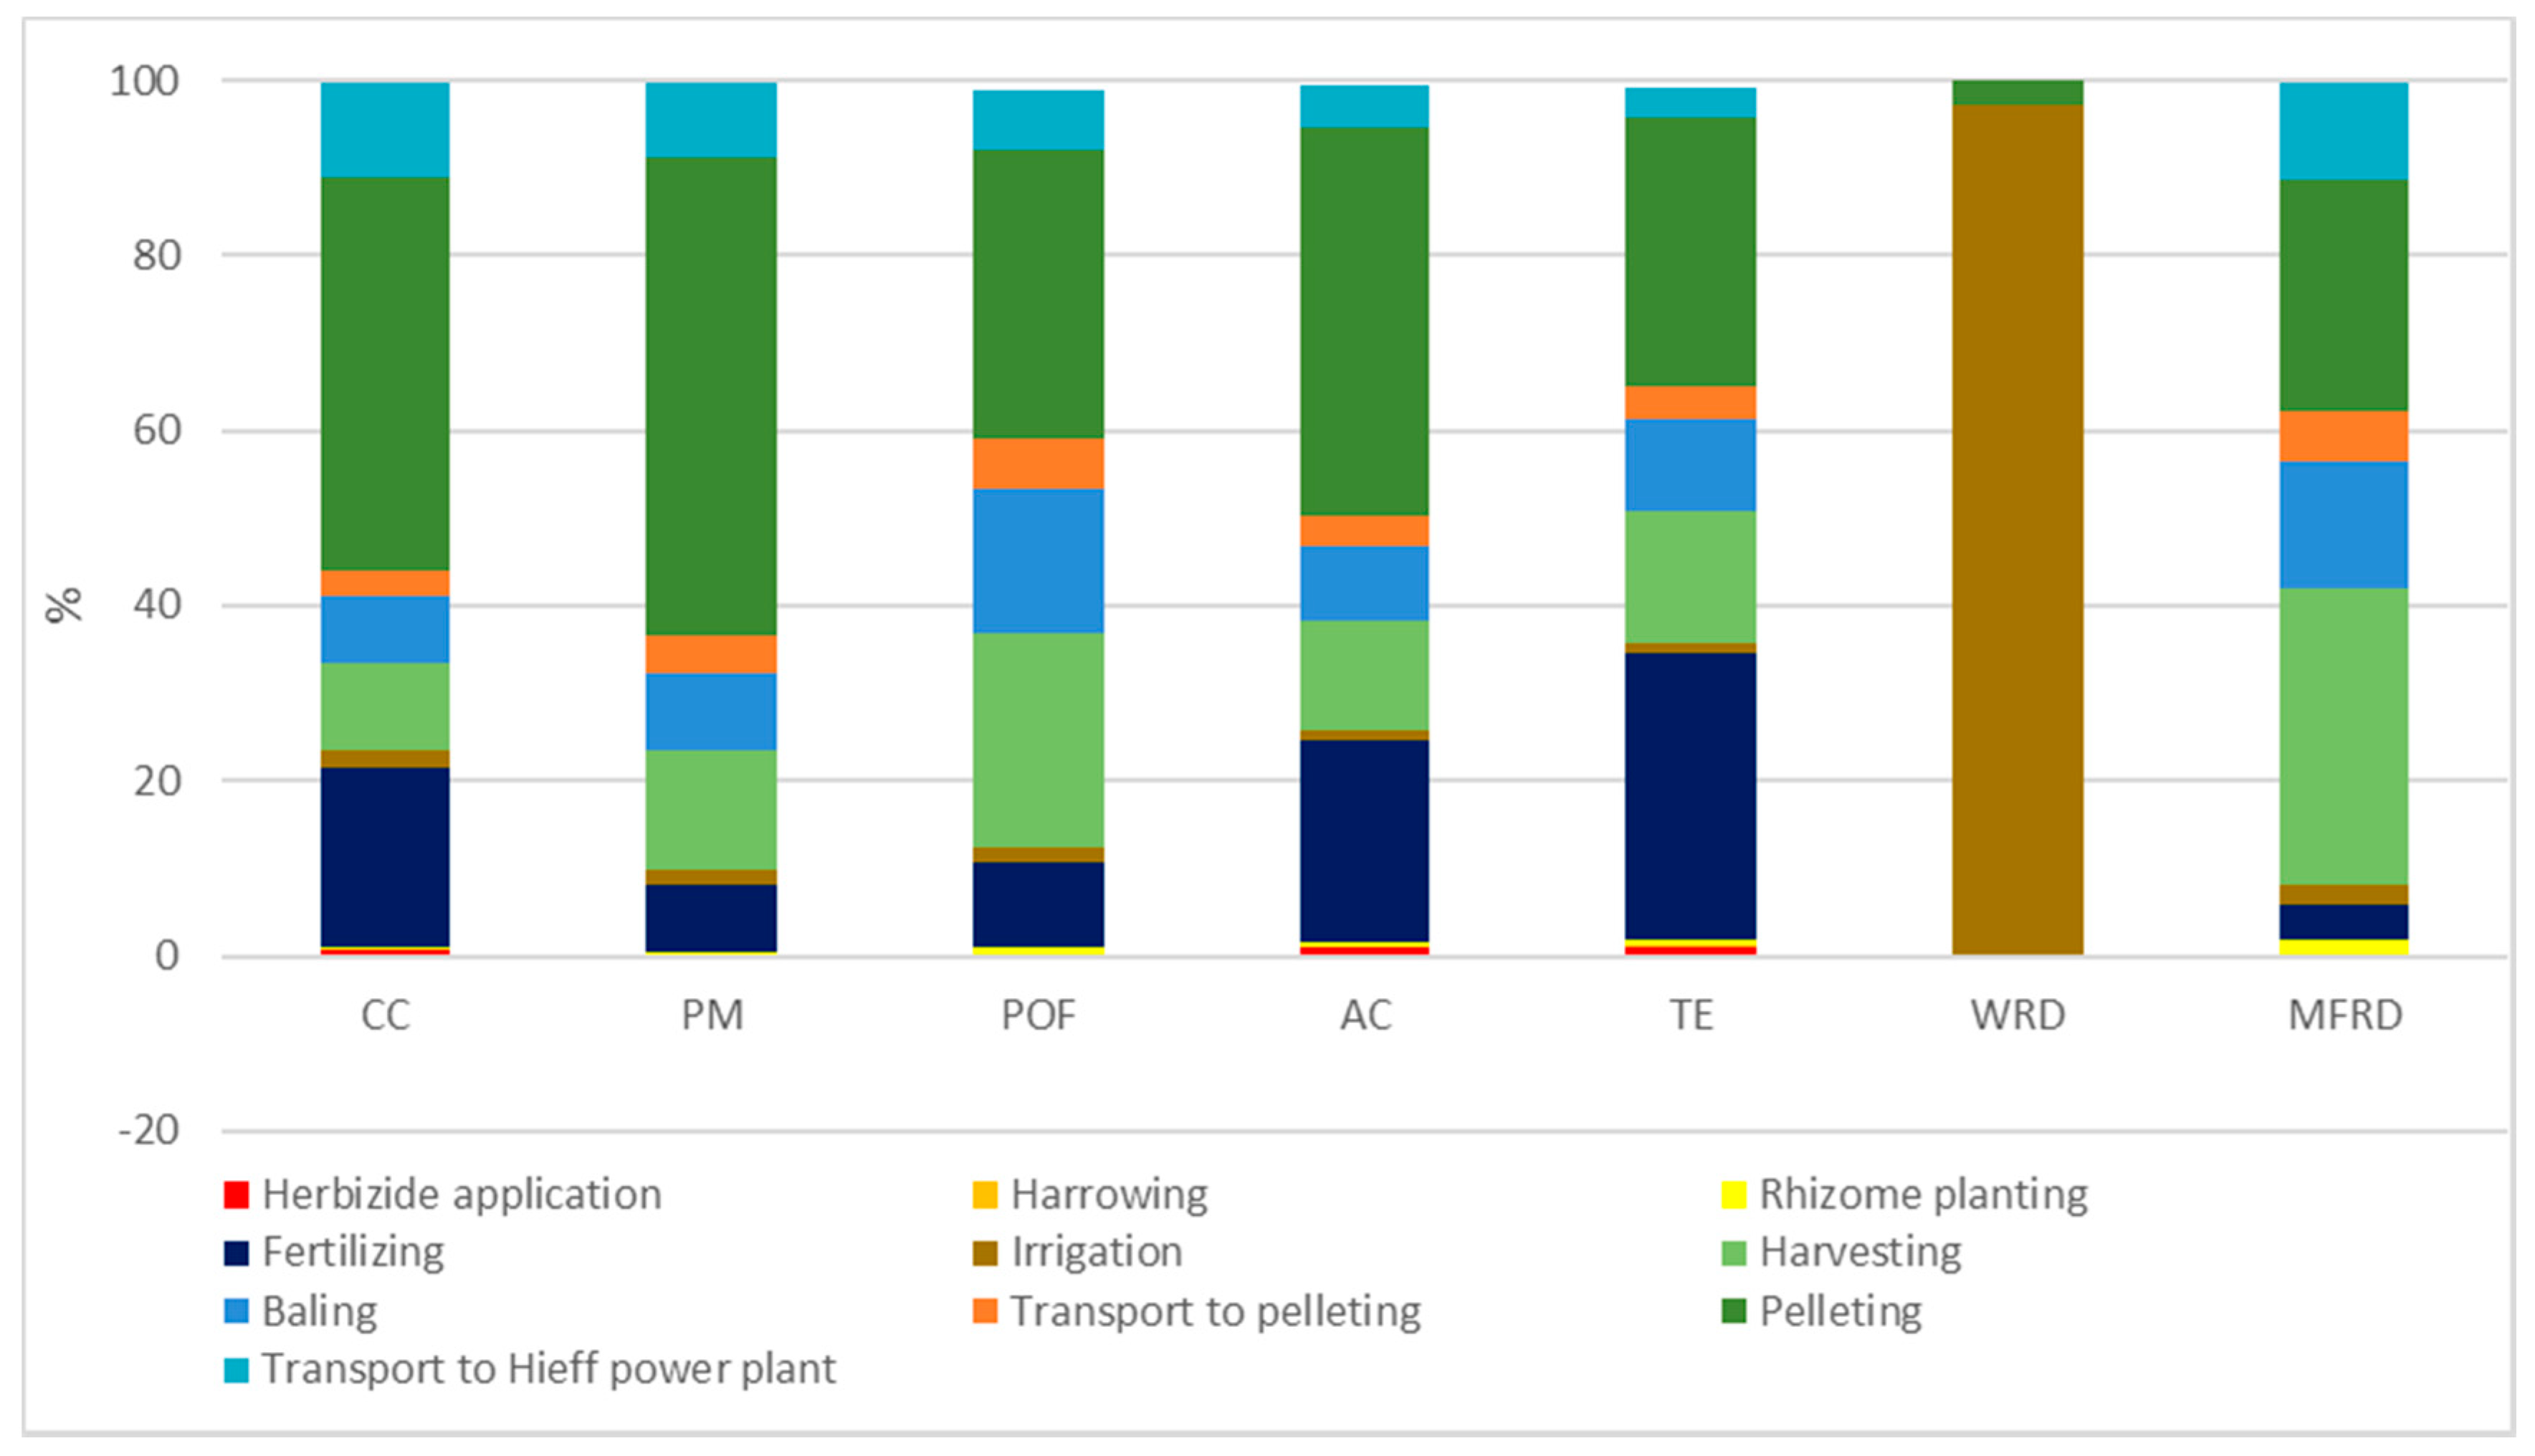
The difference in impact is even higher for the water depletion category, which scores 97% lower in the wood pellets scenario than in the Miscanthus pellets scenario. The irrigation needed during its cultivation is the main cause of the significantly higher water depletion in the scenario with Miscanthus pellets (see Figure 5). Other activities that are an important source of impacts for Miscanthus pellets are the electricity for pelleting, the diesel burnt during the harvesting stage and the emissions caused by fertilizing (see Figure 5 for the single contributions in each impact category).
Similar to the baseline case of wood chips, direct emissions have a negligible impact on the operation with wood pellets and Miscanthus pellets. This aspect is particularly important in the case of biomass technologies installed in heavily populated areas.
As Miscanthus is an energy crop, it is important to assess the impacts due to land use. As for the other impact categories, the selection of the method was based on ILCD recommendations [26]. Accordingly, the carbon deficit caused by land use was assessed using the Soil Organic Matter model of [49]. This model accounts for the changes in soil quality caused by the occupation and transformation of the land. Land occupation generates changes in soil quality which depend on the amount of area occupied and the duration of such an occupation. Land transformation generates changes in soil quality which depend on the extent of changes in land properties and the area affected. In this model, the deficits in soil organic matter content are assessed and expressed by an indicator whose unit is kilograms of carbon deficit. These deficits are caused by the effects of agricultural practices on degradation rates. The changes can also be additions of soil organic matter. For example, these additions can be caused by the application of manure or crop residues. It should be observed that this modelling of land use impacts does not account for the counterfactual effects caused by land use changes modelled in consequential LCAs of bioenergy.
The production of 1 MJ of heat using Miscanthus pellets generates a 0.86 kg C deficit. Such an impact is much higher than for 1 MJ of heat generated using wood chips (0.12 kg C deficit) and using wood pellets (0.13 kg C deficit). The reason is that Miscanthus is an energy crop. Hence, differently from the feedstock for wood chips and pellets, it requires dedicated cultivation.

3.2. Benchmarking with Competing Technologies

3.2.1. Comparison with ORC Technology (Both Fueled with Wood Chips)

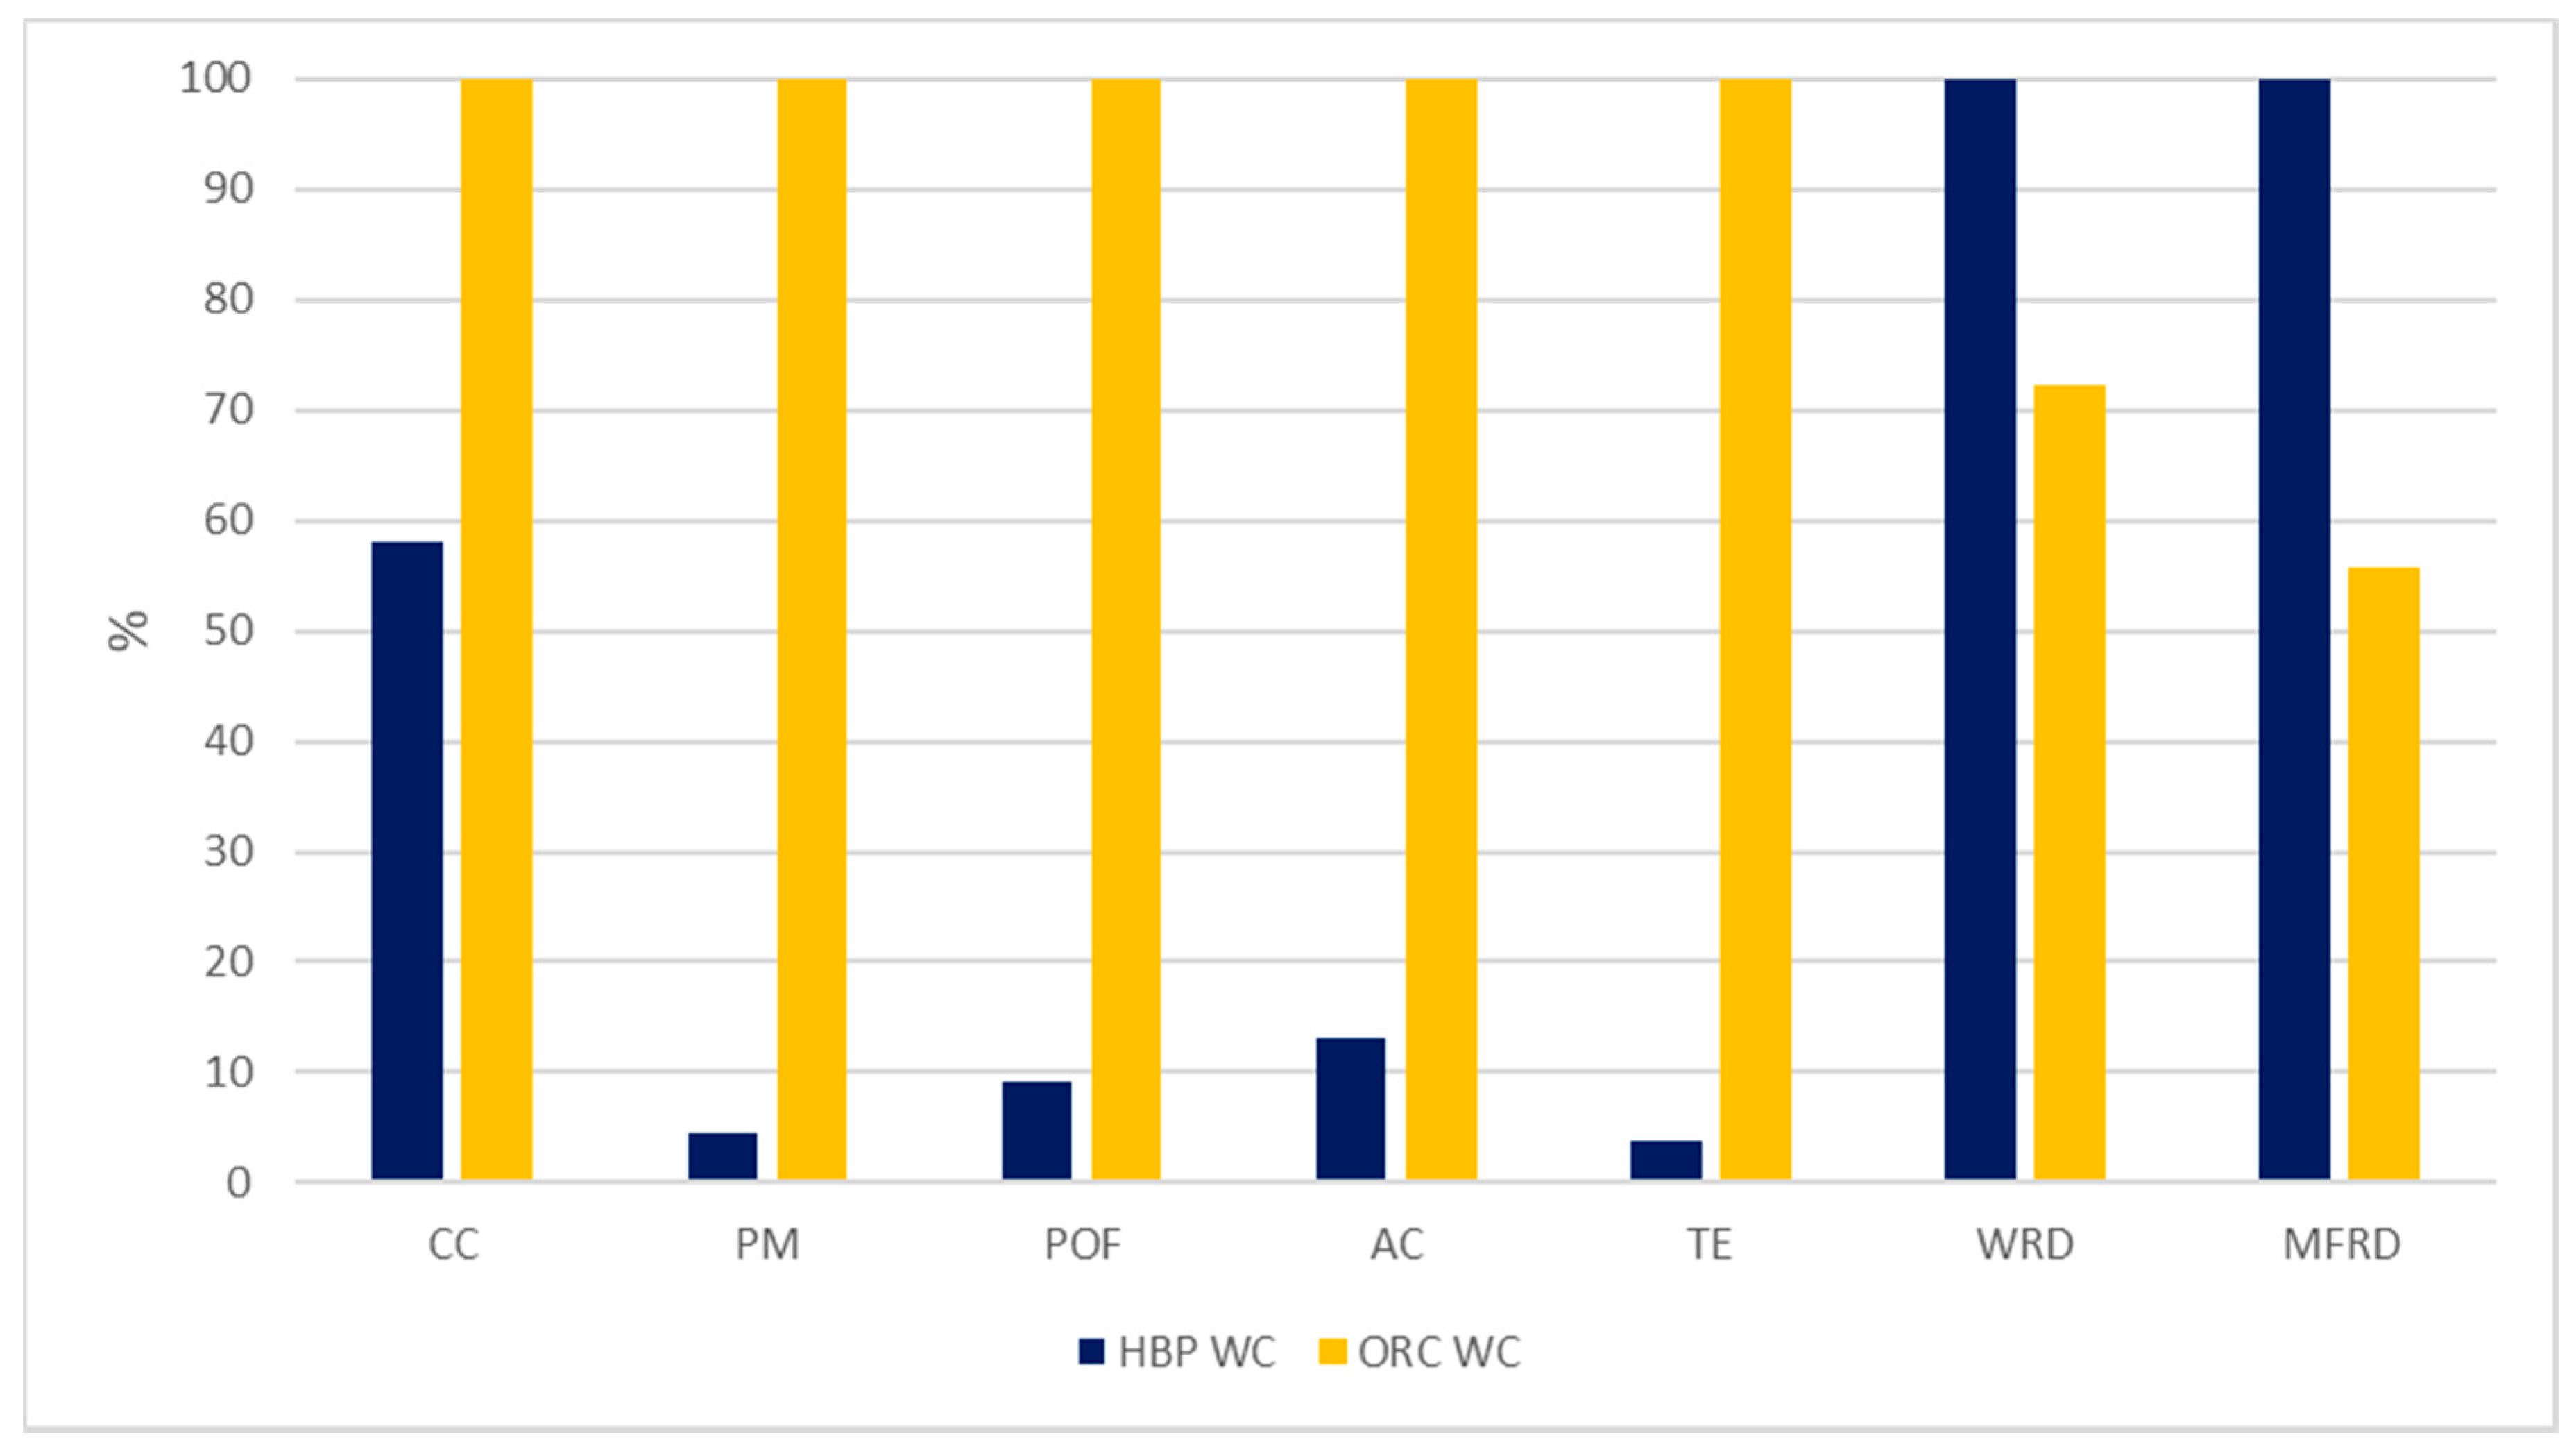
Figure 6 shows the comparison between HBP technology and ORC technology both fueled with wood chips.
Compared to the same amount of heat produced by the ORC technology, the heat co-generated by the HBP technology shows lower environmental impact in terms of climate change (−42%) and much lower impact (−87%/−96%) in terms of particulate matter, photochemical ozone formation, acidification and terrestrial eutrophication. These differences can be explained by two main advantages of the HBP technology: (1) the HBP has higher energy and exergy efficiencies, and therefore less biomass is needed for producing the same amount of energy and exergy as outputs and (2) HBP avoids the external combustion of biomass occurring in the ORCs, and therefore releases less particulate emissions (the particulate matter impact of the ORC technology is for 97% caused by direct emissions of particulates). Although HBP technology has the same thermal efficiency as the ORC technology, its electric efficiency is three times higher. On the other hand, the HBP technology shows higher water depletion (+38%) and resource depletion (+79%). For water depletion, the high impact is caused by the replacements of the SOFC stack. For depletion of resources (minerals, fossil, and renewables), the main cause can be found in the production of the SOFC stacks. All these components are not present in the case of an ORC.
Similar results were obtained when comparing electricity production from HBP and ORC. The HBP shows lower impacts for climate change (−45%), particulate matter (−96%), photochemical ozone formation (−91%), acidification (−88%) and terrestrial eutrophication (−96%). On the other hand, the HBP technology shows an increased impact in terms of water (+31%) and depletion of resources (MFRD) +70%.

3.2.2. Comparison with Conventional Production of Heat and Electricity

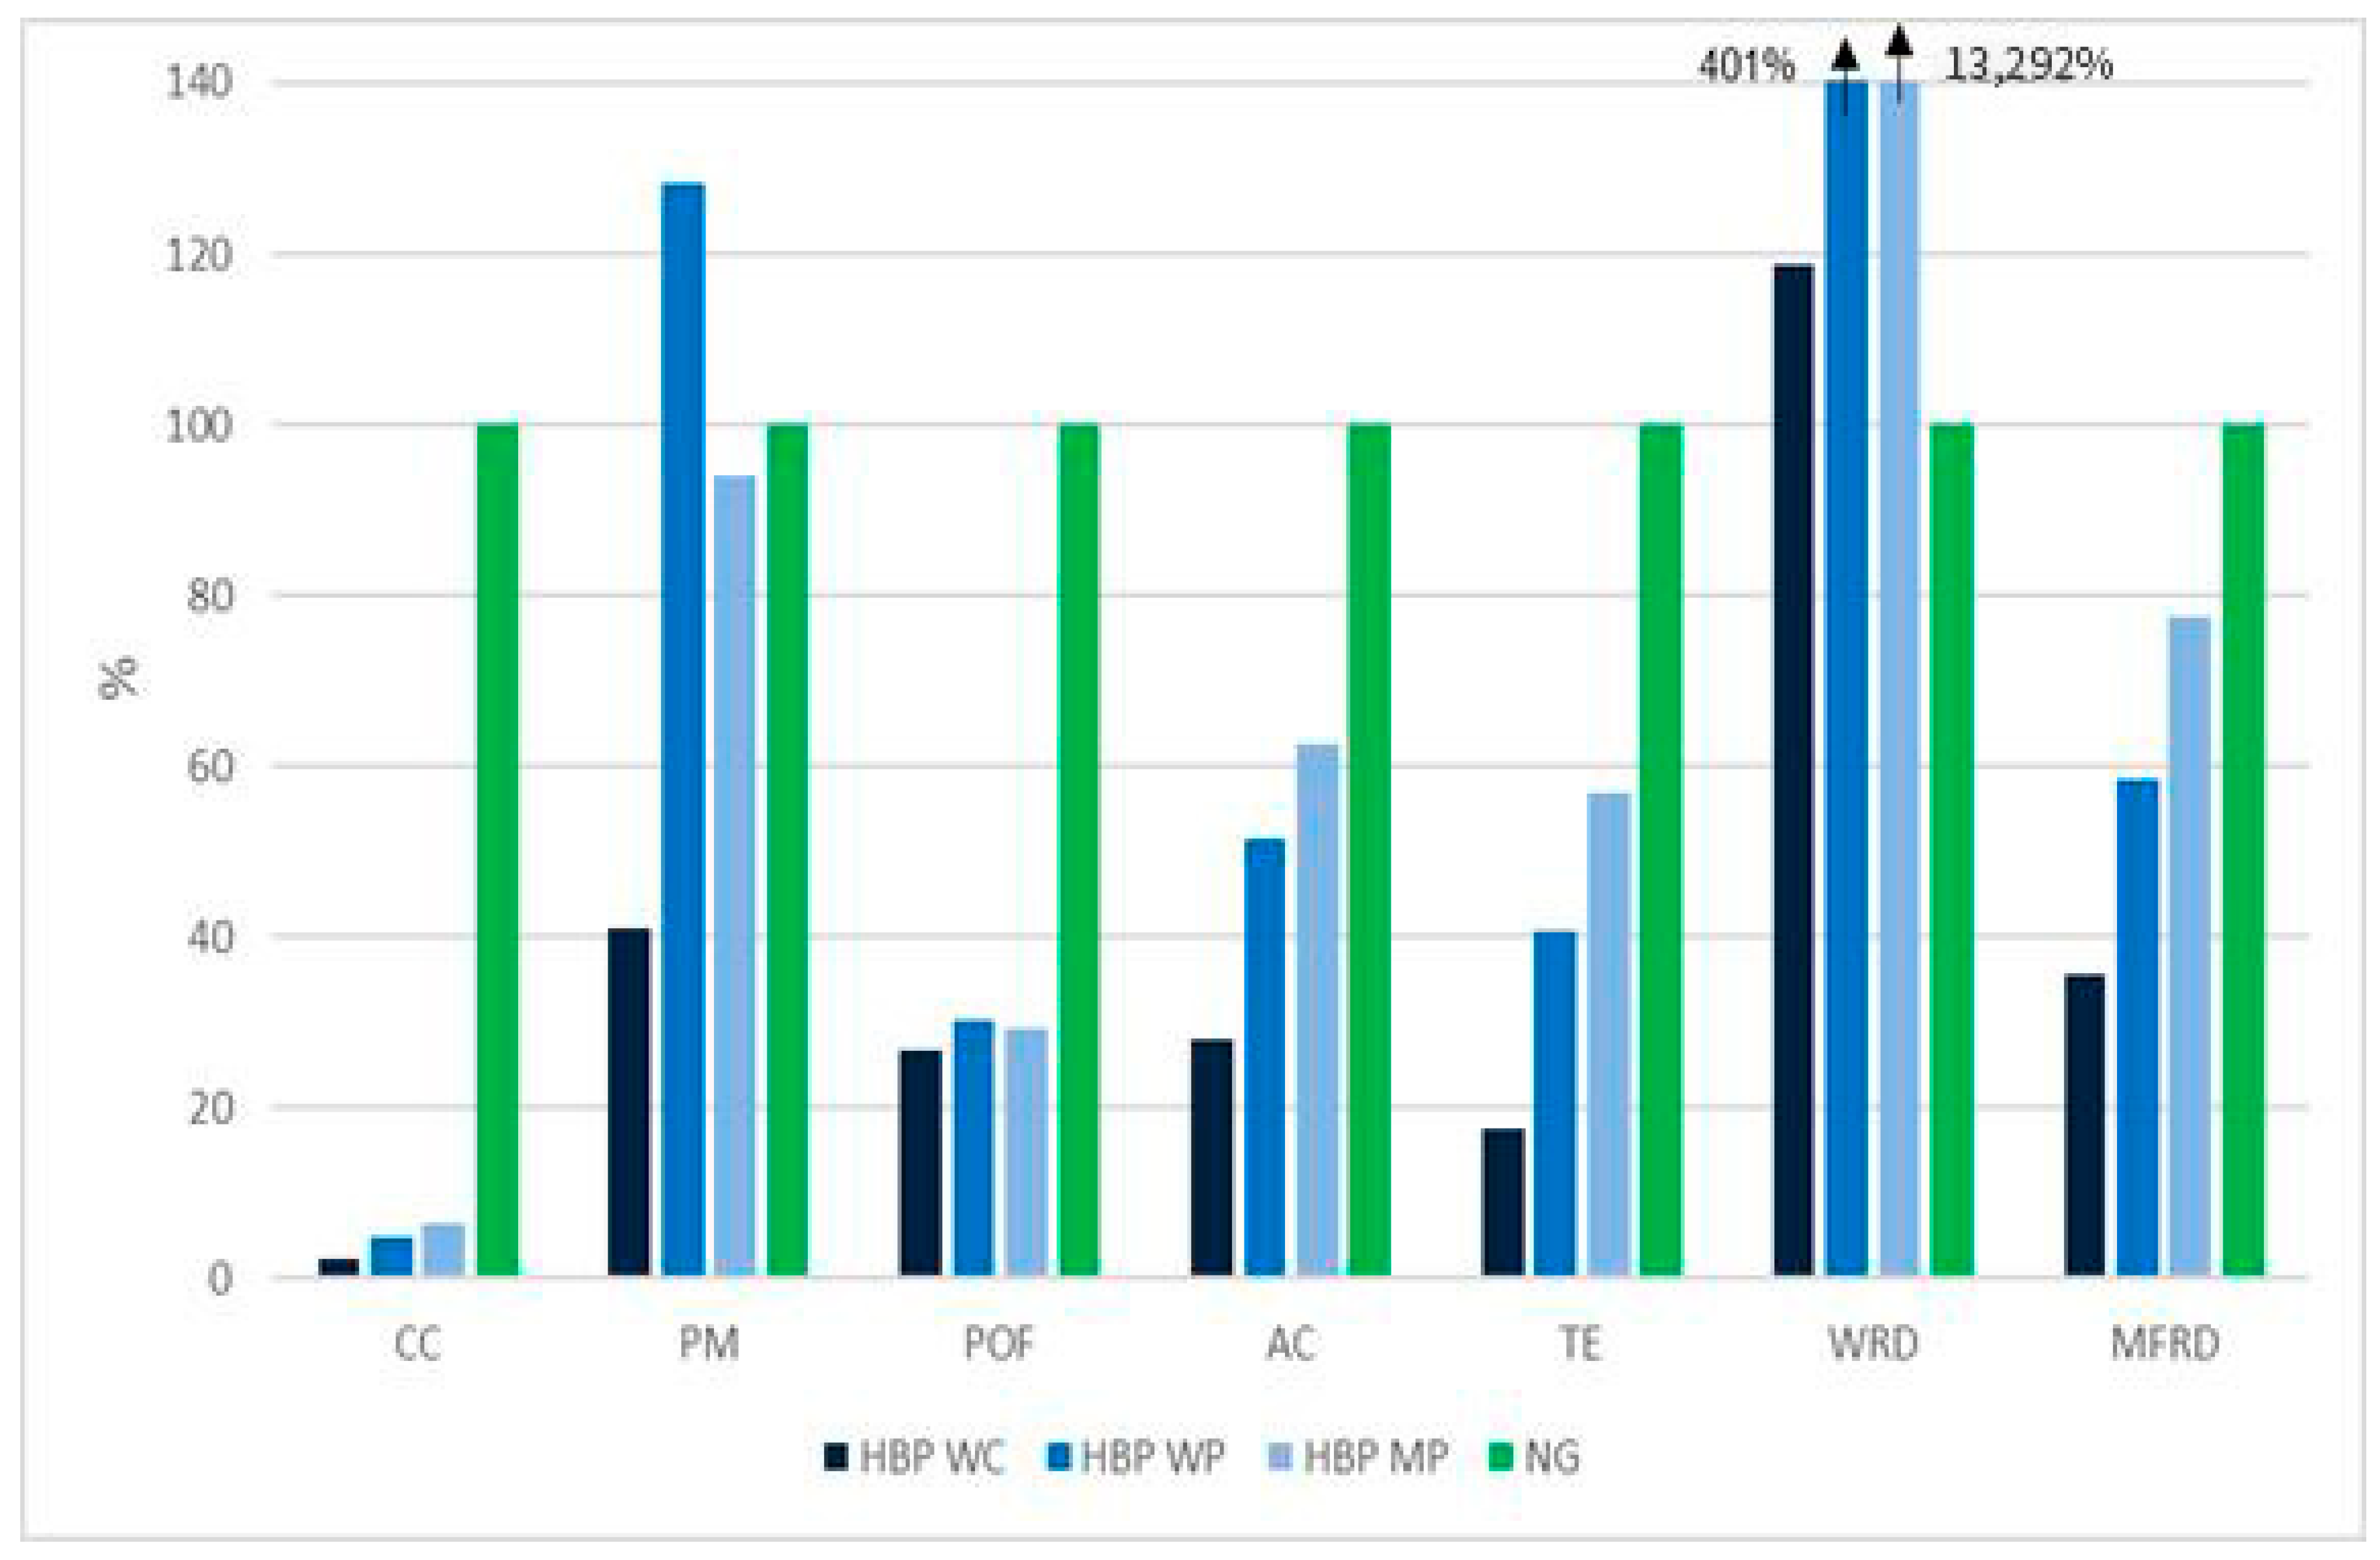
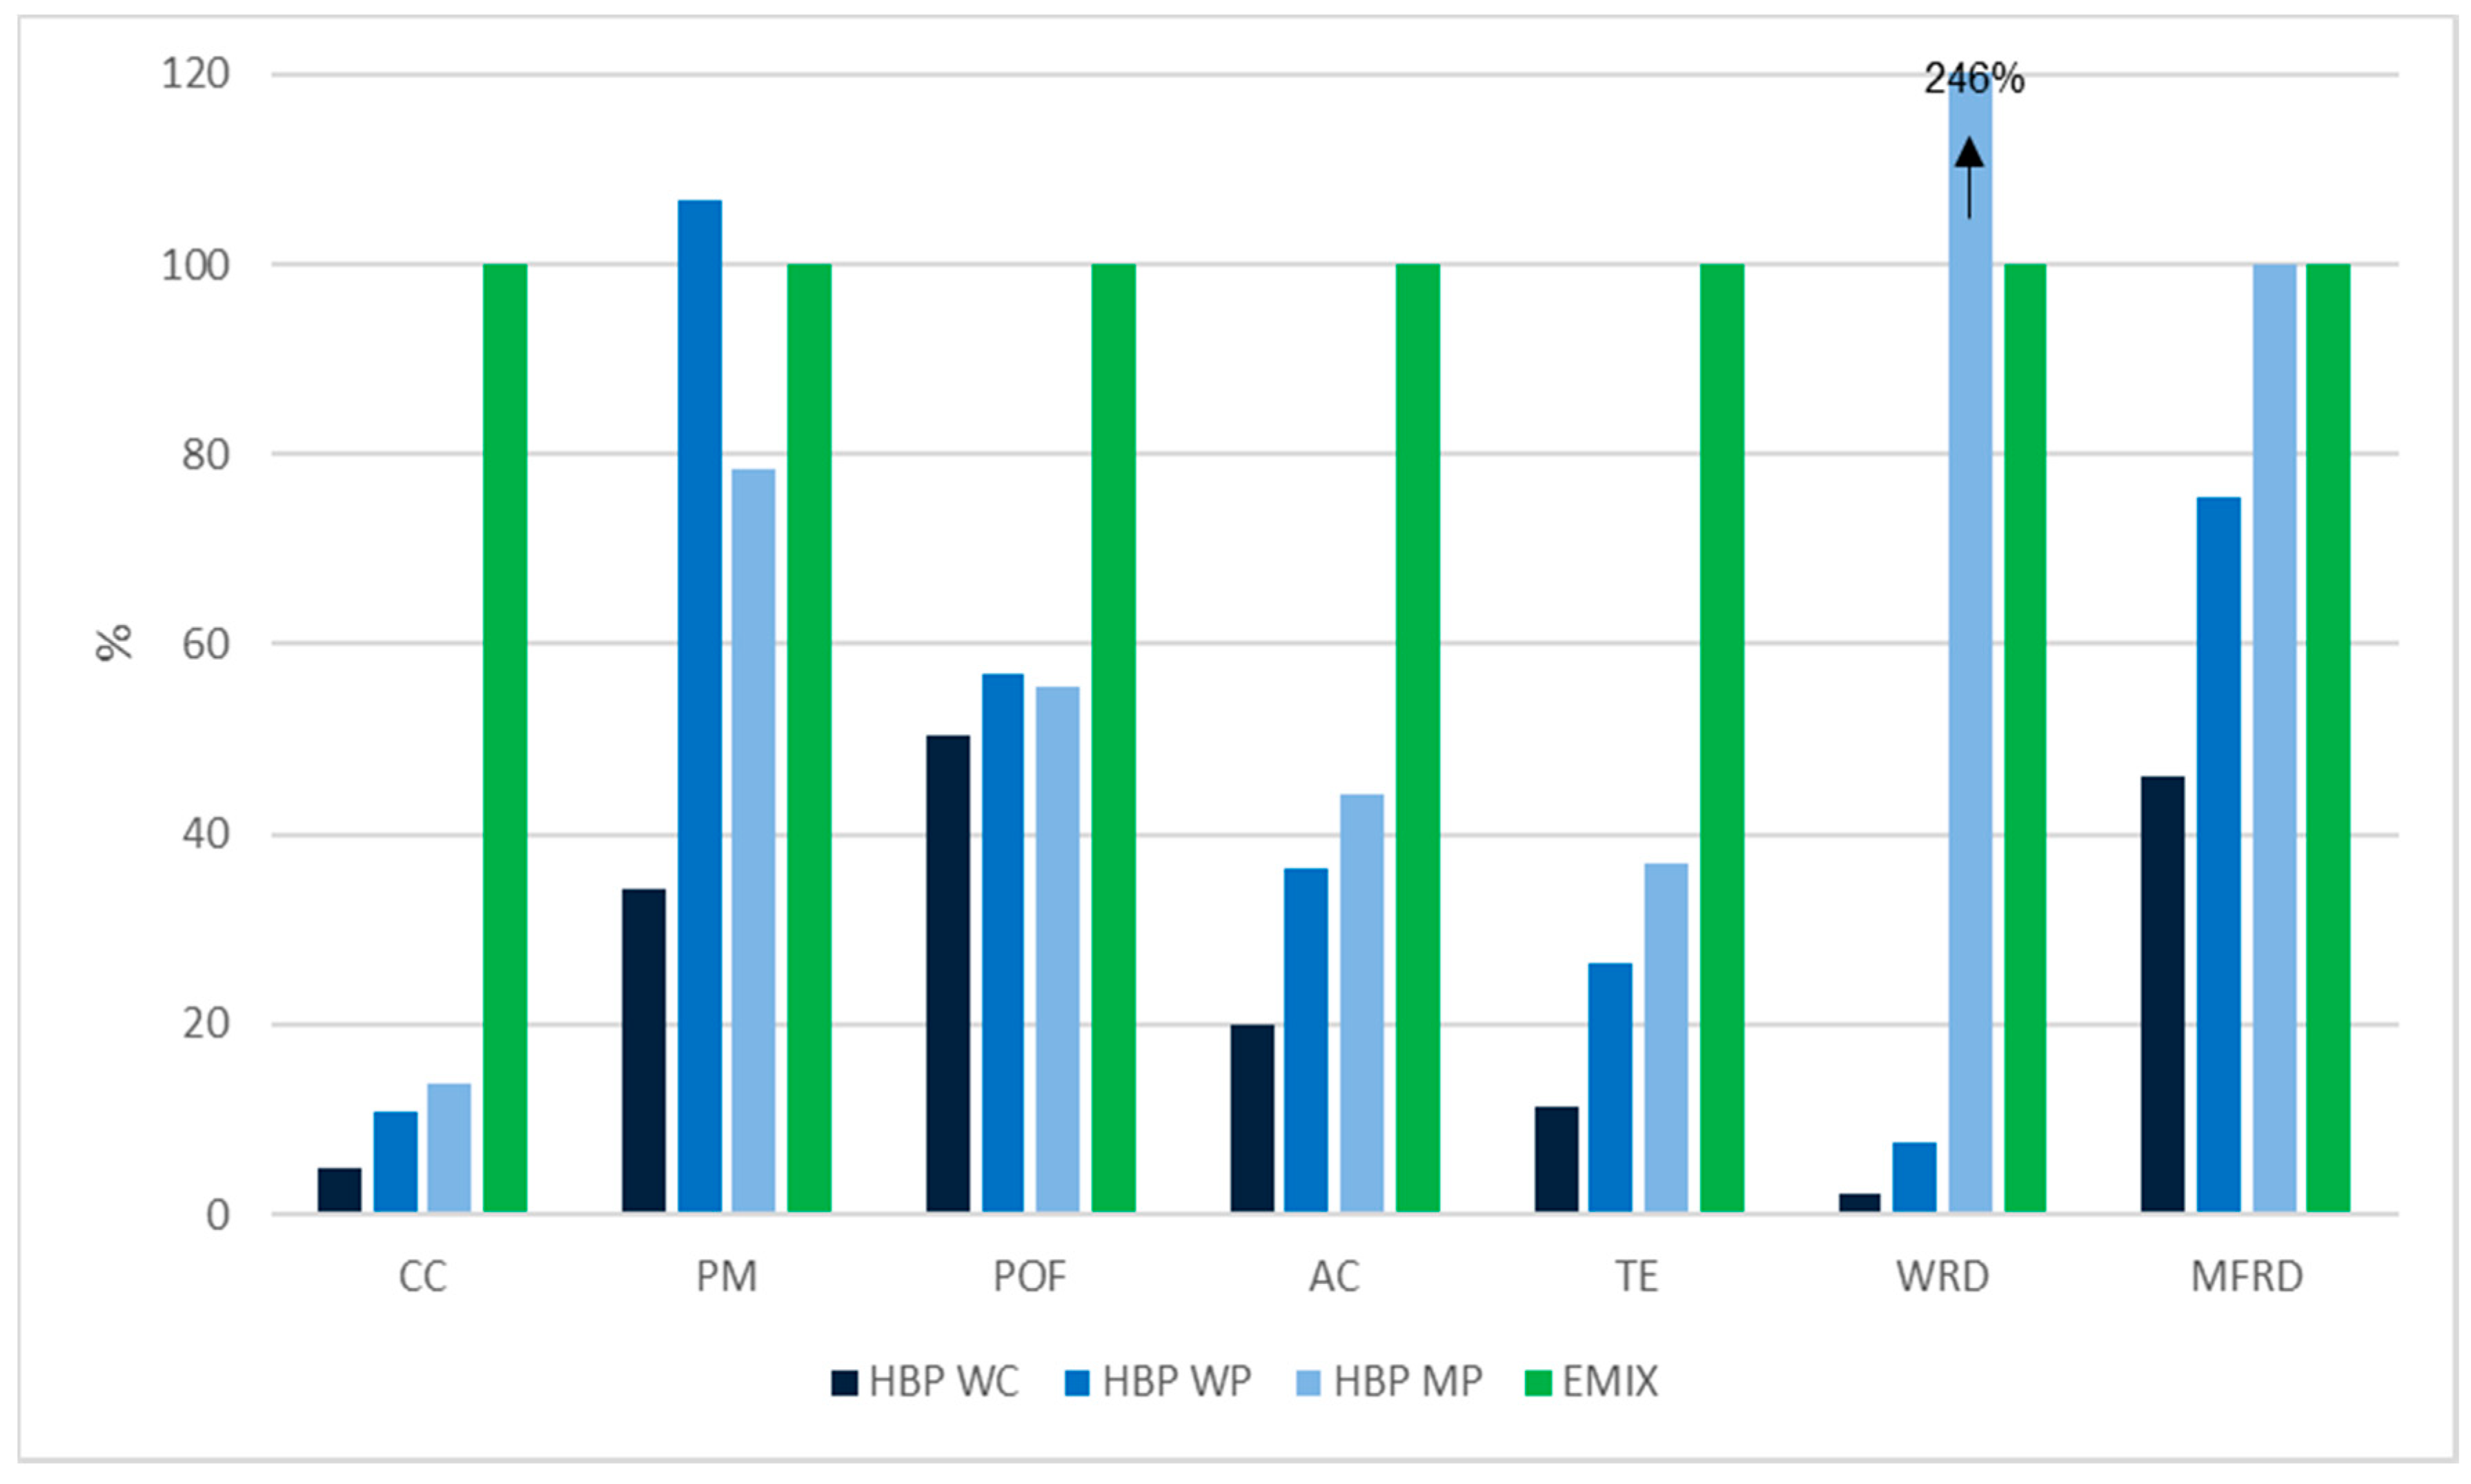
Figure 7 and Figure 8 show the comparison between the HBP technology operating with the three investigated biomass fuels and conventional separate productions of heat and electricity.
The heat co-generated by the HBP technology shows a lower environmental impact compared to the heat produced by a condensing boiler burning natural gas. Even considering the least preferred fuel scenario in each impact category, the impact differences are at least −94% in terms of climate change, −70% in photochemical ozone formation, −37% in acidification, −43% in terrestrial eutrophication and −22% in depletion of resources. In particular, the significant difference in climate change is mainly generated by the biogenic carbon dioxide emissions (which are assumed to be carbon neutral) instead of fossil ones.
On the other hand, the HBP technology causes +28% impacts in particulate matter in the WP scenario (caused by the high particulate matter released when producing wood pellets) and significantly higher water depletion for the MP scenario (+13,000%), due to the water used for irrigation in the cultivation of Miscanthus (the only scenario with irrigation). When wood chips are fed instead of pellets, the HBP shows a much lower impact in terms of particulate matter (−59%) but still a relatively higher impact in water depletion (+19%), due to indirect water consumption in different life cycle activities.
The electricity co-generated by HBP technology shows a lower environmental impact compared to electricity produced by the German electricity mix (EMIX). In particular, even considering the worst fuel scenario, the differences of impact are at least −86% for climate change, −43% for photochemical ozone formation, −56% for acidification and −63% for terrestrial eutrophication. Nevertheless, the HBP using wood pellets as fuel can lead to an increase in particulate matter (+7%). The HBP using Miscanthus pellets has much higher water resource depletion (+146%; caused by irrigation of Miscanthus) than the electricity from the grid mix. When operating with wood chips, the HBP shows a much lower impact than the EMIX, leading for example to −66% impacts in particulate matter, −98% in water depletion and −54% in depletion of resources (MFRD).

3.2.3. Comparing with Other LCAs of SOFC CHPs

In the literature, 8 LCAs of SOFC CHPs have been conducted along with a review of LCAs on SOFC systems. In most of these LCAs, the fuels used in the SOFC CHPs assessed were natural gas and biogas and the capacity of the SOFC was only a few kilowatts (1–20 kW) of electricity. LCAs on SOFC CHPs of larger capacity (comparable to the one of the HBP) were conducted by [50,51,52]. Our results for the climate change impact of the HBP technology (0.03–0.09 kgCO2eq/kWhel depending on the fuel considered) indicate considerably lower impacts than for the SOFC CHPs assessed by these LCAs.
These lower impacts are especially found for the SOFC CHPs using natural gas as fuel because of the avoidance of direct emissions of fossil CO2 allowed by the HBP which is fueled with a biofuel instead of fossil fuel. In particular, among the LCAs of SOFC CHPs whose size is comparable to the HBP and operating with natural gas, Strazza et al. [50] assessed a 230 kWel SOFC CHP with electric efficiency of 53.4%. The resulting impact was 0.47 kgCO2eq per kWh of electricity, which is at least 5 times higher than for the HBP. An older study [52] assessing a 125 kWel SOFC CHP operating with natural gas, calculated an impact of 0.9–1.0 kgCO2eq per kWh of electricity, which is at least 10 times higher than for the HBP. Staffell et al. [44] assessed a 1 kWel micro-SOFC CHP fueled with natural gas and calculated an impact of 0.32–0.37 kgCO2eq/kWhel, which is a least 3–4 times higher than for the HBP.
The impact of the HBP is also at least 44% lower than for SOFC CHPs operating with biogas. In this case, the main reason can be found in the different fuel production processes and composition of the fuel used and consequent different composition of the direct emissions (e.g., methane emissions released with the exhaust gases). In particular, Strazza et al. [50] calculated an impact of 0.16 kgCO2eq for a 230 kWel SOFC CHP with 52.2% electric efficiency operating with biogas from sewage sludge. For the same type of system but with a capacity of 125 kWel, Sadhukhan [51] calculated an impact of about 0.19 kgCO2eq per kWhel. Concerning this last figure, Sandhukhan used a different functional unit (1 ton of sewage sludge processed through anaerobic digestion) and we derived it by applying exergy allocation on the energy outputs.
Similarly to the HBP, for multiple impact categories, Strazza et al. found that the impact of this system, independently on the fuel considered (natural gas or biogas) was dominated by the production of the fuel. The only exception was the climate change impact of the operation with natural gas, whose impact was mainly caused by the operation phase (mainly direct emissions of fossil CO2 of the system).

3.3. Alternative Methods for Solving Multifunctionality

Exergy allocation was used to partition the total environmental impact between heat and electricity, as explained in Section 2.2.1. In the literature, the two most applied alternative approaches to address the multifunctionality of SOFC CHPs are system expansion (enlargement) and economic allocation [20]. The first approach was only applied in studies where it was not necessary to differentiate between the impacts of heat and those of electricity.
Although the substitution method has a clear link with consequential analyses, it has been often applied in the literature for attributional LCAs with goals similar to the one of this study [53,54,55]. By the substitution method, the impact of the main product is obtained by subtracting the impact of the marginally avoided secondary products from the impacts of the overall system [21,56]. In particular, the main product is defined as the one providing the highest share of revenues within the analyzed product system (physical/economic significance) [21].
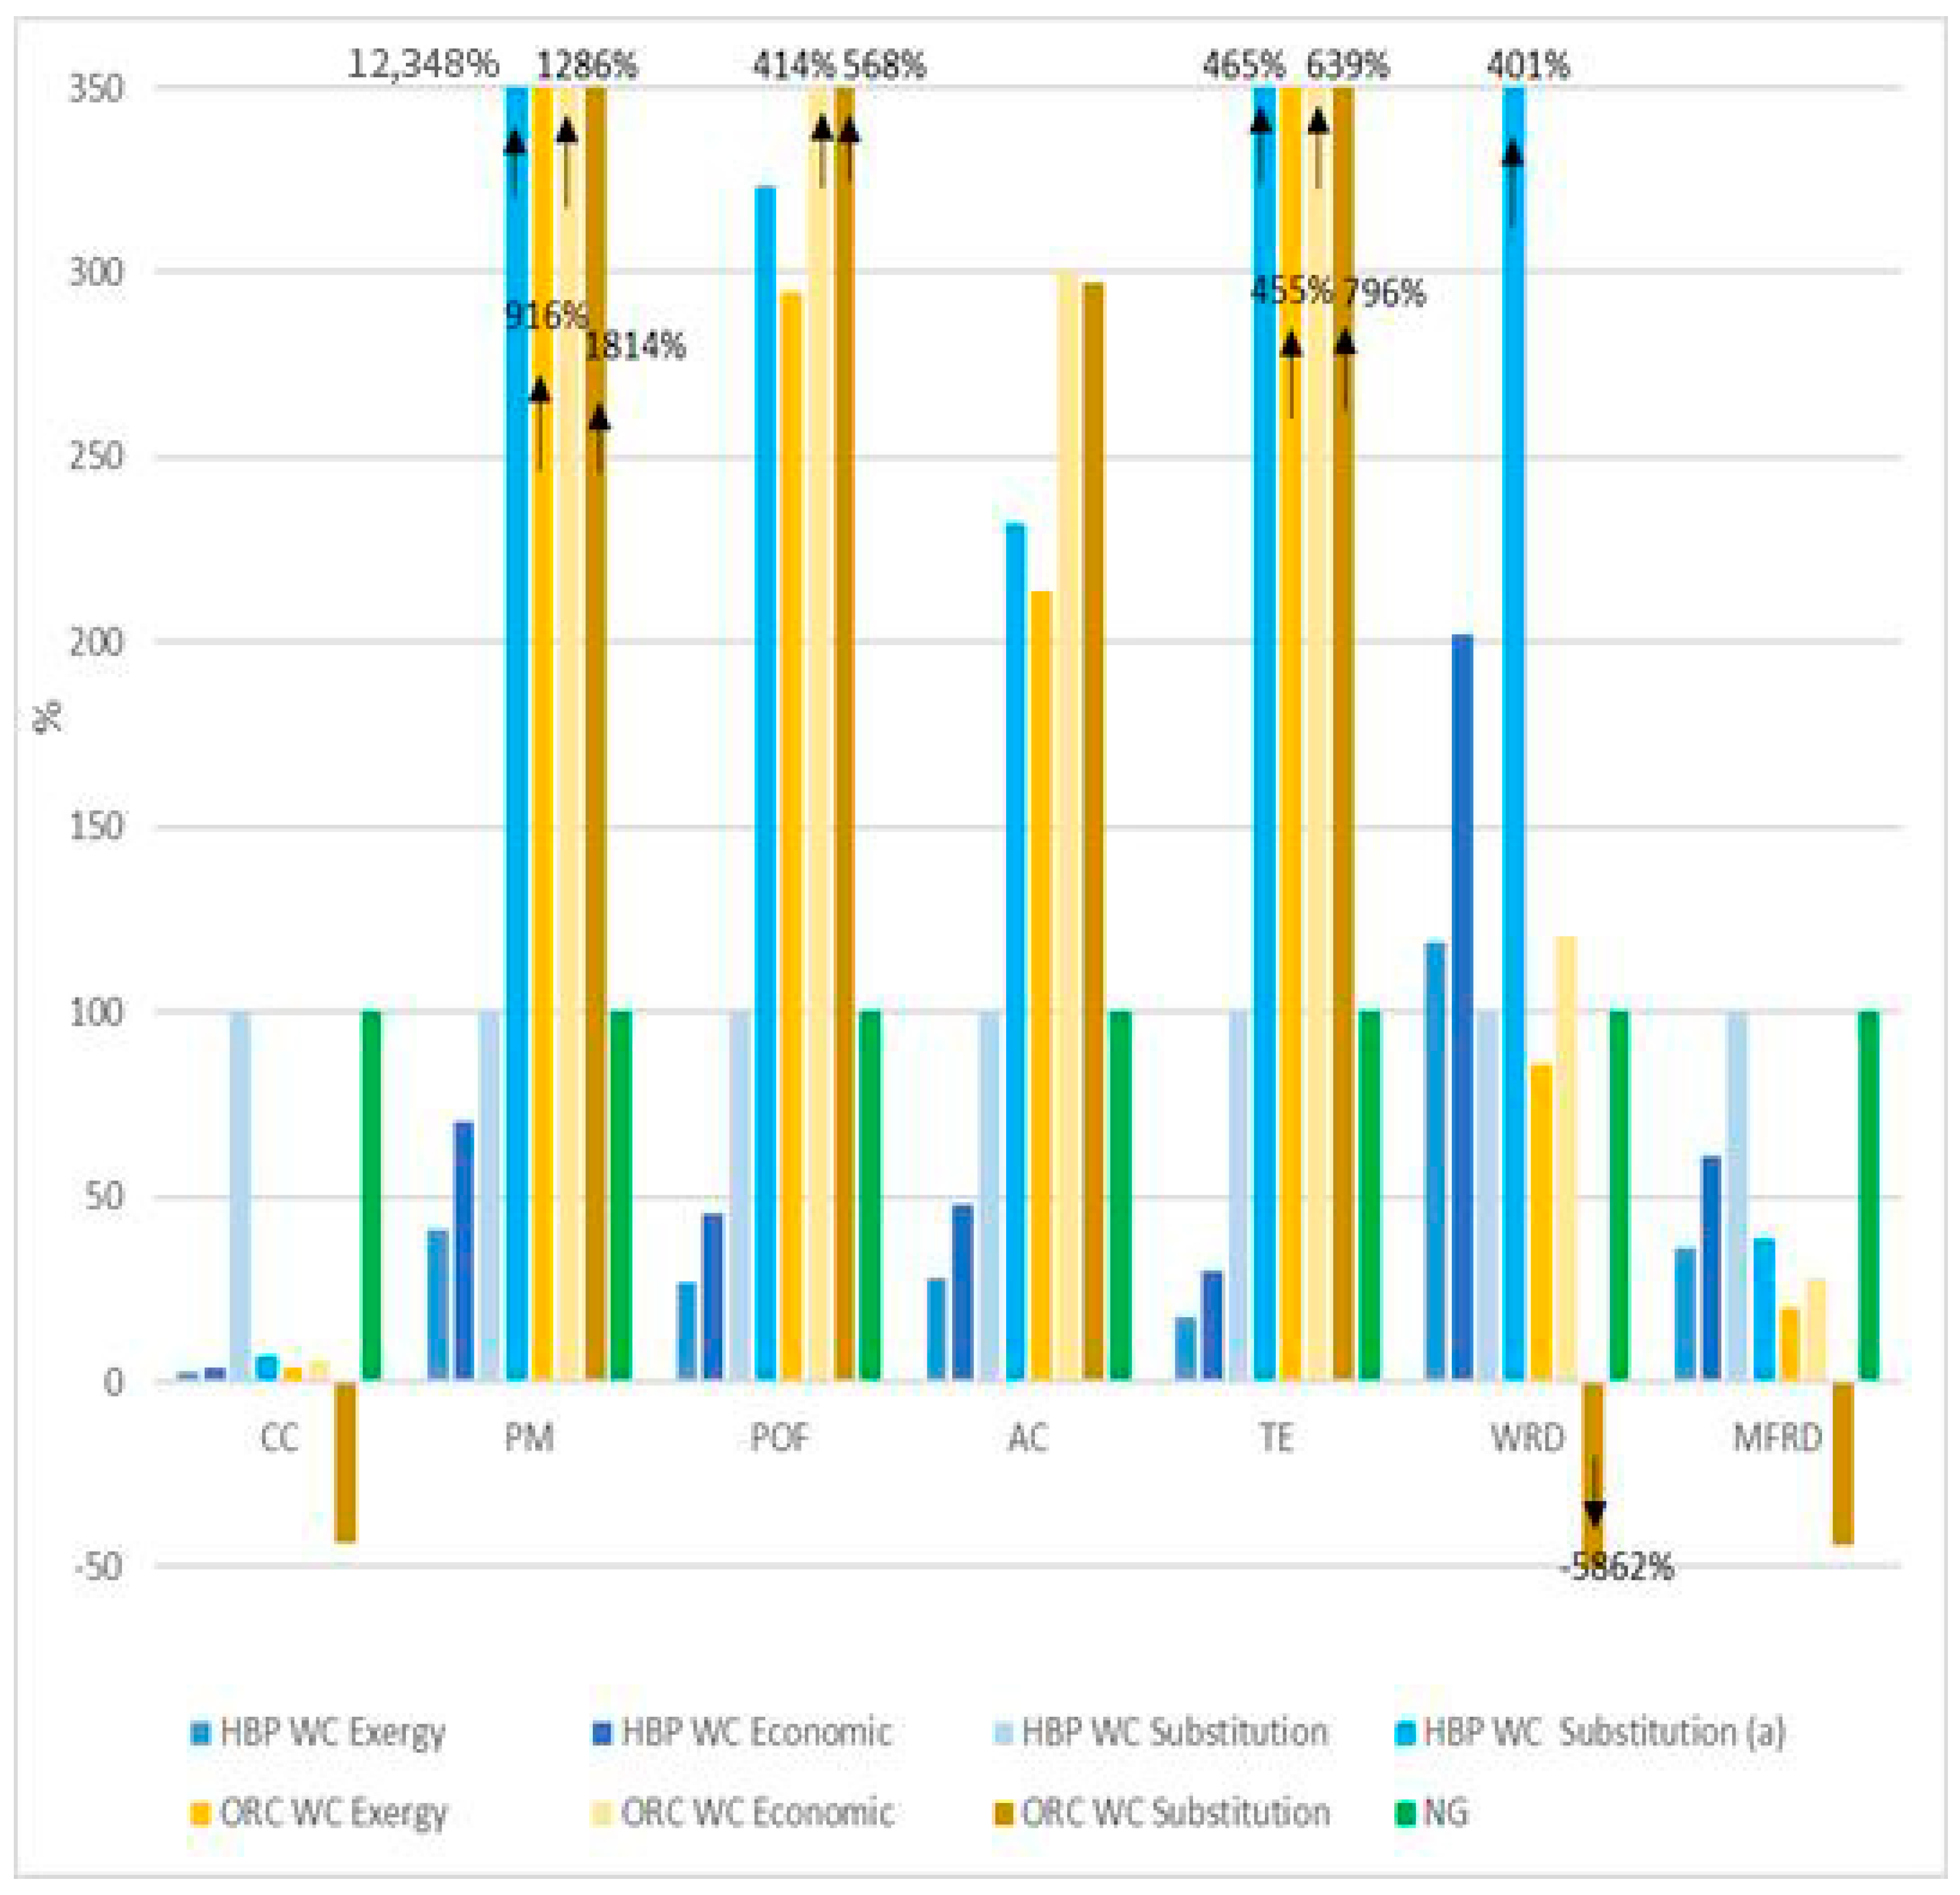
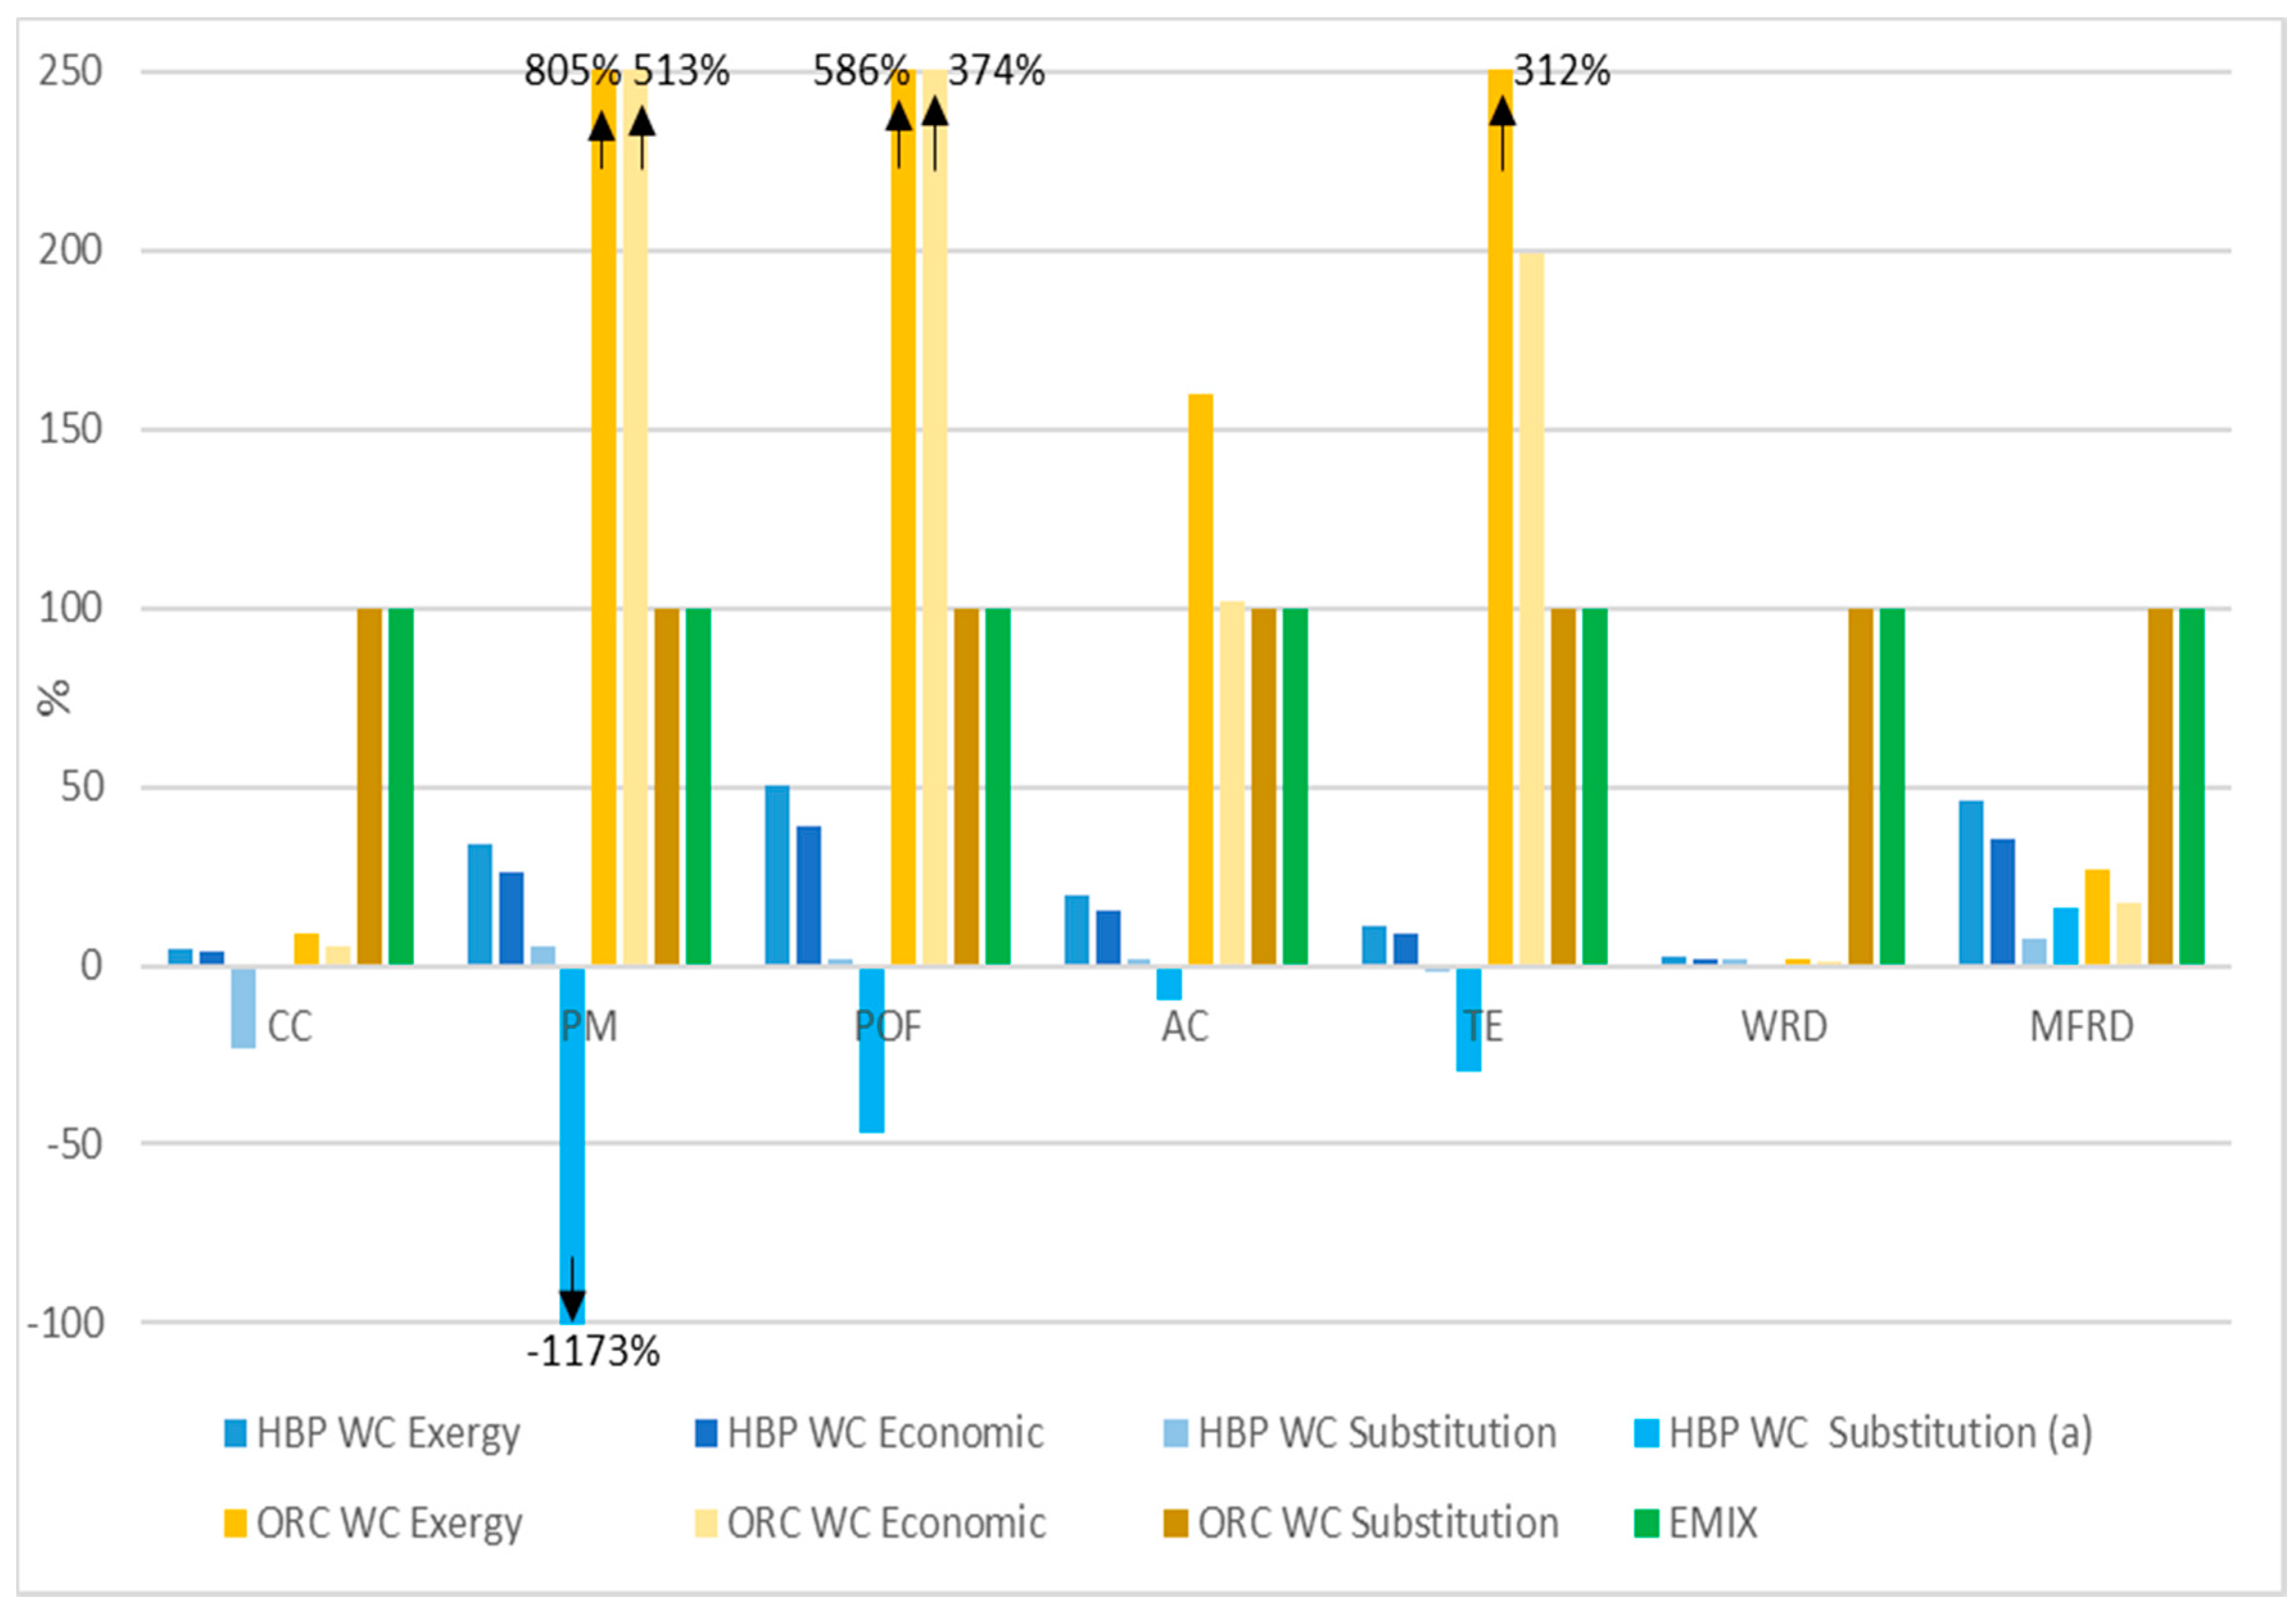
A sensitivity analysis was performed to understand the influence of the method on the results of the study. This analysis explored the variation of the results when applying economic allocation and the substitution method for the WC scenario, ORC scenario, and separate productions of heat and electricity.
When applying substitution, the first step is identifying the main product. Based on the economic heat/electricity ratio (see Table 2), electricity is the main product for the HBP. The production of heat by the HBP technology can marginally avoid the production of heat from natural gas on the market (Heat, central or small-scale, natural gas {CH}|heat production, natural gas, at boiler condensing modulating < 100 kW|Conseq from ecoinvent 3.4).
On the other hand, the HBP heat could also avoid the production of heat by an average biomass boiler (Heat, district, or industrial, other than natural gas {CH}|heat production, softwood chips from the forest, at furnace 300 kW|APOS from ecoinvent 3.4). The choice of a biomass boiler as substituted technology can be considered as an “alternative activity allocation” i.e., a form of “proxy-based disaggregation” [21]. This type of allocation is performed through the subtraction of impacts but differs from the substitution performed in consequential LCAs because it is not based on modeling of marginality [21]. Instead, this allocation takes as substituted processes the ones providing “primary productions of identical products and not of products that fall under different categories” [21]. This approach might, therefore, be an option also in attributional LCAs when reflecting the underlying physical relationship between the main and subsidiary products [21]. This sensitivity analysis considered both approaches, the substitution of a marginal activity (heat from a natural gas condensing boiler) and the substitution of an alternative activity (heat from a biomass boiler, marked as (a) in Figure 9 and Figure 10).
Based on the economic heat/electricity ratio of the ORC technology (see Table 2), heat is the main product for the ORC technology. In the case of the ORC, the electricity produced from the ORC avoids the production of marginal electricity from the electricity mix (this process is represented in the model by the ecoinvent dataset Electricity, high voltage {DE}|market for|Conseq).
The sensitivity analysis (see Figure 9 and Figure 10) indicated that, compared to exergy allocation, the economic allocation method apportions more impacts on heat (+70% in every category) while it decreases by 23% the impacts of electricity. The same applies to the ORC technology (+40% and −36% respectively for heat and electricity). For CHPs, it is therefore important to show the impacts for both heat and electricity when an allocation method is applied, so that a full picture of its environmental impacts is provided.
On the other hand, the conclusions of the comparative assessment did not change when applying exergy or economic allocation methods. This was true for all three comparisons: (1) between HBP with wood chips and ORC with wood chips, (2) between the three different biomass fuels scenarios and (3) between the HBP and the separate productions. For instance, the impact of the HBP per MJ of heat with both allocation methods was lower than for ORC in climate change, particulate matter, photochemical ozone formation, acidification, and terrestrial eutrophication, but it was higher in the two categories concerning the depletion of resources (see Figure 9). On the other hand, the percentages of potential environmental impact savings or intensifications compared to separate production can change significantly. For example, for climate change, the savings of impact of the HBP compared to ORC was 42% when using exergy allocation while it was decreased to 30% with economic allocation. However, for particulate matter, there was no difference.
Concerning substitution (see Figure 9 and Figure 10), the variations compared to other allocation methods were small or large depending on the impact category considered and the type of substitution applied. Moreover, both types of substitution approaches and the alternative activity method led to negative results in some impact categories. This last aspect highlights that the modeling was not consistent with the attributional goal of the study, which is not aimed at assessing a change in demand, and therefore, it should provide negative emissions for a single product of a multifunctional process whose overall impact is positive [21]. When a physically/economically significant product (the substituted function was 42% of total revenues for HBP and 34% for ORC) is substituted in attributional LCAs (by assuming that its impact corresponds to the one that would be replaced in the market), the results are often not aligned with other allocation methods and contrasts with the attributional aim of the LCA. This aspect emerges clearly when multiple impact categories are investigated in the same LCA study resulting in conclusions in contrast with other allocation methods and of difficult interpretation.

3.4. Sensitivity Analysis on Potentially Sensitive Parameters

3.4.1. Internal Parameters

The results of the analysis indicated that the production of the biomass fuel (23–78% for the baseline scenario WC, depending on the category) and the SOFC stacks (10–43%) have a high contribution to the total impacts.
The ecoinvent dataset used for wood chips included both wood chips obtained as by-products of sawmill activities (15%) and from forest management (85%). To reduce the environmental impact, a scenario with only sawmill wood chips as fuel could be used. This type of wood chips presents a lower impact compared to wood chips from forest management because an important percentage of the impact of the upstream activities occurring in the forests is allocated to the main products of the sawmills. This scenario was assessed by sensitivity analysis to estimate the potential variation in the impact of the HBP (see the second column of Table 5). By using only sawmill wood chips, the environmental impact of HBP technology can be significantly reduced (indicatively by 10–40%).
Alternatively, the impact of HBP technology could be improved by acting on the SOFC stack. Since the stack needs to be replaced every five years, the environmental impact could be improved by increasing the SOFC stack lifetime and therefore reducing the number of replacements over the plant lifetime. The second column of Table 5 shows the reduction of the environmental impact that could potentially be achieved by increasing the lifetime of the SOFC from five to seven years. This would lead to a decrease between 2% and 10% of the impacts of the wood chips scenario (baseline).

3.4.2. External Parameters

Since the technology will be deployed after 2025, it is important to explore how the comparative evaluation will change taking into account the current trends of decarbonization, which should lead to a decrease in the share of coal-produced electricity by shifting to renewables. In particular, the expected decarbonization of the European electricity grid will diminish the environmental benefits of HBP technology.
To assess this variation, the electricity mix based on two future scenarios for 2030 were considered: the EU reference scenario for Germany [57] and the IEA current policy scenario [58]. Due to the unavailability of the IEA current policy scenario for Germany, the IEA average mix of 2030 for the EU was taken as a proxy. This second scenario represents a more decarbonized electricity sector and includes other countries where the HBP could be commercialized. In particular, the IEA current policy scenario has only 13.7% coal and 44.7% renewables. The future savings of environmental impact allowed by the HBP is shown in the two columns on the right in Table 6. The environmental savings from the HBP technology will be only slightly affected (order of 5% overall) by the change expected in the electricity mix for 2030.

4. Conclusions

This article presented the first life cycle assessment (LCA) of a novel technology integrating biomass gasification and SOFC technologies. This technology is currently under development in the H2020 HiEff-BioPower (HBP) project and allows for the use of various biomass types as feedstock. This LCA assessed the environmental impacts when operating the technology with three different fuels: wood chips, wood pellets, and Miscanthus pellets. The impact of producing heat and electricity with the HBP technology was compared to the state of the art competing technologies. The results showed that most of the impacts of producing heat and electricity with the HBP technology are generated during the production (including transportation) of the biomass fuels (between 23% and 99% of the total impacts depending on the category and the fuel). The use of wood chips as fuel generates much lower impacts per functional unit than the operation with wood pellets (11–70% lower) and Miscanthus pellets (9–99% lower), in all impact categories. The next highest contributor to the life cycle environmental impacts is the SOFC stack, due to both the high energy intensity (especially in electricity consumption) and material intensities of its manufacturing processes, and its short lifetime (the stack should be replaced every 5 years). Beyond increasing the fuel efficiency of the technology and therefore reducing the consumption of biomass fuels, the main recommendation to technology developers would be to increase the lifetime of the SOFC stack. Increasing the SOFC stack lifetime could decrease the environmental impacts of 2–10%, depending on the category.
The comparison of the HBP technology with separate productions of heat and electricity (from natural gas condensing boilers and the German electricity grid) indicated significantly lower impacts for the HBP technology, especially in climate change (86%/94% lower), photochemical ozone formation (−43%/−70%), acidification (−37%/−56%) and terrestrial eutrophication (−43%/−63%). Overall, HBP showed also better performance than ORCs, as they have higher exergy efficiencies and almost zero particulate emissions resulting in 86–96% lower impact in the category particulate matter.
The sensitivity analysis on the allocation method for heat and electricity provided useful insights for the choice of allocation methods in CHP plants, and led to the following recommendations: (1) the attributional LCAs of CHPs should always provide the results for both heat and electricity to allow for better interpretation of results, independently of the allocation method, (2) LCA results from different CHP plants should not be compared if they assumed different allocation approaches and (3) substitution is not recommended in attributional LCA (especially if the substituted product is not a minor by-product) because it provides results which are not in line with the attributional aim (e.g., negative emissions) and lead to conclusions in contracts with the ones from applying allocation methods which are proven to be a good proxy of physical causality for CHPs and therefore preferable.

Author Contributions

Conceptualization, C.M. and B.C.; data curation, C.M., V.R., T.G., T.B. and I.O.; formal analysis, C.M., B.C. and V.R.; funding acquisition, M.J. and L.S.; investigation, C.M., B.C., V.R. and L.S.; Methodology, C.M., B.C., M.J. and L.S.; project administration, B.C., M.J., T.B., I.O., and L.S.; resources, B.C.; software, C.M. and V.R.; supervision, B.C., M.J. and L.S.; validation, B.C., T.G., M.J., T.B., I.O. and L.S.; visualization, B.C., M.J., and L.S.; writing—original draft, C.M. and V.R.; writing—review and editing, B.C., T.G., M.J., T.B., I.O. and L.S. All authors have read and agreed to the published version of the manuscript.

Funding

This LCA study has been developed within the HiEff-BioPower project, which received funding by the European Union Horizon2020 Programme under Grant agreement number 727330.

Acknowledgments

The authors express their gratitude to the other project partners and all the members of the consortium.

Conflicts of Interest

The authors declare no conflict of interest.

Appendix A

Table A1 presents the characterized environmental impacts per functional unit of heat and electricity for each fuel scenario.
Table A1. Cradle-to-grave environmental impacts per functional unit and biomass fuel. WC = wood chips, WP = wood pellets, MP = Miscanthus pellets.
Impact Category1 MJ of Heat1 kWh of Electricity
Wood ChipsWood PelletsMiscanthus PelletsWood ChipsWood PelletsMiscanthus Pellets
Climate change (kg CO2eq)1.52 × 10−33.42 × 10−34.36 × 10−33.05 × 10−26.87 × 10−28.77 × 10−2
Particulate matter (kg PM2.5 eq)1.34 × 10−64.19 × 10−63.07 × 10−62.70 × 10−58.41 × 10−56.17 × 10−5
Photochemical ozone formation (kg NMVOC eq)1.51 × 10−51.71 × 10−51.66 × 10−53.04 × 10−43.43 × 10−43.33 × 10−4
Acidification (molc H+ eq)1.57 × 10−52.87 × 10−53.49 × 10−53.15 × 10−45.78 × 10−47.02 × 10−4
Terrestrial eutrophication (molc N eq)2.46 × 10−55.72 × 10−57.96 × 10−54.93 × 10−41.15 × 10−31.60 × 10−3
Water resource depletion (co2 water eq)3.01 × 10−61.02 × 10−53.36 × 10−46.03 × 10−52.04 × 10−46.76 × 10−3
Mineral, fossil and renewable resource depletion (kg Sb eq)1.71 × 10−72.80 × 10−73.71 × 10−73.43 × 10−65.63 × 10−67.46 × 10−6

References

  1. Havukainen, J.; Nguyen, M.T.; Väisänen, S.; Horttanainen, M. Life cycle assessment of small-scale combined heat and power plant: Environmental impacts of different forest biofuels and replacing district heat produced from natural gas. J. Clean. Prod. 2018, 172, 837–846. [Google Scholar] [CrossRef]
  2. Boschiero, M.; Cherubini, F.; Nati, C.; Zerbe, S. Life cycle assessment of bioenergy production from orchards woody residues in Northern Italy. J. Clean. Prod. 2016, 112, 2569–2580. [Google Scholar] [CrossRef]
  3. Bloess, A.; Schill, W.P.; Zerrahn, A. Power-to-heat for renewable energy integration: A review of technologies, modeling approaches, and flexibility potentials. Appl. Energy 2018, 212, 1611–1626. [Google Scholar] [CrossRef]
  4. Lombardi, F.; Rocco, M.V.; Colombo, E. A multi-layer energy modelling methodology to assess the impact of heat-electricity integration strategies: The case of the residential cooking sector in Italy. Energy 2019, 170, 1249–1260. [Google Scholar] [CrossRef]
  5. Chiaroni, D.; Chiesa, M.; Chiesa, V.; Franzò, S.; Frattini, F.; Toletti, G. Introducing a new perspective for the economic evaluation of industrial energy efficiency technologies: An empirical analysis in Italy. Sustain. Energy Technol. Assess. 2016, 15, 1–10. [Google Scholar] [CrossRef]
  6. Paletto, A.; Bernardi, S.; Pieratti, E.; Teston, F.; Romagnoli, M. Assessment of environmental impact of biomass power plants to increase the social acceptance of renewable energy technologies. Heliyon 2019, 5, e02070. [Google Scholar] [CrossRef] [Green Version]
  7. González-García, S.; Bacenetti, J. Exploring the production of bio-energy from wood biomass. Italian case study. Sci. Total Environ. 2019, 647, 158–168. [Google Scholar] [CrossRef] [PubMed]
  8. Bacenetti, J.; Fusi, A.; Azapagic, A. Environmental sustainability of integrating the organic Rankin cycle with anaerobic digestion and combined heat and power generation. Sci. Total Environ. 2019, 658, 684–696. [Google Scholar] [CrossRef] [PubMed] [Green Version]
  9. Götz, T.; Saurat, M.; Kaselofsky, J.; Obernberger, I.; Brunner, T.; Weiss, G.; Bellostas, B.C.; Moretti, C. First Stage Environmental Impact Assessment of a New Highly Efficient and Fuel Flexible Medium-scale CHP Technology Based on Fixed-bed Updraft Biomass Gasification and a SOFC. In Proceedings of the 27th European Biomass Conference and Exhibition, Lisbon, Portugal, 27–30 May 2019; pp. 1586–1594. [Google Scholar]
  10. Brunner, T.; Biedermann, F.; Obernberger, I.; Hirscher, S.; Schöch, M.; Milito, C.; Leibold, H.; Sitzmann, J.; Megel, S.; Hauth, M.; et al. Development of a new highly efficient and fuel flexible medium-scale CHP technology based on fixed-bed updraft biomass gasification and a SOFC. In Proceedings of the 26th European Biomass Conference and Exhibition: EUBCE 2018, Copenhagen, Denmark, 14–17 May 2018; Volume 72, pp. 249–267. [Google Scholar]
  11. European Commission. Technology Readiness Levels (TRL). Horizon 2020–Work Programme 2014–2015 General Annexes, Extract from Part 19-Commission Decision C. Available online: https://ec.europa.eu/research/participants/data/ref/h2020/wp/2014_2015/annexes/h2020-wp1415-annex-g-trl_en.pdf (accessed on 20 May 2020).
  12. Chianese, S.; Fail, S.; Binder, M.; Rauch, R.; Hofbauer, H.; Molino, A.; Blasi, A.; Musmarra, D. Experimental investigations of hydrogen production from CO catalytic conversion of tar rich syngas by biomass gasification. Catal. Today 2016, 277, 182–191. [Google Scholar] [CrossRef]
  13. Fail, S.; Diaz, N.; Benedikt, F.; Kraussler, M.; Hinteregger, J.; Bosch, K.; Hackel, M.; Rauch, R.; Hofbauer, H. Wood gas processing to generate pure hydrogen suitable for PEM fuel cells. ACS Sustain. Chem. Eng. 2014, 2, 2690–2698. [Google Scholar] [CrossRef]
  14. Biedermann, F.; Brunner, T.; Obernberger, I.; Weiß, G. D8. 3: Preliminary Techno-Economic Performance Analysis of the New Technologies; H2020 Hieff-BioPower project deliverable; BIOS: Graz, Austria, October 2017. [Google Scholar]
  15. Evangelisti, S.; Lettieri, P.; Clift, R.; Borello, D. Distributed generation by energy from waste technology: A life cycle perspective. Process Saf. Environ. Prot. 2015, 93, 161–172. [Google Scholar] [CrossRef]
  16. Lee, Y.D.; Ahn, K.Y.; Morosuk, T.; Tsatsaronis, G. Environmental impact assessment of a solid-oxide fuel-cell-based combined-heat-and-power-generation system. Energy 2015, 79, 455–466. [Google Scholar] [CrossRef]
  17. Rillo, E.; Gandiglio, M.; Lanzini, A.; Bobba, S.; Santarelli, M.; Blengini, G. Life Cycle Assessment (LCA) of biogas-fed Solid Oxide Fuel Cell (SOFC) plant. Energy 2017, 126, 585–602. [Google Scholar] [CrossRef]
  18. ISO. ISO 14044, Environmental management—Life cycle assessment—Requirements and guidelines. International Standard Organization. Environ. Manag. 2006, 4, 307. [Google Scholar]
  19. Adams, P.W.R.; Manus, M.C. Small-scale biomass gasification CHP utilisation in industry: Energy and environmental evaluation. Sustain. Energy Technol. Assess. 2014, 6, 129–140. [Google Scholar] [CrossRef] [Green Version]
  20. Mehmeti, A.; McPhail, S.J.; Pumiglia, D.; Carlini, M. Life cycle sustainability of solid oxide fuel cells: From methodological aspects to system implications. J. Power Sources 2016, 325, 772–785. [Google Scholar] [CrossRef]
  21. Majeau-Bettez, G.; Dandres, T.; Pauliuk, S.; Wood, R.; Hertwich, E.; Samson, R.; Strømman, A.H. Choice of allocations and constructs for attributional or consequential life cycle assessment and input-output analysis. J. Ind. Ecol. 2018, 22, 656–670. [Google Scholar] [CrossRef]
  22. Vera, I.; Hoefnagels, R.; van der Kooij, A.; Moretti, C.; Junginger, M. A carbon footprint assessment of multi-output biorefineries with international biomass supply: A case study for the Netherlands. Biofuels Bioprod. Biorefining 2020, 14, 198–224. [Google Scholar] [CrossRef] [Green Version]
  23. ISO 14040. Environmental Management—Life Cycle Assessment—Principles and Framework; Technical Committee ISO/TC 207; ISO: Geneva, Switzerland, 2006. [Google Scholar]
  24. Pelletier, N.; Ardente, F.; Brandão, M.; De Camillis, C.; Pennington, D. Rationales for and limitations of preferred solutions for multi-functionality problems in LCA: Is increased consistency possible? Int. J. Life Cycle Assess. 2015, 20, 74–86. [Google Scholar] [CrossRef] [Green Version]
  25. Corona, B.; Shen, L.; Junginger, M. Preliminary Market Study for Europe: Detailed Market Assessment of 4 EU Member State Markets; H2020 Hieff-BioPower project deliverable; Utrecht University: Utrecht, The Netherlands, 2018. [Google Scholar]
  26. ILCD. ILCD Handbook—General guide on LCA—Detailed guidance. Constraints 2010, 15, 524–525. [Google Scholar]
  27. Höök, M.; Tang, X. Depletion of fossil fuels and anthropogenic climate change—A review. Energy Policy 2013, 52, 797–809. [Google Scholar] [CrossRef] [Green Version]
  28. Conibear, L.; Butt, E.W.; Knote, C.; Arnold, S.R.; Spracklen, D.V. Residential energy use emissions dominate health impacts from exposure to ambient particulate matter in India. Nat. Commun. 2018, 9, 1–9. [Google Scholar] [CrossRef] [Green Version]
  29. Broeren, M.L.M.; Zijp, M.C.; Waaijers-van der Loop, S.L.; Heugens, E.H.W.; Posthuma, L.; Worrell, E.; Shen, L. Environmental assessment of bio-based chemicals in early-stage development: A review of methods and indicators. Biofuels Bioprod. Biorefining 2017, 11, 701–718. [Google Scholar] [CrossRef] [Green Version]
  30. Hartmann, D.L.; Tank, M.G.K.; Rusticucci, M. IPCC Fifth Assessment Report, Climatie Change 2013: The Physical Science Basis; IPCC AR5; IPCC: Geneva, Switzerland, 2013. [Google Scholar]
  31. Rabl, A.; Spadaro, J.V.; Holland, M. Description of the RiskPoll software. In How Much Is Clean Air Worth; Cambridge University Press: Cambridge, UK, 2014. [Google Scholar]
  32. Van Zelm, R.; Huijbregts, M.A.J.; den Hollander, H.A.; van Jaarsveld, H.A.; Sauter, F.J.; Struijs, J.; van Wijnen, H.J.; van de Meent, D. European characterization factors for human health damage of PM10 and ozone in life cycle impact assessment. Atmos. Environ. 2008, 42, 441–453. [Google Scholar] [CrossRef]
  33. Posch, M.; Seppälä, J.; Hettelingh, J.P.; Johansson, M.; Margni, M.; Jolliet, O. The role of atmospheric dispersion models and ecosystem sensitivity in the determination of characterisation factors for acidifying and eutrophying emissions in LCIA. Int. J. Life Cycle Assess. 2008, 13, 477. [Google Scholar] [CrossRef]
  34. Frischknecht, R.; Steiner, R.; Arthur, B.; Norbert, E.; Gabi, H. Swiss Ecological Scarcity Method: The New Version 2006. Available online: https://www.researchgate.net/publication/237790160_Swiss_Ecological_Scarcity_Method_The_New_Version_2006 (accessed on 28 May 2020).
  35. Van Oers, L.; de Koning, A.; Guinée, J.B.; Huppes, G. Abiotic Resource Depletion in LCA. 2002. Available online: https://www.leidenuniv.nl/cml/ssp/projects/lca2/report_abiotic_depletion_web.pdf (accessed on 20 May 2020).
  36. Mackenzie, S.G.; Leinonen, I.; Kyriazakis, I. The need for co-product allocation in the life cycle assessment of agricultural systems—Is “biophysical” allocation progress? Int. J. Life Cycle Assess. 2017, 22, 128–137. [Google Scholar] [CrossRef] [Green Version]
  37. Azapagic, A.; Clift, R. Allocation of Environmental Burdens in Co-product Systems: Product-related Burdens (Part 1). Int. J. Life Cycle Assess. 1999, 4, 357–369. [Google Scholar] [CrossRef]
  38. Moretti, C.; Junginger, M.; Shen, L. Environmental life cycle assessment of polypropylene made from used cooking oil. Resour. Conserv. Recycl. 2020, 157, 104750. [Google Scholar] [CrossRef]
  39. Primas, A. Life Cycle Inventories of New CHP Systems; Ecoinvent: Zurich, Switzerland, 2007. [Google Scholar]
  40. European Commission. Proposal for a Directive of the European Parliament and of the Council on the promotion of the use of energy from renewable sources. Off. J. Eur. Union 2016, 5, 2009. [Google Scholar]
  41. EUROSTAT Energy Data. Available online: https://ec.europa.eu/eurostat/web/energy/data (accessed on 15 November 2019).
  42. Perić, M.; Komatina, M.; Antonijević, D.; Bugarski, B.; Dželetović, Ž. Life Cycle Impact Assessment of Miscanthus Crop for Sustainable Household Heating in Serbia. Forests 2018, 9, 654. [Google Scholar] [CrossRef] [Green Version]
  43. Caslin, B.; Finnan, J.; Easson, L. Miscanthus Best Practice Guidelines; Agriculture and Food Development Authority. Available online: https://www.teagasc.ie/publications/2011/315/MiscanthusBestPractice.pdf (accessed on 13 April 2019).
  44. Staffell, I.; Ingram, A.; Kendall, K. Energy and carbon payback times for solid oxide fuel cell based domestic CHP. Int. J. Hydrog. Energy 2012, 37, 2509–2523. [Google Scholar] [CrossRef]
  45. BWF Tec GmbH & Co. KG. Pyrotex ® KE. More Than Just Hot Gas De-Dusting; BWF Envirotec: Offingen, Germany, 2017. [Google Scholar]
  46. Biganzoli, L.; Rigamonti, L.; Grosso, M. LCA evaluation of packaging re-use: The steel drums case study. J. Mater. Cycles Waste Manag. 2019, 21, 67–78. [Google Scholar] [CrossRef]
  47. Rigamonti, L.; Grosso, M.; Sunseri, M.C. Influence of assumptions about selection and recycling efficiencies on the LCA of integrated waste management systems. Int. J. Life Cycle Assess. 2009, 14, 411–419. [Google Scholar] [CrossRef]
  48. Valente, A.; Iribarren, D.; Dufour, J. End of life of fuel cells and hydrogen products: From technologies to strategies. Int. J. Hydrog. Energy 2019, 44, 20965–20977. [Google Scholar] [CrossRef]
  49. Milà i Canals, L.; Bauer, C.; Depestele, J.; Dubreuil, A.; Freiermuth Knuchel, R.; Gaillard, G.; Michelsen, O.; Müller-Wenk, R.; Rydgren, B. Key Elements in a Framework for Land Use Impact Assessment Within LCA (11 pp). Int. J. Life Cycle Assess. 2007, 12, 5–15. [Google Scholar] [CrossRef] [Green Version]
  50. Strazza, C.; Del Borghi, A.; Costamagna, P.; Gallo, M.; Brignole, E.; Girdinio, P. Life Cycle Assessment and Life Cycle Costing of a SOFC system for distributed power generation. Energy Convers. Manag. 2015, 100, 64–77. [Google Scholar] [CrossRef]
  51. Sadhukhan, J. Distributed and micro-generation from biogas and agricultural application of sewage sludge: Comparative environmental performance analysis using life cycle approaches. Appl. Energy 2014, 122, 196–206. [Google Scholar] [CrossRef] [Green Version]
  52. Osman, A.; Ries, R. Life cycle assessment of electrical and thermal energy systems for commercial buildings. Int. J. Life Cycle Assess. 2007, 12, 308–316. [Google Scholar] [CrossRef]
  53. Schrijvers, D.L.; Loubet, P.; Sonnemann, G. Developing a systematic framework for consistent allocation in LCA. Int. J. Life Cycle Assess. 2016, 21, 976–993. [Google Scholar] [CrossRef]
  54. Sandin, G.; Røyne, F.; Berlin, J.; Peters, G.M.; Svanström, M. Allocation in LCAs of biorefinery products: Implications for results and decision-making. J. Clean. Prod. 2015, 93, 213–221. [Google Scholar] [CrossRef]
  55. Anne Renouf, M.; Pagan, R.J.; Wegener, M.K. Life cycle assessment of Australian sugarcane products with a focus on cane processing. Int. J. Life Cycle Assess. 2011, 16, 125–137. [Google Scholar] [CrossRef]
  56. Cherubini, F.; Strømman, A.H.; Ulgiati, S. Influence of allocation methods on the environmental performance of biorefinery products—A case study. Resour. Conserv. Recycl. 2011, 55, 1070–1077. [Google Scholar] [CrossRef]
  57. Carpos, P.; De Vita, A.; Tasios, N.; Siskos, P.; Kannavou, M.; Preopoulos, A.; Evangelopoulou, S.; Zampara, M.; Papadopoulos, D.; Nakos, C.; et al. EU Reference Scenario 2016—Energy, Transport and GHG Emissions—Trends to 2050; European Commission: Brussels, Belgium, 2016; ISBN 978-92-79-52373-1. [Google Scholar]
  58. IEA. World Energy Outlook 2018: Electricity; IEA: Paris, France, 2018. [Google Scholar]
Figure 1. Concept of high-efficiency bio-based power (HBP) technology. GCU = Gas cleaning unit. SOFC = Solid oxide fuel cell.
Energies 13 02773 g001
Figure 2. Flowchart of the HBP product system, including system boundaries (dashed lines).
Energies 13 02773 g002
Figure 3. Main contributions to the cradle-to-grave environmental impact of producing heat and electricity with the HBP technology using wood chips as biomass fuel. The presented breakdown is valid for both functional units. CC = Climate change, PM = Particulate matter, POF = Photochemical ozone formation, AC = Acidification, TE = Terrestrial eutrophication, WRD = Water resource depletion, MFRD = Mineral, fossil, and renewable resource depletion.
Energies 13 02773 g003
Figure 4. HBP technology fueled with various biomass fuels (the same graph applies to both 1 MJ heat or 1 kWh electricity). Values are normalized taking as 100% the impacts of the most impacting scenario. CC = Climate change, PM = Particulate matter, POF = Photochemical ozone formation, AC = Acidification, TE = Terrestrial eutrophication, WRD = Water resource depletion, MFRD = Mineral, fossil, and renewable resource depletion. WC = wood chips, WP = wood pellets, MP = Miscanthus pellets.
Energies 13 02773 g004
Figure 5. Main contributions to the environmental impact of Miscanthus pellets supplied to the HBP CHP plant. CC = Climate change, PM = Particulate matter, POF = Photochemical ozone formation, AC = Acidification, TE = Terrestrial eutrophication, WRD = Water resource depletion, MFRD = Mineral, fossil, and renewable resource depletion.
Energies 13 02773 g005
Figure 6. Comparison of HBP technology with ORC technology for 1 MJ of heat. The graph for 1 kWh electricity shows some minor differences due to a slightly different Carnot factor assumed for ORC technology. Values are normalized with respect to the impacts of the most impacting scenario. CC = Climate change, PM = Particulate matter, POF = Photochemical ozone formation, AC = Acidification, TE = Terrestrial eutrophication, WRD = Water resource depletion, MFRD = Mineral, fossil, and renewable resource depletion. WC = wood chips.
Energies 13 02773 g006
Figure 7. Comparison of HBP technology with competing technologies (for 1 MJ heat). Values are normalized taking as 100% the impacts of the natural gas boiler. CC = Climate change, PM = Particulate matter, POF = Photochemical ozone formation, AC = Acidification, TE = Terrestrial eutrophication, WRD = Water resource depletion, MFRD = Mineral, fossil, and renewable resource depletion. WC = wood chips, WP = wood pellets, MP = Miscanthus pellets.
Energies 13 02773 g007
Figure 8. Comparison of HBP technology with competing technologies (for 1 kWh electricity). Values are normalized taking as 100% the impacts of the German electricity mix. CC=Climate change, PM=Particulate matter, POF = Photochemical ozone formation, AC=Acidification, TE=Terrestrial eutrophication, WRD=Water resource depletion, MFRD = Mineral, fossil, and renewable resource depletion. WC = wood chips, WP = wood pellets, MP = Miscanthus pellets.
Energies 13 02773 g008
Figure 9. Sensitivity on allocation method for the generation of 1 MJ with HBP technology and competing technologies. Boiler running with natural gas taken as 100%. ORC = Organic Rankine Cycle, NG = Natural gas boiler, (a) = substitution of heat from a biomass boiler.
Energies 13 02773 g009
Figure 10. Sensitivity on allocation method for the generation of 1 kWh with HBP technology and competing technologies (1 kWh electricity). Electricity mix taken as 100%. ORC = Organic Rankine Cycle, EMIX = Electricity mix, (a) = substitution of heat from a biomass boiler.
Energies 13 02773 g010
Table 1. Selected impact categories and models.
Impact CategoryUnitImpact Assessment Models
Climate change (CC)kg CO2eqIPCC 2013 Global Warming Potential 100 years [30]
Particulate matter (PM)kg PM2.5 eqPremature death or disability from particulates/respiratory inorganics from [31]
Photochemical ozone formation (POF)kg NMVOC eqPotential contribution to photochemical ozone formation for Europe from [32]
Acidification (AC)molc H+ eqAccumulated Exceedance (AE) characterizing the change in critical load exceedance of the sensitive area from [33]
Terrestrial eutrophication (TE)molc N eqAccumulated Exceedance (AE) characterizing the change in critical load exceedance of the sensitive area from [33]
Water resource depletion (WRD)m3 water eqFreshwater scarcity: Scarcity-adjusted amount of water used from Swiss Ecoscarcity 2006 [34]
Mineral, fossil and renewable resource depletion (MFRD)kg Sb eqDepletion of resources based on the scarcity model from [35]
Table 2. Characteristics of the small scale HBP technology (8000 h of operations per year). Modeled values.
Flow (Unit)Wood Chips (30 wt.%)Pellets (from Wood and Miscanthus) (5 wt.%)
Biomass fuel (kW)548.5570.0
Biomass fuel (kg/h)164.1115.7
Gross electric power (kW) 170.5190.0
Thermal power output (kW)288.5292.0
Electrical efficiency gross (%)31%33%
Electrical efficiency net (%)30%32%
Thermal efficiency (%)53%51%
Exergy output as heat (%)24.622.7
Exergy output as electricity (%)75.477.3
Economic output as heat (%)41.839.3
Economic output as electricity (%)58.260.7
Table 3. Materials of the gasifier including the primary gas treatment zone.
MaterialAmountProcess Dataset
Steel (low alloyed) (kg)6770Steel, low-alloyed {RER}|steel production, converter, low-alloyed|APOS
Stainless steel (kg)585Steel, chromium steel 18/8, hot rolled {RER}|production|APOS
Iron-nickel-chromium alloy (kg)220Iron-nickel-chromium alloy {RER}|production|APOS
Concrete fireproof (kg)4480Concrete block {DE}|production|APOS
insulating material (kg)1220Glass wool mat {CH}|production|APOS
Table 4. Direct emissions (mg) to air per MJ of overall energy output (heat and electricity). OGC = organic gaseous compounds, TSP = total suspended particle, NOX = nitrogen oxides. Maximum values shown in the table were used in the Life Cycle Inventory.
FuelCOOGCTSPNOX
Wood chips<20<0.01<0.01<0.01
Pellets<20<0.01<0.01<0.01
Table 5. Sensitivity analysis on the reduction of the environmental impact of the HBP technology by either increasing the SOFC stack lifetime or using only wood chips produced as industrial by-products.
Impact CategoryIndustrial Wood Chips Only (Measured in % Variation)Longer SOFC Stack Lifetime (Measured in % Variation)
Climate change (CC)−37%−4%
Particulate matter (PM)−15%−6%
Photochemical ozone formation (POF)−47%−2%
Acidification (AC)−16%−7%
Terrestrial eutrophication (TE)−37%−4%
Water resource depletion (WRD)+8%−10%
Mineral, fossil, and renewable resource depletion (MFRD)−10%−3%
Table 6. Sensitivity analysis on the savings of environmental impacts of 1 kWh of electricity produced by the HBP compared to the grid electricity mix (EMIX).
Impact CategoryEMIX Germany, Ecoinvent 3.4Future EMIX Germany, EU Reference Scenario 2030Future EMIX EU, IEA Current Policy Scenario 2030
1 kWh ElectricitySavings (%) HBP vs. EMIX1 kWh ElectricitySavings (%) HBP vs. EMIX1 kWh ElectricitySavings (%) HBP vs. EMIX
Climate change (kg CO2eq)6.41 × 10⁻¹−95%5.61 × 10⁻¹−95%3.96 × 10⁻¹−92%
Particulate matter (kg PM2.5 eq)7.87 × 10⁻⁵−66%7.84 × 10⁻⁵−66%6.74 × 10⁻⁵−60%
Photochemical ozone formation (kg NMVOC eq)6.02 × 10⁻⁴−49%6.06 × 10⁻⁴−50%4.98 × 10⁻⁴−39%
Acidification (molc H+ eq)1.58 × 10⁻³−80%1.35 × 10⁻³−77%1.12 × 10⁻³−72%
Terrestrial eutrophication (molc N eq)4.33 × 10⁻³−89%3.86 × 10⁻³−87%3.49 × 10⁻³−86%
Water resource depletion (m3 water eq)2.75 × 10⁻³−98%1.32 × 10⁻⁴−54%4.47 × 10⁻⁴−87%
Mineral, fossil and renewable resource depletion (kg Sb eq)7.47 × 10⁻⁶−54%7.89 × 10⁻⁶−56%7.41 × 10⁻⁶−54%