Abstract
Currently, linear discontinuous deformations in mining areas are an important issue, both due to the frequency of their occurrence and the threat they pose to general safety. This paper presents a case study of an occurrence of such a deformation. The analyses of the geological and mining conditions, as well as the conducted calculations presented herein, indicate that the cause of the deformation was the occurrence of high-value horizontal tensile strains. It was triggered by mining exploitation carried out with caving in three seams at depths between 200 and 545 m. An additional factor conductive to the creation of the deformation was the tectonic structure of the rock mass. The subject matter of the paper is significant given the growing number of discontinuous linear deformations occurring on the surface due to underground mining—even if the mining was conducted at great depths. They were formed as a result of intensive underground mining operations and the occurrence of high-value deformations. These deformations were particularly dangerous to building structures on the surface, which were often damaged. For this reason, it was worthwhile to make arrangements regarding the correlation between the occurrence of the deformations and the values and the distribution of continuous deformations caused by underground extraction, as well as the existence of tectonic faults.
1. Introduction
The impact of underground exploitation on the surface leads to a series of generally recognized negative consequences. The numerous manifestations of this impact on the surface include continuous and discontinuous deformations. The negative influence of such deformations on objects may be eliminated by establishing protective pillars of suitable dimensions [1].
The formation of linear discontinuous deformations on the surface is particularly dangerous, as it causes damage to buildings and accompanying infrastructure objects [2,3,4]. An example of such a danger was the case described in the paper [5], concerning a deformation that occurred on a highway.
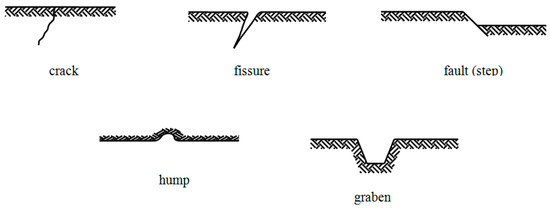
Figure 1.
Forms of linear discontinuous deformations [6,7].
- ▪
- Cracks, when the continuity of the surface is interrupted and the horizontal displacement is not greater than 1 cm, without any vertical displacement.
- ▪
- Fissures, when the continuity of the surface is interrupted and the horizontal displacement is greater than 1 cm, without any vertical displacement.
- ▪
- Faults (steps), when the surface is cut and there is mutual vertical displacement.
- ▪
- Humps, when there is an uplift of the terrain due to high-value horizontal deformations.
- ▪
- Grabens, when a narrow hollow in the soil is created at a certain length.
The paper [8] comprehensively addressed the forms of impact of mining on the environment while also presenting the case of linear discontinuous deformations under the conditions of room and pillar mining in the Witbank Coalfield.
Linear deformations in the conditions of Polish coal basins are caused by intense mining exploitation conducted with caving, when the end edges of the extractions coincide in a vertical plane. Tectonic disturbances (faults) are a factor conductive to their creation [9]. At present, they occur quite often in numerous countries, and many known cases have been described in the literature [10,11,12,13]. In particular, H. Kratzsch’s [14] textbook provided detailed information on the causes of linear deformations, including those in the vicinity of tectonically disturbed zones. The issue of the impact of faults on the formation of flexures in the soil was also investigated by R. Ścigała [15,16], who provided a method to predict their occurrence. The occurrence of large displacement values in the vicinity of fault outcrops is very often the cause of seismic events [17].
In some papers, attention has been paid to a certain threshold value of horizontal strain caused by the underground exploitation of deposits. It has been reported [9,18,19] that linear discontinuous deformations have been observed when the horizontal tensile strain has exceeded the value of 9 mm/m. Following these findings, the same value of threshold strain was thus determined for two Polish mining regions [9,18] and a Chinese basin [19]. In his paper [5], Kowalski noted that primary discontinuous deformations are formed at values of horizontal tensile strain exceeding 9 mm/m, whereas secondary deformations can occur even when these values grow by ca. 3 mm/m. A statistical relationship between the value and size of the deformations has been reported [20]. This also indicates a number of important factors determining the formation of linear deformations (fissures). These factors include: soil properties, surface topography, the depth and thickness of the deposit, the way of managing the roof, the dimensions of the sites, and the speed of progress of the exploitation front. The inclination of the terrain has a significant impact on the nature of the deformations, as evidenced by the observation of two characteristic types of fissures in steep and mildly inclined slopes. The problem of the formation of linear discontinuous deformations in a mountainous terrain was also highlighted in the paper [21].
Among the factors causing linear discontinuous deformations, the paper [22] mentioned the following: rock mass structure, occurrence of active tectonic faults, human activity, and loess erosion.
Linear discontinuous deformations also occur in the case of shallow coal seam exploitations. The paper [23] presented the conditions of the formation of these deformations and the numerical analyses of the impact on the surface caused by exploitation conducted in the rock mass with a varied lithological structure. As a result of the conducted calculations, an image of the formation of ground steps or fissures on the surface was obtained. Thus, the results of the analyses indicated a large impact of the geological structure of the rock mass on the nature of the occurring deformations.
The hazard level of a given area related to the occurrence of these deformations has been evidenced by the need to monitor them using selected observation methods [24]. It should be noted that the occurrence of linear discontinuous deformations is particularly dangerous for buildings on the surface and depends on a number of factors indicated above. It should be highlighted that the papers referred to above described case studies of the formation of linear discontinuous deformations in the most frequently encountered forms—namely ground steps and fissures (Strzałkowski, Ścigała [9], Malinowska, Hejmanowski [18], Kowalski [5]). In regards to the occurrence of tectonic faults as a factor contributing to the occurrence of the deformations, it has to be noted that the faults were characterized by high throw values, ranging from ca. 30 to 450 m. Grabens are another form of deformations that are observed less frequently but pose a greater threat to buildings. The works by Zhu [20] and Kang [21] indicated that they occur in mountain terrains or at least steep slopes. This leads to the following questions: Is it the case that the only factor conductive to the occurrence of discontinuous linear deformations are faults characterized by a throw of several dozen and more meters? Can discontinuous linear deformations in the form of grabens occur in flat terrain? The case described in this paper could be considered atypical, as the linear deformation in the form of a graben occurred in flat terrain in the vicinity of a fault characterized by a really small throw—1.2 m. Therefore, it was decided that the analyzed case was worth presenting. Moreover, as a case, it warns of the hazard of the formation of a dangerous deformation in geological and mining conditions in which, in the light of the previous experience, it should not have occurred. As part of the performed analyses, the paper presents the contour distribution of maximal subsidence and horizontal strains that had arisen in the area of the deformation as a result of the performed mining exploitation, as well as the map of the thickness of the selected deposit with reference to the course of the fault zone.
This paper presents the case of the occurrence of a discontinuous deformation that, according to Polish literature, can be classified as a graben. The causes of the occurrence of the deformation are also analyzed.
2. Material and Methods
The theories used to predict continuous deformations (subsidences and their derivatives) applied in Poland have been presented in the works by Strzałkowski [7] and Kratzsch [14]. Generally, it can be said that these theories can be divided into the four following groups:
- Geometric-integral theories utilizing a special function called the “influence function” that describes the distribution of land surface subsidence around the elementary extraction area. In Poland, there are several methods of this group, e.g., by W. Budryk–S. Knothe and T. Kochmański. The W. Budryk–S. Knothe theory, especially, has found widespread applications because of its clarity in the description of the deformation process, particularly in the transient state. It has been the subject of various modifications by other authors, aiming at its improvement—mainly in the scope of transient subsidence.
- Theories (methods) based on continuum mechanics. In these methods, the state of stress and displacement is described by a system of differential equations and a state equation that depends on the type of the considered medium. The works of A. Sałustowicz et al. are widely known in Poland.
- Solutions based on the so-called “theory of stochastic medium” created by J. Litwiniszyn and later developed by H. Smolarski.
- Numerical methods that, generally speaking, use the assumptions of FEM (Finite Element Method) methods.
The prevalence of the application of the W. Budryk–S. Knothe method in Poland has resulted from the following factors: a low complexity level of the model’s equations as opposed to other methods, a good understanding of the values of the parameters that should be used in predictions, and the development of a number of computer programs designed to perform the calculations and create graphic representations of the results, e.g., contour maps of deformation indicators [25]. No such programs have been developed for other methods.
All the Polish underground hard coal and copper ore mines utilize this theory to make deformation predictions. For the aforementioned reasons, this method was also employed in this work. According to the research performed by J. Zych, this theory allows one to achieve an agreement with the measurement results that is sufficient in practice [26]. The values of the percentage errors of the subsidence prediction usually do not exceed 5%.
As mentioned above, Knothe’s theory [27] is the most popular one in Poland. The final value of subsidence at point A (,) located on the land surface is determined by the equation:
where f() is the so-called “influence function:”
where:
- —the thickness of the coal seam, m.
- ,—the coordinates of point A in the Cartesian coordinate system, m.
- ,—the coordinates of the elementary extraction field , m.
- —the extracted area of the coal seam, m2.
Equations (1) and (2) contain the following parameters:
A—the roof control coefficient. Its average value is from 0.70 to 0.85 for caving, from 0.30 to 0.50 for extraction with dry backfilling, 0.5 for extraction with roof deflection, and from 0.15 to 0.25 for extraction with stowing (hydraulic backfilling). As derived from [28], the values of this parameter are influenced by several factors, mainly connected to the rock mass structure (the thickness and properties of the overburden, as well as the properties of the Carboniferous layers) and the extraction depth.
- —the main impact range, m.
In practice, the β parameter is used (β = H/r, where H is the depth of extraction). In the Upper Silesian Coal Basin, the value of β ranges from 1.5 to 3.0 in different areas. Its value is connected to rock mass properties. In the case of rock mass characterized by high strength parameters, this parameter assumes values from the lower limit of the range. The lower the strength parameters, the higher the value of the β parameter. It also increases with the extraction of the successive seams as a result of the weakening of the rock mass. Therefore, in the case of rocks characterized by high strength parameters, the value of the r parameter describing the impact range of the extraction is greater than when it comes to rocks characterized by low strength parameters—given, of course, that the depth of the seam is the same. This is because the value of the r parameter is inversely proportional to the β value.
The locations of the point A (,) and the elementary extraction are shown in Figure 2.
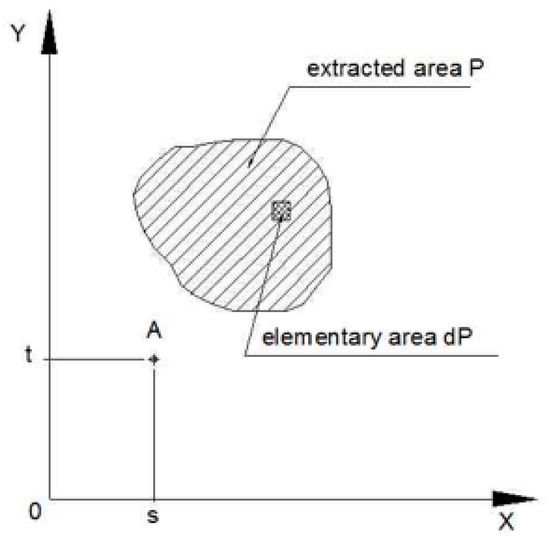
Figure 2.
Schematic location of point A (,) and the extracted area.
Apart from subsidence, the deformation indices of the ground surface are: inclination [mm/m], vertical curvature [1/km], and horizontal strain [mm/m]. The deformation indices are calculated as derivatives from the subsidence according to the following equations:
where:
—Awierszyn coefficient; the value of this parameter was assumed as = 0.32 [m].
The values of the parameters included in the Knothe theory should be obtained on the basis of results of geodetic measurements by using computer programs [25]. The minimized objective function results from the least square method. It is obtained using computer programs, e.g., [7,25]:
where:
—the measured subsidence at point “”;
—the subsidence calculated at point “”. (, , , , );
—the number of measuring points.
Examples of parameter identification on the basis of surveys have been presented in works by Strzałkowski [29].
3. Results
3.1. Description of the Deformation
The deformation occurred in the mining area of one of the mines of the Upper Silesian Coal Basin (Figure 3) in the conditions of intensive mining exploitation of three hard coal seams (Figure 4). The Upper Silesian Coal Basin is located in southwestern Poland and partially in the Czech Republic. It is the area of the most intensive hard coal exploitation in Poland. Its geological structure is varied. Generally, it can be said that the rock mass is made up of Triassic and Tertiary overburden, as well as a Carboniferous formation-containing coal seams. The thickness of the overburden layers is varied, as are the types of rocks they are made up of. In some regions, the Carboniferous formations reach the surface and there is no overburden. The Carboniferous formations are made up of series of rocks that are shown in Figure 3, which depicts the geological map of Carboniferous subcrops [30]. Detailed information on the geological structure has been presented in the literature [30,31].
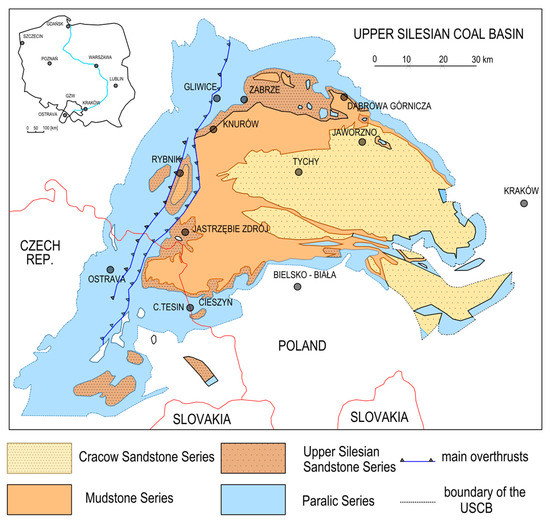
Figure 3.
Location of the Upper Silesian Basin in Poland ([30,31]).
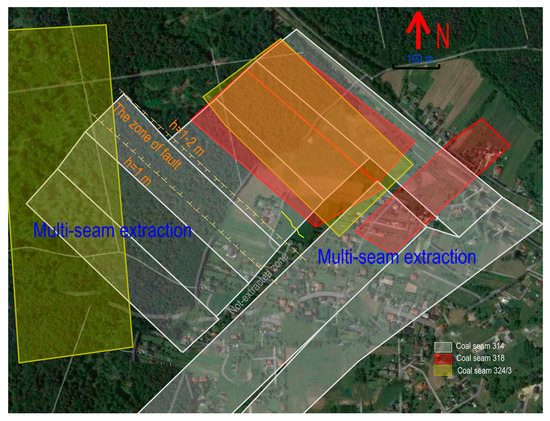
Figure 4.
Sketch of multi-seam extraction edges in the vicinity of the discontinuous deformation.
The general view of the deformation is shown in Figure 4. It ran through a meadow area in the immediate vicinity of buildings. The length of the graben that was formed was ca. 200 m, and its width was ca. 0.5 m (Figure 5 and Figure 6). The deformation occurred in 2011.
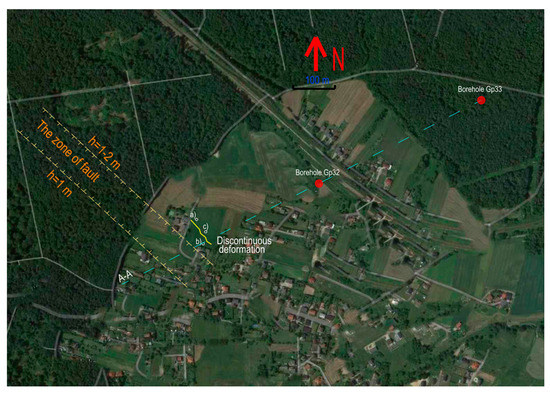
Figure 5.
The course of the discontinuous deformation (red lines) and the locations of the selected damages (white dots).
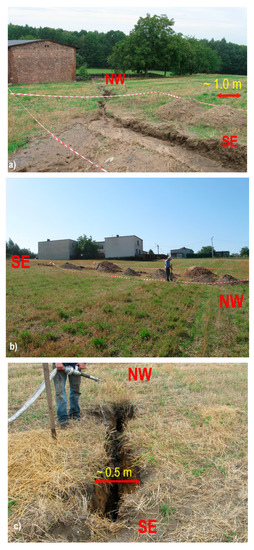
Figure 6.
General view of the deformation: (a) SE–NW view of the damages, (b) NW–SE view of the damages, and (c) damaged surface.
3.2. Rock Mass Structure
The structure of the rock mass was determined based on the G-32 borehole located at a distance of ca. 330 m from the deformation (Figure 5). On its basis, it can be stated that the rock mass was formed of a Quaternary overburden and productive Carboniferous formations. The Quaternary overburden was formed as a layer of top soil and layers of sand and clay. The total thickness of these layers amounted to 6.6 m. Under the Quaternary layer, there were Carboniferous formations that belonged to the Łaziskie layers. They were made up of alternating layers of shale and sandstone along with a group of coal seams numbered from 301 to 325. This paper presents only the profile of the G-32 borehole (Figure 7) due to its close proximity to the deformation and its similarity to the G-33 profile. Based on both profiles and seam maps, a stratigraphic A-A section was created. It is shown on the map (Figure 5) and is presented in Figure 8.
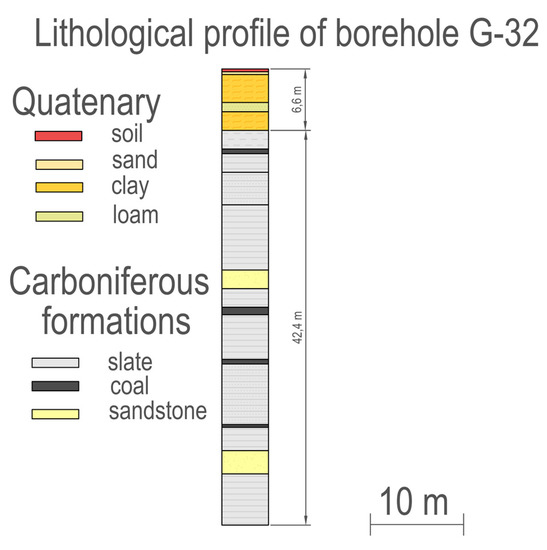
Figure 7.
Lithological profile of the rock mass (borehole G-32). The location of the borehole is shown in Figure 5.
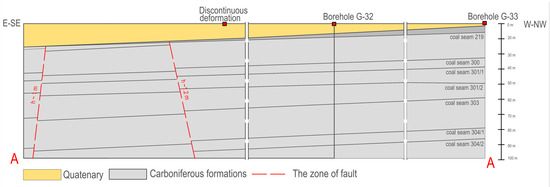
Figure 8.
The general E–SE/W–NW cross section of the rock mass in the study area. The location of the A-A section is presented in Figure 5.
3.3. Tectonics
Based on the geological and mining documentation, it was established that a tectonic fault zone runs through the area in question. It formed a graben that ran from northwest to southeast (Figure 4 and Figure 5). The throw of the faults forming the fault zone was small (h = 1.2 m and h = 1 m—see the two faults shown in Figure 9). The inclination angles of the fault planes ranged from ca. 80° to 85°. These faults are marked on the cross section presented in Figure 8.
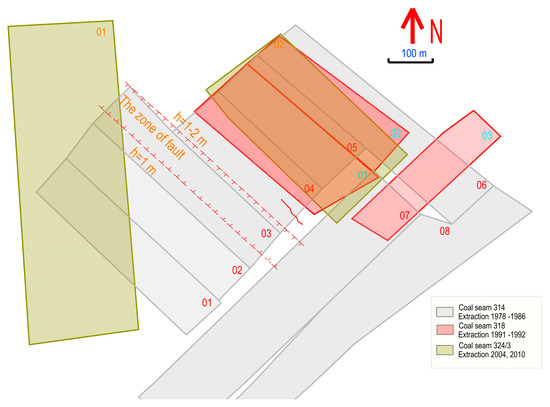
Figure 9.
Location of the mining exploitation in relation to the deformation.
3.4. Former Mining Exploitation
In the region of the deformation, hard coal mining was carried out in the years 1977–2011 at a depth between 210 and 545 m. The thickness of the exploited seams ranged from 1.70 to 2.25 m. The exploitation was carried out using a longwall system with the collapse of roof rocks. The basic data concerning the exploitation conditions are presented in Table 1.

Table 1.
Basic mining exploitation data concerning the area of the deformation.
As seen in Table 1, the mining exploitation was conducted in three seams by using a longwall system with caving. The analysis of the geological and mining data presented in Table 1 allowed us to conclude that the time of occurrence of the discontinuous deformation corresponded to the time of exploitation conducted in seam 324/3, longwall 02.
The location of the exploited longwalls in relation to the deformation is shown in Figure 9.
3.5. Selected Analysis Method
Taking into account the conclusions resulting from the literature review, it was decided to conduct analyses consisting of:
- The determination of the distribution of maximal horizontal strains, maximal inclinations, and horizontal displacements in the area of the deformation.
- The creations of a map of the thickness of the extracted deposit.
- The examination of the correlation between the course of the linear strains, the thicknesses of the selected deposit and the tectonic fault, and the location of the deformation on the surface.
As the literature overview demonstrated the impact of horizontal tensile strain on the formation of linear discontinuous deformations, it was decided to calculate the maximum values of the horizontal strain in the region of the occurrence of the deformations.
The conclusions presented in the works discussed in the introduction were substantiated. It should be remembered that rocks were characterized by high compressive strength and low tensile strength. Thus, at high values of horizontal strain, the occurrence of stresses exceeding the tensile strength was expected.
The DEFK-Win software [25] based on the Budryk–Knothe theory [27] was used in the calculations. This theory was also presented in the paper [14].
The following parameter values were assumed in the calculations:
- Roof control coefficient = 0.8.
- Tangent of the main impact range angle β = 2.0.
- Proportionality coefficient determining the horizontal strains = 0.32.
- Extraction boundary = 0 m.
The above parameter values were assumed in the calculations based on the analyses of the results of geodetic measurements conducted at the area of the mine [32]. It is the obligation of each Polish mine to update the values of the Budryk–Knothe theory parameters necessary for the purposes of predicting the impact of the planned exploitation on the surface.
In Figure 10, the map of the mean thickness of the extracted deposit is presented. It was obtained by multiplying the seam thickness by the exploitation coefficient. On the basis of the calculations conducted in the grid of points, a map of subsidence was created (Figure 11), as was as a map of the maximum horizontal strains along with their directions (Figure 12).
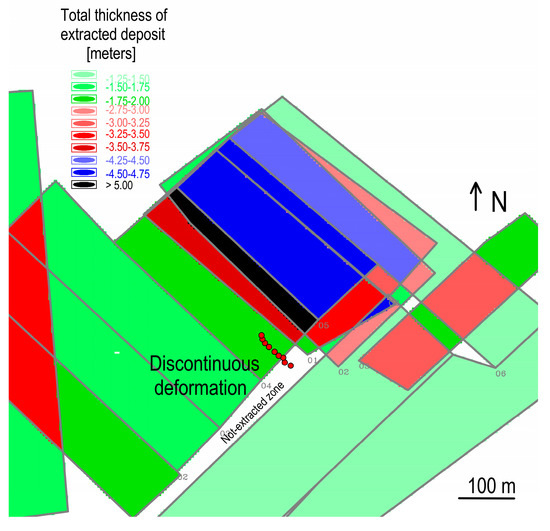
Figure 10.
The map of the thickness of the extracted deposit in the vicinity of the discontinuous deformation.
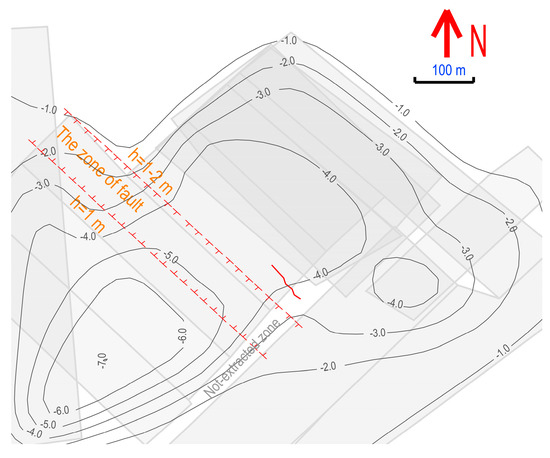
Figure 11.
The distribution of the calculated land surface subsidence resulting from the past extraction (values in meters).
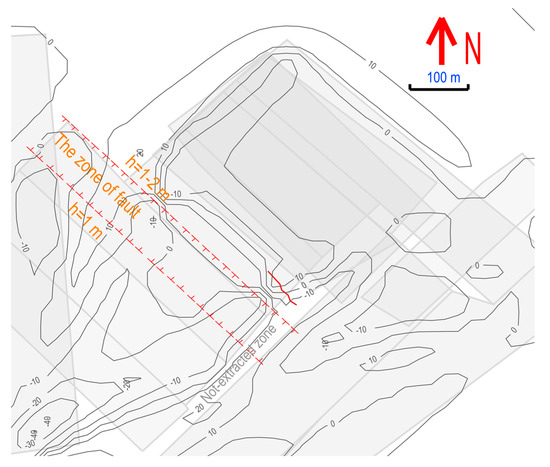
Figure 12.
The distribution of the final maximum horizontal strain values in the vicinity of the discontinuous deformation (values in m/mm).
As seen in Figure 10, the deformation was formed in the vicinity of an area separating the fields characterized by the highest and lowest thicknesses of the selected deposit. Moreover, it should be noted that in the area of the tectonic fault, the deposit was extracted very unevenly. A much higher mean thickness of the deposit was extracted on the side of the hanging-wall (over 5 m) than on the side of the footwall (2 m).
On the basis of Figure 11, it can be concluded that the maximum values of subsidence of ca. 7 m occurred to the west of the deformations. In the deformation area, the subsidence amounted to ca. 4.2 m. Therefore, it should be concluded that significant values of subsidence occurred in the area of the discontinuous deformations.
On the basis of Figure 12, which presents the distribution of the maximum horizontal strain contours, it should be stated that the deformations were located in the region of their largest values. A separate problem was the sum of the strain values in long time intervals. The calculations did not take into account the influence of time on the reduction of strain values. According to some researchers, this process should not be used [7].
The mining exploitation in the study area was conducted in three hard coal seams: 314, 318, and 324/3, in the years 1978–2011 (Table 1). When analyzing the course of the subsidences in time w(t) and the primary horizontal strains E1(t), E2 (t) presented in Figure 13 and Figure 14, it should be noted that the mining exploitation had repeated impacts on the studied terrain. This means that in the analyzed period, there were also moments when the movements of the rock mass ceased. In the area of the linear discontinuous deformation, the rock mass was mainly subject to the impact of deformations in the form of strain and (to a smaller extent) compression resulting from the conducted exploitation.
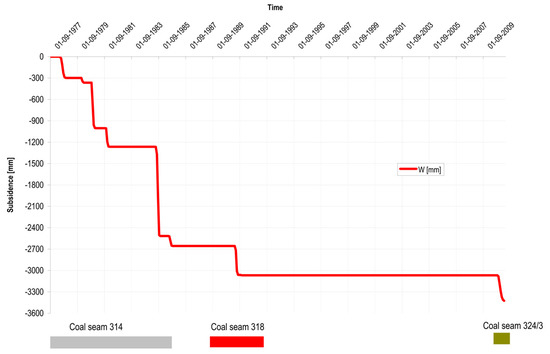
Figure 13.
The course of the surface subsidence at the location of the discontinuous deformation over time.
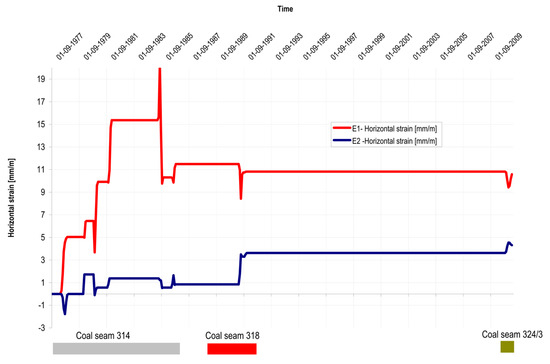
Figure 14.
The course of the principal horizontal strain (E1, E2) at the location of the discontinuous deformation over time.
The greatest increases in subsidences were connected to the exploitation conducted in seam 314: longwalls 03 and 04 (w ca. 640 mm) and longwalls 06 and 08 (w ca. 1250 mm). Until December 1986, the maximal subsidence resulting from the exploitation of these longwalls reached ca. −2655 mm. The biggest principal tensile strain occurred in July 1985 and amounted to ca. 20 mm/m. The obtained value was the result of the accumulation of rock mass deformation resulting from the exploitation in seam 314 until 1985.
In the early 1990s, mining exploitation was commenced in seam 318, and the subsidence increase of ca. 460 mm was connected to the exploitation of the 01 longwall that started in May 1991. The subsidence of the area in January 1992 amounted to −3062 mm. The biggest principal tensile strain was ca. 11.49 mm in April 1991.
Until October 2010, the conducted mining exploitation did not impact the area under analysis. Only the exploitation of the 02 longwall in the 324/3 seam caused a significant increase in the subsidences. The maximal subsidence in March 2011, at the time of the occurrence of the linear discontinuous deformation, amounted to ca. −3424 mm, and the biggest principal tensile strain was ca. 10.6 mm/m.
Fault activation as a result of mining works can primarily occur in the case of one-sided exploitation in its vicinity. The conditions favoring fault activation include the significant thickness of the exploited seam or the exploitation of a few seams, the watering of the fault, the large inclination angles of the fault surface, and the low cohesion of the rock mass at the fault boundary [15,16]. In 1980–1981, the exploitation was conducted on both sides of the fault. One-sided exploitation was conducted in both 1991 and 2010. In the period corresponding to the occurrence of the discontinuous deformation on the surface, the exploitation was conducted on the side of the hanging-wall of the fault in seam 324/3, longwall 02. The exploitation edge was located ca. 100 m to the north-east. This suggests that the activation of the fault zone was a factor that could have contributed to the formation of the discontinuous deformation.
3.6. Obtained Calculation Results and Their Review
In the study area, the horizontal tensile strain assumed values in excess of 10 mm/m. Moreover, the shape of the deformation approximated both the course of the 10 mm/m contours of the maximum horizontal strain, and the course of the low-throw fault found in the deposits. The above two facts indicate the causes of the deformation. The occurrence of the deformation in 2011, and not before, suggests that the main and primary causes of their occurrence were large horizontal tensile strains. Figure 13 and Figure 14 show that in the period of the occurrence of the deformation, the surface was impacted by exploitation in seam 324/3, longwall 02 (from 2010 to 2011). During that time, there was an increase in subsidence and principal horizontal strain in the second direction E2.
However, the presence of a tectonic fault could be a factor conductive to the occurrence of deformations. This was evidenced by the fact that in other places where the horizontal tensile strain also assumed values close to 10 mm/m (Figure 12), but without tectonic faults, discontinuous deformations did not occur. It should also be noted that in the mid-1980s, the state of rock mass deformation caused by mining exploitation was conductive to the formation of a discontinuous deformation, but such a deformation did not occur on the surface at that time.
It should be highlighted that the tectonic fault in question was characterized by a very small value of vertical throw. It was much smaller than in the cases described in the literature, in which linear deformations in the form of ground steps and cracks on the surface occurred. The observed linear deformation had the characteristics of a graben. In the literature, such deformations have been observed in the case of inclined terrain. This demonstrates the possibility of the occurrence of such deformations, posing a greater threat to safety than ground steps in conditions that have not been taken into account previously. Therefore in different geological and mining conditions, it also needs to be taken into account that high values of horizontal deformations caused by exploitation carried out in the area of faults can cause this type of discontinuous linear deformation on the surface. It also needs to be noted that this even applies to faults characterized by a small value of vertical throw.
Deformations of that type pose a particular threat to buildings and their users. Currently, there is no method to effectively protect structures against these deformations. Therefore, the possibility of the complete destruction of buildings should be taken into account. This forces the abandonment of exploitation or a serious limitation of its scope.
4. Conclusions
This paper presents a case study of an extensive linear discontinuous deformation. The issues concerning the occurrence of this type of deformations are important due to the high risk posed to the buildings on the surface. It should also be noted that these deformations are not uncommon—both in Poland and in other mining countries of the world. The analyses carried out within the study allowed us to draw the following conclusions:
- The main and basic cause of the occurrence of the deformation was the conducted mining exploitation with caving in three coal seams at the depths between 200 and 545 m. This exploitation caused significant (i.e., exceeding 10 mm/m) horizontal tensile strain values. The obtained results confirmed the known conclusions drawn from studies conducted by other authors. However, the cases described in the literature only presented the occurrence of ground steps and cracks in the rock mass—not grabens (as was the instance in the analyzed case).
- A factor that could have contributed to the formation of the deformation was the occurrence of a tectonic fault in the area of the deformation. Its course overlapped with the direction of the resulting deformation, which confirmed this view. Another convincing argument was the fact that no discontinuous deformations occurred in places where the values of the horizontal tensile strain were the same, but there were no tectonic faults. Here, it should be noted that the fault throw was of small value—as opposed to the cases known from the literature. This suggests that the activation of even a small fault can cause dangerous and extensive deformations.
- The way to avoid the dangers associated with the occurrence of linear deformations is to design the exploitation in such a way as to limit the occurrence of high-value horizontal strain or at least to allow for their occurrence in undeveloped zones.
Author Contributions
Conceptualization, P.S. and K.S.; methodology, P.S.; software, P.S and K.S.; validation, P.S. and K.S.; formal analysis, P.S. and K.S.; investigation, P.S. and K.S.; resources, P.S.; data curation, K.S.; writing—original draft preparation, P.S. and K.S.; writing—review and editing, P.S. and K.S.; visualization, K.S.; supervision, P.S.; project administration, K.S. All authors have read and agreed to the published version of the manuscript.
Funding
This work was supported by the DKW (Departmental costs of principal activity units), MPK: 06/040, Department of Geomechanics and Underground Construction, Faculty of Mining, Safety Engineering and Industrial Automation, Silesian University of Technology, Gliwice, Poland.
Acknowledgments
The authors thankfully acknowledge the Silesian University of Technology, Poland, for providing all the facilities to perform the research work.
Conflicts of Interest
The authors declare no conflict of interest.
References
- He, C.; Xu, J.; Wang, F.; Wang, F. Movement Boundary Shape of Overburden Strata and Its Influencing Factors. Energies 2018, 11, 742. [Google Scholar] [CrossRef]
- Peng, S. Coal Mine Ground Control, 3rd ed.; West Virginia University: Morgantown, WV, USA, 2008; p. 750. [Google Scholar]
- Ścigała, R.; Szafulera, K. Linear discontinuous deformations created on the surface as an effect of underground mining and local geological conditions—Case study. Bull. Eng. Geol. Environ. 2019, 1–10. [Google Scholar] [CrossRef]
- Orwat, J. Causes analysis of occurrence of the terrain surface discontinuous deformations of a linear type. J. Phys. 2020, 1426, 1–9. [Google Scholar] [CrossRef]
- Kowalski, A.; Kotyrba, A. Linear discontinuous deformation of A4 highway within mining area Halemba. Miner. Resour. Manag. 2009, 25, 303–317. [Google Scholar]
- Chudek, M. Rock Mass Mechanics with Basics of Environment Management in Mining and Post-Mining Areas; Publishing House of Silesian University of Technology: Gliwice, Poland, 2010; p. 499. [Google Scholar]
- Strzałkowski, P. Overview of Mining Areas Protection; Publishing House of Silesian University of Technology: Gliwice, Poland, 2015; p. 192. [Google Scholar]
- Bell, F.G.; Stacey, T.R.; Genske, D.D. Mining subsidence and its effect on the environment: Some differing examples. Environ. Geol. 2000, 40, 135–152. [Google Scholar] [CrossRef]
- Strzałkowski, P.; Ścigała, R. The causes of mining induced ground steps occurrence—Case study from Upper Silesia in Poland. Acta Geodyn. Geomater. 2017, 14, 305–312. [Google Scholar] [CrossRef]
- Li, X.; Wang, S.J.; Liu, T.Y.; Ma, F.S. Engineering geology, ground surface movement and fissures induced by underground mining in the Jinchuan Nickel Mine. Eng. Geol. 2004, 76, 93–107. [Google Scholar] [CrossRef]
- Woo, K.; Eberhardt, E.; Elmo, D.; Stead, D. Empirical investigation and characterization of surface subsidence related to block cave mining. Int. J. Rock Mech. Min. Sci. 2013, 61, 31–42. [Google Scholar] [CrossRef]
- Donnelly, L.J. A review of international cases of fault reactivation during mining subsidence and fluid abstraction. Q. J. Eng. Geol. Hydrogeol. 2009, 42, 73–94. [Google Scholar] [CrossRef]
- Hellewell, E.G. Influence of faulting on ground movement due to coal mining. The UK and European experience. Min. Eng. 1988, 147, 334–337. [Google Scholar]
- Kratzsch, H. Mining Subsidence Engineering; Springer-Verlag: Berlin/Heidelberg, Germany; New York, NY, USA, 1983; p. 543ff. [Google Scholar]
- Ścigała, R. The identification of parameters of theories used for prognoses of post mining deformations by means of present software. Arch. Min. Sci. 2013, 58, 1347–1357. [Google Scholar] [CrossRef]
- Ścigała, R. The Influence of Deposit Tectonics on the Distribution on Mining Area Deformations; Publishing House of Silesian University of Technology: Gliwice, Poland, 2013; p. 160. [Google Scholar]
- Tajduś, A.; Cała, M.; Tajduś, K. Seismicity and rock burst hazard assessment in fault zones: A case study. Arch. Min. Sci. 2018, 63, 747–765. [Google Scholar] [CrossRef]
- Malinowska, A.A.; Hejmanowski, R. The impact of deep underground coal mining on Earth fissure occurrence. Acta Geodyn. Geomater. 2016, 13, 321–330. [Google Scholar] [CrossRef]
- Deng, Y.; Chen, C.; Xia, K.; Pang, H.; Sun, C.; Yang, K.; Zheng, X. Investigation on the distribution characteristics of ground cracks in the Chengchao Iron Mine, China. Environ. Earth Sci. 2019, 78, 280. [Google Scholar] [CrossRef]
- Zhu, H.; He, F.; Fan, Y. Development mechanism of mining-induced ground fissure for shallow burial coal seam in the mountains area of southwestern China: A case study. Acta Geodyn. Geomater. 2018, 15, 329–362. [Google Scholar] [CrossRef]
- Kang, J. Analysis of effect of fissures in caused by underground mining on ground movement and deformation. Artic. Yanshilixue Yu Gongcheng Xuebao/Chin. J. Rock Mech. Eng. 2008, 27, 59–64. [Google Scholar]
- Peng, J.; Qiao, J.; Leng, Y.; Wang, F.; Xue, S. Distribution and mechanism of the ground fissures in Wei River Basin, the origin of the Silk Road Environ. Earth Sci. 2016, 75, 1–12. [Google Scholar] [CrossRef]
- Li, J.; Liu, C. Formation Mechanism and Reduction Technology of Mining-Induced Fissures in Shallow Thick Coal Seam Mining. Shock Vib. 2017, 6, 14. [Google Scholar] [CrossRef]
- Lian, X.; Hu, H. Terrestrial laser scanning monitoring and spatial analysis of ground disaster in Gaoyang coal mine in Shanxi, China: A technical note. Environ. Earth Sci. 2017, 76, 287. [Google Scholar] [CrossRef]
- Ścigała, R. Computer Aided Forecasting of Rock Mass and Surface Deformations; Publishing House of Silesian University of Technology: Gliwice, Poland, 2008; p. 127. [Google Scholar]
- Zych, J. The Method of Predicting Mining Exploitation Influences on the Ground Surface Taking into Account the Asymmetry of Deformation Process; Publishing House of Silesian University of Technology: Gliwice, Poland, 1987; p. 158. [Google Scholar]
- Knothe, S. Forecasting the Impact of Mining Exploitations; Publishing House ‘Śląsk’: Katowice, Poland, 1984; p. 122. [Google Scholar]
- Kryzia, K.; Majcherczyk, T.; Niedbalski, Z. Variability of exploitation coefficient of Knothe theory in relation to rock mass strata type. Arch. Min. Sci. 2018, 63, 767–782. [Google Scholar] [CrossRef]
- Strzałkowski, P. Some Remarks on Impact of Mining Based on an Example of Building Deformation and Damage Caused by Mining in Conditions of Upper Silesian Coal Basin. Pure Appl. Geophys. 2019, 176, 2595–2605. [Google Scholar] [CrossRef]
- Gabzdyl, W. Geology of Coal Deposits. Deposits of the World; Polska Agencja Ekologiczna: Warsaw, Poland, 1994; p. 400. [Google Scholar]
- Jureczka, J.; Ignatowicz, A.; Zdanowski, A. Polish hard coal basins—And overview of the history of the researche of the National Geological Institute. Przegląd Geologiczny 2019, 67, 578–583. [Google Scholar]
- Strzałkowski, P.; Szafulera, K. Mining—Geological Opinion Concerning Mining Extraction Influences on the Ground Surface in the Area of Marzankowicka Street in Mikołów; Unpublished Work; Silesian University of Technology: Gliwice, Poland, 2019. [Google Scholar]


© 2020 by the authors. Licensee MDPI, Basel, Switzerland. This article is an open access article distributed under the terms and conditions of the Creative Commons Attribution (CC BY) license (http://creativecommons.org/licenses/by/4.0/).