A Risk Assessment Model of Coalbed Methane Development Based on the Matter-Element Extension Method


Abstract
1. Introduction
- (1)
- Most studies focus on economic risk factor analyses of the national CBM industry. At present, risk assessment research for CBM development projects has not provided a reference for investors, insurance companies and CBM development operators.
- (2)
- Although several researchers have studied the risk of CBM development projects, the research depth was insufficient because the studies only determined the weight of the CBM risk assessment indicators. These studies used the weights to identify the main risk factors of CBM development, but failed to quantitatively measure the overall risk levels of CBM development projects and calculate the membership degree of each bottom index.
- (3)
- In terms of the construction of the indicator system, the above studies lack a systematic and comprehensive indicator selection process and did not cover the life cycle of CBM development, including geological exploration, drilling, gathering, and market applications. Therefore, the research results have a certain one-sidedness.
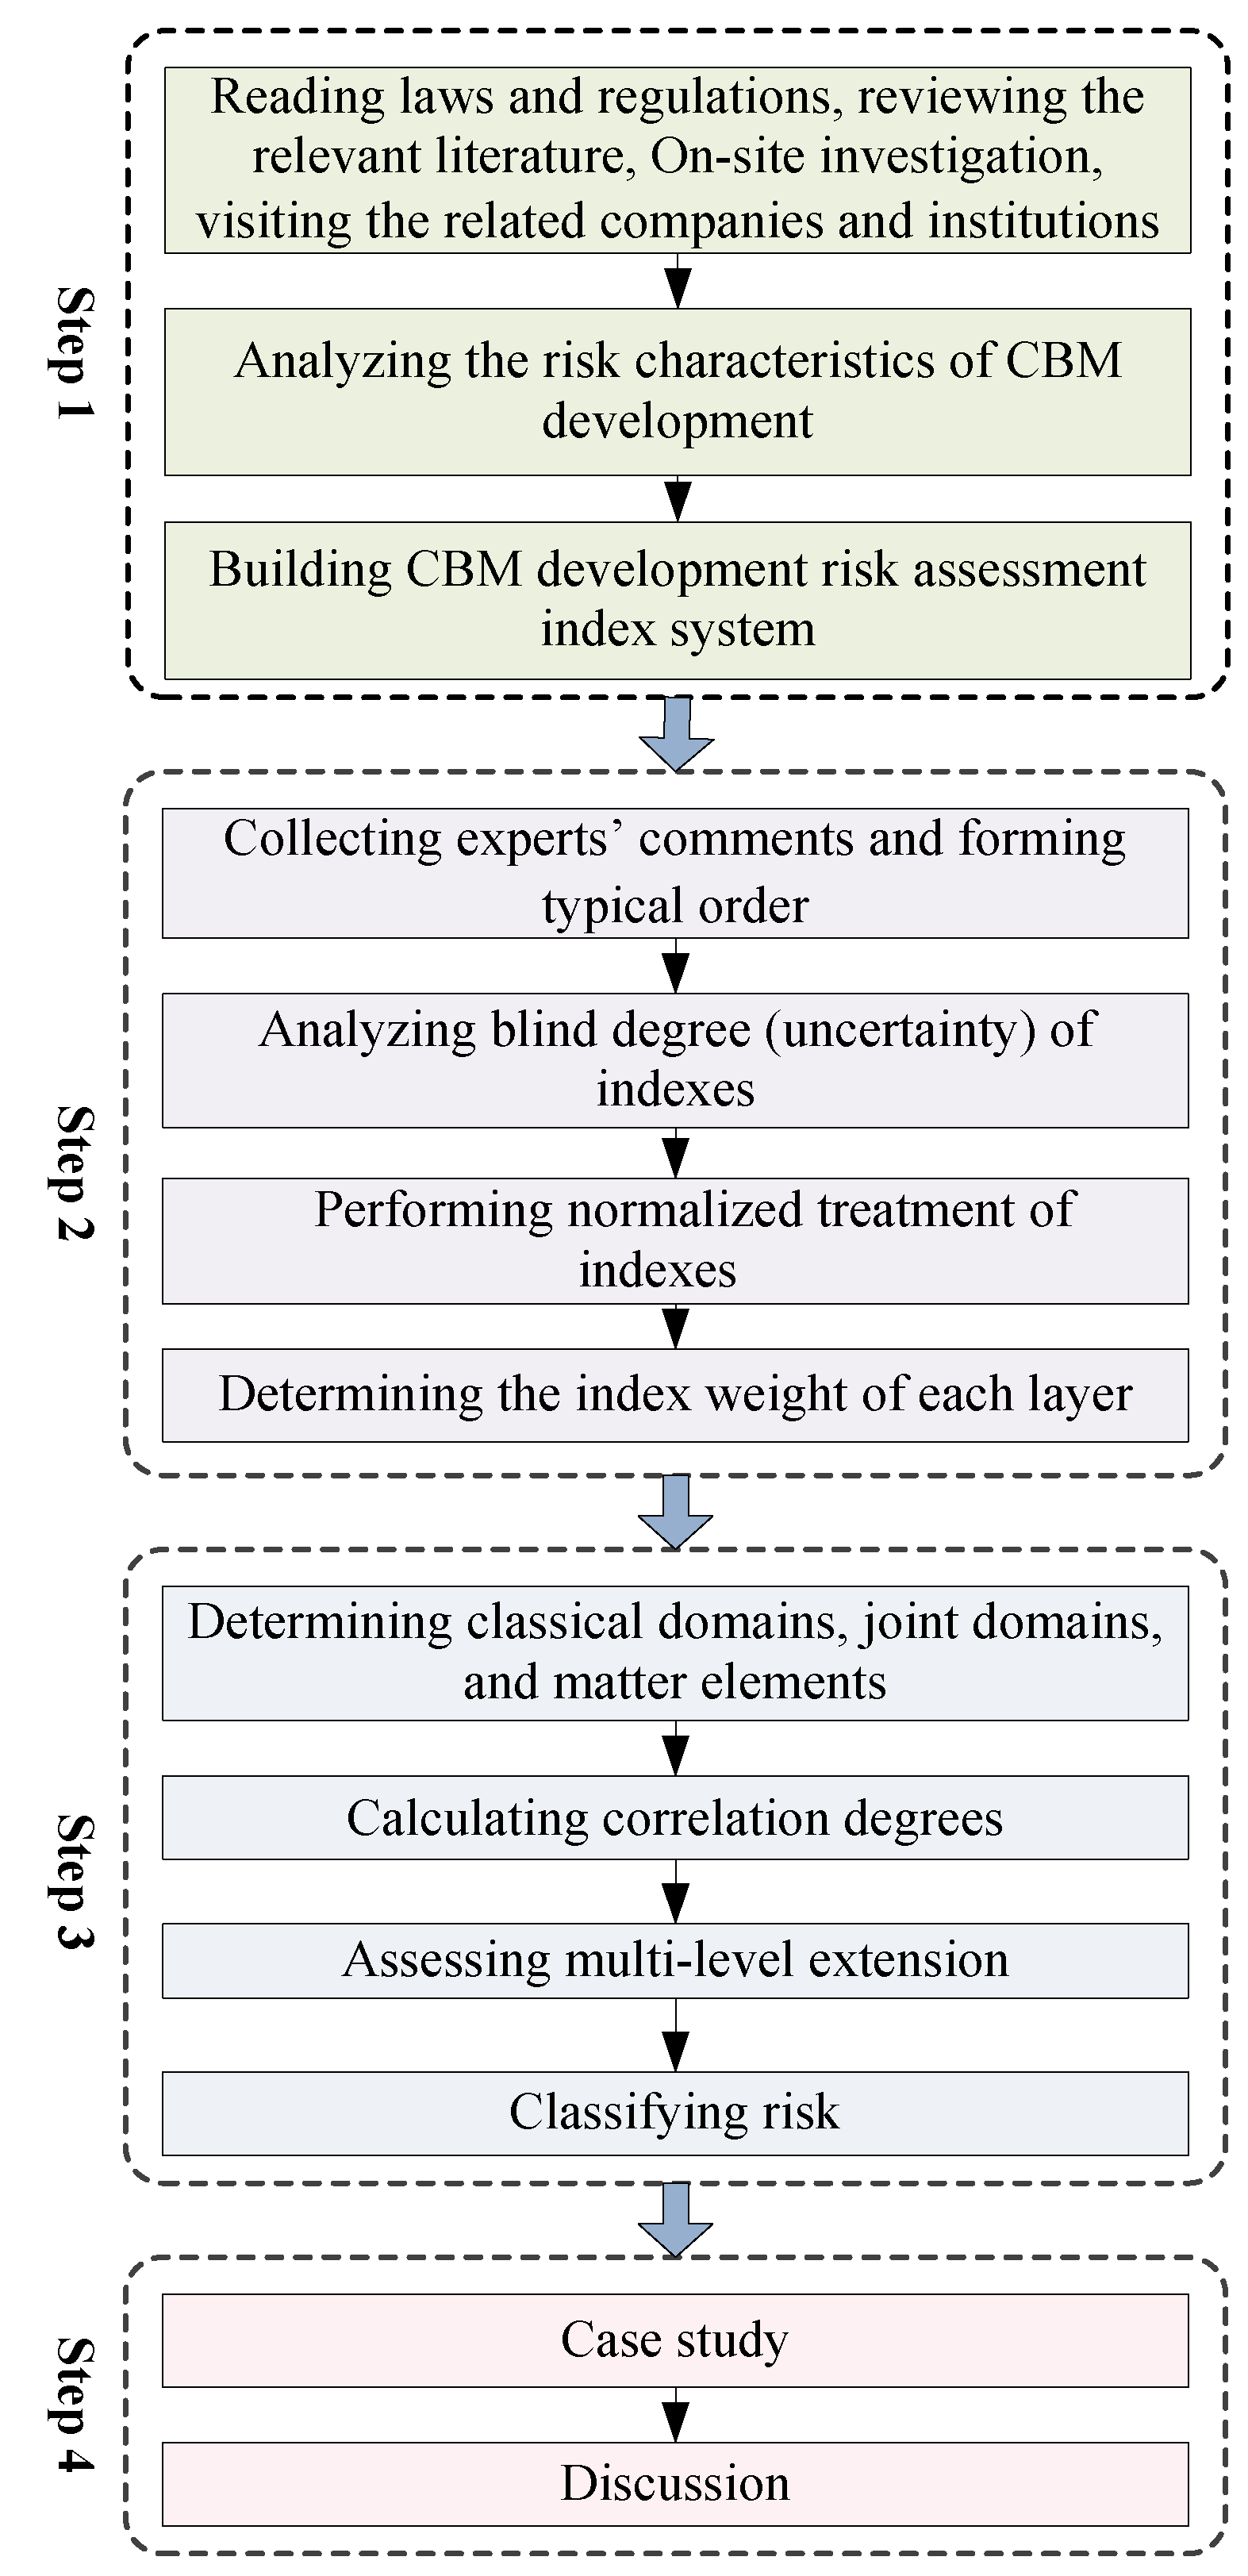
2. Methodology
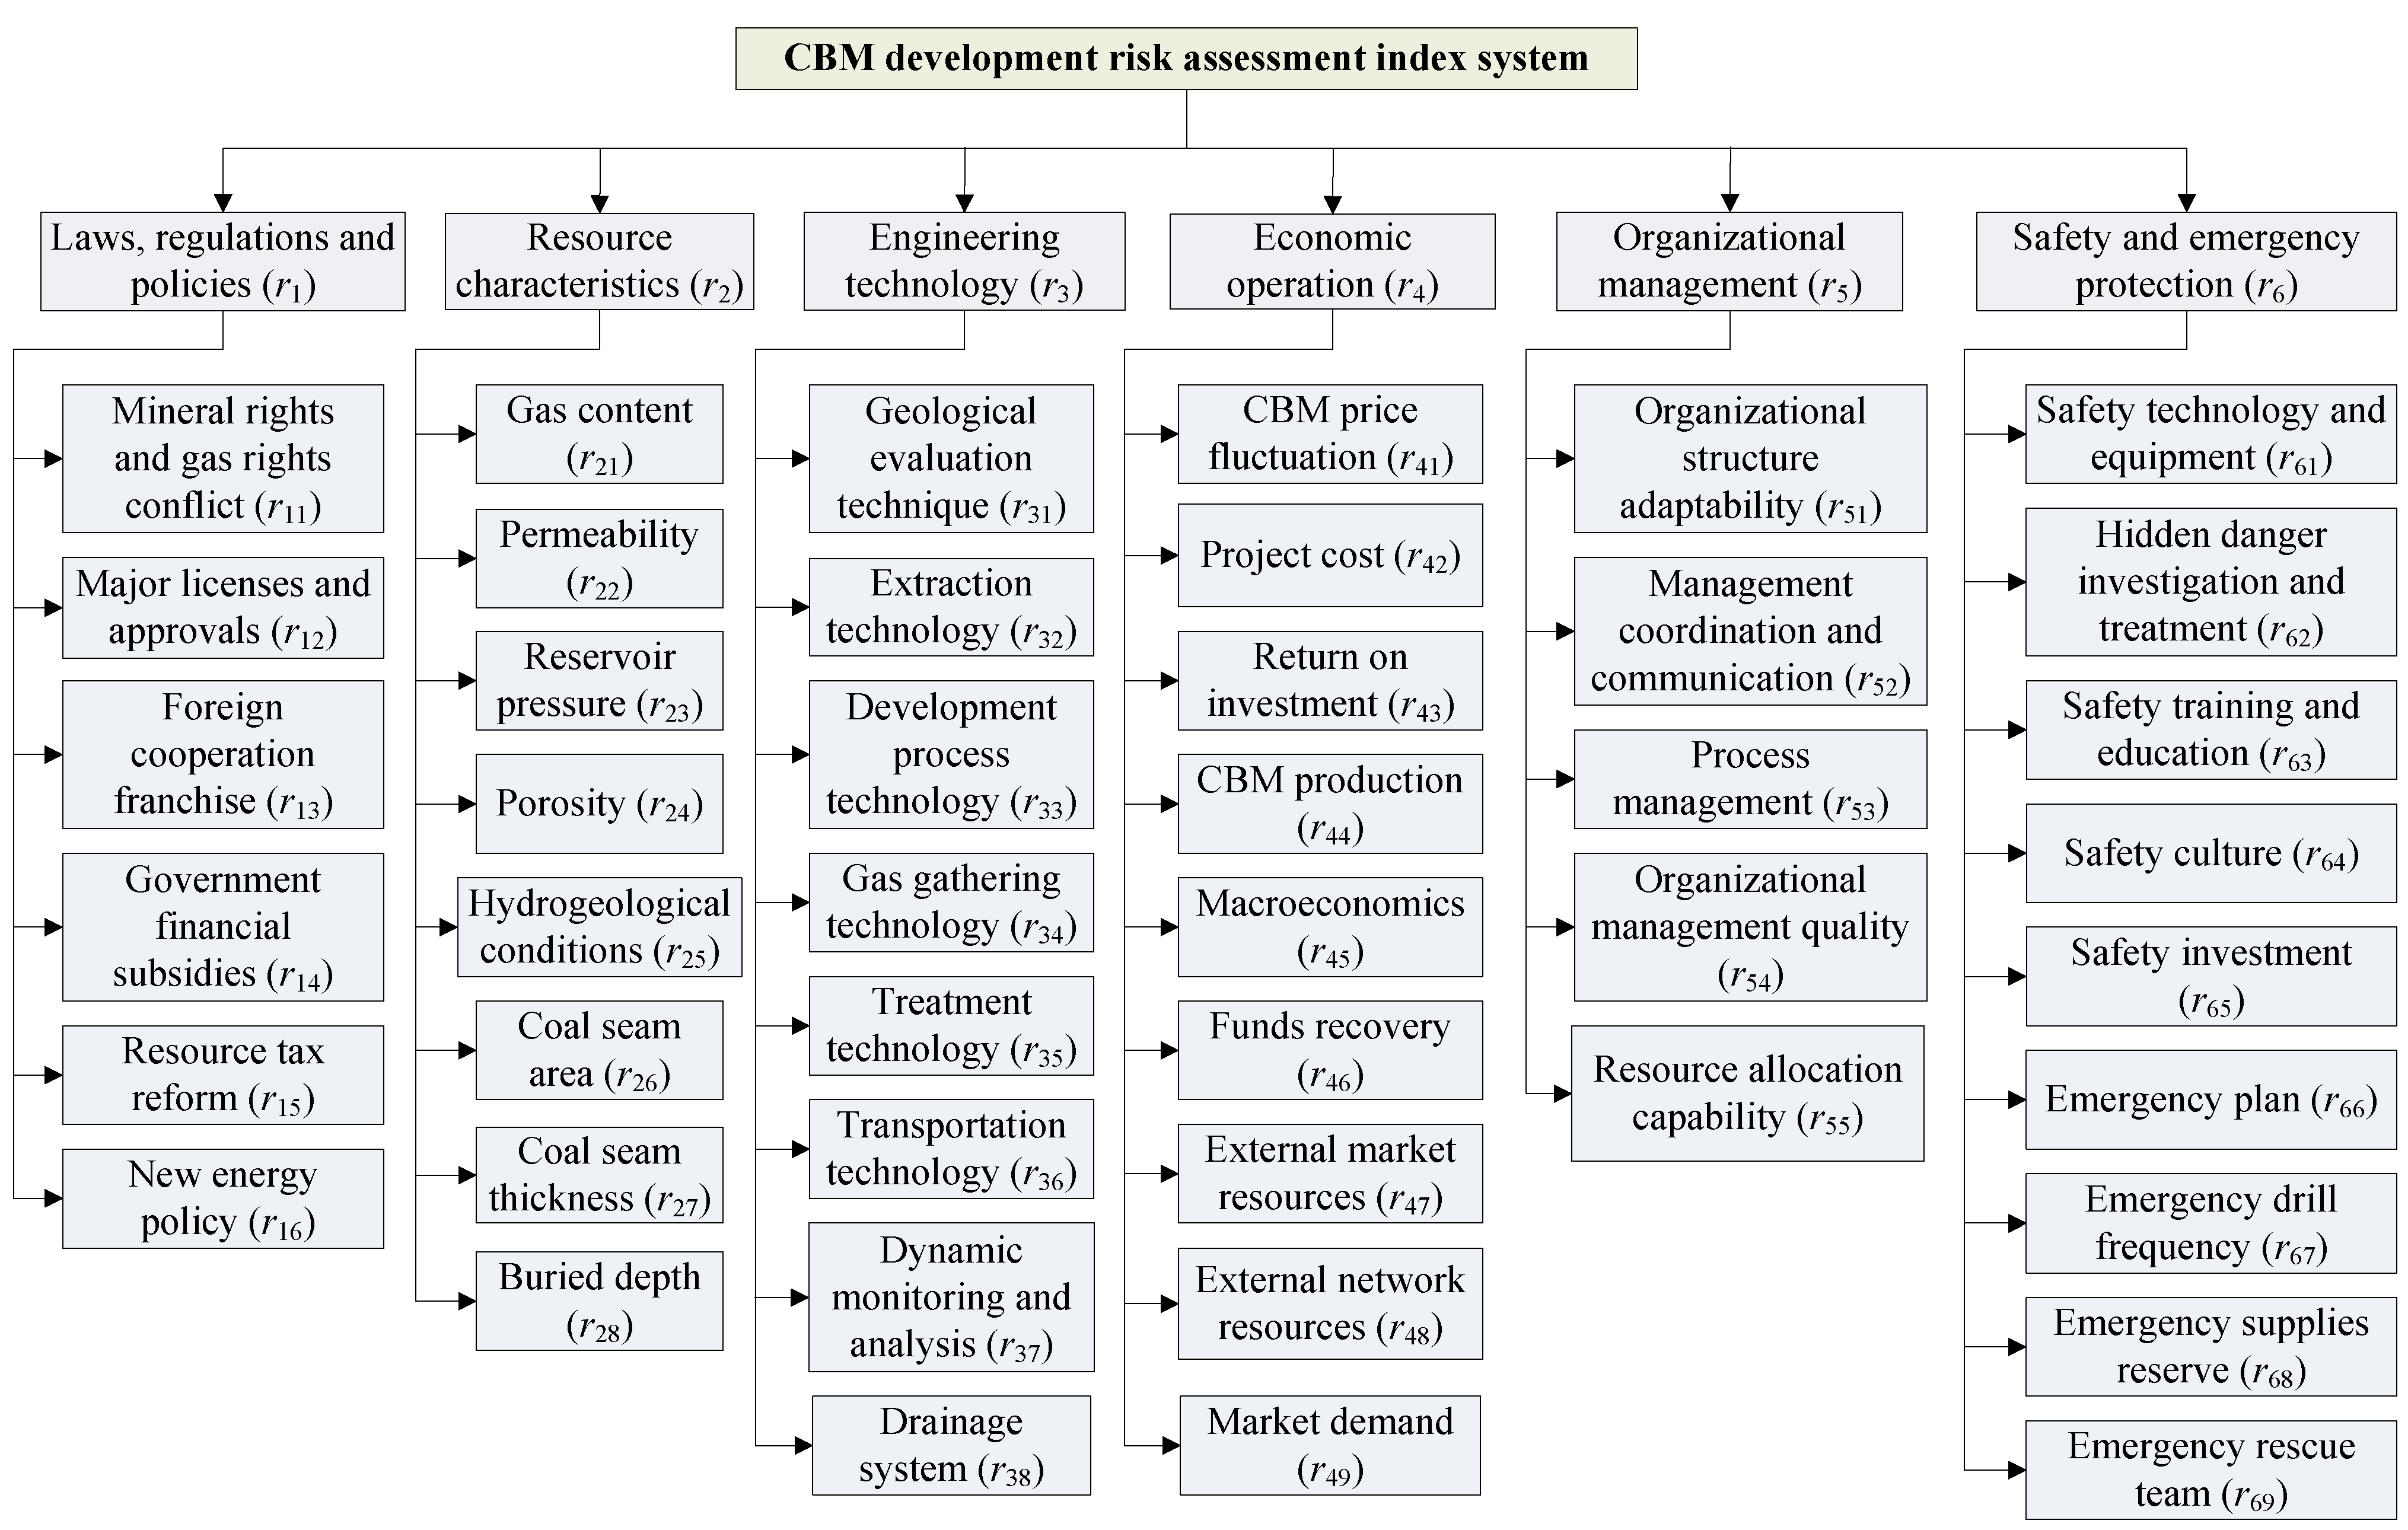
2.1. Construction of the CBM Development Risk Assessment Index System
2.1.1. Principle
2.1.2. Construction of Index System
2.2. Determination of Index Weights
2.2.1. Principle of the SEWM
2.2.2. Calculation of the Index Weight
- (1)
- The rank results from the four groups of experts were collected in Table 2:
- (2)
- The obtained rank matrix A:
- (3)
- The calculated membership matrix B was based on Equation (4) and rank matrix A, and m was set as 8.
- (4)
- The average degree of understanding of a particular dimension from all experts:
- (5)
- Based on the previous results and Equations (5) and (6), the blind understanding degree σj for the indexes from all experts could be obtained. Then, the evaluation vector X could be calculated according to the blind understanding degree σj and Equation (7). Finally, the weight of each index could be achieved by the normalized treatment method. The calculated result of each parameter is shown in Table 3. Similarly, the weight distribution of the second grade indexes can be obtained by refining. The index distribution is shown in Table 4. The detailed calculation processes are shown in Appendix B (Table A2, Table A3, Table A4, Table A5, Table A6 and Table A7.).
2.3. Assessment Model Construction
2.3.1. Determination of the Classical Domain, Joint Domain and Matter-Element Evaluation
2.3.2. Calculating the Correlation Degree
2.3.3. Multi-Level Extension Assessment
2.3.4. Risk Classification
3. Case Study
3.1. Determination of the Classical Domain, Joint Domain and Matter-Element Evaluation
3.2. Calculating the Correlation Degree
3.3. Multi-Level Extension Assessment
4. Results and Discussion
- (1).
- The correlation degree of comprehensive risk of the research object is 0.108, and the overall risk level of the CBM development project is judged to be Grade II according to the principle of maximum membership degree. This finding shows that the overall risk of the project is small and within an acceptable range, but the local risk of the project needs to be rectified in a timely manner.
- (2).
- According to the calculation results of the correlation degree of the second grade indexes in Table 6, it is possible to determine the links with higher risks in the second grade indexes. The following is an analysis of the indexes with risk levels greater than Grade II.
- (1)
- According to the investigation, the operators of the project did not obtain the right to cooperate with foreign countries, which indicates that the project cannot be assisted by foreign companies in terms of technology and management. Therefore, the project is at a higher risk in foreign cooperation franchises.
- (2)
- The transportation technology of this project is relatively backwards, and mainly relies on tank trucks for CBM transportation, and there is no long-distance pipeline network for the system. Therefore, the transportation technology risk of this project is high. It is recommended that the project operator regularly check the reliability of the tank truck equipment and conduct safety training for the tank truck driver.
- (3)
- Because the project operators are affiliated with private enterprises, and the enterprises have been established only for a short period, a well-known corporate image or reputation in the CBM industry have not been established. For these reasons, the project’s external market resource risk is high.
- (4)
- The project is not doing well in safety training and education. According to the survey, not all employees have participated in safety training, which will cause high risks to the daily operation of the project. CBM leakage and explosion accidents caused by human error are not uncommon; therefore, project operators should pay more attention to this aspect.
- (5)
- The number of daily emergency drills of the project is not up to standard. During the investigation of the emergency drill record, it was found that the project conducted only one accident emergency drill every year, which did not meet the standards of China’ China’s Safe Production Law stipulates that emergency drills be performed at least once every six months for firms involved in the production, filling, storage, supply and sales of flammable and explosive chemicals and the emergency plan is to be continuously improved in light of the actual situation. Therefore, to reduce the project risk, the project operators should add at least one more accident emergency drill every year.
- (6)
- The project’s emergency supplies were not adequately prepared and did not include gas masks and explosion-proof emergency lights. The main component of CBM is methane, which is a flammable, explosive, toxic and corrosive gas. If a CBM leak accident occurs during the production process, rescue personnel are required to have a gas mask; otherwise, death, due to suffocation, is likely. Moreover, project operators should be equipped with a sufficient number of explosion-proof emergency lights. Other lighting equipment may cause methane explosion accidents, due to static electricity during use.
- (7)
- The risks of other second grade indexes are very small, and their risk levels reached the first or second level. First, the risks of laws, regulations and policies faced by the project are minimal. The current new energy policies and financial subsidy policies are conducive to the development of the CBM industry. Second, there is no conflict between mining rights and air rights in the block where the project is located. In addition, the major licensing and approval procedures for the project are also complete. Third, the coal reservoirs in the block where the project is located have good porosity, high permeability, high gas content and gas saturation, which are conducive to the development of CBM. Finally, the economic operational risks of the project are also small. The project’s return on investment and CBM production are at a high level.
- (8)
- In summary, the overall risk of the project is small and within an acceptable range, indicating that the project has development value. The assessment results are in good agreement with the actual operation of the project, indicating that the established risk assessment model is feasible and effective.
5. Conclusions
- (1)
- Taking a CBM development project as the research object and considering the risk characteristics of exploration, mining, gathering and market application involved in the project life cycle, a CBM development risk assessment index system consisting of six first grade indexes and 45 second grade indexes is constructed.
- (2)
- Based on the SEWM, the weights of the risk assessment indexes are calculated. Then, the MEEM is used to construct the theoretical model of CBM development risk assessment.
- (3)
- A case study of a CBM development project in the southern Qinshui Basin of China was carried out using the established CBM development risk assessment model. The results show that the overall risk level of the CBM development project is Grade II, indicating that the overall risk of the project is small and within an acceptable range, although the local risk of the project needs to be rectified in a timely fashion. The assessment results are in good agreement with the actual operation of the project, indicating that the established risk assessment model has good applicability and effectiveness.
- (4)
- The study makes three contributions. First, the research results can help relevant government departments formulate policies to reduce the risks faced by the CBM industry. Second, this work can provide a reference for investors to evaluate the feasibility of CBM development projects and for insurance companies to determine the insurance rate of CBM development projects. Finally, the research results are also conducive to improving the risk awareness and risk perception of CBM project operators. Therefore, the accuracy of managers’ risk aversion decisions can be improved, and the waste of resources and property loss caused by the failure of risk management and control in the daily production process of the project can be reduced.
Author Contributions
Funding
Conflicts of Interest
Abbreviations
| CBM | Coalbed methane |
| SEWM | Structure entropy weight method |
| MEEM | Matter-element extension method |
Appendix A

| First Grade Indexes (ri) | Index Analysis | Second Grade Indexes (rik) | Index Analysis | Reference |
|---|---|---|---|---|
| Laws, regulations and policies (r1) | Such risks refer to the laws, regulatory constraints and policy controls that are affected during the development of CBM. They also include uncertainties, such as audit approvals for CBM development. | Mineral rights and gas rights conflict (r11) | In China, coal mines are licensed by the State Ministry of Land and Resources and the Provincial Department of Land and Resources, while CBM is licensed by the Ministry of Land and Resources. However, there are often overlapping conflicts between CBM and coal at the level of hydrocarbon accumulation. In addition, China has not always made good distinctions between the block planning of coal mines and CBM. Therefore, in many blocks, there are both coal mining rights issued by the Provincial Department of Land and Resources and CBM mining rights granted by the State Ministry of Land and Resources. This type of conflict has caused many worries for investors. | Zhang et al. [29] |
| Major licenses and approvals (r12) | CBM development also involves a number of major licensing and approval risks. Investors and companies should strictly inspect the exploration and mining licenses, safety production licenses and dangerous chemicals business licenses for CBM development projects. The absence of any of the above documents poses a significant risk to the operation of the project. | PRC [38] | ||
| Foreign cooperation franchise (r13) | Foreign cooperation can make up for the shortage of funds for CBM projects and introduce advanced technology and management experience, thus promoting the development of CBM projects. | PRC [39] | ||
| Government financial subsidies (r14) | Increasing financial subsidies can increase corporate liquidity, reduce production costs, and ease corporate investment pressures. Lowering or eliminating financial subsidies will increase competition in the CBM market and restrict the initial development of CBM enterprises. | Zhang et al. [13] | ||
| Resource tax reform (r15) | Increasing the resource tax will increase the production cost of CBM enterprises, reduce the profit margin, and hinder the enthusiasm of enterprises. In contrast, reducing or cancelling unreasonable tax and fee systems and increasing tax incentives will incentivize CBM enterprises. | Zhang et al. [13] | ||
| New energy policy (r16) | In the short run, CBM resources account for a certain proportion o’ China’s energy consumption. However, in the long run, with the development of new energy technologies, there will be inevitable changes i’ China’s energy structure, affecting the supply and demand of CBM. Therefore, the implementation of the national new energy policy may introduce risks to CBM development. | PRC [39] | ||
| Resource characteristics (r2) | Risks associated with resource characteristics mainly come from the CBM resources themselves and geological factors. Such risks refer to factors that are unstable or not widely available, due to resource conditions, resource distribution, CBM quality and geological factors. | Gas content (r21) | The gas content of CBM determines the critical desorption pressure. The higher the critical desorption pressure, the smaller the magnitude of the pressure reduction required for the CBM well. This also means that the earlier the CBM well starts to produce gas, the more methane gas can be desorbed by the coal seam. Therefore, insufficient CBM resources may pose risks to CBM development. | Roadifer et al. [10] |
| Permeability (r22) | Permeability is the most critical factor in controlling the flow of CBM in coal reservoirs and the gas production of gas wells. It determines whether CBM can be successfully recovered. Therefore, permeability directly affects the economic benefits of CBM development, and low permeability of the coal seam may pose risks to the development of CBM. | Zhang et al. [13] | ||
| Reservoir pressure (r23) | In the production process of CBM, a reasonable grasp of the trend of bottom hole flow pressure can reduce reservoir sensitivity, and thus, increase the production of CBM. Therefore, the size and distribution of coal reservoir pressure affect not only the enrichment of CBM, but also the production of CBM. | Zhang et al. [13] | ||
| Porosity (r24) | Porosity is a key factor in determining the adsorption, permeability and strength properties of coal. By measuring the porosity and pressure of the CBM, the content of free CBM in the coal can be obtained. As a transport channel connecting the adsorption volume with the free surface, the pores also constitute the adsorption, diffusion and permeation system of CBM. Therefore, poor coal seam porosity may pose risks to CBM development. | Mares et al. [16] | ||
| Hydrogeological conditions (r25) | The groundwater system controls the adsorption and accumulation of CBM through formation pressure. This gas control can cause the CBM to escape, and it can also conserve the CBM. In the development of CBM, CBM wells generally require a large amount of drainage and pressure reduction to produce gas. Therefore, regional hydrogeological conditions are the main factors determining the selection of well network, downhole equipment and dehydration process in the development of CBM. Therefore, unsuitable hydrogeological conditions may introduce risks to the development of CBM. | Lei et al. [31] | ||
| Coal seam area (r26) | At the initial stage of the CBM development process, the coal seam area containing CBM is an important measure. In general, the larger the area of the gas-bearing coal seam, the higher the CBM content. Therefore, a poor coal seam area may pose risks to CBM development. | Zhai et al. [32] | ||
| Coal seam thickness (r27) | In the case of a certain degree of gas saturation, the thickness of the coal seam directly determines the amount of gas-bearing resources of the gas reservoir. The thicker the coal seam, the more abundant the CBM that converges into the wellbore and the higher the CBM production. Therefore, insufficient coal seam thickness may introduce risks to CBM development. | Zhai et al. [32] | ||
| Buried depth (r28) | The burial depth of coal seams is the main source of pressure. As the burial depth increases, the pressure will increase, which will increase the coalbed’s ability to adsorb methane. In addition, if the geological structural conditions change so that the burial depth of the coal seam changes, the pressure will be changed, thus, affecting the preservation of the CBM reservoir. Therefore, the burial depth of CBM may introduce risks to the development of CBM. | Ge et al. [30] | ||
| Engineering technology (r3) | Engineering technology risks are mainly caused by inadaptability of geological evaluation, exploration and development, ground supporting engineering, dynamic monitoring and analysis and other technologies. | Geological evaluation technique (r31) | Geological evaluation technology plays a key role in understanding the geological conditions of CBM resources and the law of hydrocarbon accumulation. Advanced geological resource evaluation technology can accurately detect the distribution and enrichment of CBM resources. Therefore, backward geological evaluation technology will introduce risks to the development of CBM. | Mu et al. [17] |
| Extraction technology (r32) | The extraction technology involves the adaptability of coal seams, which will directly affect the recovery and production of CBM wells. Moreover, the extraction technology and the drainage system should be coordinated; otherwise, reservoir ground stress and effective stress sensitivity damage will be caused, and the permeability will decrease. Therefore, backward mining technology may introduce risks to the development of CBM. | Jie et al. [33] | ||
| Development process technology (r33) | The technology used in CBM development, the means for increasing production and the effect of increasing production vary across projects. At present, China’s CBM development process technology mainly uses fracturing stimulation technology, and the fracturing effect directly affects the production of CBM wells. Therefore, if the CBM development process is backward, it will introduce risks to the development of CBM. | Jie et al. [33] | ||
| Gas gathering technology (r34) | Gas gathering technology can effectively reduce the pressure of the gas production pipeline and the operating cost of the pipeline network and improve the operating efficiency and the development of CBM. Therefore, backward gas gathering process technology will increase operating costs and reduce operating efficiency, which will introduce risks to the development of CBM. | Jie et al. [33] | ||
| Treatment technology (r35) | The treatment technology can not only increase the methane content in the CBM, but also realize the compression or liquefaction of the CBM, thereby greatly increasing the storage and transportation volume of the CBM and driving the development of the CBM enterprises. Therefore, if the treatment technology is backward, the quality, reserves and transportation of CBM will be reduced, thus, introducing economic risks to CBM development. | Jie et al. [33] | ||
| Transportation technology (r36) | At present, CBM is mainly transported by tank trucks and pipelines. Among them, the tank truck transportation risk is greater because it involves more human error, and the delivery volume is much smaller than that of pipeline transportation. Transportation by long-distance pipeline network can reduce the potential for explosions caused by low-concentration CBM. Pipeline transportation technology can not only reduce the purification cost, but also greatly increase the transportation capacity of CBM. Therefore, backward transportation technology will also affect the development of CBM enterprises. | Jie et al. [33] | ||
| Dynamic monitoring and analysis (r37) | Dynamic monitoring and analysis technology can observe and monitor the dynamic production of CBM exploration and development activities. This technology can determine the pressure distribution, connectivity of gas wells, and utilization of coal reservoirs. The technology can also guide production adjustment, which is conducive to improving the description accuracy of CBM reservoirs and the development of coal seams, thereby increasing the recovery rate of CBM. Therefore, the backwardness of dynamic monitoring and analysis technology will introduce risks to the development of CBM. | Lyu et al. [34] | ||
| Drainage system (r38) | Unreasonable drainage systems often cause reservoir stress sensitivity damage. An unreasonable drainage system may significantly harm reservoir permeability. Too much damage may make it difficult or impossible to return the reservoir to the original state and may result in the CBM well not producing gas at all. Therefore, an unreasonable CBM drainage system may introduce risks to CBM development. | Zhang et al. [13] | ||
| Economic operation (r4) | Such risks refer to economic risks caused by macroeconomic weakness, price fluctuations, and capital supply in actual economic activities. These factors are potential uncertainties in the economic base, economic situation, and the ability to solve economic problems in CBM development projects. | CBM price fluctuation (r41) | The price of CBM is a very sensitive factor that is greatly affected by the national energy development and resource policy adjustment and directly affects the economic benefits of CBM development. Therefore, fluctuations in the price of CBM will adversely affect the development of the CBM industry. | Luo et al. [15] |
| Project cost (r42) | High cost and low profit are the status quo of CBM development, which shows that if the project operator does not have a certain capital base, it will not be able to withstand the risks of CBM development. The level of mining costs also determines the level of profit. In recent years, although China’s CBM demand and prices have been rising, due to the increase in staff salaries and environmental compensation fees, the project mining costs have also increased, which has led to a growth rate of CBM development profit that is far less than the increase in CBM prices. Therefore, the project mining cost has become another important factor restricting the development of the CBM industry. | Luo et al. [15] | ||
| Return on investment (r43) | For CBM development enterprises, operating profit is the driving force for survival and development. If this driving force is lost, the solvency of the company will decline. Enterprises will fall into the predicament of production and development. Therefore, a low return on investment may introduce risks to CBM development. | Xia et al. [35] | ||
| CBM production (r44) | CBM production stability directly affects the daily operation of the project, which means that if the project’s CBM production is unstable or insufficient, it will bring high economic risks to the company. | Su et al. [19] | ||
| Macroeconomics (r45) | CBM development is closely related to the growth of the national economy. When the national economy develops slowly and even stagnates, the demand and price of CBM will fall. In addition, the risks brought about by the macroeconomic downturn to CBM development are reflected in interest rates, money supply and inflation. Therefore, the macroeconomic downturn may introduce risks to CBM development. | Senthi et al. [11] | ||
| Funds recovery (r46) | Some CBM development companies do not know enough about the credit rating of customers in the credit sales process and blindly sell to them, which will result in a large number of receivables that cannot be recovered for a long time until they become bad debts. On the other hand, in China’s CBM development of current assets, the proportion of inventory is relatively large, and many enterprises are characterized by overstocking and inventory. Assets are occupied by debtors and stocks for a long time, making CBM development lack sufficient liquidity to reinvest or return debts due. The above situations will seriously affect the liquidity and safety of CBM development assets. | Xia et al. [35] | ||
| External market resources (r47) | A typical feature of external market resources is market power, which refers to the influence and control of the market by economic entities. Market power refers to companies’ ability to charge market prices to seek benefits and gain influence in the market and dominate stakeholder behavior. Market resources are expressed in various aspects, such as corporate image, goodwill and reputation. If the external market resources of the enterprise are poor, there may be risks to the development of CBM. | Zhang et al. [13] | ||
| External network resources (r48) | External network resources mainly refer to the social relationships between enterprises and stakeholders. Many aspects of the CBM development process, such as access to funds, raw materials, production, sales promotion, and access to relevant policies, entail external relations. Relevant literature surveys have found that good external network resources can promote the development of a project. Conversely, the lack of such resources can introduce risks to CBM development. | Zhang et al. [13] | ||
| Market demand (r49) | The market demand for clean energy is crucial to the development of the CBM industry. If the demand for clean energy is strong, it will be beneficial to the economic development of CBM development enterprises. If not, it will introduce risks to CBM development, due to the imbalance between supply and demand. | Chen et al. [12] | ||
| Organizational management (r5) | Organizational management not only provides the mechanism and framework for the development and operation of CBM, but also arranges personnel and resources for project operation. Organizational disruption and management failure are the least noticeable potential risks in the project’s operations. It is also the root cause of the failure of the project management operational system. | Organizational structure adaptability (r51) | The organizational structure of the project determines not only how the strategic objectives and policies are established, but also the resource allocation efficiency of the project. The unreasonable organizational structure will increase the internal coordination cost of the enterprise, affect the efficiency and effectiveness of organizational decision-making, and reduce the efficiency of resource allocation. Therefore, an unreasonable organizational structure may introduce risks to the development of CBM. | Zhang et al. [13] |
| Management coordination and communication (r52) | Due to the special nature of the workplace, the working surface needs to be constantly changing. Good coordination and communication within the organization not only ensure the smooth and efficient operation of the CBM development process, but also improve labor productivity and safe production management efficiency. Good coordination and communication skills can also maximize the overall efficiency of the project through effective systems, appropriate business complementarities, and good interpersonal relationships, thereby improving overall competitiveness. Conversely, if the company’s management coordination and communication skills are insufficient, it may introduce risks to CBM development. | Zhang et al. [13] | ||
| Process management (r53) | In the process of production and operation, the CBM development project involves many departments, and the production process is very complicated. The project’s process management involves coordination between departments, reduction of operating costs and a guarantee of safe production. Therefore, inadequate process management may pose risks to CBM development. | Zhang et al. [13] | ||
| Organizational management fineness (r54) | The main embodiment of the refined management of the CBM development process is the refined production method. It determines how to improve technology, eliminate waste, increase recovery rates, and efficiently use limited resources. Refined production methods are also an effective way to increase resources. Therefore, the lack of refined management of the CBM development process will introduce risks to CBM development. | Zhang et al. [13] | ||
| Resource allocation capability (r55) | Resource allocation capability refers to maximizing the role of the resources a company owns and promoting the achievement of development goals. For CBM development projects, internal resources, such as CBM resources, financial resources and human resources, as well as external resources closely related to CBM development, play a key role in industrial development. How to use these resources reasonably and to their full potential without causing waste is an important issue that must be dealt with in the development of CBM. Therefore, an inefficient resource allocation capacity may introduce risks to CBM development. | Zhang et al. [13] | ||
| Safety and emergency protection (r6) | Safety and emergency protection risks affect the entire process of CBM development. The CBM development process involves a wide range of content, many links, complicated operating procedures, and a large safety supervision span. Any problem with any link can introduce risks to a CBM development project. | Safety technology and equipment (r61) | In the process of CBM development, relevant technologies and equipment are required for effective safety protection. Compared with that in other countries, there is still a gap in the safety technology of CBM development in China, and the research and development of safety equipment are still far behind. Therefore, CBM development safety accidents have occasionally occurred in China. Therefore, the backwardness of safety technology and equipment will introduce risks to CBM development. | Kirchgessne et al. [18] |
| Hidden danger investigation and treatment (r62) | CBM is a flammable and explosive gas. In the operation of CBM projects, enterprises should attach great importance to the investigation of accident safety hazards. If hidden dangers are found in the inspection, they should be quickly rectified to avoid fire or explosion accidents. Therefore, if the company does not establish an effective long-term mechanism for potential hazard investigation and treatment, it will increase the risk of safe production of CBM development. | PRC [40] | ||
| Safety training and education (r63) | Accidents are often caused by the unsafe behavior of people and the unsafe state of things. To reduce human error in the development of CBM and enhance employees’ safety awareness, enterprises should organize training and education on a regular basis. Otherwise, safety production accidents caused by human error will cause casualties and halt production. | PRC [40] | ||
| Safety culture (r64) | The construction of corporate safety culture is an effective guarantee for the safe production of the project. The system is rigid, and consciousness and culture are flexible. Only by orienting both aspects of safety can employees effectively prevent the occurrence of security incidents, due to their understanding and habits. Therefore, the lack of a corporate safety culture may introduce risks to CBM development. | Henriqson et al. [36] | ||
| Safety investment (r65) | Safety investment affects the advancement of safety technology and equipment and the preparation of emergency supplies. Enterprises should maximize their safety investment funds, purchase advanced safety equipment and sufficient emergency materials, and regularly organize experts to train employees. If the company’s safety investment is too small, it will indirectly affect other safety factors, thus, introducing risks to CBM development. | Zhao et al. [37] | ||
| Emergency plan (r66) | China’s Safe Production Law stipulates that the CBM production industry should formulate special emergency plans for all kinds of accidents and all hazards that may occur and have clear rescue procedures and specific emergency rescue measures. If the company does not formulate an emergency plan, accidents can easily spread, resulting in more serious casualties and property losses. | PRC [40] | ||
| Emergency drill frequency (r67) | Conducting emergency drills can leave a deeper impression on participants by simulating the emergency response process of CBM development accidents. Let employees truly understand accidents intuitively and emotionally and improve their vigilance against accident risk sources. Emergency drills not only enhance employees’ emergency awareness and accident handling skills, but also improve their self-help and mutual rescue capabilities. Therefore, insufficient frequency of emergency drills will introduce risks to CBM development. | PRC [41] | ||
| Emergency supplies reserve (r68) | In the event of a safety production accident, if emergency supplies cannot be provided in a timely and comprehensive manner, it is difficult to achieve accident rescue. Therefore, insufficient emergency material reserves will introduce risks to CBM development. | PRC [41] | ||
| Emergency rescue team(r69) | China’s Hazardous Chemicals Safety Management Regulations clearly state that the CBM development industry should establish an emergency rescue team consisting of full-time or part-time personnel. In addition, emergency rescue teams must organize emergency rescue operations in the event of an accident and assist in the investigation of risk hidden dangers during normal project operation. Therefore, if the companies do not establish emergency rescue teams, they will introduce risks to CBM development. | PRC [41] |
Appendix B
| Index r 11 | Index r 12 | Index r 13 | Index r 14 | Index r 15 | Index r 16 | |
|---|---|---|---|---|---|---|
| Group A | 1 | 2 | 6 | 3 | 5 | 4 |
| Group B | 2 | 1 | 5 | 4 | 3 | 6 |
| Group C | 2 | 1 | 5 | 3 | 4 | 4 |
| Group D | 2 | 1 | 4 | 3 | 6 | 5 |
| bj | 0.941 | 0.980 | 0.549 | 0.798 | 0.615 | 0.586 |
| bjmax | 1.000 | 1.000 | 0.712 | 0.827 | 0.827 | 0.712 |
| bjmax- bj | 0.059 | 0.020 | 0.163 | 0.029 | 0.212 | 0.126 |
| bjmin | 0.921 | 0.921 | 0.356 | 0.712 | 0.356 | 0.356 |
| bj- bjmin | 0.020 | 0.059 | 0.193 | 0.086 | 0.259 | 0.230 |
| σj | 0.040 | 0.040 | 0.178 | 0.058 | 0.236 | 0.178 |
| 1-σj | 0.961 | 0.961 | 0.822 | 0.943 | 0.765 | 0.822 |
| Xj | 0.904 | 0.941 | 0.451 | 0.752 | 0.470 | 0.482 |
| Weight | 0.226 | 0.235 | 0.113 | 0.188 | 0.118 | 0.120 |
| Index r 21 | Index r 22 | Index r 23 | Index r 24 | Index r 25 | Index r 26 | Index r 27 | Index r 28 | |
|---|---|---|---|---|---|---|---|---|
| Group A | 2 | 1 | 3 | 4 | 5 | 7 | 7 | 6 |
| Group B | 3 | 1 | 2 | 5 | 8 | 6 | ||
| Group C | 3 | 2 | 1 | 6 | 4 | 8 | 7 | 5 |
| Group D | 1 | 2 | 3 | 4 | 6 | 7 | 8 | 5 |
| bj | 0.929 | 0.973 | 0.929 | 0.749 | 0.749 | 0.454 | 0.408 | 0.682 |
| bjmax | 1.000 | 1.000 | 1.000 | 0.815 | 0.815 | 0.500 | 0.500 | 0.732 |
| bjmax- bj | 0.071 | 0.027 | 0.071 | 0.067 | 0.067 | 0.046 | 0.092 | 0.051 |
| bjmin | 0.886 | 0.946 | 0.886 | 0.631 | 0.631 | 0.315 | 0.315 | 0.631 |
| bj- bjmin | 0.044 | 0.027 | 0.044 | 0.118 | 0.118 | 0.138 | 0.092 | 0.051 |
| σj | 0.057 | 0.027 | 0.057 | 0.092 | 0.092 | 0.092 | 0.092 | 0.051 |
| 1-σj | 0.943 | 0.973 | 0.943 | 0.908 | 0.908 | 0.908 | 0.908 | 0.949 |
| Xj | 0.876 | 0.947 | 0.876 | 0.680 | 0.680 | 0.412 | 0.370 | 0.647 |
| Weight | 0.160 | 0.173 | 0.160 | 0.124 | 0.124 | 0.075 | 0.067 | 0.118 |
| Index r 31 | Index r32 | Index r 33 | Index r 34 | Index r 35 | Index r 36 | Index r 37 | Index r 38 | |
|---|---|---|---|---|---|---|---|---|
| Group A | 1 | 2 | 4 | 5 | 3 | 7 | 6 | 4 |
| Group B | 1 | 3 | 2 | 6 | 4 | 8 | 7 | 5 |
| Group C | 2 | 1 | 3 | 4 | 7 | 6 | 5 | 3 |
| Group D | 1 | 2 | 5 | 4 | 3 | 7 | 6 | 3 |
| bj | 0.987 | 0.945 | 0.845 | 0.749 | 0.772 | 0.487 | 0.624 | 0.830 |
| bjmax | 1.000 | 1.000 | 0.946 | 0.815 | 0.886 | 0.631 | 0.732 | 0.886 |
| bjmax- bj | 0.013 | 0.055 | 0.101 | 0.067 | 0.114 | 0.144 | 0.109 | 0.056 |
| bjmin | 0.946 | 0.886 | 0.732 | 0.631 | 0.500 | 0.315 | 0.500 | 0.732 |
| bj- bjmin | 0.040 | 0.059 | 0.113 | 0.118 | 0.272 | 0.171 | 0.124 | 0.097 |
| σj | 0.027 | 0.057 | 0.107 | 0.092 | 0.193 | 0.158 | 0.116 | 0.077 |
| 1-σj | 0.972 | 0.943 | 0.893 | 0.908 | 0.807 | 0.842 | 0.884 | 0.923 |
| Xj | 0.960 | 0.891 | 0.755 | 0.680 | 0.623 | 0.410 | 0.551 | 0.766 |
| Weight | 0.170 | 0.158 | 0.134 | 0.121 | 0.111 | 0.073 | 0.098 | 0.136 |
| Index r 41 | Index r42 | Index r 43 | Index r 44 | Index r 45 | Index r 46 | Index r 47 | Index r 48 | Index r 49 | |
|---|---|---|---|---|---|---|---|---|---|
| Group A | 8 | 2 | 4 | 3 | 7 | 5 | 6 | 9 | 1 |
| Group B | 6 | 1 | 2 | 3 | 8 | 7 | 4 | 5 | 1 |
| Group C | 5 | 1 | 3 | 2 | 4 | 6 | 7 | 8 | 2 |
| Group D | 7 | 3 | 4 | 2 | 6 | 5 | 8 | 9 | 1 |
| bj | 0.639 | 0.964 | 0.887 | 0.929 | 0.656 | 0.714 | 0.656 | 0.464 | 0.989 |
| bjmax | 0.778 | 1.000 | 0.954 | 0.954 | 0.845 | 0.778 | 0.845 | 0.778 | 1.000 |
| bjmax- bj | 0.139 | 0.036 | 0.067 | 0.0256 | 0.189 | 0.064 | 0.189 | 0.314 | 0.011 |
| bjmin | 0.477 | 0.903 | 0.845 | 0.903 | 0.477 | 0.602 | 0.477 | 0.301 | 0.954 |
| bj- bjmin | 0.162 | 0.061 | 0.042 | 0.026 | 0.179 | 0.112 | 0.179 | 0.163 | 0.034 |
| σj | 0.151 | 0.048 | 0.055 | 0.026 | 0.184 | 0.088 | 0.184 | 0.239 | 0.023 |
| 1-σj | 0.850 | 0.952 | 0.945 | 0.974 | 0.816 | 0.912 | 0.816 | 0.761 | 0.978 |
| Xj | 0.543 | 0.918 | 0.838 | 0.905 | 0.535 | 0.651 | 0.535 | 0.354 | 0.966 |
| Weight | 0.087 | 0.147 | 0.134 | 0.145 | 0.086 | 0.104 | 0.086 | 0.057 | 0.155 |
| Index r 51 | Index r 52 | Index r 53 | Index r 54 | Index r 55 | |
|---|---|---|---|---|---|
| Group A | 1 | 3 | 4 | 5 | 2 |
| Group B | 1 | 2 | 3 | 4 | 2 |
| Group C | 2 | 4 | 1 | 5 | 3 |
| Group D | 1 | 4 | 2 | 5 | 3 |
| bj | 0.975 | 0.725 | 0.821 | 0.443 | 0.836 |
| bjmax | 1.000 | 0.898 | 0.898 | 0.613 | 0.898 |
| bjmax- bj | 0.025 | 0.174 | 0.077 | 0.170 | 0.062 |
| bjmin | 0.898 | 0.613 | 0.613 | 0.387 | 0.774 |
| bj- bjmin | 0.076 | 0.111 | 0.208 | 0.057 | 0.062 |
| σj | 0.051 | 0.143 | 0.143 | 0.113 | 0.062 |
| 1-σj | 0.949 | 0.857 | 0.857 | 0.887 | 0.938 |
| Xj | 0.925 | 0.621 | 0.704 | 0.393 | 0.784 |
| Weight | 0.270 | 0.181 | 0.205 | 0.115 | 0.229 |
| Index r 61 | Index r62 | Index r 63 | Index r 64 | Index r 65 | Index r 66 | Index r 67 | Index r 68 | Index r 69 | |
|---|---|---|---|---|---|---|---|---|---|
| Group A | 1 | 2 | 4 | 8 | 3 | 5 | 6 | 7 | 7 |
| Group B | 2 | 3 | 4 | 8 | 1 | 5 | 5 | 7 | 6 |
| Group C | 1 | 4 | 2 | 9 | 3 | 7 | 8 | 6 | 5 |
| Group D | 1 | 3 | 2 | 8 | 1 | 7 | 6 | 5 | 4 |
| bj | 0.989 | 0.901 | 0.900 | 0.433 | 0.952 | 0.690 | 0.663 | 0.670 | 0.731 |
| bjmax | 1.000 | 0.954 | 0.954 | 0.477 | 1.000 | 0.778 | 0.778 | 0.778 | 0.845 |
| bjmax- bj | 0.011 | 0.053 | 0.055 | 0.044 | 0.048 | 0.088 | 0.115 | 0.108 | 0.114 |
| bjmin | 0.954 | 0.845 | 0.845 | 0.301 | 0.903 | 0.602 | 0.477 | 0.602 | 0.602 |
| bj- bjmin | 0.034 | 0.056 | 0.055 | 0.132 | 0.048 | 0.088 | 0.186 | 0.068 | 0.129 |
| σj | 0.023 | 0.055 | 0.055 | 0.088 | 0.048 | 0.088 | 0.151 | 0.088 | 0.122 |
| 1-σj | 0.977 | 0.945 | 0.945 | 0.912 | 0.952 | 0.912 | 0.850 | 0.912 | 0.878 |
| Xj | 0.966 | 0.852 | 0.851 | 0.395 | 0.905 | 0.629 | 0.563 | 0.611 | 0.642 |
| Weight | 0.151 | 0.133 | 0.133 | 0.062 | 0.141 | 0.098 | 0.088 | 0.0953 | 0.100 |
Appendix C
References
- Zhou, C.; Huang, G.; Chen, J. A multi-objective energy and environmental systems planning model: management of uncertainties and risks for Shanxi province, China. Energies 2018, 11, 2723. [Google Scholar] [CrossRef]
- Cheng, L.; Ge, Z.; Chen, J.; Ding, H.; Zou, L.; Li, K. A Sequential approach for integrated coal and gas mining of closely-spaced outburst coal seams: Results from a case study including mine safety improvements and greenhouse gas reductions. Energies 2018, 11, 3023. [Google Scholar] [CrossRef]
- Wang, J.F.; Li, W.J. China’s Coal Mine Accidents and Comments of Safety Specialists; China Coal Industry Publishing House: Beijing, China, 2002; pp. 1–8. [Google Scholar]
- Zhang, J.J.; Xu, K.L.; You, G.; Wang, B.B.; Zhao, L. Causation analysis of risk coupling of gas explosion accident in Chinese underground coal mines. Risk Anal. 2019, 4, 1–13. [Google Scholar] [CrossRef] [PubMed]
- Zhang, J.J.; David, C.; Xu, K.L.; You, G. Focusing on the patterns and characteristics of extraordinarily severe gas explosion accidents in Chinese coal mines. Process Saf. Environ. Prot. 2018, 117, 390–398. [Google Scholar] [CrossRef]
- Knez, D.; Wiśniowski, R.; Owusu, W.A. Turning filling material into proppant for coalbed methane in Poland—Crush test results. Energies 2019, 12, 1820. [Google Scholar] [CrossRef]
- Li, G.F.; Li, G.H.; Liu, G. Analysis on the ground extraction effect of coal-bed methane at typical area in Jincheng, China. J. China Coal Soc. 2014, 39, 1932–1937. [Google Scholar]
- Karacan, C.O.; Ruiz, F.A.; Cote, M.; Phipps, S. Coal mine methane: A review of capture and utilization practices with benefits to mining safety and to greenhouse gas reduction. Int. J. Coal Geol. 2011, 86, 121–156. [Google Scholar] [CrossRef]
- Liao, Y.Y.; Luo, D.K.; Li, W.D. Development strategy analysis of China’s CBM. Acta Pet. Sin. 2012, 33, 1098–1102. [Google Scholar]
- Roadifer, R.D. Coalbed methane parametric study: What’s really important to production and when? In Proceedings of the SPE Annual Technical Conference and Exhibition, Denver, CO, USA, 5–8 October 2003. [Google Scholar] [CrossRef]
- Senthil, B. Economic Feasibility of Coalbed Methane Projects Using Monte-Carlo and Hypercube Simulation. Ph.D. Thesis, Mississippi State University, Starkville, MS, USA, 1994. [Google Scholar]
- Chen, Y.H.; Yang, Y.G.; Luo, J.H. Uncertainty Analysis of Coalbed Methane Economic Assessment with Montecarlo Method. Procedia Environ. Sci. 2012, 12, 640–645. [Google Scholar] [CrossRef]
- Zhang, Y.C.; Yang, Y.G.; Luo, J.H. Study on risk assessment of CBM development based on optimized combination weighting. J. Saf. Sci. Technol. 2016, 12, 91–97. [Google Scholar]
- Acquah-Andoh, E.; Putra, H.A.; Ifelebuegu, A.O.; Owusu, A. Coalbed methane development in Indonesia: Design and economic analysis of upstream petroleum fiscal policy. Energy Policy 2019, 131, 155–167. [Google Scholar] [CrossRef]
- Luo, D.K.; Dai, Y.J. Economic evaluation of coalbed methane production in China. Energy Policy 2009, 37, 3883–3889. [Google Scholar] [CrossRef]
- Mares, T.E.; Moore, T.A.; Moore, C.R. Uncertainty of gas saturation estimates in a subbituminous coal seam. Int. J. Coal Geol. 2009, 77, 320–327. [Google Scholar] [CrossRef]
- Mu, F.Y.; Wang, H.Y.; Wu, J.T.; Sun, B. Practice of and suggestions on CBM development in China. Nat. Gas Ind. 2018, 38, 61–66. [Google Scholar]
- Kirchgessne, D.A.; Masemore, S.S.; Piccot, S.D. Engineering and economic evaluation of gas recovery and utilization technologies at selected US mines. Environ. Sci. Policy 2002, 5, 397–409. [Google Scholar] [CrossRef]
- Su, J.; Zhang, J.; Zhu, W. Improved methodology of economic evaluation of coalbed methane based on discounted cash flow analysis. J. China Univ. Min. Technol. 2018, 47, 176–183. [Google Scholar]
- Lau, C.K.; Lai, K.K.; Lee, Y.P.; Du, J.Z. Fire risk assessment with scoring system, using the support vector machine approach. Fire Saf. J. 2015, 78, 188–195. [Google Scholar] [CrossRef]
- Cheng, Q.Y. Structure entropy weight method to confirm the weight of evaluating index. Syst. Eng. Theory Pract. 2010, 30, 1225–1228. [Google Scholar]
- Cai, W. Introduction of Extenics. Syst. Eng. Theory Pract. 1998, 1, 76–84. [Google Scholar]
- Jin, Y.Q.; Hu, M.; Wu, Q.; Fang, C.X. Quantitative risk assessment model for high pressure oil and gas well control based on the matter-element extension. J. Saf. Environ. 2014, 14, 147–150. [Google Scholar]
- Wang, J.M.; Jia, M.T.; Wang, J.; Chen, J.H.; Long, K.M. Risk evaluation of break-dam in tailings reservoir based on matter-element extension model. J. Saf. Sci. Technol. 2014, 4, 96–102. [Google Scholar]
- Xie, Z.X.; Li, Y.Y.; Wu, X.R.; Wang, F.; Wang, W. Evaluation of the archive fire risk based on the matter-element and multi-level extension model. J. Saf. Environ. 2019, 19, 27–34. [Google Scholar]
- Iribarren, D.; Martíngamboa, M.; O’Mahony, T.; Dufour, J. Screening of socio-economic indicators for sustainability assessment: A combined life cycle assessment and data envelopment analysis approach. Int. J. Life Cycle Assess. 2016, 21, 202–214. [Google Scholar] [CrossRef]
- Elhami, B.; Raini, M.G.N.; Soheili-Fard, F. Energy and environmental indices through life cycle assessment of raisin production: A case study (Kohgiluyeh and Boyer-Ahmad Province, Iran). Renew. Energy 2019, 141, 507–515. [Google Scholar] [CrossRef]
- Alvarez-Rodriguez, C.; Martin-Gamboa, M.; Iribarren, D. Sustainability-oriented management of retail stores through the combination of life cycle assessment and dynamic data envelopment analysis. Sci. Total Environ. 2019, 68, 49–60. [Google Scholar] [CrossRef]
- Zhang, Y.S.; Niu, C.H. Research on risk factors and strategies of China’s CBM industry development under the background of energy revolution. Sci. Manag. Res. 2019, 37, 68–73. [Google Scholar]
- Ge, X.; Liu, D.; Cai, Y.; Wang, Y. Gas content evaluation of coalbed methane reservoir in the Fukang area of Southern Junggar Basin, northwest China by multiple geophysical logging methods. Energies 2018, 11, 1867. [Google Scholar] [CrossRef]
- Lei, C.L.; Liu, X. Assessment of economic benefit for coalbed methane development project from geological hazard risk. Coal Geol. Explor. 2016, 44, 75–79. [Google Scholar]
- Zhai, G.M.; He, W.Y. Occurrence features and exploration orientation of coalbed methane gas in China. Nat. Gas Ind. 2010, 30, 1–3. [Google Scholar]
- Jie, M.X.; Ge, X.D.; Peng, C.Y.; Xiong, X.Y.; Xia, F. Advances in the CBM exploration and development techniques and their developing trend in China. Nat. Gas Ind. 2011, 31, 63–65. [Google Scholar]
- Lyu, Y.M.; Tang, D.Z.; Li, Z.P.; Shao, X.J.; Xu, H. Fitting and predicting models for coalbed methane wells dynamic productivity. J. China Coal Soc. 2011, 36, 1481–1485. [Google Scholar]
- Xia, L.Y.; Luo, D.K.; Dai, Y.J. Risk evaluation methods of CBM development projects. Nat. Gas Ind. 2012, 32, 117–120. [Google Scholar]
- Henriqson, E.; Schuler, B.; Van Winsen, R.; Dekker, S.W.A. The constitution and effects of safety culture as an object in the discourse of accident prevention: A Foucauldian approach. Saf. Sci. 2014, 70, 465–476. [Google Scholar] [CrossRef]
- Zhao, B.F.; Zhang, C.; Jia, B.S.; Zhai, C.X.; Ren, H.Z.; Guo, J.W. DMIP-MCDM based method of evaluating safety input for coal enterprises. China Saf. Sci. J. 2017, 27, 127–131. [Google Scholar]
- People’s Republic of China Mineral Resources Law; PRC Standing Committee of the National People’s Congress: Beijing, China, 1986.
- Coalbed Methane Industry Policy; PRC National Energy Board: Beijing, China, 2013.
- Safety Production Law of the People’s Republic of China; PRC Standing Committee of the National People’s Congress: Beijing, China, 2002.
- Hazardous Chemicals Safety Management Regulations; PRC State Council: Beijing, China, 2002.
- Dalkey, N.C. The Delphi method: An experimental study of group opinion. Futures 1969, 1, 408–426. [Google Scholar] [CrossRef]
- Liu, F.; Zhao, S.Z.; Weng, M.C.; Liu, Y.Q. Fire risk assessment for large-scale commercial buildings based on structure entropy weight method. Saf. Sci. 2017, 94, 26–40. [Google Scholar] [CrossRef]
- Cai, W. Extension theory and its application. Chin. Sci. Bull. 1999, 7, 673–682. [Google Scholar] [CrossRef]
- Cai, W.; Yang, C.Y. Basic theory and methodology on Extenics. Chin. Sci. Bull. 2013, 58, 1190–1199. [Google Scholar]
- Guan, X.J. Evaluation method on risk grade of tunnel collapse based on extension connection cloud model. J. Saf. Sci. Technol. 2018, 14, 186–192. [Google Scholar]
- Wang, Y.; Liu, D.; Cai, Y.; Li, X. Variation of petrophysical properties and adsorption capacity in different rank coals: An experimental study of coals from the Junggar, Ordos and Qinshui Basins in China. Energies 2019, 12, 986. [Google Scholar] [CrossRef]
- Qin, Y.; Liang, J.S.; Shen, J.; Liu, Y.H.; Wang, C.W. Gas logging shows and gas reservoir types in tight sandstones and shales from Southern Qinshui Basin. J. China Coal Soc. 2014, 39, 1559–1565. [Google Scholar]
- Zhang, Z.; Qin, Y.; Fu, X.H. The favorable developing geological conditions for CBM multi-layer drainage in southern Qinshui basin. J. China Univ. Min. Technol. 2014, 43, 1019–1024. [Google Scholar]
- Li, Q.; He, J.J.; Cao, J. Physical characteristics of coalbed methane reservoir in Heshun Area of Qinshui Basin. Oil Geophys. Prospect. 2013, 48, 734–739. [Google Scholar]


| Index1 | Index2 | Index3 | Index4 | Index5 | … | |
|---|---|---|---|---|---|---|
| Expert1 | ||||||
| Expert2 | ||||||
| Expert3 | ||||||
| Expert4 | ||||||
| … |
| Index r 1 | Index r 2 | Index r 3 | Index r 4 | Index r 5 | Index r 6 | |
|---|---|---|---|---|---|---|
| Group A | 4 | 1 | 2 | 3 | 6 | 5 |
| Group B | 3 | 1 | 1 | 2 | 5 | 4 |
| Group C | 3 | 1 | 2 | 3 | 5 | 4 |
| Group D | 4 | 2 | 1 | 3 | 6 | 5 |
| Index r1 | Index r2 | Index r3 | Index r4 | Index r5 | Index r6 | |
|---|---|---|---|---|---|---|
| Group A | 4 | 1 | 2 | 3 | 6 | 5 |
| Group B | 3 | 1 | 1 | 2 | 5 | 4 |
| Group C | 3 | 1 | 2 | 3 | 5 | 4 |
| Group D | 4 | 2 | 1 | 3 | 6 | 5 |
| Average cognition degree bj | 0.770 | 0.980 | 0.960 | 0.851 | 0.460 | 0.638 |
| bjmax | 0.827 | 1.000 | 1.000 | 0.921 | 0.565 | 0.712 |
| bjmax- bj | 0.057 | 0.020 | 0.040 | 0.070 | 0.104 | 0.074 |
| bjmin | 0.712 | 0.921 | 0.921 | 0.827 | 0.356 | 0.565 |
| bj- bjmin | 0.057 | 0.059 | 0.040 | 0.023 | 0.104 | 0.074 |
| σj | 0.057 | 0.040 | 0.040 | 0.047 | 0.104 | 0.074 |
| 1-σj | 0.943 | 0.960 | 0.960 | 0.953 | 0.896 | 0.926 |
| Xj | 0.726 | 0.941 | 0.922 | 0.811 | 0.412 | 0.591 |
| Weight | 0.165 | 0.214 | 0.209 | 0.184 | 0.094 | 0.134 |
| First Grade Indexes (ri) | Weight (ωi) | Second Grade Indexes (rik) | Weight (ωik) | Total Score | Actual Score (vik) |
|---|---|---|---|---|---|
| Laws, regulations and policies (r1) | 0.165 | Mineral rights and gas rights conflict (r11) | 0.226 | 100 | 91 |
| Major licenses and approvals (r12) | 0.235 | 100 | 88 | ||
| Foreign cooperation franchise (r13) | 0.113 | 100 | 48 | ||
| Government financial subsidies (r14) | 0.188 | 100 | 83 | ||
| Resource tax reform (r15) | 0.118 | 100 | 86 | ||
| New energy policy (r16) | 0.120 | 100 | 84 | ||
| Resource characteristics (r2) | 0.214 | Gas content (r21) | 0.160 | 100 | 79 |
| Permeability (r22) | 0.173 | 100 | 82 | ||
| Reservoir pressure (r23) | 0.160 | 100 | 89 | ||
| Porosity (r24) | 0.124 | 100 | 76 | ||
| Hydrogeological conditions (r25) | 0.124 | 100 | 86 | ||
| Coal seam area (r26) | 0.075 | 100 | 74 | ||
| Coal seam thickness (r27) | 0.067 | 100 | 81 | ||
| Buried depth (r28) | 0.118 | 100 | 87 | ||
| Engineering technology (r3) | 0.209 | Geological evaluation technique (r31) | 0.170 | 100 | 86 |
| Extraction technology (r32) | 0.158 | 100 | 74 | ||
| Development process technology (r33) | 0.134 | 100 | 77 | ||
| Gas gathering technology (r34) | 0.121 | 100 | 82 | ||
| Treatment technology (r35) | 0.111 | 100 | 81 | ||
| Transportation technology (r36) | 0.073 | 100 | 68 | ||
| Dynamic monitoring and analysis (r37) | 0.098 | 100 | 78 | ||
| Drainage system (r38) | 0.136 | 100 | 75 | ||
| Economic operation (r4) | 0.184 | CBM price fluctuation (r41) | 0.087 | 100 | 83 |
| Project cost (r42) | 0.147 | 100 | 78 | ||
| Return on investment (r43) | 0.134 | 100 | 76 | ||
| CBM production (r44) | 0.145 | 100 | 72 | ||
| Macroeconomics (r45) | 0.086 | 100 | 84 | ||
| Funds recovery (r46) | 0.104 | 100 | 86 | ||
| External market resources (r47) | 0.086 | 100 | 56 | ||
| External network resources (r48) | 0.057 | 100 | 82 | ||
| Market demand (r49) | 0.155 | 100 | 78 | ||
| Organizational management (r5) | 0.094 | Organizational structure adaptability (r51) | 0.270 | 100 | 85 |
| Management coordination and communication (r52) | 0.181 | 100 | 79 | ||
| Process management (r53) | 0.205 | 100 | 73 | ||
| Organizational management quality (r54) | 0.115 | 100 | 82 | ||
| Resource allocation capability (r55) | 0.229 | 100 | 74 | ||
| Safety and emergency protection (r6) | 0.134 | Safety technology and equipment (r61) | 0.151 | 100 | 75 |
| Hidden danger investigation and treatment (r62) | 0.133 | 100 | 78 | ||
| Safety training and education (r63) | 0.133 | 100 | 56 | ||
| Safety culture (r64) | 0.062 | 100 | 72 | ||
| Safety investment (r65) | 0.141 | 100 | 82 | ||
| Emergency plan (r66) | 0.098 | 100 | 74 | ||
| Emergency drill frequency (r67) | 0.088 | 100 | 54 | ||
| Emergency supplies reserve (r68) | 0.095 | 100 | 63 | ||
| Emergency rescue team (r69) | 0.100 | 100 | 76 |
| Risk Level | Score Range | Basic Characteristics |
|---|---|---|
| Ⅰ | (85, 100] | System operation condition is very good, risk is very low |
| Ⅱ | (70, 85] | System operation condition is good, risk is lower |
| Ⅲ | (50, 70] | System operation condition is mediocre, risk is mediocre |
| Ⅳ | (25, 50] | System operation condition is poor, risk is higher |
| Ⅴ | [0, 25] | System operation condition is very poor, risk is very high |
| First Grade Indexes | Second Grade Indexes | Relevance of Second Grade Indexes | Risk Level | ||||
|---|---|---|---|---|---|---|---|
| Ⅰ | Ⅱ | Ⅲ | Ⅳ | Ⅴ | |||
| Laws, regulations and policies (r1) | Mineral rights and gas rights conflict (r11) | 2.000 | −0.400 | −0.700 | −0.820 | −0.880 | Ⅰ |
| Major licenses and approvals (r12) | 0.333 | −0.200 | −0.600 | −0.760 | −0.840 | Ⅰ | |
| Foreign cooperation franchise (r13) | −0.435 | −0.314 | −0.040 | 0.043 | −0.324 | Ⅳ | |
| Government financial subsidies (r14) | −0.105 | 0.133 | −0.433 | −0.660 | −0.773 | Ⅱ | |
| Resource tax reform (r15) | 0.077 | −0.067 | −0.533 | −0.720 | −0.813 | Ⅰ | |
| New energy policy (r16) | −0.059 | 0.067 | −0.467 | −0.680 | −0.787 | Ⅱ | |
| Resource characteristics (r2) | Gas content (r21) | −0.222 | 0.400 | −0.300 | −0.580 | −0.720 | Ⅱ |
| Permeability (r22) | −0.143 | 0.200 | −0.400 | −0.640 | −0.760 | Ⅱ | |
| Reservoir pressure (r23) | 0.571 | −0.267 | −0.633 | −0.780 | −0.853 | Ⅰ | |
| Porosity (r24) | −0.273 | 0.333 | −0.200 | −0.520 | −0.680 | Ⅱ | |
| Hydrogeological conditions (r25) | 0.077 | −0.067 | −0.533 | −0.720 | −0.813 | Ⅰ | |
| Coal seam area (r26) | −0.297 | 0.182 | −0.133 | −0.480 | −0.653 | Ⅱ | |
| Coal seam thickness (r27) | −0.174 | 0.267 | −0.367 | −0.620 | −0.747 | Ⅱ | |
| Buried depth (r28) | 0.182 | −0.133 | −0.567 | −0.74 | −0.826 | Ⅰ | |
| Engineering technology (r3) | Geological evaluation technique (r31) | 0.770 | −0.067 | −0.533 | −0.720 | −0.813 | Ⅰ |
| Extraction technology (r32) | −0.297 | 0.182 | −0.133 | −0.480 | −0.653 | Ⅱ | |
| Development process technology (r33) | −0.258 | 0.438 | −0.233 | −0.540 | −0.693 | Ⅱ | |
| Gas gathering technology (r34) | −0.143 | 0.200 | −0.400 | −0.640 | −0.760 | Ⅱ | |
| Treatment technology (r35) | −0.174 | 0.267 | −0.367 | −0.620 | −0.747 | Ⅱ | |
| Transportation technology (r36) | −0.347 | −0.059 | 0.067 | −0.360 | −0.573 | Ⅲ | |
| Dynamic monitoring and analysis (r37) | −0.241 | 0.467 | −0.267 | −0.560 | −0.707 | Ⅱ | |
| Drainage system (r38) | −0.286 | 0.250 | −0.167 | −0.500 | −0.667 | Ⅱ | |
| Economic operation (r4) | CBM price fluctuation (r41) | −0.105 | 0.133 | −0.433 | −0.660 | −0.773 | Ⅱ |
| Project cost (r42) | −0.241 | 0.467 | −0.267 | −0.560 | −0.707 | Ⅱ | |
| Return on investment (r43) | −0.273 | 0.333 | −0.200 | −0.520 | −0.68 | Ⅱ | |
| CBM production (r44) | −0.317 | 0.077 | −0.067 | −0.440 | −0.627 | Ⅱ | |
| Macroeconomics (r45) | −0.059 | 0.067 | −0.467 | −0.680 | −0.787 | Ⅱ | |
| Funds recovery (r46) | 0.077 | −0.067 | −0.533 | −0.720 | −0.813 | Ⅰ | |
| External market resources (r47) | −0.397 | −0.214 | 0.158 | −0.120 | −0.413 | Ⅲ | |
| External network resources (r48) | −0.143 | 0.200 | −0.400 | −0.640 | −0.760 | Ⅱ | |
| Market demand (r49) | −0.241 | 0.467 | −0.267 | −0.560 | −0.707 | Ⅱ | |
| Organizational management (r5) | Organizational structure adaptability (r51) | 0.000 | 0.000 | −0.500 | −0.700 | −0.800 | Ⅰ, Ⅱ |
| Management coordination and communication (r52) | −0.222 | 0.400 | −0.300 | −0.580 | −0.720 | Ⅱ | |
| Process management (r53) | −0.308 | 0.125 | −0.100 | −0.460 | −0.640 | Ⅱ | |
| Organizational management quality (r54) | −0.142 | 0.200 | −0.400 | −0.640 | −0.760 | Ⅱ | |
| Resource allocation capability (r55) | −0.297 | 0.182 | −0.133 | −0.480 | −0.653 | Ⅱ | |
| Safety and emergency protection (r6) | Safety technology and equipment (r61) | −0.286 | 0.250 | −0.167 | −0.500 | −0.667 | Ⅱ |
| Hidden danger investigation and treatment (r62) | −0.241 | 0.467 | −0.267 | −0.560 | −0.707 | Ⅱ | |
| Safety training and education (r63) | −0.397 | −0.241 | 0.158 | −0.120 | −0.413 | Ⅲ | |
| Safety culture (r64) | −0.317 | 0.077 | −0.067 | −0.440 | −0.627 | Ⅱ | |
| Safety investment (r65) | −0.143 | 0.200 | −0.400 | −0.640 | −0.760 | Ⅱ | |
| Emergency plan (r66) | −0.297 | 0.182 | −0.133 | −0.480 | −0.653 | Ⅱ | |
| Emergency drill frequency (r67) | −0.403 | −0.258 | 0.095 | −0.080 | −0.387 | Ⅲ | |
| Emergency supplies reserve (r68) | −0.373 | −0.159 | 0.233 | −0.260 | −0.507 | Ⅲ | |
| Emergency rescue team (r69) | −0.273 | 0.333 | −0.200 | −0.520 | −0.680 | Ⅱ | |
© 2019 by the authors. Licensee MDPI, Basel, Switzerland. This article is an open access article distributed under the terms and conditions of the Creative Commons Attribution (CC BY) license (http://creativecommons.org/licenses/by/4.0/).
Share and Cite
Wang, W.; Lyu, S.; Zhang, Y.; Ma, S. A Risk Assessment Model of Coalbed Methane Development Based on the Matter-Element Extension Method. Energies 2019, 12, 3931. https://doi.org/10.3390/en12203931
Wang W, Lyu S, Zhang Y, Ma S. A Risk Assessment Model of Coalbed Methane Development Based on the Matter-Element Extension Method. Energies. 2019; 12(20):3931. https://doi.org/10.3390/en12203931
Chicago/Turabian StyleWang, Wanqing, Shuran Lyu, Yudong Zhang, and Shuqi Ma. 2019. "A Risk Assessment Model of Coalbed Methane Development Based on the Matter-Element Extension Method" Energies 12, no. 20: 3931. https://doi.org/10.3390/en12203931
APA StyleWang, W., Lyu, S., Zhang, Y., & Ma, S. (2019). A Risk Assessment Model of Coalbed Methane Development Based on the Matter-Element Extension Method. Energies, 12(20), 3931. https://doi.org/10.3390/en12203931