Abstract
This paper presents the optimal scheduling of a diesel generator and an energy storage system (ESS) while using a detailed battery ESS energy efficiency model. Optimal scheduling has been hampered to date by the nonlinearity and complexity of the battery ESS. This is due to the battery ESS efficiency being a multiplication of inverter and battery efficiency and the dependency of an inverter and any associated battery efficiencies on load and charging and discharging. We propose a combined mixed-integer linear programming and particle swarm optimization (MILP-PSO) algorithm as a novel means of addressing these considerations. In the algorithm, MILP is used to find some initial points of PSO, so that it can find better solution. Moreover, some additional algorithms are added into PSO to modify and, hence, improve its ability of dealing with constraint conditions and the local minimum problem. The simulation results show that the proposed algorithm performs better than MILP and PSO alone for the practical microgrid. The results also indicated that simplification or neglect of ESS efficiency when applying MILP to scheduling may cause a constraint violation.
1. Introduction
In 2015, the Hawaii legislature adopted Act 97 featuring a renewable portfolio standard of 100 percent by 2045, making Hawaii the first U.S. state to make a legally binding commitment to produce all of its electricity from indigenous renewable sources. Act 97 also established interim targets of 30, 40, and 70 percent by 2020, 2030, and 2040, respectively [1]. The Hawaii legislature subsequently adopted Act 200 into law, concluding that microgrids can provide valuable services to the public utility electric grid, including many ancillary services, such as frequency and voltage control, and thereby can increase public safety and security [2].
Section 4 of Act 200 notes potential opportunities for microgrid demonstration projects at the Natural Energy Laboratory of Hawaii Authority (NELHA) that test advanced technologies and market concepts that can facilitate microgrid development consistent with the purpose of Act 200. Accordingly, NELHA is planning a microgrid that consists of photovoltaic (PV) generation, ESS, and an energy management system (EMS) to enhance energy resiliency, self-sufficiency and reliability through the capability of operating in an islanded mode during outages of the Hawaii Island electrical grid.
NELHA’s configuration is consistent with remote and islanded renewable energy source (RES)-connected microgrids and distribution networks that use diesel generators, ESSs, and RESs, such as wind turbines and PV generation systems. Battery energy storage system (ESS) as the principal means of managing power variation of RESs has long been a focus of optimal scheduling problems, typically with equations that feature optimization techniques [3,4,5,6,7,8,9,10,11,12].
In [3], Soroudi et al. proposed an optimal demand response and ESS scheduling in a distribution network while using robust optimization. In [4], Yi et al. presented a robust scheduling scheme for ESSs deployed in distribution networks to facilitate high penetration of RESs. In [5], Fang and Xu proposed a multiobjective coordinated scheduling of energy for aircraft microgrids. Zhou et al. [6] proposed an optimal scheduling for a virtual power plant when considering the degradation cost of ESS. Ross et al. [7] proposed a knowledge-based expert system for the scheduling of an ESS that was installed in a wind-diesel isolated power system. Karami et al. [8] proposed a day-ahead scheduling algorithm for a home energy system, including a battery ESS. Garcia-Torres and Bordons [9] proposed an optimal scheduling of hybrid ESS for a microgrid while using model predictive control. The studies in [3,4,5,6,7,8,9] have considered the efficiency of the ESS as a constant value.
In [10], Choi and Min proposed a coordination scheme between real-time corrective operations of the ESS and day-ahead optimizing planning. Shi et al. [11] analyzed a fluctuation feature of wind power output and proposed generation scheduling optimization of wind-ESS hybrid system. Zhao et al. [12] considered an operation scheduling problem in renewable-powered microgrids to determine a least-cost unit commitment. ESS efficiency is not even a consideration in the studies in [10,11,12].
ESS efficiency depends on the efficiency of both the inverter and the battery. Furthermore, the inverter and battery efficiencies are dependent on an amount of load and a charging/discharging current, respectively, and they are also nonlinear [13,14,15]. The net efficiency of the ESS is a multiplication of both efficiencies, so it is highly nonlinear and complex. Fortenbacher et al. [14] considered both the battery and the inverter efficiency, however they eventually simplified the ESS efficiency as a linear function. The simplification or neglect of the ESS efficiency might cause a violation of state of charge (SOC) limitation and/or cause an inaccurate solution when it is applied to a practical system. Such a case will be shown in the simulation section.
In this paper, resource scheduling has been more fully optimized by featuring a detailed ESS efficiency model. ESS efficiency, as indicated, has been simplified or neglected in previous studies. Since the model is highly nonlinear and complex, optimization techniques, such as linear programming (LP) and quadratic programming, do not adequately address the problem. As a simple methodology applicable to nonlinear problems, we adopted particle swarm optimization (PSO) to the optimal scheduling problem. However, we note that PSO has problems in finding initial set points and dealing with constraint conditions. We propose additional algorithms into the PSO that manage constraint conditions and propose to use mixed-integer LP (MILP) to find initial points of PSO to overcome these issues. The simulation results show the effectiveness of the proposed MILP-PSO coordinated algorithm.
The rest of this paper is organized, as follows. Section 2 shows the problem formulation. Section 3 illustrates the proposed algorithm, including the modification of PSO and the process of MILP to find initial points of PSO. Section 4 shows the simulation results and Section 5 summarized the key findings and policy implications in the conclusion.
2. Problem Formulation
2.1. System Configuration
The algorithm has been developed to manage critical loads at the Hawaii Ocean, Technology and Technology (HOST) Park, which is managed by NELHA on Hawaii island. From Ho’ona Bay to Wawaloli Beach of the ocean-facing portion of the HOST Park, NELHA consists of three main electricity loads—a research campus, a farm compound, and a 55-inch pump station. While all three loads would benefit from inclusion in a microgrid, the three loads are separated by multiple meters and along a distribution feeder line that is operated by Hawaiian Electric Light Company, the Hawaii island utility. The 55-inch pump station location has been selected for development of the initial microgrid because of uncertain tariff and interconnection implications of an advanced hybrid microgrid. Figure 1 is a line diagram of the microgrid that consists of the 750 kW diesel generator, the 600 kW PV generation system, the 500 kW/567 kWh ESS, and the pump station with an average load of 297 kW. The PV generation system, ESS, and microgrid are currently under development and they are expected to be operational in 2021.
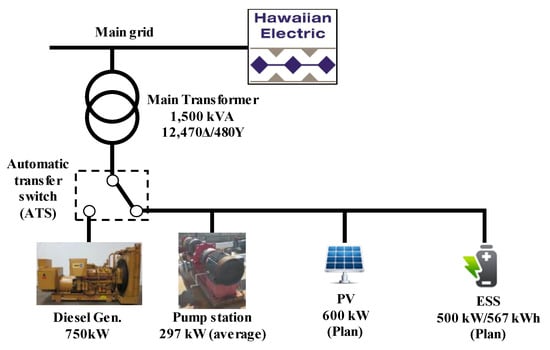
Figure 1.
Natural Energy Laboratory of Hawaii Authority (NELHA) microgrid configuration (the photovoltaic (PV) and the energy storage system (ESS) are planned to be installed).
2.2. Formulation for MILP
The proposed algorithm utilizes MILP for finding partial initial search points of the PSO model. Both of the models are separately formulated in this paper since the MILP is suitable for a linear model and the PSO is suitable for a non-linear model.
The purpose of the developed algorithm is to extend the island mode operation time by more efficiently fueling the diesel generator. This can be achieved by optimizing the efficiency of the energy generation and ESS system. In an islanded microgrid with a diesel generator, minimizing the fuel consumption of the diesel generator is the energy efficient way to operate. Hence, the objective function is expressed as:
where the subscript t is the index for operation time intervals, PD is the diesel generator output, CD is the generation cost per hour of the diesel generator, ΩT is the set of time periods, and Δt is the duration of each time interval. The diesel generator cost at time t, CD,t, is expressed as:
where UD is the diesel generator on/off status and a, b, and c are the cost coefficients and derived by using the curve fitting tool in MATLAB based on the diesel generator fuel consumption data [16]. The value of a, b, and c are 32,000, 210, and 0.097, respectively, where the unit of CD is Korean Won (KRW) per hour. The quadratic diesel generator cost curve is split into 10 linear pieces and, hence, to form piecewise linear cost function since the cost has to be transformed into the linear function. Consequently, the objective function for the MILP is expressed as:
where S is the slope of every linearly split part derived from Equation (2), the subscript l is the index for the slope, and ΩL is the set of slopes. Table 1 shows the value of each slope.

Table 1.
Slope rate of each interval.
The constraint conditions to be satisfied ∀t ∈ ΩT and ∀l ∈ ΩL are
where PESSdis and PESSchg are the discharge and charge output power of ESS, respectively, PPV is the output power of PV, PL is the power of load demand, PD,l,min and PD,l,max are the minimum and maximum power of diesel generator at lth interval, respectively, PESS,max the maximum power of ESS, SOCmin and SOCmax are the minimum and maximum value of SOC, respectively, and PESS is the output power of ESS. PD,l,min and PD,l,max ∀l ∈ ΩL are 0 and 75 kW, respectively, since the range of PD is split into 10 linear pieces.
The SOC of ESS at time t is expressed as:
where ηESSdis and ηESSchg are the efficiencies of ESS when discharging and charging, respectively. For the MILP formulation, they are considered to be constants.
2.3. Formulation for PSO
The formulation has to be different from that of the MILP, since the PSO is adopted to consider the detailed model of the system. For the PSO, instead of Equation (3), the objective function is expressed, as:
Note that UD,t is multiplied to the whole diesel fuel cost, CD,t, instead of being multiplied only to the coefficient a because of the characteristic of the PSO. PD,t could be selected as non-zero value, even if UD,t is zero, which is physically impossible, since the PSO is heuristically searching method. Accordingly, to prevent this error, UD,t is multiplied to the whole diesel fuel cost, so that the diesel generation cost becomes definitely zero if the diesel generator is turned off (UD,t = 0).
The constraint conditions Equations (6)–(11), (13) are unnecessary for the PSO, since PD,t and PESS,t are now considered as a single variable each. Hence, the following constraints are needed:
where PD,min and PD,max are zero and the rated power of diesel generator, respectively. Most importantly, the SOC formulation considering the ESS efficiency has to be changed. In previous works [3,4,5,6,7,8,9,10,11,12,13,14,15], the ESS efficiency has been neglected or simplified, whereas it is considered in detail in this paper, which is the key contribution of this paper.
The net ESS efficiency is the multiplication of the inverter efficiency ηinv and the battery efficiency ηBT and it is expressed as:
where ηBTchg and ηBTdis are the charge and discharge efficiency of the battery, respectively. Note that, in order to consider the net ESS efficiency in detail, both inverter and battery efficiencies have to be considered as a function of output power. The generic inverter efficiency is referred to [17] and it can be divided into several linear equations, as (in per unit):
where PESS = PESSdis when discharging and PESS = PESSchg when charging. The energy efficiency for rechargeable battery is expressed as [18] (in per unit):
where PBTchg and PBTdis are the charge/discharge power flow of the battery from the inverter and they are expressed as:
Refer to Equation (20), let ηinv be expressed as a general form of linear function with coefficient C1 and C0, that is:
Subsequently, by substituting Equations (21)–(25) into Equations (18) and (19), the net ESS efficiency is represented as (in per unit):
Note the per unit value of CAP is 1 and hence is omitted in Equations (26) and (27). By substituting Equations (14), (26), and (27) into (12), all of the constraint conditions can be represented in terms of controllable variables (PESS, PD, and UD) and parameters.
3. Generation Scheduling Algorithm
As shown in Equations (14), (26), and (27), in the detailed ESS efficiency model, the SOC constraint is represented as a highly nonlinear and complex function of PESS. Hence, numerical optimization techniques, such as LP or quadratic programming, are not applicable to the problem. It is inevitable to use heuristic optimization techniques to take account of the detailed model of the ESS efficiency and PSO is used in this paper. However, the heuristic optimization techniques also have some disadvantages of performance dependency on initial points and imperfection of reflecting constraint conditions into the algorithm. We propose a MILP-PSO coordinated algorithm for an optimal scheduling of a diesel generator-ESS islanded microgrid to solve these problems.
3.1. PSO Algorithm
The PSO algorithm is working based on the following equations [17]:
where V is the velocity vector, w is the weight factor, c1 and c2 are the acceleration constants, rand1 and rand2 are random numbers in the range between 0 and 1, X is the position vector, Xlb and Xgb are the local and the global best positions for X, respectively, wmax and wmin are the maximum and the minimum values of w, respectively, i is the particle index, k is the iteration index, and N is the total number of iterations. In this paper, the position vector includes PESS, PD, and UD at every time slot.
Refer to [19,20,21], the maximum value of the sum of c1 and c2 should be 4 and an effective initial value for each is 2. Based on these initial values, we have chosen c1, c2, wmax and wmin as 1, 1, 1, and 0.1, respectively, as grounds for trial-and-error simulation results. It is noticeable that there are some competitive offline and online parameter control methods that alleviate the user of this time-consuming phase while providing superior results [22,23,24,25]. An application of parameter control methods remains as a future work, as this paper is focused on the detailed model of battery ESS and the application of MILP for finding a part of PSO initial searching points.
Although PSO has been developed primarily as unconstrained optimization methods [26], it is considered to be a good alternative for solving constrained optimization problems. The most common approach for solving a constrained optimization problem is the use of a penalty function [27]. The problem with this approach is that no other method exists other than trial-and-error for defining pertinent penalty functions [28]. If the penalty values are high or low, the solutions could be trapped in a local minimum or could not be well detected. Furthermore, the solution of the optimal ESS scheduling usually lies on the limit of the SOC constraint, since the ESS will continuously charge and discharge power until its SOC reaches the maximum or the minimum value. The tendency of the solution to lie on the constraint limit makes finding solutions much more difficult. We add a simple algorithm that forces the variables to stay within the feasible solutions into the PSO to alleviate the penalty function problem. Figure 2 shows the algorithm flow chart.
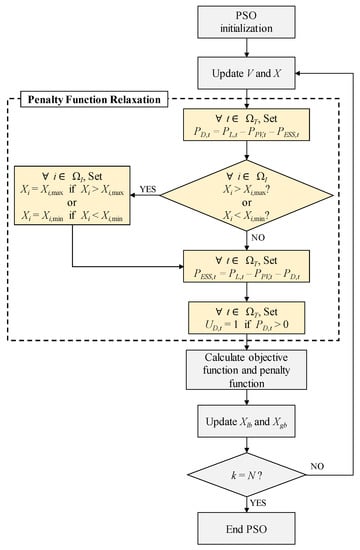
Figure 2.
Modified particle swarm optimization (PSO) algorithm flow chart.
A ‘Penalty Function Relaxation (PFR)’ component is added to the general PSO algorithm, as shown in Figure 2. The purpose of the PFR algorithm is simply to relax the burden of the penalty function by forcing the variables to stay within the feasible solution range. All of the constraints, except that of the SOC, are handled by the proposed part of the algorithm. This is because the SOC is a highly nonlinear function of PESSchg and PESSdis in consideration of the detailed model of battery ESS, as shown in Equations (14), (26), and (27). Consequently, maintaining the SOC within a feasible range while updating the position vector can no longer be achieved by simple rules. A more complex algorithm, which understands the nonlinear relationship between PESS and SOC, is required to update the SOC in such a manner to keep it within a feasible range. In this case, we only used the penalty function for the SOC constraint due to its simplicity. The sequence of the PFR algorithm is as follows:
- (1)
- After updating V and X, PD is forced to be set as the net load (PL − PPV − PESS) in order to balance the generation and load.
- (2)
- Afterwards, all of the variables are checked as to whether if they violate the upper or lower limit. If so, they are constrained to their closest limit value. However, by adjusting the violated variables, the generation and load equality constraint could be violated.
- (3)
- Hence, this time, PESS is forced to be set as the net load (PL − PPV − PD) in order to balance the generation and load again.
- (4)
- If PD,t > 0, set UD,t = 1.
For sequence in Equation (2), other rules may be applied. For instance, instead of binding the violated variable on the limit, it can be readjusted to be within the limit. In such a case, the following equation can be applied to the violated variables:
where Xi,viol denotes the amount of violation by the variable Xi. Comparative analysis of both methodologies yielded results showing little variation between the two, but suggested that the methodology of sequence (2) performed slightly better than that of Equation (31).
Nonetheless, we were unable to render a definitive assessment of superiority between the two methodologies, because the PSO algorithm contains a random variable that might yield a slightly different result in each simulation. In many cases of the optimal scheduling problem, including this paper, some variables tend to be bound on their upper or lower limit. For instance, the SOC could operate at its minimum and/or maximum value for at least one cycle (the simulation results show that it has minimum value at a certain time slot) and/or the output of ESS could operate at its minimum and/or maximum value. Therefore, we have adopted the methodology that is presented in sequence (2) in this paper.
Note that, due to the sequence in Equation (4), the proposed algorithm can avoid being formulated as the mixed-integer PSO (MIPSO) problem, which makes the formulation more complicated, since it contains both discrete and continuous variables. In other words, UD is not contained in the position vector X and is simply acquired by the sequence in Equation (4). This is possible due to the characteristic of the diesel generator cost function in Equation (2), which is included in the objective function of the PSO. Due to the existence of the cost coefficient a, once being operated, the diesel generator tends to generate its power as much as possible in order to achieve cost efficient operation.
The PFR algorithm cannot deal with the SOC constraint condition in Equation (12), since it is very complex in terms of the controllable variables. Hence, it is unavoidable to use the penalty function to take account of the SOC constraint. The penalty function fp is presented as:
where kp is the penalty function coefficient and SOCviol,t is the amount of SOC violation at t in per unit. The penalty function is formulated by trial-and-error, as referred to [28], and kp is set to 100. By applying PFR algorithm, all of the constraints, except the SOC constraint, can be excluded from the penalty function.
3.2. PSO Coordination with MILP
We propose a methodology to find proper initial points to alleviate such difficulties in finding a solution since the penalty function makes finding optimal solution difficult. To find initial points of PSO, MILP is adopted, since it is the most common optimization technique for the optimal scheduling. To adopt MILP, the problem is linearized as in Equations (3)–(14). The SOC constraint in Equation (12) is linearized by setting ηESS to a constant number, as the previous works [3,4,5,6,7,8,9] have done. However, in this paper, we have applied 11 different values to ηESS ranging from 90% to 100% with 1% interval. Hence, 11 different particles are acquired from MILP as the initial points of the PSO. The rest of the initial points are working the same as with the regular PSO. Hence, the proposed algorithm can take advantages from both MILP (by fixing some initial points near the local optimal value) and PSO (by retaining the chance of searching an entire feasible area). Figure 3 shows the flow chart of getting the initial points of PSO by using MILP. The set of solutions resulting from MILP is used as a portion of the initial points of the PSO, as illustrated in Figure 3. The rest of the initial points of the PSO are randomly generated from the uniformly distributed values within the allowable range. For instance, if the population of PSO NP is 1000, 11 are acquired from the algorithm shown in Figure 3 and the rest of the population is randomly selected.
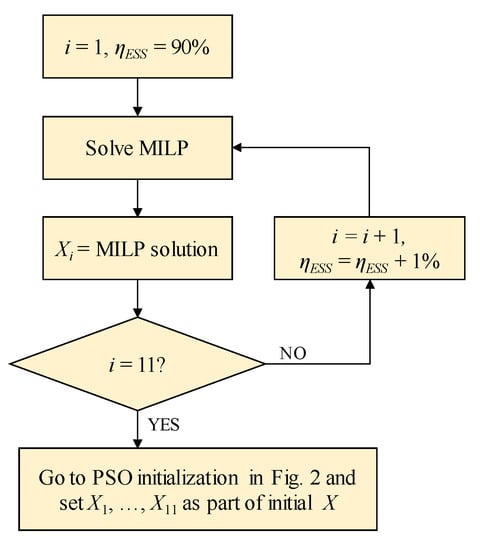
Figure 3.
Flow chart of acquiring the initial points of PSO by using mixed-integer linear programming (MILP).
4. Simulation Results and Discussion
4.1. Simulation Environment
We used the real measured data of NELHA’s 17.5-kW PV system and the pump station load shown in Figure 4 to test the algorithm. Since the 600-kW PV system of the target microgrid shown in Figure 1 has not been installed yet, we used the 17.5-kW PV data and scaled it up to 600 kW. Four cases were tested to present two different weather conditions—a sunny day (Cases 1 and 2) and a cloudy day (Cases 3 and 4)—and two different SOC initial values—40% (Cases 1 and 3) and 60% (Cases 2 and 4). For all cases, an island mode starts at 15 h. Figure 5 shows the PV generation and the pump station load data for Cases 1–4.
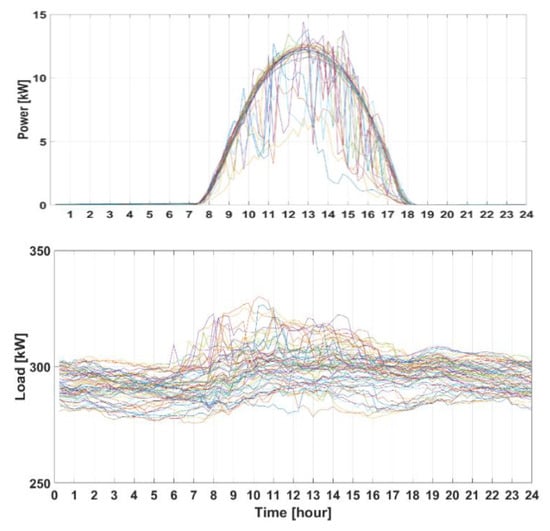
Figure 4.
Daily 17.5-kW PV generation and pump station load data of NELHA (with 15-min. time interval from 1 October 2017 to 31 December 2018).
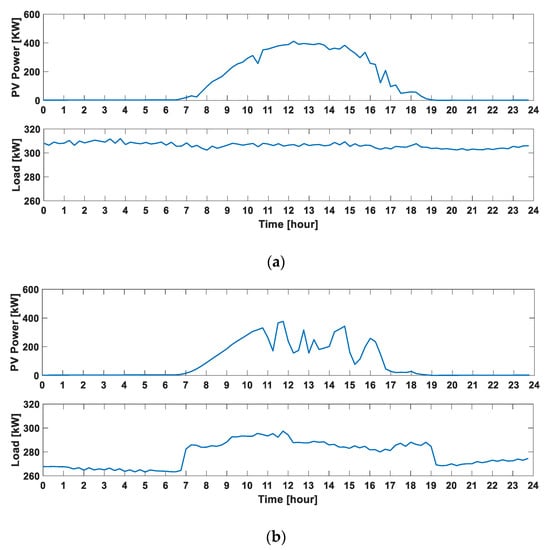
Figure 5.
Daily PV generation and pump station load data of NELHA: (a) Cases 1 and 2—4 July 2018; and, (b) Cases 3 and 4—31 July 2018.
Three different optimal scheduling methods are tested to prove the effectiveness of the proposed algorithm. The following a are brief explanation about the tested algorithms:
- MILP: MILP is adopted to solve the scheduling problem. The problem is linearized in a piecewise fashion to adopt MILP. Eleven results are acquired by changing ηESS from 90% to 100% with 1% interval.
- PSO: A general PSO algorithm is applied. All of the initial points are randomly selected. The rest of the algorithm is the same as explained in Section III-A, except that it has no Equations (1) and (3) sequences in PRF algorithm and, hence, has a different penalty function that takes account of the generation and load balance constraint. The penalty function is expressed, as:where kp is set to 100,000 grounds for trial-and-error. The exponential form used in Equation (32) is not applicable here, since we experienced that the solution cannot be found by applying exponential form with the generation and load balance constraint.
- MILP-PSO: The proposed algorithm.
The population number Np and the total iteration number N of the PSO algorithm are 1000 and 1000, respectively. The scheduling time interval Δt is set to 15 min., since the data of the NELHA microgrid are measured with 15-min. time intervals.
Since MILP is applied to the linear model while the others are applied to the detailed model (a practical model that considers the detailed model of the net ESS efficiency), it is not appropriate to directly compare those results. To make a fair comparison between algorithms, the same detailed model evaluates all of the solutions acquired from the algorithms. Figure 6 shows the methodology of solution evaluation among three algorithms.
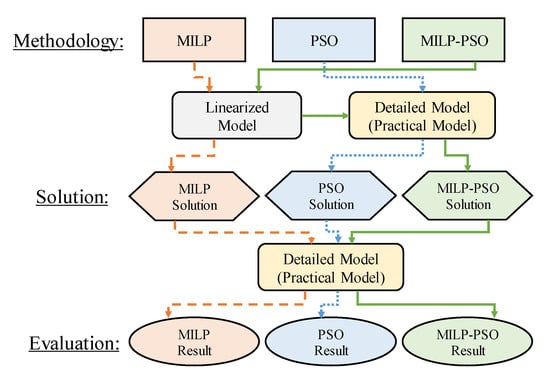
Figure 6.
Solution evaluation methodology among algorithms.
4.2. Simulation Results and Discussion
Table 2 shows the simulation results of the operation cost and the sum of SOC violation at each time slot for all cases by applying different methods shown in Figure 6. Figure 7 shows the simulation results of the ESS power and SOC for each time slot using the proposed MILP-PSO algorithm. Careful observation reveals initial values of the SOC in Figure 7(a–d) are not exactly at 40% or 60%. This is because these are not actually initial values, but are the values after the first time slot. The SOCs at the first time slot of Cases 1 and 2 are slightly higher than 40% and 60%, respectively, since the ESS charges in the first time slot of Cases 1 and 2, as shown in Figure 7a,b. Similarly, the SOCs at the first time slot of Cases 3 and 4 are slightly lower than 40% and 60%, respectively, since the ESS discharges in the first time slot of Cases 3 and 4, as shown in Figure 7c,d.

Table 2.
Simulation results of cost and state of charge (SOC) violation.
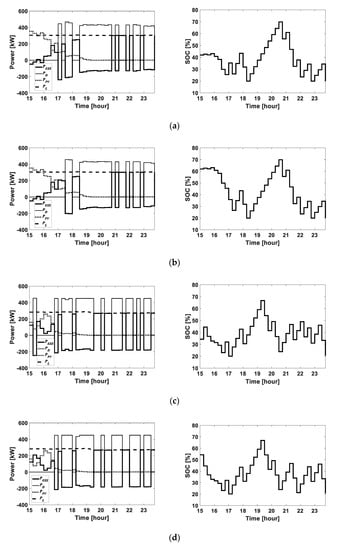
Figure 7.
Simulation results of output power and SOC: (a) Case 1; (b) Case 2; (c) Case 3; (d) Case 4.
Applying MILP to the ESS scheduling problem causes the SOC violation problem if the practical plant (ESS) is highly nonlinear, as shown in Table 2. When considering the ESS efficiency to be 95% or 100% as most previous works have done definitely contributes to the SOC violation. In the case of 100% ESS efficiency, Table 2 shows that the sum of SOC violations for 9 h with 15-min. time intervals ranges from 85.0% to 142.9%, depending on the case studies. In the case that applies the general PSO, the SOC violation is even worse and the cost is also high. This is because the general PSO is hard to handle with the constraint conditions and it is highly dependent on the initial condition.
Decreasing the ESS efficiency can avoid the risk of violating SOC, but it increases the operational cost. Moreover, it is impossible to choose a proper constant ESS efficiency value since it depends on the operational condition, such as the initial SOC, load, and PV generation. It is shown as the bold letters of Table 2—for Cases 1 and 2, the proper constant ESS efficiency is 93%, whereas it is 94% for Cases 3 and 4. Yet, these results do not represent the best choices for Cases 1 and 2. By using MILP-PSO, the cost can be even further decreased without the SOC violation, i.e., the cost is decreased by 0.53% and 0.60% for Case 1 and 2, respectively, when compared to the best solution of the conventional MILP.
The simulation results vary every time they are conducted since the PSO and MILP-PSO contains random parameters in their algorithms. Accordingly, the results of PSO and MILP-PSO in Table 2 are the average values of a thousand different simulation results. The variation of MILP-PSO results is very small since we have upgraded it, as shown in Figure 2 and Figure 3. Table 3 shows the minimum, maximum, and standard deviations of the costs for Cases 1 and 2. Even the maximum costs among 1000 different MILP-PSO simulation for Cases 1 and 2 are smaller than those of the best solutions of the MILP, as shown in Table 3.

Table 3.
Statistics from 1000 times of MILP-PSO simulation.
The population number Np and the total iteration number N of the PSO algorithm is adjustable. Additional simulations have been conducted for Case 1 to analyze the effect of changing those numbers on the results and the results are shown in Figure 8. Figure 8a shows the result costs and the computation times by changing Np to 100, 300, 500, and 1000, while N is fixed as 1000. As Np increases, the cost is reduced, but the reduction rate is very small while the computation time increases drastically. Similarly, by increasing N to 500, 1000, 1500, and 2000 while fixing Np as 1000, the computation time is drastically increased, as shown in Figure 8b. In this case, the cost is slightly increased even if N is increased from 1500 to 2000. This is due to the PSO containing random variables that can yield slightly different results each time. Consequently, the increment profile of the population number and the iteration number causes too large a computation time increment relative to the small size of the cost reduction.
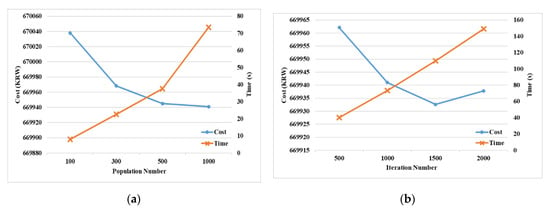
Figure 8.
Simulation results for Case 1 by changing the population number Np and the iteration number N: (a) Fix N = 1000; and, (b) Fix Np = 1000.
Since this algorithm is about to be applied to the real test-site where the scheduling time interval is 15 min. and is expected to yield its result every time interval, the computation time should be significantly less than 15 min. This is most importantly seen in emergencies, such as an unexpected transition to island mode when the algorithm has to reschedule and yield its solution rapidly. Grounds for this constraint, we expect that the algorithm has to output the result within 1–2 min. Hence, we have selected Np = 1000 and N = 1000. However, this value is adjustable by operators, depending on their own time constraint.
4.3. Scope of the Study
We have considered the net ESS efficiency in detail vis-a-vis the application of the combined MILP-PSO algorithm and model, but acknowledge several assumptions that simplify a portion of the overall model. We have not conducted a power flow analysis on the 55-inch pump system or the applied power flow equations to our model. We also did not consider the startup cost of the diesel generator, since the primary purpose of this paper is to show that the SOC violation and the premature solution are solely caused by the consideration of ESS efficiency as a constant value. The authors deemed that the addition of these particular complex factors would obscure the findings on the critical impact of accurately considering the ESS efficiency as we have clearly demonstrated.
Moreover, it is worthy to try to adopt other metaheuristic algorithms, such as the differential evolution and genetic algorithm. Comparing the superiority between all of the metaheuristic algorithms is out of scope of this paper, but adopting other types of algorithms with a parameter adaptation method could yield an improved performance. These issues remain as future works.
5. Conclusions
In this paper, the detailed model of ESS efficiency is reflected into the ESS-diesel generator scheduling algorithm for an islanded microgrid. A combined MILP-PSO algorithm is developed to overcome the limitation of the conventional, independent MILP and PSO algorithms, which has resulted in greater efficiency of the diesel back-up generator. Actual electrical consumption data from the 55-inch pump at NELHA are used to simulate microgrid performance to prove the effectiveness of the proposed algorithm. The simulation results show that applying MILP or PSO independently to the islanded microgrid causes an SOC violation in the practical microgrid and also contributes to premature solutions that hinder efficiency. However, by applying the proposed combined MILP-PSO algorithm, less fuel is used and operational costs can be decreased by 0.53–0.6% by eliminating the SOC violation.
From a resilience standpoint, this greater efficiency results in longer operation of the back-up systems in islanded mode. Therefore, optimized resource scheduling, as described herein, can help to fulfill the intent of Hawaii’s Act 200 regarding microgrids adding valuable services to the grid and energy resiliency.
Author Contributions
Methodology, software, and validation, R.-K.K.; writing—review and editing, R.-K.K. and M.B.G.; project administration and funding acquisition, M.B.G. and Y.-S.K.; data curation, K.R.O.; conceptualization and writing—original draft preparation, Y.-S.K. All authors have read and agreed to the published version of the manuscript.
Funding
This research was funded by the Korea Institute of Energy Technology Evaluation and Planning (KETEP) and the Ministry of Trade, Industry and Energy (MOTIE) of the Korea, grant number 20188550000410.
Acknowledgments
This work was supported by the Korea Institute of Energy Technology Evaluation and Planning (KETEP) and the Ministry of Trade, Industry and Energy (MOTIE) of the Korea (No. 20188550000410).
Conflicts of Interest
The authors declare no conflict of interest.
Nomenclatures
| A. Sets and Indices | |
| t | Index for operation time intervals. |
| ΩT | Set of time periods. |
| l | Index for linearized diesel generation cost slope. |
| ΩL | Set of diesel generation cost slopes. |
| k | Index for PSO iteration. |
| i | Index for PSO particles. |
| ΩI | Set of PSO particles. |
| B. Parameters | |
| PD,min/max | Minimum/maximum output power of diesel generator. |
| PESS,max | Maximum output power of energy storage system (ESS). |
| SOCmin/max | Minimum/maximum state of charge (SOC) of ESS. |
| CAP | Rating capacity of ESS. |
| Δt | Duration of each time interval. |
| a, b, c | Cost coefficients of diesel generator. |
| S | Slope rate of the diesel generation cost. |
| C1, C0 | Coefficients of inverter efficiency. |
| N | Total number of PSO iterations. |
| Np | Population number of particles. |
| rand | Random numbers uniformly distributed between [0, 1] |
| w | PSO weight factor. |
| wmin/max | Minimum/maximum value of PSO weight factor w. |
| c1, c2 | Acceleration constants of PSO. |
| kp | Penalty function coefficient. |
| C. Variables | |
| PD | Output power of diesel generator. |
| PESSdis/ESSchg | Discharge/charge output power of ESS (power flow between inverter and grid). |
| PBTdis/BTchg | Discharge/charge output power of battery (power flow between inverter and battery). |
| PPV | Output power of photovoltaic (PV) generation system. |
| PL | Load demand power. |
| UD | Diesel generator ON/OFF status. |
| UEd/Ec | ESS discharging/charging status. |
| ηinv | Efficiency of inverter. |
| ηBTdis/BTchg | Discharge/charge efficiency of inverter. |
| ηESSdis/ESSchg | Discharge/charge efficiency of ESS. |
| X, V | Position and velocity vectors of PSO, respectively. |
| Xlb, Xgb | Local and global best positions for X, respectively. |
References
- Hawaii Clean Energy Initiative 2008–2018: Celebrating 10 Years of Success. Available online: https://www.nrel.gov/docs/fy18osti/70709.pdf (accessed on 23 July 2019).
- H.B. 2110, 29th Leg., Reg. Session (Haw. 2018) (“Act 200”), Section 1. Available online: https://www.capitol.hawaii.gov/session2018/bills/HB2110_SD2_.htm (accessed on 13 April 2020).
- Soroudi, A.; Siano, P.; Keane, A. Optimal DR and ESS scheduling for distribution losses payments minimization under electricity price uncertainty. IEEE Trans. Smart Grid 2016, 7, 261–272. [Google Scholar] [CrossRef]
- Yi, J.; Lyons, P.F.; Davison, P.J.; Wang, P.; Taylor, P.C. Robust scheduling scheme for energy storage to facilitate high penetration of renewables. IEEE Trans. Sustain. Energy 2016, 7, 797–807. [Google Scholar] [CrossRef]
- Fang, S.; Xu, Y. Multiobjective coordinated scheduling of energy and flight for hybrid electric unmanned aircraft microgrids. IEEE Trans. Ind. Electron. 2019, 66, 5685–5695. [Google Scholar] [CrossRef]
- Zhou, B.; Liu, X.; Cao, Y.; Li, C.; Chung, C.Y.; Chan, K.W. Optimal scheduling of virtual power plant with battery degradation cost. IET Gener. Transm. Distrib. 2016, 10, 712–725. [Google Scholar] [CrossRef]
- Ross, M.; Hidalgo, R.; Abbey, C.; Joos, G. Energy storatge system scheduling for an isolated microgrid. IET Renew. Power Gener. 2011, 5, 117–123. [Google Scholar] [CrossRef]
- Karami, H.; Sanjari, M.J.; Hosseinian, S.H.; Gharehpetian, G.B. An optimal dispatch algorithm for managing residential distributed energy resources. IEEE Trans. Smart Grid 2014, 5, 2360–2367. [Google Scholar] [CrossRef]
- Garcia-Torres, F.; Bordons, C. Optimal economical schedule of hydrogen-based microgrids with hybrid storage using model predictive control. IEEE Trans. Ind. Electron. 2015, 62, 5195–5207. [Google Scholar] [CrossRef]
- Choi, S.; Min, S.-W. Optimal scheduling and operation of the ESS for prosumer market environment in grid-connected industrial complex. IEEE Trans. Ind. Appl. 2018, 54, 1949–1957. [Google Scholar] [CrossRef]
- Shi, J.; Lee, W.-J.; Liu, X. Generation scheduling optimization of wind-energy storage system based on wind power output fluctuation features. IEEE Trans. Ind. Appl. 2018, 54, 10–17. [Google Scholar] [CrossRef]
- Zhao, B.; Shi, Y.; Dong, X.; Luan, W.; Bornemann, J. Short-term operation scheduling in renewable-powered microgrids: A duality-based approach. IEEE Trans. Sustain. Energy 2014, 5, 209–217. [Google Scholar] [CrossRef]
- Kang, J.; Yan, F.; Zhang, P.; Du, C. A novel way to calculate energy efficiency for rechargeable batteries. J. Power Sources 2012, 206, 310–314. [Google Scholar] [CrossRef]
- Fortenbacher, P.; Mathieu, J.L.; Andersson, G. Modeling and optimal operation of distributed battery storage in low voltage grids. IEEE Trans. Power Syst. 2017, 32, 4340–4350. [Google Scholar] [CrossRef]
- Faranda, R.S.; Hafezi, H.; Leva, S.; Mussetta, M.; Ogliari, E. The optimum PV plant for a given solar DC/AC converter. Energies 2015, 8, 4853–4870. [Google Scholar] [CrossRef]
- Approximate Diesel Fuel Consumption Chart. Available online: https://www.dieselgenerators.com/approximate-diesel-fuel-consumption-chart (accessed on 29 July 2019).
- Fedkin, M. Utility Solar Power and Concentration: Chapter 6.5. In Efficiency of Inverter; Penn State University: State College, PA, USA, 2014; Available online: https://www.e-education.psu.edu/eme812/node/738 (accessed on 29 July 2019).
- Kennedy, J.; Eberhart, R. Particle swarm optimization. In Proceedings of the ICNN’95, Perth, Australia, 27 November–1 December 1995; pp. 1942–1948. [Google Scholar]
- Valle, Y.; Venayagamoorthy, G.K.; Mohagheghi, S.; Hernandez, J.-C.; Harley, R.G. Particle swarm optimization: Basic concepts, variants and applications in power systems. IEEE Trans. Evol. Comput. 2008, 12, 171–195. [Google Scholar] [CrossRef]
- Eberhart, R.; Shi, Y.; Kennedy, J. Swarm Intelligence; Morgan Kaufmann: San Francisco, CA, USA, 2001. [Google Scholar]
- Ozcan, E.; Mohan, C. Particle swarm optimization: Surfing the waves. Proc. IEEE Congr. Evol. Comput. 1999, 3, 1939–1944. [Google Scholar]
- Eiben, E.; Smit, S.K. Evolutionary algorithm parameters and methods to tune them. In Autonomous Search, 1st ed.; Hamadi, Y., Monfroy, E., Saubion., F., Eds.; Springer: Berlin/Heidelberg, Germany, 2011; Chapter 2; pp. 15–36. [Google Scholar]
- Tatsis, V.A.; Parsopoulos, K.E. Dynamic Parameter Adaptation in Metaheuristics Using Gradient Approximation and Line Search. Appl. Soft Comput. 2019, 74, 368–384. [Google Scholar] [CrossRef]
- Bartz-Beielstein, T. Experimental Research in Evolutionary Computation; Springer: Berlin, Germany, 2006. [Google Scholar]
- Birattari, Z.Y.; Balaprakash, P.; Stutzle, T. F-race and iterated f- race: An overview. In Experimental Methods for the Analysis of Optimization Algorithms, 1st ed.; Bartz-Beielstein, T., Chiarandini, M., Paquete, L., Preuss, M., Eds.; Springer: Berlin/Heidelberg, Germany, 2010; pp. 311–336. [Google Scholar]
- Aziz, N.A.A.; Alias, M.Y.; Mohemmed, A.W.; Aziz, K.A. Particle swarm optimization for constrained and multiobjective problems: A brief review. In Proceedings of the IPEDR’11, Bali, Indonesia, 1–3 April 2011; pp. 146–150. [Google Scholar]
- Parsopoulos, K.E.; Vrahatis, M.N. Particle swarm optimization method for constrained optimization problems. In Proceedings of the 2nd Euro-International Symposium on Computational Intelligence, Kosice, Slovakia, 2002; pp. 214–220. [Google Scholar]
- Yang, J.-M.; Chen, Y.-P.; Horng, J.-T.; Kao, C.-Y. Applying family competition to evolution strategies for constrained optimization. In Evolutionary Programming VI, 1st ed.; Angeline, P.J., Reynolds, R.G., McDonnell, J.R., Eberhart, R., Eds.; Springer: Berlin/Heidelberg, Germany; New York, NY, USA, 1997; pp. 201–211. [Google Scholar]
© 2020 by the authors. Licensee MDPI, Basel, Switzerland. This article is an open access article distributed under the terms and conditions of the Creative Commons Attribution (CC BY) license (http://creativecommons.org/licenses/by/4.0/).