Article

Integration of Hydrogen into Multi-Energy Systems Optimisation

Department of Electrical and Electronic Engineering, Imperial College London, London SW7 2AZ, UK
*
Author to whom correspondence should be addressed.
Energies 2020, 13(7), 1606; https://doi.org/10.3390/en13071606
Submission received: 14 March 2020 / Revised: 30 March 2020 / Accepted: 31 March 2020 / Published: 1 April 2020

Abstract

:
Hydrogen presents an attractive option to decarbonise the present energy system. Hydrogen can extend the usage of the existing gas infrastructure with low-cost energy storability and flexibility. Excess electricity generated by renewables can be converted into hydrogen. In this paper, a novel multi-energy systems optimisation model was proposed to maximise investment and operating synergy in the electricity, heating, and transport sectors, considering the integration of a hydrogen system to minimise the overall costs. The model considers two hydrogen production processes: (i) gas-to-gas (G2G) with carbon capture and storage (CCS), and (ii) power-to-gas (P2G). The proposed model was applied in a future Great Britain (GB) system. Through a comparison with the system without hydrogen, the results showed that the G2G process could reduce £3.9 bn/year, and that the P2G process could bring £2.1 bn/year in cost-savings under a 30 Mt carbon target. The results also demonstrate the system implications of the two hydrogen production processes on the investment and operation of other energy sectors. The G2G process can reduce the total power generation capacity from 71 GW to 53 GW, and the P2G process can promote the integration of wind power from 83 GW to 130 GW under a 30 Mt carbon target. The results also demonstrate the changes in the heating strategies driven by the different hydrogen production processes.

Graphical Abstract

1. Introduction

The new-found interest in hydrogen from both industry and academia has stimulated research exploring the application of hydrogen as a potential option for decarbonizing major parts of the energy system. Hydrogen can play a key role alongside electricity in the low carbon economy due to its low-cost storability, flexibility, low-carbon hydrogen production technologies, and the opportunity to re-energise the gas distribution network. Considering the expensive investment for large scale deployment of electric storage to facilitate the mass integration of renewable energy sources (RES), hydrogen storage can potentially serve as an alternative, when coordinated with other hydrogen-related technologies, to fulfil the same functionality at a lower cost due to its reduced capital cost [1,2]. It is also a flexible energy vector that can be produced from various primary energy sources. Two main sources were considered in this paper: natural gas and electricity via electrolysers. Hydrogen can be used as fuel for electricity generation, fuel for a hydrogen boiler for heating, and it can also be used to power fuel cells for transport and co-generation for electricity and heat. This raises important questions on how the hydrogen should be integrated with other energy systems and the importance of whole-energy system optimisation, compared to the traditional silo planning approach.
The need to address these questions has triggered the development of multi-energy systems modelling approaches to assess the technical and cost implications of integrating hydrogen into the overall energy system. Compared to the energy system planning approach without considering synergies between different sectors, multi-energy systems, whereby different energy vectors (e.g., electricity, heat and gas, etc.) can operate in a coordinated fashion at various levels, introduces an important opportunity to improve the system planning technically, economically, and environmentally [3]. Few applications of hydrogen include hydrogen boilers, hydrogen fuel-cells for vehicles, and micro-CHP (combined heat and power), which demonstrate that hydrogen brings interaction to all sectors across the energy landscape. However, the impacts of this cross-energy vector interaction on the energy system capacity requirement and operation, primary energy demand, values, and options that hydrogen create have not been thoroughly investigated, especially in the context of multi-energy systems. The benefits and the system implications of integrating a hydrogen supply chain should be identified through a whole-system approach to capture complex interactions across different technologies, different energy vectors, and coordination between investment in energy infrastructure and operating decisions.
Authors have proposed the use of a holistic optimisation model for electricity system investment and operation decisions to assess the value of bulk and distributed energy storages in the future low-carbon electricity systems [4]. Enhancing the model in [4], the authors proposed the integrated electricity and heat energy model in [5]. The model was used to analyse the system implications and cost performance of alternative heating decarbonisation strategies including the use of hydrogen, electrification, and hybrid heat pumps. The analyses considered the interactions between electricity sectors and heat sectors. Similarly, Zhang et al. [6] quantified the benefits of the integration of heat, particularly district heating, and the electricity system. Through integrated planning, the flexibility that exists in the heating system can be utilised to support the electricity system, which otherwise has to count on the flexibility measures within the electricity system itself. The series of case studies demonstrated that district heating network and application of thermal energy storage would enhance the flexibility of the overall energy system, thus delivering substantial cost savings to meet the carbon target. Chaudry et al. [7] proposed a combined gas and electricity system optimisation model to solve short-term operation problems. The model links two energy sectors through gas turbine generation. The proposed combined gas and electricity system model has demonstrated its value for assessing the consequences of the failure of vital facilities.
Previous research on the integration of hydrogen in the overall energy system has mostly focused on its industrial production, transmission, and distribution [8]. Authors designed a future hydrogen supply chain which covered production, storage, and distribution for the UK transport demand. A few previous studies have considered the interactions of hydrogen with other energy sectors. Almansoori et al. [9] adopted optimisation techniques to develop the hydrogen supply chain for the transport sector; the optimal infrastructure structure and operation costs were determined through the proposed model. The mixed-integer linear programming (MILP) model was proposed to optimise the design and operation of integrated wind–hydrogen–electricity networks [10]. The optimisation only considered the transport demand supplied by hydrogen. However, the design and operation of the wider power sector and other hydrogen production processes were not considered. Samsatli et al. [11] proposed a comprehensive spatiotemporal MILP model to optimise the integrated electricity–hydrogen value chains to supply the space and water heating demand in GB. The impacts of P2G facilities in the integrated electricity and gas system were analysed in [12,13,14], which proved the flexibility and effectiveness of P2G facilities. In [15], a power-to-hydrogen-and-heat scheme was proposed, in which the power-to-heat and power-to-hydrogen processes were coupled through adopting the heat recovery from the P2G process. The synergy among the electricity sector, transport sector, and hydrogen sector was analysed in [16], but the heat sector was not considered.
This paper proposes an electricity–heat-transport–hydrogen economical optimisation with environmental constraints at the national level, which simultaneously considers the infrastructure capital expenditures (CAPEX) and whole system operative expenditures (OPEX), thus meeting the specific carbon target at a lower whole-system cost. The key contributions of this paper can be summarised as follows:
1)
It incorporates modelling of the hydrogen system into a combined optimization multi-energy systems model considering both investment and operation at the system level.
2)
It assesses the system implications, economic, and environmental impact of different hydrogen production infrastructures across the whole system level.
3)
It also investigates the impacts of hydrogen integration on each individual energy sector under different carbon targets.
The remainder of this paper is organized as follows. Section 2 presents the integrated multi-energy systems model. In Section 3, a series of case studies are performed to compare the advantages and disadvantages of adopting G2G and P2G individually with the system without hydrogen integration in different carbon scenarios. The conclusions are provided in Section 4.

2. Integrated Multi-Energy Systems Model

2.1. Interactions in the Multi-Energy Systems

Interactions take place through the energy conversion between different energy carriers to supply energy demand and to ensure optimal and secured operation. There are numerous interactions between different energy sectors in the proposed model, as shown in Figure 1. In this model, gas-heated reformers combined with carbon capture storage (GHR-CCS) and electrolysers are the technologies for the G2G and P2G processes, respectively. GHR and electrolysis link hydrogen with the gas and electricity system together respectively. The electricity generation can also use hydrogen as a fuel to make electricity and hydrogen systems interactive. Meanwhile, the transportation demand can be supplied by electricity or hydrogen through electric vehicles (EV) and hydrogen fuel-cell vehicles (HFCV), respectively, which means that electricity and hydrogen systems are also coupled in the transportation sector. The hydrogen boiler can function in the same way as existing gas boilers in the heating system, but brings zero-emissions, which maintains resilience for householders through promoting the diversity of energy carriers. The other components like electricity storage and thermal energy storage or other heating devices (resistance) can also be added to the model, which were omitted here for brevity.

2.2. Objective Function

The model was formulated as a MILP problem with a 1-year time horizon and hourly time resolution to capture the interactions across investment and operating decisions. The objective function (Equation (5)) is to minimize the overall annuitized investment and operation cost. The fixed and variable operating and maintenance costs of all the technologies were also considered, which were omitted in the equations for brevity. The total cost in the electricity system is formulated in Equation (1).
C e = g = 1 G π g · n g · P ¯ g + r = 1 R ( π h v s r · n h v s r + π l v s r · n l v s r ) + l = 1 L π f l · f l + g = 1 G t = 1 T Z ( γ g , P g , t , π n l , π s t , μ g , t )
The electricity system investment cost includes the annuitized capital cost of new-built generation, reinforcement cost of transmission, and distribution networks. The operational cost of the electricity system consists of the operation cost of the conventional generation, which is fossil fuel based as well as the no-load cost that is a function of the number of synchronized units and start-up cost and the fixed and variable O&M cost of all the units including RES. The total cost in the heating system, which includes the cost in the DHN and end-use heating appliances are formulated in Equations (2) and (3), respectively. The operational cost in the heat sector is mainly from the natural gas consumption of industrial and end-use natural gas boiler.
C h , h n = r = 1 R ( π h p r · n h p r + π n g b r · n n g b r + π h b r · n h b r + D ( D H r ) ) + r = 1 R t = 1 T γ n g b r · H n g b r , t
C h , e d = r = 1 R ( π e h p r · n e h p r + π e n g b r · n e n g b r + π e h b r · n e h b r ) + r = 1 R t = 1 T γ e n g b i · H e n g b i , t
District heating is supplied by industrial heat pumps (HPs), natural gas boilers (NGBs), and hydrogen boilers (HBs) and end-use heating appliances include air source heat pumps (ASHPs), end-use NGBs, and HBs. The total cost in the hydrogen system is formulated in Equation (4). The operational cost in the hydrogen system refers to the natural gas consumption of GHR.
C h 2 = i = 1 I ( π e l i · n e l i + π s m r i · n s m r i + π h s i · n h s i ) + i = 1 I t = 1 T γ s m r i · Q s m r i , t + l = 1 L π f h t l · f h t l
The investment of the hydrogen system cost includes the annuitized capital cost of the electrolyser, GHR-CCS, hydrogen storage, and the hydrogen transmission pipelines. The study assumes the cost of EV and HFCV is the same, and therefore, their costs can be omitted from the optimisation problem; the portfolio of EV and HFCV is optimised based on their system integration costs rather than by the vehicle’s capital cost. It is trivial to include different EV and HFCV costs in the objective function; at present, it is the interest of this paper to evaluate the competitiveness of these technologies on the basis of their system integration costs.
M i n   φ = C e + C h , h n + C h , e d + C h 2

2.3. Constraints

The proposed model is subject to several constraints in each energy system. Constraints associated with the electricity system include those in Equations (6)–(22). All constraints are applied to each time interval within the optimisation time horizon (1-year) ( t T ) for all regions and locations ( r R , i I ). Electricity supply and demand are balanced in each time interval (Equation (6)). The electricity demand includes non-heat demand, the demand of HPs, and the electricity consumption of electrolysis and EV. DC power flow model Equation (7) is applied to determine power flows in the electricity network. The production of all the generating units is within their installed capacity including renewable energy units (Equations (8) and (9)). The change in the generation of a thermal unit within a single time interval is limited by its ramping capacity (Equations (10) and (11)), and the number of units being synchronised is constrained in Equations (12)–(14).
g = 1 G P g , t = r = 1 R ( D E r , t + H h p r , t η h p + H e h p r , t η e h p r , t + Q e l r , t η e l + V e v r , t η e v )
( f l ¯ + f l ) F ( G , D , θ ) f l ¯ + f l
μ g , t · P _ g P g , t μ g , t · P ¯ g
μ g , t n g
P g , t P g , t 1 μ g , t · R g u p · Δ t
P g , t 1 P g , t μ g , t 1 · R g d o w n · Δ t
μ g , t μ g , t 1 = s t g , t d s t g , t
s t g , t n g μ g , t 1
d s t g , t μ g , t 1
The reinforcement cost of the electricity distribution network is expressed as a function of peak flow in the local distribution system [4], which are formulated in Equations (15) and (16). The concept of reverse power flow, meaning that due to high PV penetration, the net energy may flow in the opposite direction was also considered in this model (Equations (17) and (18)).
D E r , t + H h p r , t η h p + V e v r , t η e v + H e h p r , t η e h p r , t P h v p v r , t P l v p v r , t h v s ¯ r + h v s r
κ · D E r , t + V e v r , t η e v + H e h p r , t η e h p r , t P l v p v r , t l v s ¯ r + l v s r
P h v p v r , t + P l v p v r , t D E r , t H h p r , t η h p V e v r , t η e v H e h p r , t η e h p r , t σ h v · ( h v s ¯ r + h v s r )
P l v p v r , t κ · D E r , t V e v r , t η e v H e h p r , t η e h p r , t σ l v · ( l v s ¯ r + l v s r )
Frequency response and operating reserve are two balancing services considered in this model. The supplementary frequency response and operating reserve can also be provided by the heating sector (HP) and hydrogen sector (electrolyser) as well as the transport sector (EV). The system frequency response requirement is directly related to the level of system inertia [17], which can be treated as linear to the online synchronous capacity in each time period (Equations (19) and (20)). The operating reserve requirement is determined by the forecasting errors of electricity load and renewable energy generation (Equations (21) and (22)).
r s p g , t μ g , t · r s p ¯ g
r = 1 R ( r s p h p r , t + r s p e h p r , t + r s p e l r , t + r s p e v r , t ) + g = 1 G r s p g , t S F ¯ t
r e s g , t μ g , t · r e s ¯ g
r = 1 R ( r e s h p r , t + r e s e h p r , t + r e s e l r , t ) + g = 1 G r e s g , t S R ¯ t
Heating demand is supplied by either DHN or end-use appliances (Equations (23)–(28)). The industrial-sized HPs, NGBs, and HBs are deployed on the heat network for district heating. All the appliances were also used as end-use heating appliances. Hybrid electric HPs and natural gas boilers (Hybrid HP-NGBs) have been proven to have a significant overall economic advantage over other individual heat devices like HP-only and DHN [5]. With the presence of HBs, the hybrid HPs and HBs (Hybrid HP-HBs) can be another heating strategy.
H d h n r , t + H e d u r , t = D H r , t
H d h n r , t = H h p r , t + H n g b r , t + H h b r , t
H e d u r , t = H e h p r , t + H e n g b r , t + H e h b r , t
H d h n r , t = λ d h n · D H r , t
H e d u r , t = λ e d u · D H r , t
λ d h n + λ e d u = 1
Similarly, the transport demand is supplied by electric vehicles (EVs) and hydrogen fuel cell vehicles (HFCVs) (Equations (29)–(31)). EVs are modelled as flexible loads that can provide a demand-side response (DSR). Constraints (32) and (33) describe the demand reduction and the energy balance for demand shifting.
V e v r , t = λ e v r · D T r , t + d r , t + d r , t
V h f c v r , t = λ h f c v r · D T r , t
λ e v r + λ h f c v r = 1
d r , t ε · D T r , t
t D d r , t = t D d r , t +
The hydrogen system in this model considers the hydrogen supply chain from production to end-users via hydrogen storage, transmission, and distribution. Currently, the national gas transmission system and the local gas distribution system in the UK are constructed primarily from carbon steel. The unprotected iron and carbon steel pipelines suffer from embrittlement due to the diffusion of hydrogen into the material, which results in a reduction of structural integrity and can potentially cause the fracture. Therefore, these materials are not suitable for hydrogen networks [18]. The model assumes new hydrogen transmission through pipelines is needed in addition to the existing transmission gas pipelines. At the distribution level, the government-sponsored Iron Mains Replacement Programme is expected to convert a majority of the current natural gas distribution network to polyethylene pipes that are hydrogen tolerant by 2030 [19,20]. As the upgrade of the gas distribution network will occur in all scenarios, we assumed in this study that the local natural gas distribution systems will be compatible with hydrogen use by 2050 and the upgrade cost of gas distribution was excluded from the model. The hydrogen energy balancing is formulated in Equation (34). The hydrogen storage model is formulated by Equations (35)–(38). The hydrogen transmission capacity is optimised by using the transportation model [21]. The output of all the technologies is limited by its own capacity. To save the length of the article, these are not listed in the paper.
i = 1 I ( Q e l i , t + Q s m r i , t + S H i , t S H i , t + ) = g I i P h 2 g , t η h 2 g + r = 1 R ( H h b r , t η h b + H e h b r , t η e h b + V h f c v r , t η h f c v )
S H i , t + n h s i
S H i , t n h s i
S H S i , t n h s i · S H S T i
S H S i , t = S H S i , t 1 S H i , t + η h s · S H i , t +
The total direct carbon emissions of the whole system do not exceed the regulated amount of carbon emissions including electricity, heat, and hydrogen sectors. The carbon emission constraints are formulated as Equation (39).
t = 1 T g = 1 G P g , t · C g + t = 1 T r = 1 R ( H n g b r , t · C n g b + H e n g b r , t · C e n g b ) + t = 1 T i = 1 I Q s m r i , t · C s m r C T
The MILP problem defined in this section was implemented in the FICO Xpress optimisation tool [22] and solved by the Newton Barrier method.

3. Case Studies

3.1. System Description and Assumptions

The proposed integrated multi-energy systems model in Section 2 was applied to analyse and optimise the GB 2050 energy systems, with 30 Mt and 10 Mt carbon targets. The benefits of integrating hydrogen into energy systems were analysed. The study used a simplified GB transmission system representing five main regions: (1) Scotland (SCOT); (2) North England and Wales (EW-N); (3) Middle England and Wales (EW-M); (4) South England and Wales (EW-S); and (5) London (LON). Three neighbouring systems, Ireland (IE), Continental Europe (CE), and Norway (NOR) are connected with GB through finite interconnectors. The model also considers the investment and operation in IE and CE; this will enable the cross-border interactions to be modelled more accurately. The topology of the simplified network together with the length and transmission capacity is illustrated in Figure 2.
The cost and operation data for different types of electricity generation are listed in Table 1 [2,23]. We assumed that the cost of hydrogen-fuelled generation (H2-CCGT, H2-OCGT) is 1.2 times that of the conventional CCGT and OCGT based on the parameters in [24]. The data on heating and hydrogen technologies are listed in Table 2 and Table 3, respectively [2,25]. Other assumptions on the costs or operational parameters are omitted here for brevity.
In order to quantify the economic benefit of integrating a hydrogen system with different hydrogen production technologies, the whole system costs of four different scenarios were compared under different carbon targets. The four scenarios are described as follows:
1)
REF: This is the counterfactual scenario assuming that there is no hydrogen integration across the whole energy system.
2)
P2G: Hydrogen is integrated into the energy system, which is produced only by the P2G process (i.e., electrolyser).
3)
G2G: Similar to Equation (2), but hydrogen is produced only by G2G process (i.e., GHR-CCS).
4)
OPT: The model was used to optimise the capacity of different hydrogen production processes (G2G and P2G).

3.2. The Economic Benefit of Hydrogen Integration

This section compares the economic performance of P2G, G2G, and OPT by comparing the costs against the costs of the counterfactual scenario (REF). 
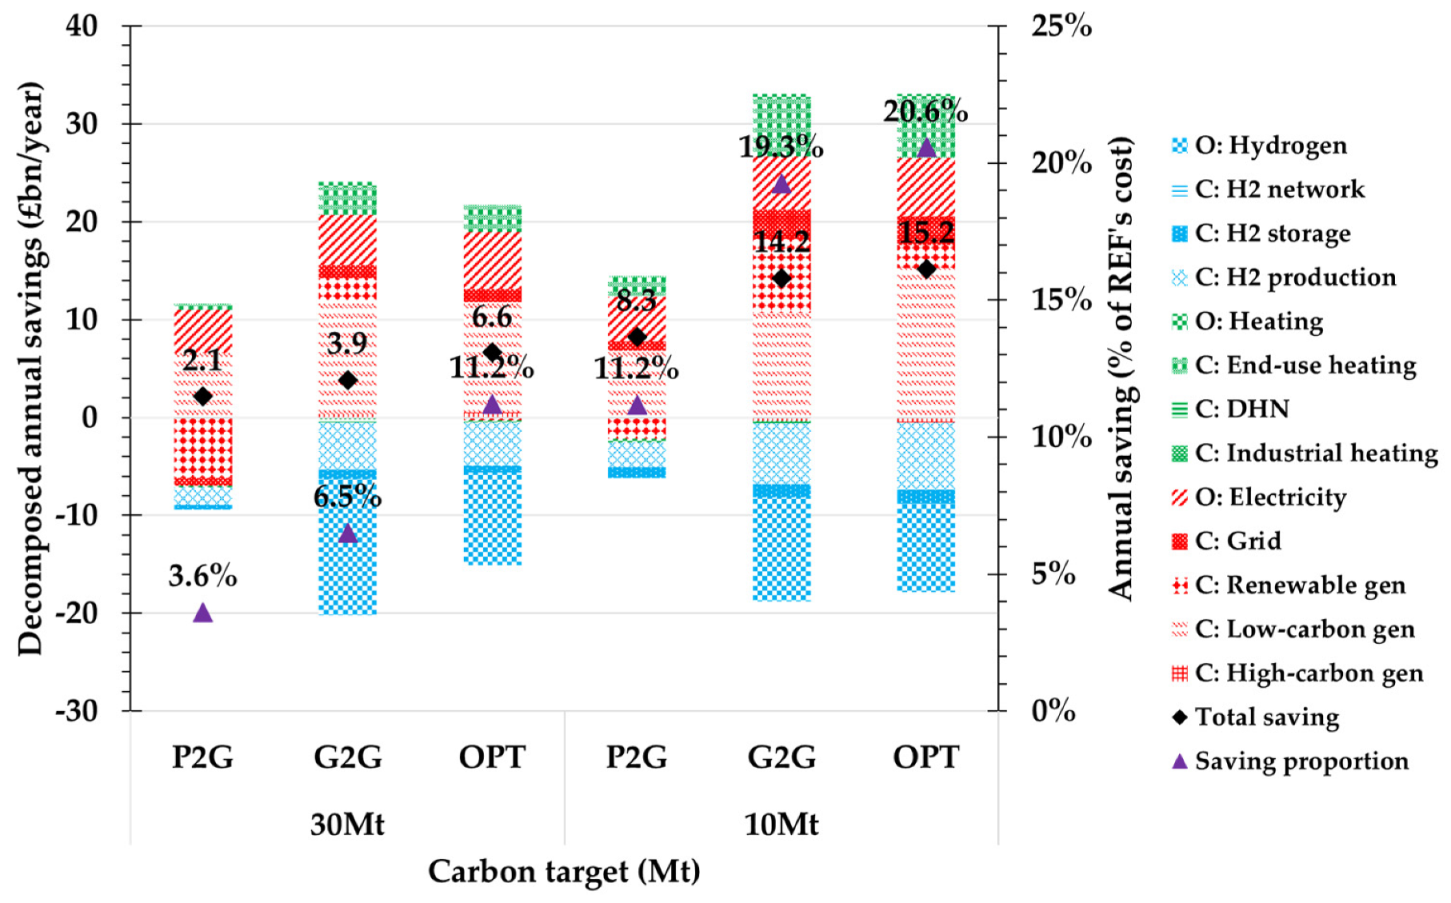
Figure 3 shows the whole system cost savings for each scenario under two different carbon targets. The G2G process was identified as the most cost-effective hydrogen production technology under the carbon target 30 Mt, which can reduce the cost by £3.9 bn/year (6.5%). The P2G scenario can bring £2.1 bn/year (3.8%) cost-savings. The OPT scenario brings further cost savings up to £6.6 bn/year (11.2%) by optimally combining the portfolio of hydrogen production technologies. In the heating sector, the use of hybrid heating technology (hybrid HP-HBs), which is based on the use of high COP (coefficient of performance) HPs, to supply the baseload of heat demand while providing the flexibility to use hydrogen to supply peak demand or when there is scarcity in the low-carbon electricity generation output.
The flexibility provided by the hydrogen system can reduce the total power generation capacity requirement from 71 GW to 53 GW in the G2G scenario and reduce electricity operation costs by £5.1 bn/year under a 30 Mt carbon target. Integration of hydrogen also allows hydrogen-fuelled power generation to displace higher cost low-carbon technologies such as nuclear and CCS while supporting better integration of renewables by providing flexibility and balancing fluctuating renewable energy in the system. It is worth noting that under the P2G scenarios, the investment in renewable energy, especially wind power, has increased significantly due to the P2G facilities, which can help integrate renewable energy, as its power consumption can be adjusted to follow the renewable generation. The excess of renewable energy can be stored cost-effectively and used when the output of the renewable is low.
Most of the benefits gained in the heat sector through the deployment of HB is driven by the reduced investment in the end-use heating appliances and industrial heating appliances under 30 Mt and 10 Mt carbon targets, respectively, which also further achieved the cost savings in the distribution network reinforcement due to the peak demand reduction that was compensated by hydrogen-based heat.
The increased cost of hydrogen integration is mainly from the hydrogen system, which is dominated by the operation cost of the hydrogen system in the G2G and OPT scenarios. The increased cost in the P2G scenarios mainly comes from the hydrogen production investment. The economic benefit of the integration of the hydrogen system is influenced by the carbon target. In the 10 Mt case, due to the zero-emission characteristics of the P2G process, it plays a more important role in the low-carbon scheme, and its economic benefits become stronger than the G2G process. However, the G2G process still has an economic advantage, especially saving on the investment of electricity infrastructure (e.g., generation and grid network). The annual saving of the OPT scenario under a carbon target of 10 Mt increased to 15.2 bn/year (20.6% of total cost in the REF scenario).

3.3. Impact of Hydrogen Integration on the Electricity System

The integration of hydrogen into the system makes the application of hydrogen fuel power generation (such as H2-CCGT and H2-OCGT) advantageous, thus reshaping the power system potentially, and using HB as the main low-carbon heat source reduces the electricity peak demand and the need for a new power system capacity compared with the system capacity needed if the heat is decarbonised through electrification only. This section compares the capacity and annual electricity generation mix between different cases under given carbon targets.
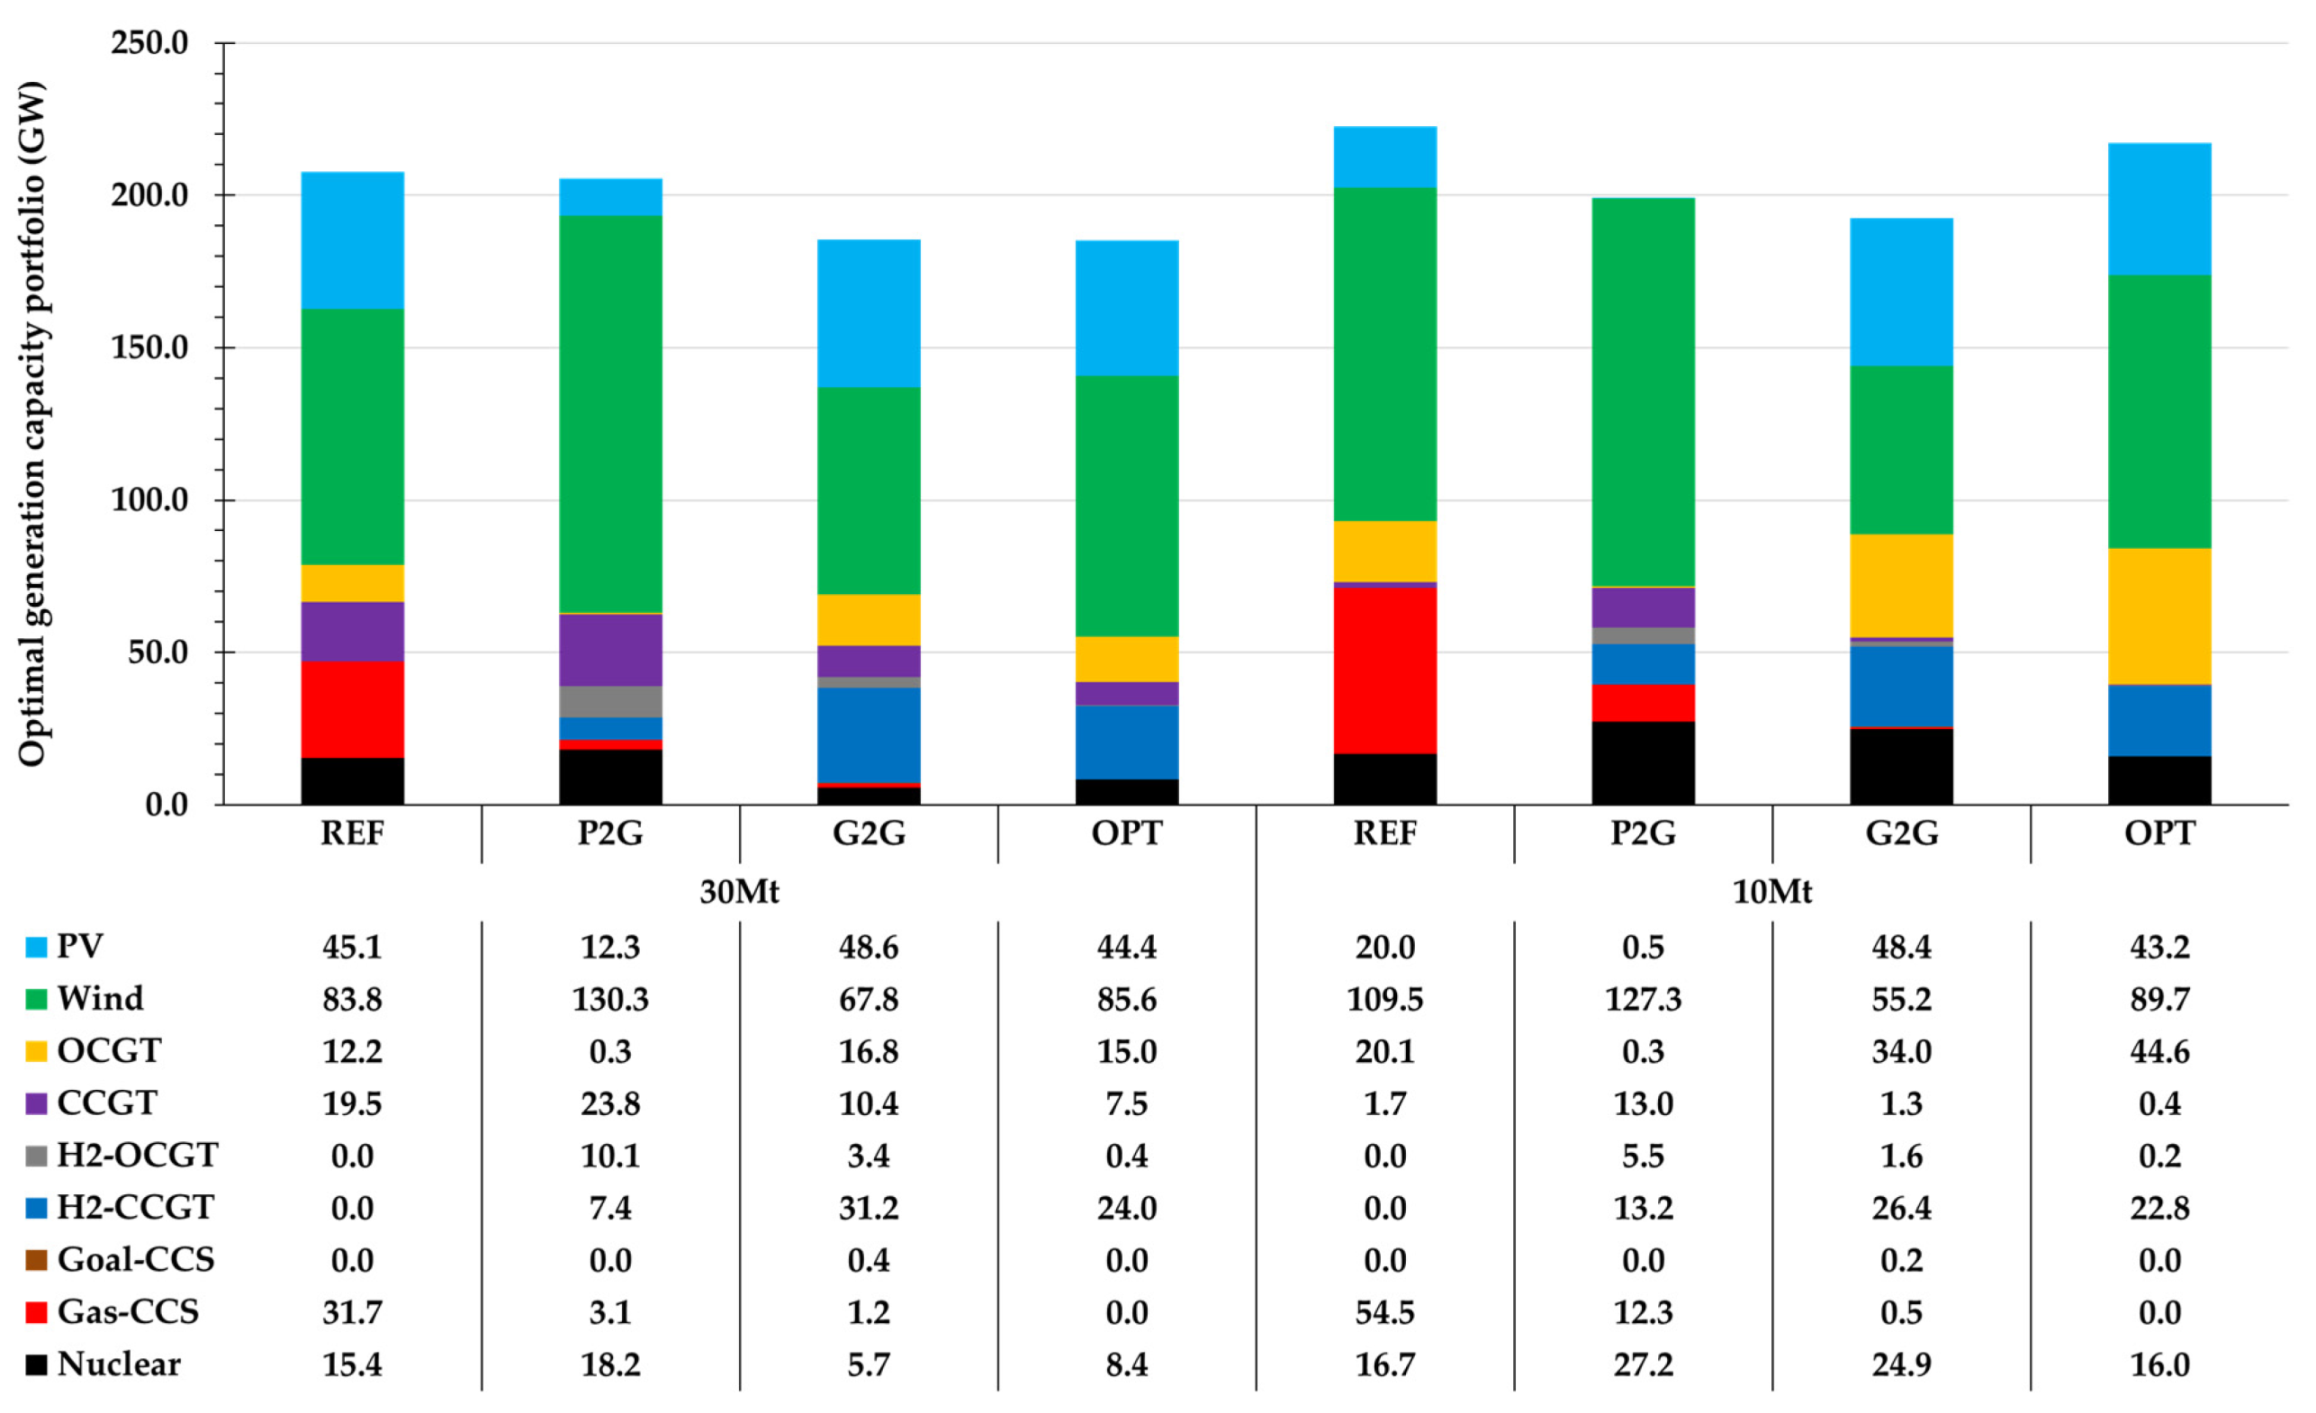
Figure 4 shows the portfolio of electricity generation capacity in each scenario. It can be observed that the G2G process can reduce the capacity requirement of electricity generation significantly (and other electricity infrastructure, e.g., network) compared to P2G. The choice of hydrogen production pathway will have significant implications for the electricity system. A large part of the low-carbon generation is replaced by the hydrogen-fuelled generation because sufficient flexibility can be provided from the hydrogen-fuelled generation without carbon emission, a more expensive source of flexibility like gas-ccs is not necessary. The high-carbon generation capacity reduction is driven by the enhanced flexibility and presence of hydrogen-fuelled generation. P2G can significantly promote the integration of wind power as the electrolyser can absorb excess wind power, which improves the wind power utilisation. The availability of firm low carbon generation such as nuclear is more critical for energy system decarbonisation under a more demanding carbon target. It is worth emphasising that the carbon emissions from the G2G process limit the large-scale deployment of hydrogen-fuelled generation in the electricity system.
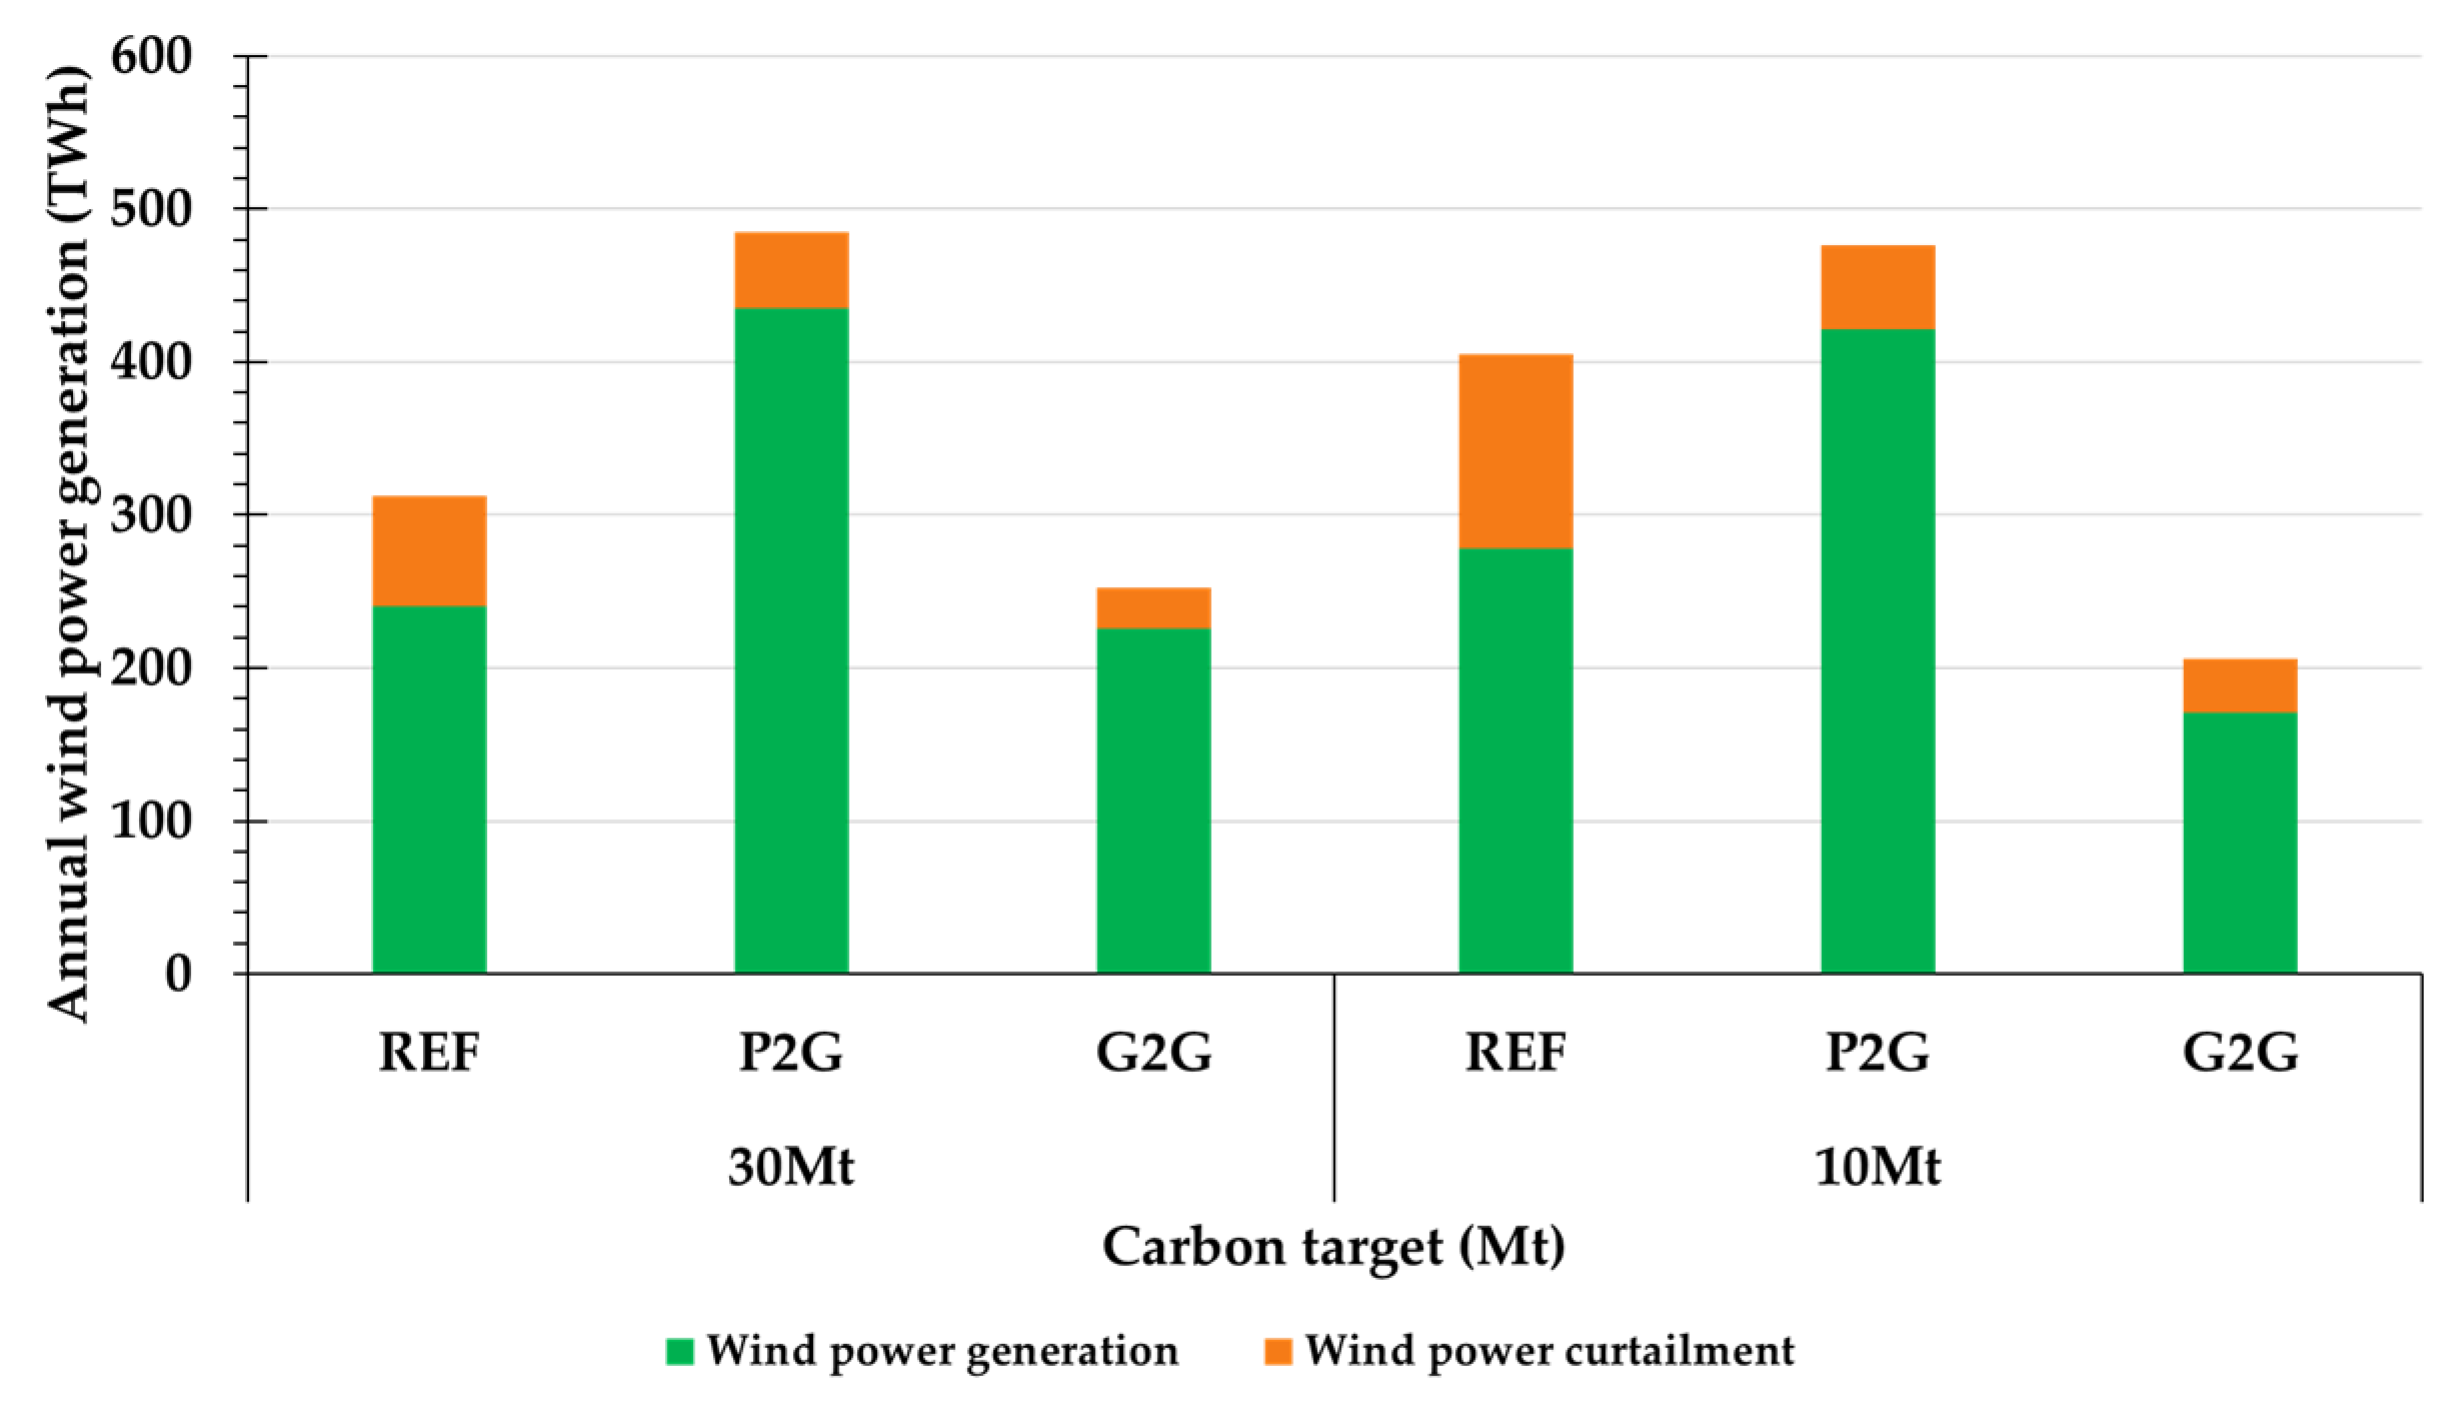
Figure 5 shows the portfolio of annual electricity production in each scenario, where the annual wind power generation in the REF cases were 240 TWh and 278 TWh under 30 Mt and 10 Mt carbon targets, respectively. It can be observed that the annual wind power generation in the P2G cases increased to 435 TWh and 421 TWh, which were 67% and 61% of total generation under the 30 Mt and 10 Mt carbon targets, respectively. The increased system ability to integrate wind is driven by the use of the P2G facility, which allows the excess renewable energy to be stored cost-effectively via hydrogen storage, thus reducing the curtailment rate of wind and solar power. The difference in the annual generation mix is further reflected by the increased generation of nuclear power in the G2G cases compared with the P2G cases, where the nuclear power generation in the G2G cases is notably higher than in the case of P2G as well as its capacity. The main reason is that the G2G facility cannot help integrating more renewable energy, and it will give priority to nuclear power as low-carbon power generation. Meanwhile, the relatively high carbon emission of GHR increases the integration costs of a hydrogen system under a 10 Mt carbon target. Thus, the installed capacity of hydrogen-fuelled generation and its production decrease.

3.4. Impact of Hydrogen Integration on the Heating System

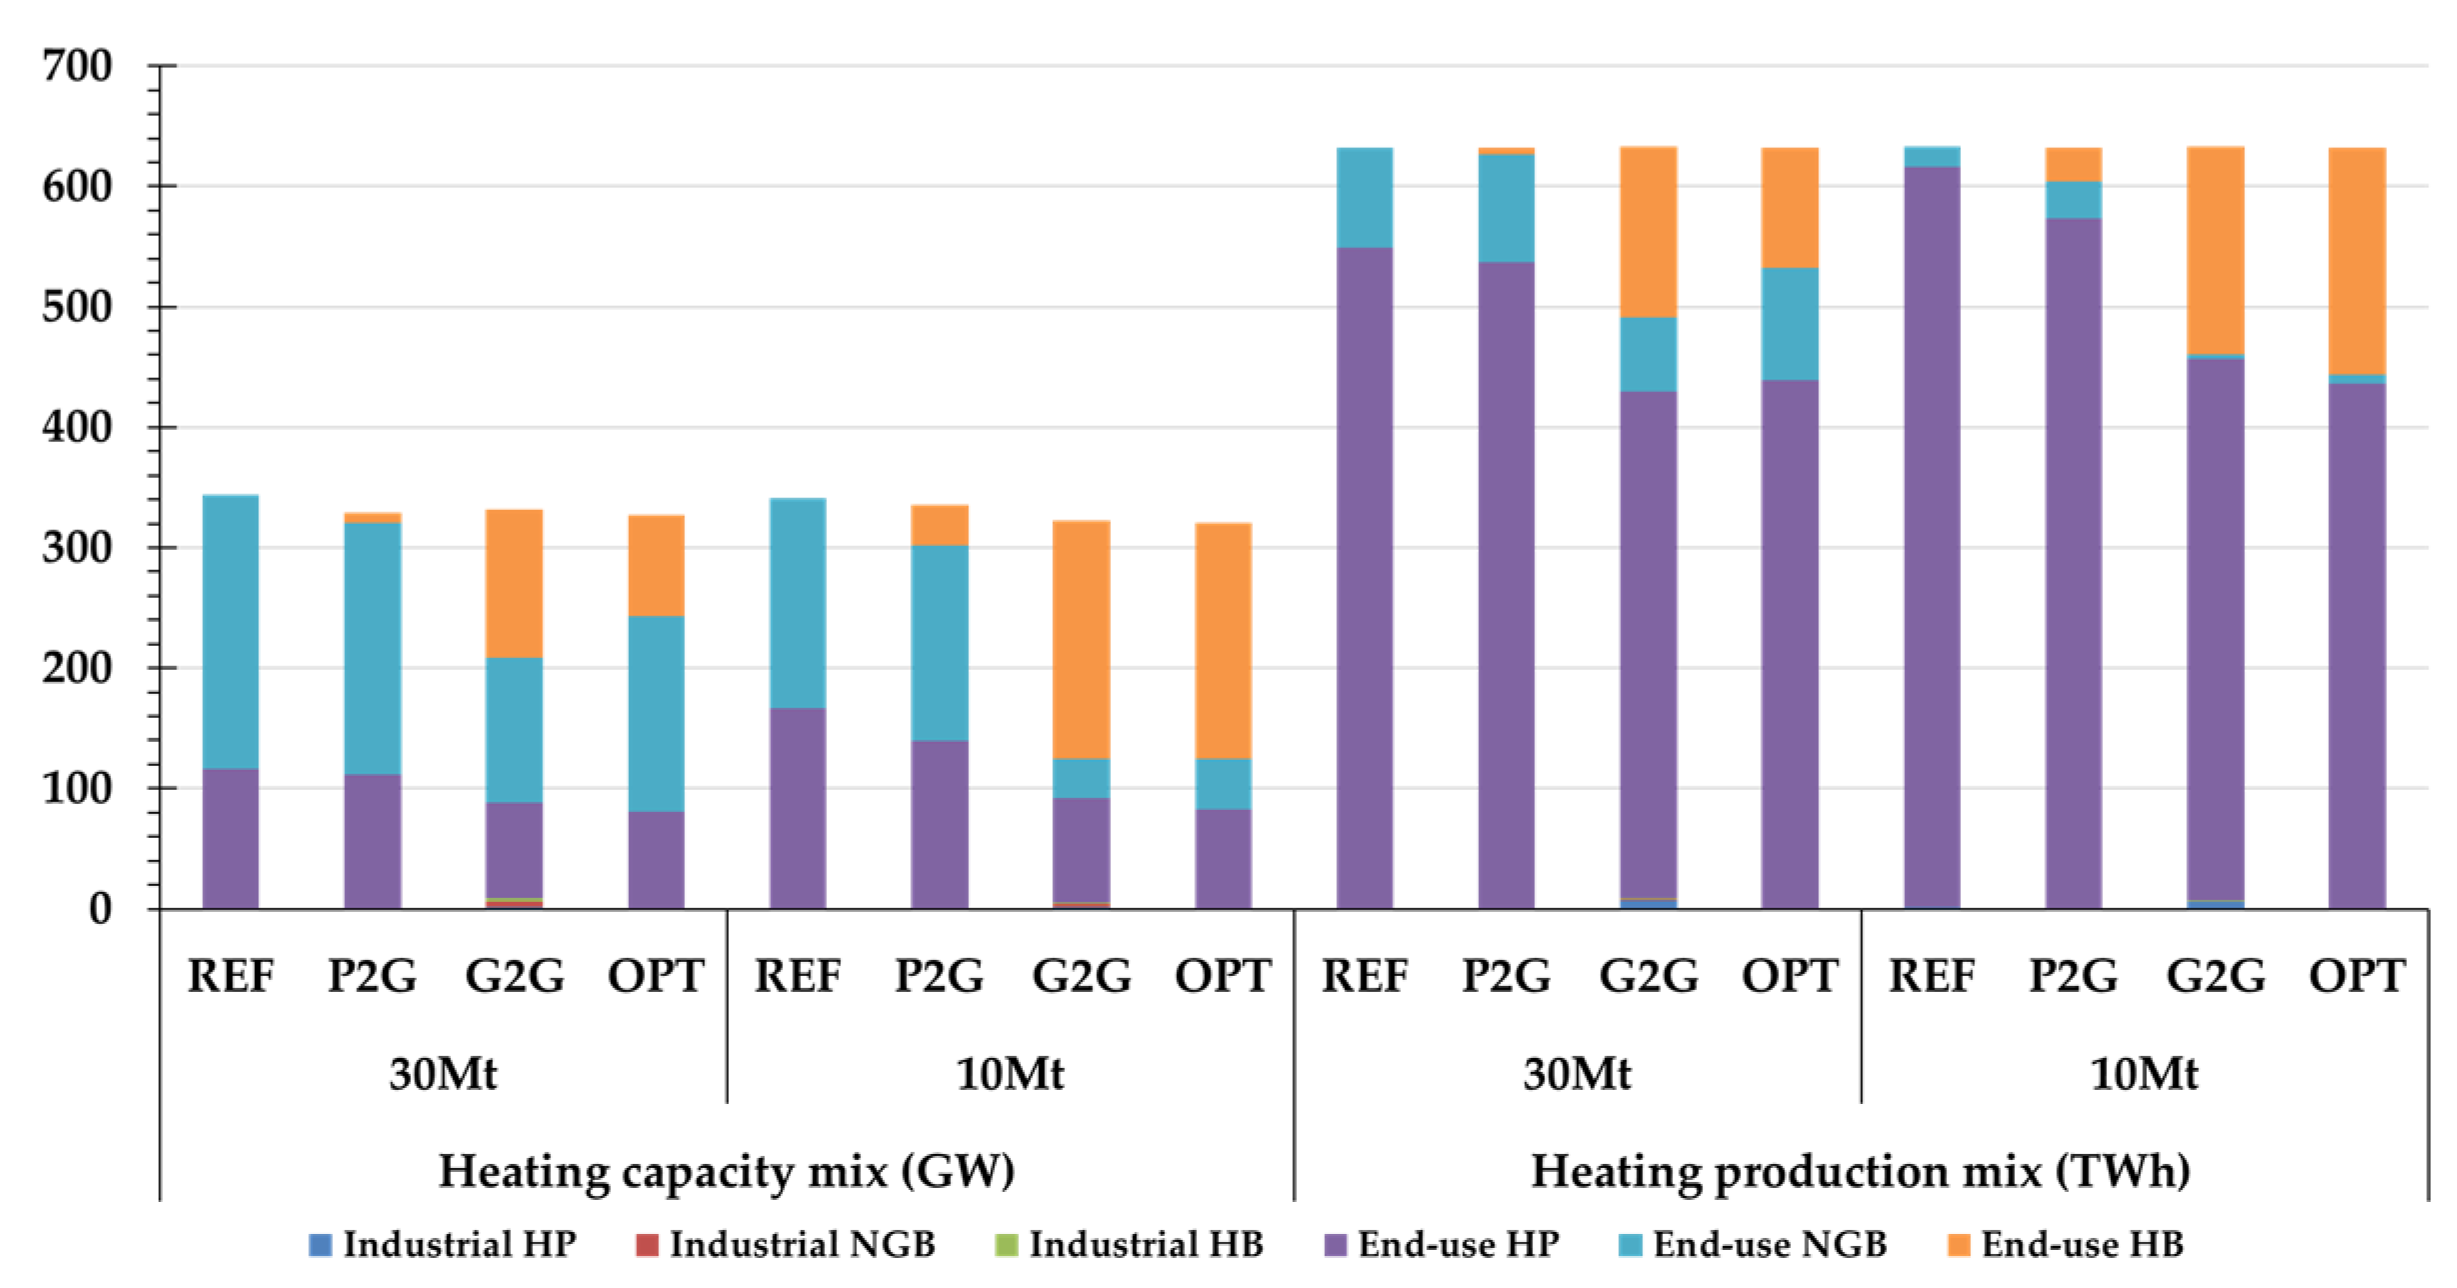
The mix of heating technology and annual heat production under different carbon targets are shown in Figure 5. The national DHN pathway only contributes a small part of heat demand in each scenario under both carbon targets due to the expenditure associated with the deployment of heat networks.
As shown in Figure 6, in a system with hydrogen, the heating pathway is shifted from end-use HP-NGB to end-use HP-HB, which drives less investment in the electricity sector as can be derived from Figure 4. It is worth noting that hybrid HP-HB can dominate the heating market, which is up to 73% in the OPT scenario when the carbon target becomes tighter (10 Mt).
Hydrogen integration also has a notable impact on the annual heat production mix. It can be observed that HP supplies the baseload while NGB only provides a little part of heat demand during the peak load due to its emissions and less flexibility when the hydrogen integration is not enabled, or its integration is not cost-effective (e.g., the P2G pathway). In the G2G case, the heat provided by HB increases to 23% and 27% under the 30 Mt and 10 Mt carbon targets, respectively. In the OPT scenario, the P2G process brings zero-emission hydrogen production, which offsets the carbon emissions from the G2G process and makes HB production increase further to 29% under a 10 Mt carbon target. Generally, the P2G process is necessary to offset the carbon emissions from the hydrogen system under a demanding carbon target.

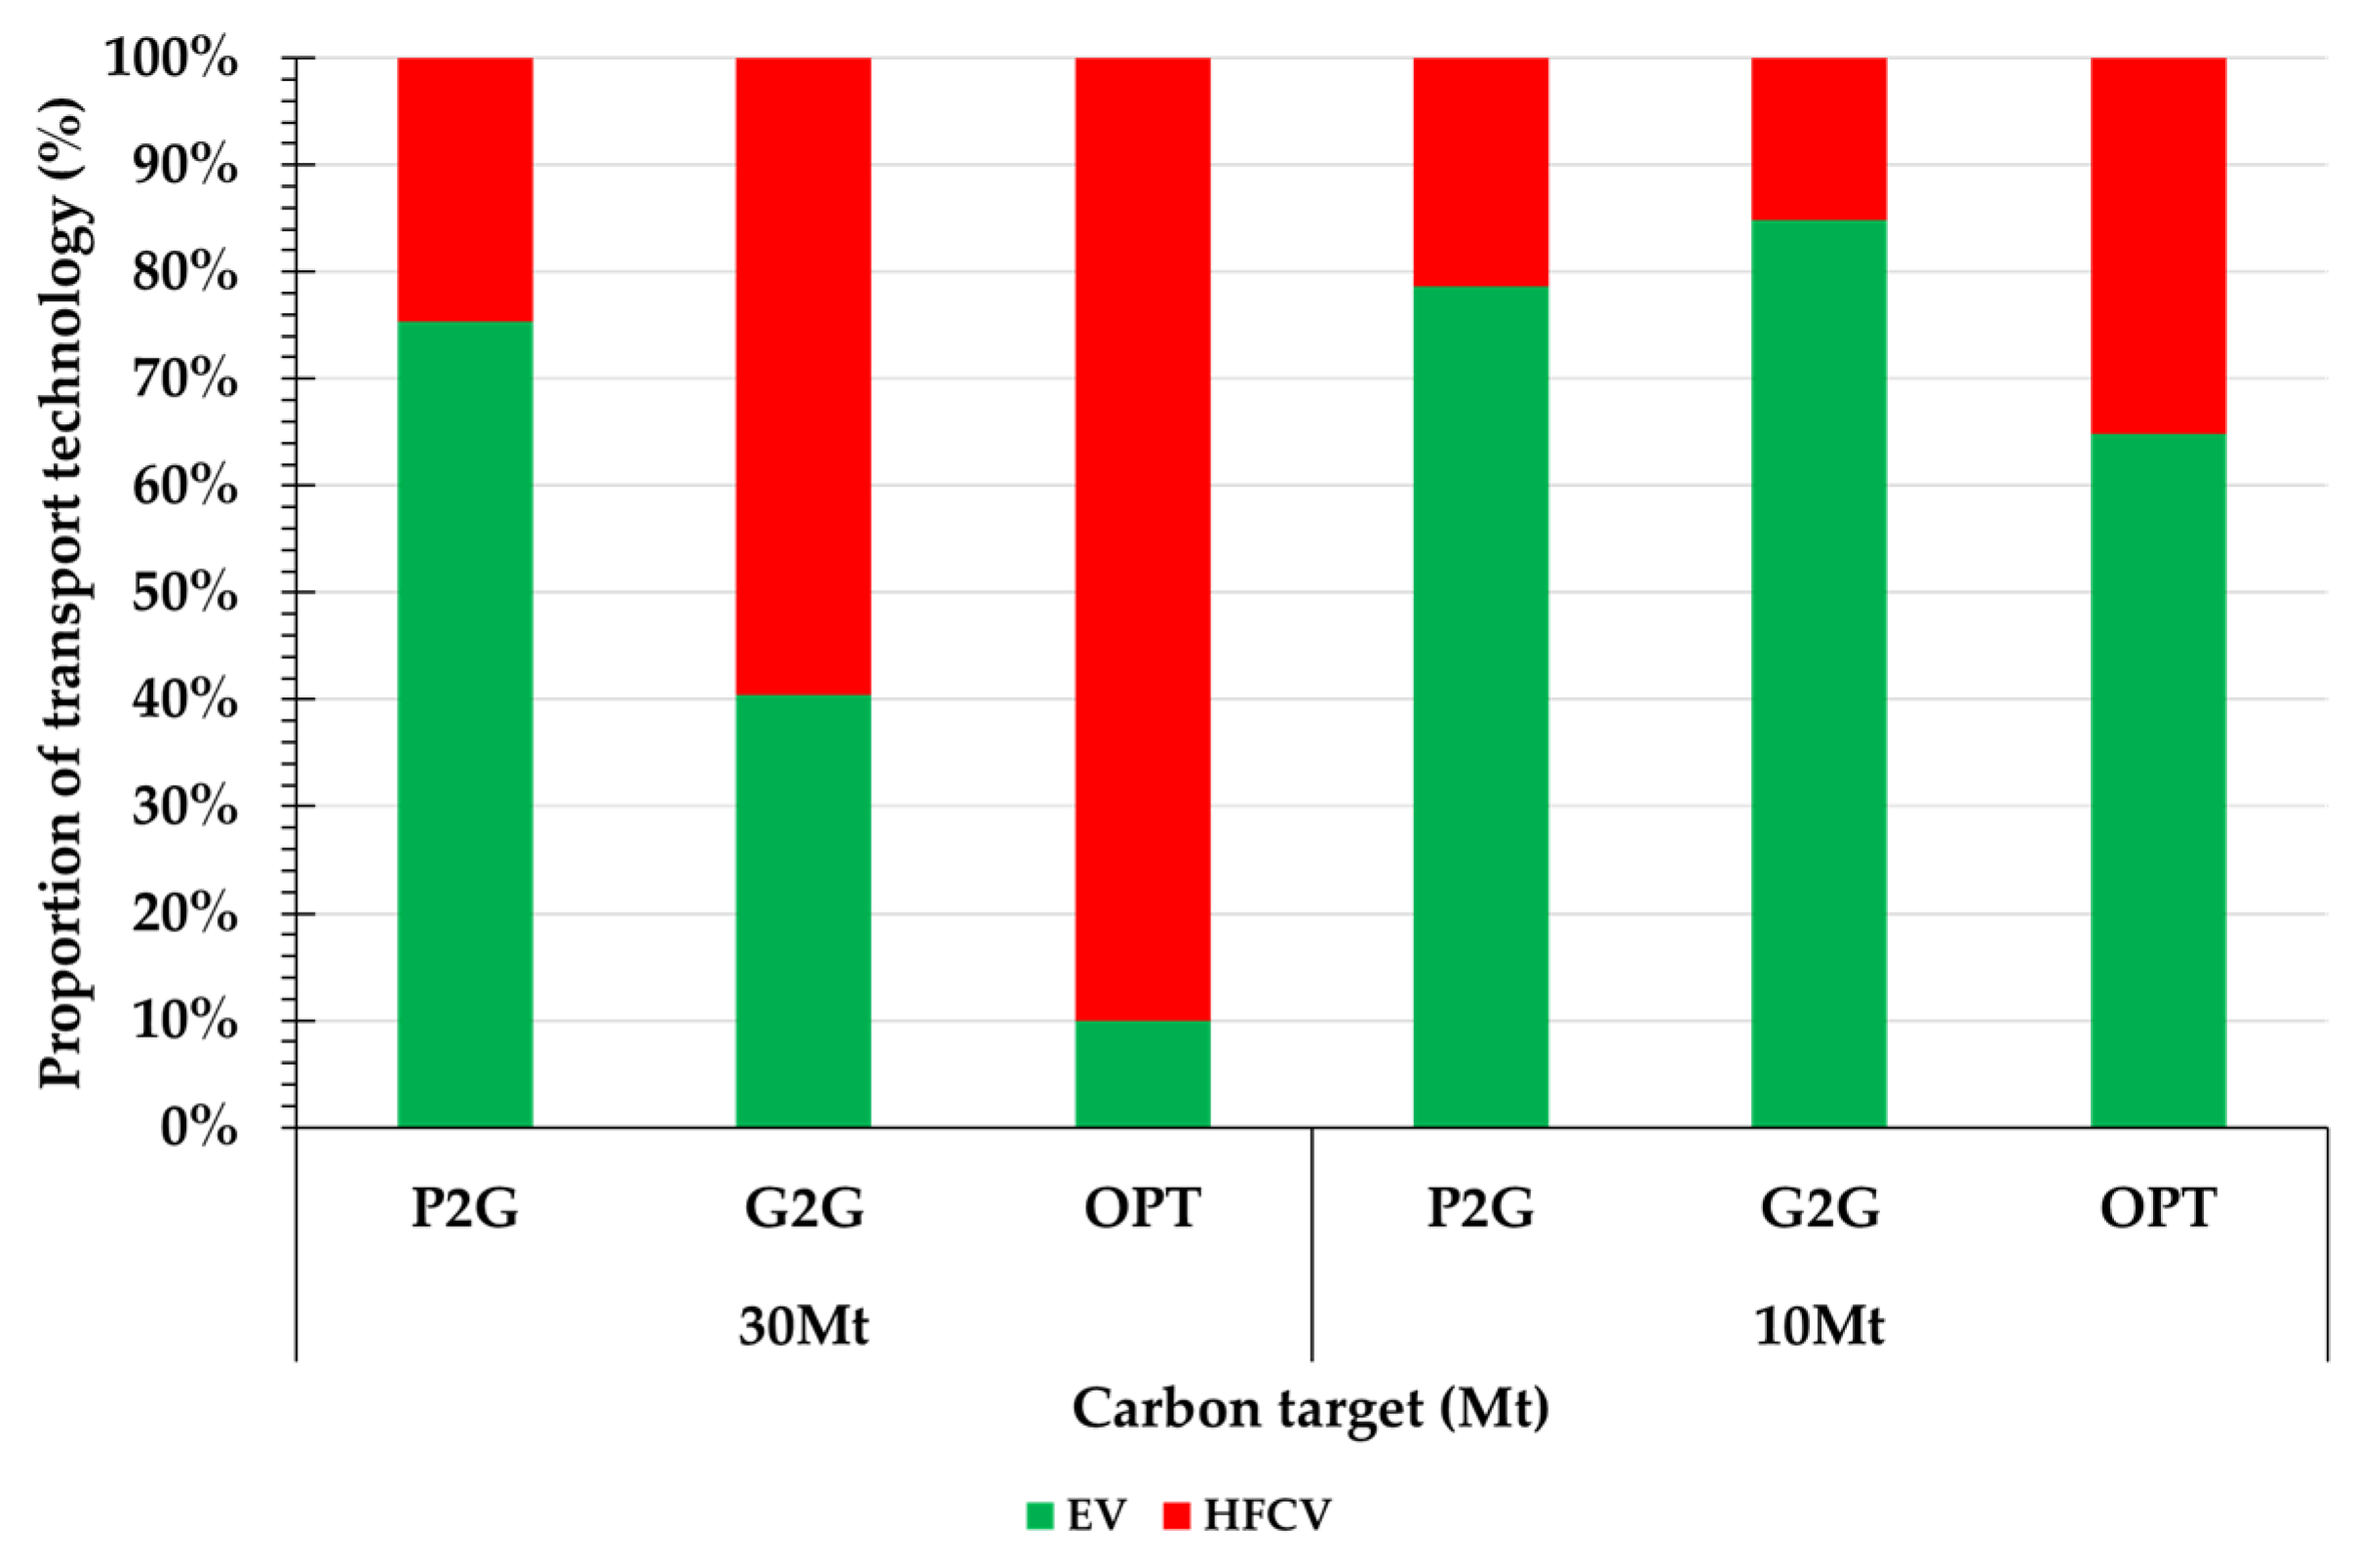
3.5. Impact of Hydrogen Integration on the Transport Sector

In this model, assume the efficiency of HFCV is 40% lower than EV [26]. Figure 7 shows the proportion of each transport technology in different scenarios under different carbon targets. When the carbon target is 30 Mt, in the P2G scenario, EV still accounts for the most market. If hydrogen production shifts from P2G to G2G or a combined pathway, the cost of hydrogen system integration will be reduced so that the hydrogen will become more competitive in the transport sector, which will allow HFCV to dominate the transport market. However, when the carbon target is tightened to 10 Mt, EV takes back the domination position due to the hydrogen production process, which is less competitive. Only through least-cost hydrogen production (OPT), can the HFCV occupy 35% of the market share. In summary, from the whole-system point of view, the deployment of HFCV is sensitive to the costs of hydrogen and lower costs of hydrogen drive investment in HFCV. Emission is another factor affecting the deployment of HFCV, and the P2G process is necessary for the development of HFCV due to its zero-emission feature. However, the capital cost of HFCV is still not competitive compared to the current EVs [27].

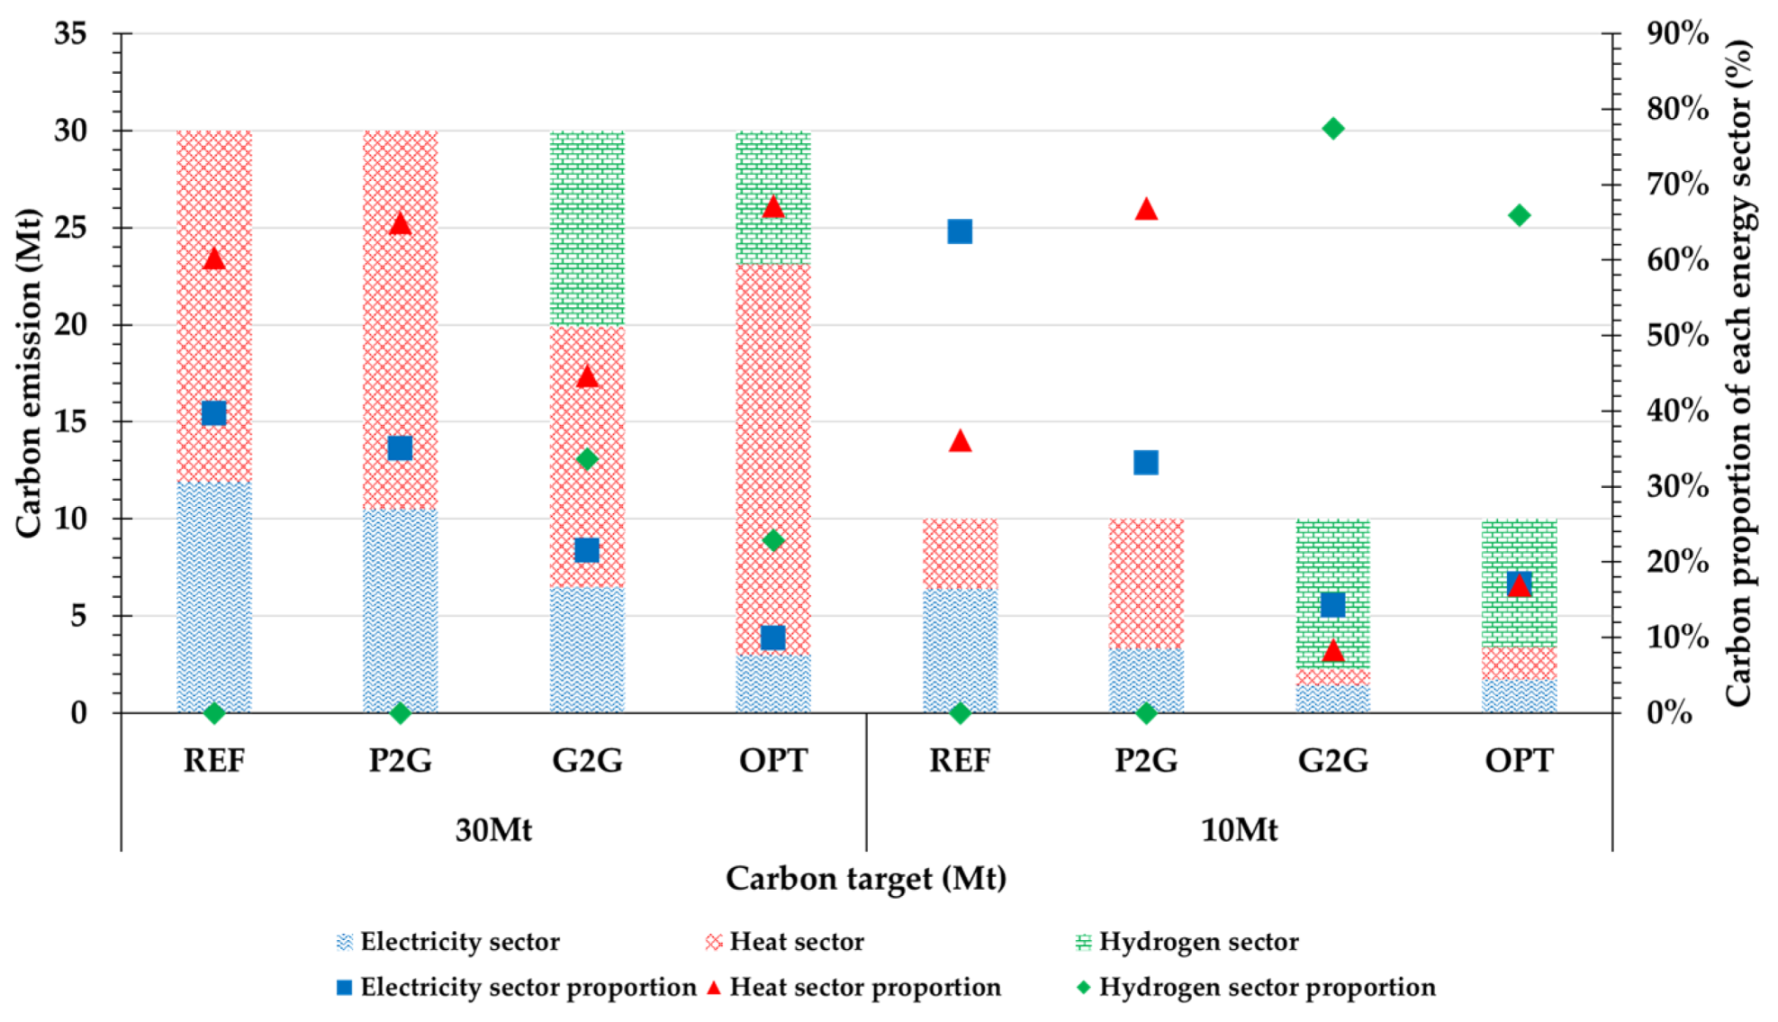
3.6. Impact of Hydrogen Integration on Carbon Emission

The integration of the hydrogen system will influence the decarbonisation strategies of other energy sectors. Figure 8 shows the total carbon emissions of each energy system in each scenario. The integration of the hydrogen system shifts the carbon emissions from the electricity system to other energy sectors in all the P2G, G2G, and OPT scenarios. Decarbonisation of the heat sector under a 30 Mt carbon target will require a higher integration of low-carbon heat supply technologies (HP and HB) and increased investment cost in the electricity and hydrogen sectors. When the carbon target is set strictly to 10 Mt, the high hydrogen integration cost of P2G also increases the cost of the decarbonisation in the electricity and heat sectors. When more economical hydrogen production methods (G2G and OPT) are adopted to produce hydrogen, the penetration of hydrogen in the electricity and heat sectors increases further, and the carbon emissions of the whole system mainly come from the hydrogen system due to a higher share of hydrogen-fuelled power generation, and HB replaces most of the NGB, as shown in Figure 4 and Figure 6, respectively. This case study indicates that hydrogen integration may shift the carbon emissions from the electricity and heat sector to the hydrogen system since it is more cost-effective to decarbonise the energy through hydrogen. It is worth noting that the carbon emissions of the heat sector are far lower than the other energy sectors in the G2G and OPT scenario with the 10 Mt carbon target due to the massive deployment of HB, indicating that the hydrogen integration will play an important role in the cost-effective transition towards a zero-carbon future energy system.

3.7. Hydrogen Production Technologies Deployment

The deployment of an electrolyser requires more electricity system investment, which increases the 34.4 GW and 52.1 GW peak demand under 30 Mt and 10 Mt carbon targets in the P2G scenario, respectively. From Table 4, it can be observed that GHR-CCS dominated the hydrogen production technology due to the economic advantages of GHR as mentioned in the above case. However, the capacity of the electrolyser increases when the carbon target becomes stricter because of its zero-carbon emissions feature. In terms of the annual hydrogen production, when the carbon target changes from 30 Mt to 10 MT, the annual hydrogen production of the electrolyser increases in all scenarios. In contrast, the annual hydrogen production of GHR-CCS decreases in the G2G scenario and the share of GHR-CCS decreases in the OPT scenario, mainly due to the need to meet a stricter carbon target.

3.8. The Relation between the P2G Facility and Wind Power

In this system, aside from P2G being able to absorb the excess wind power to integrate more wind power into the system, the P2G facility can also offer a flexible load, thus providing ancillary services like frequency response through the interrupted operation, which also increases the wind power integration potentially. So, as shown in Figure 9, P2G can promote the integration of wind power, and G2G plays the opposite role.

3.9. Sensitivity Studies

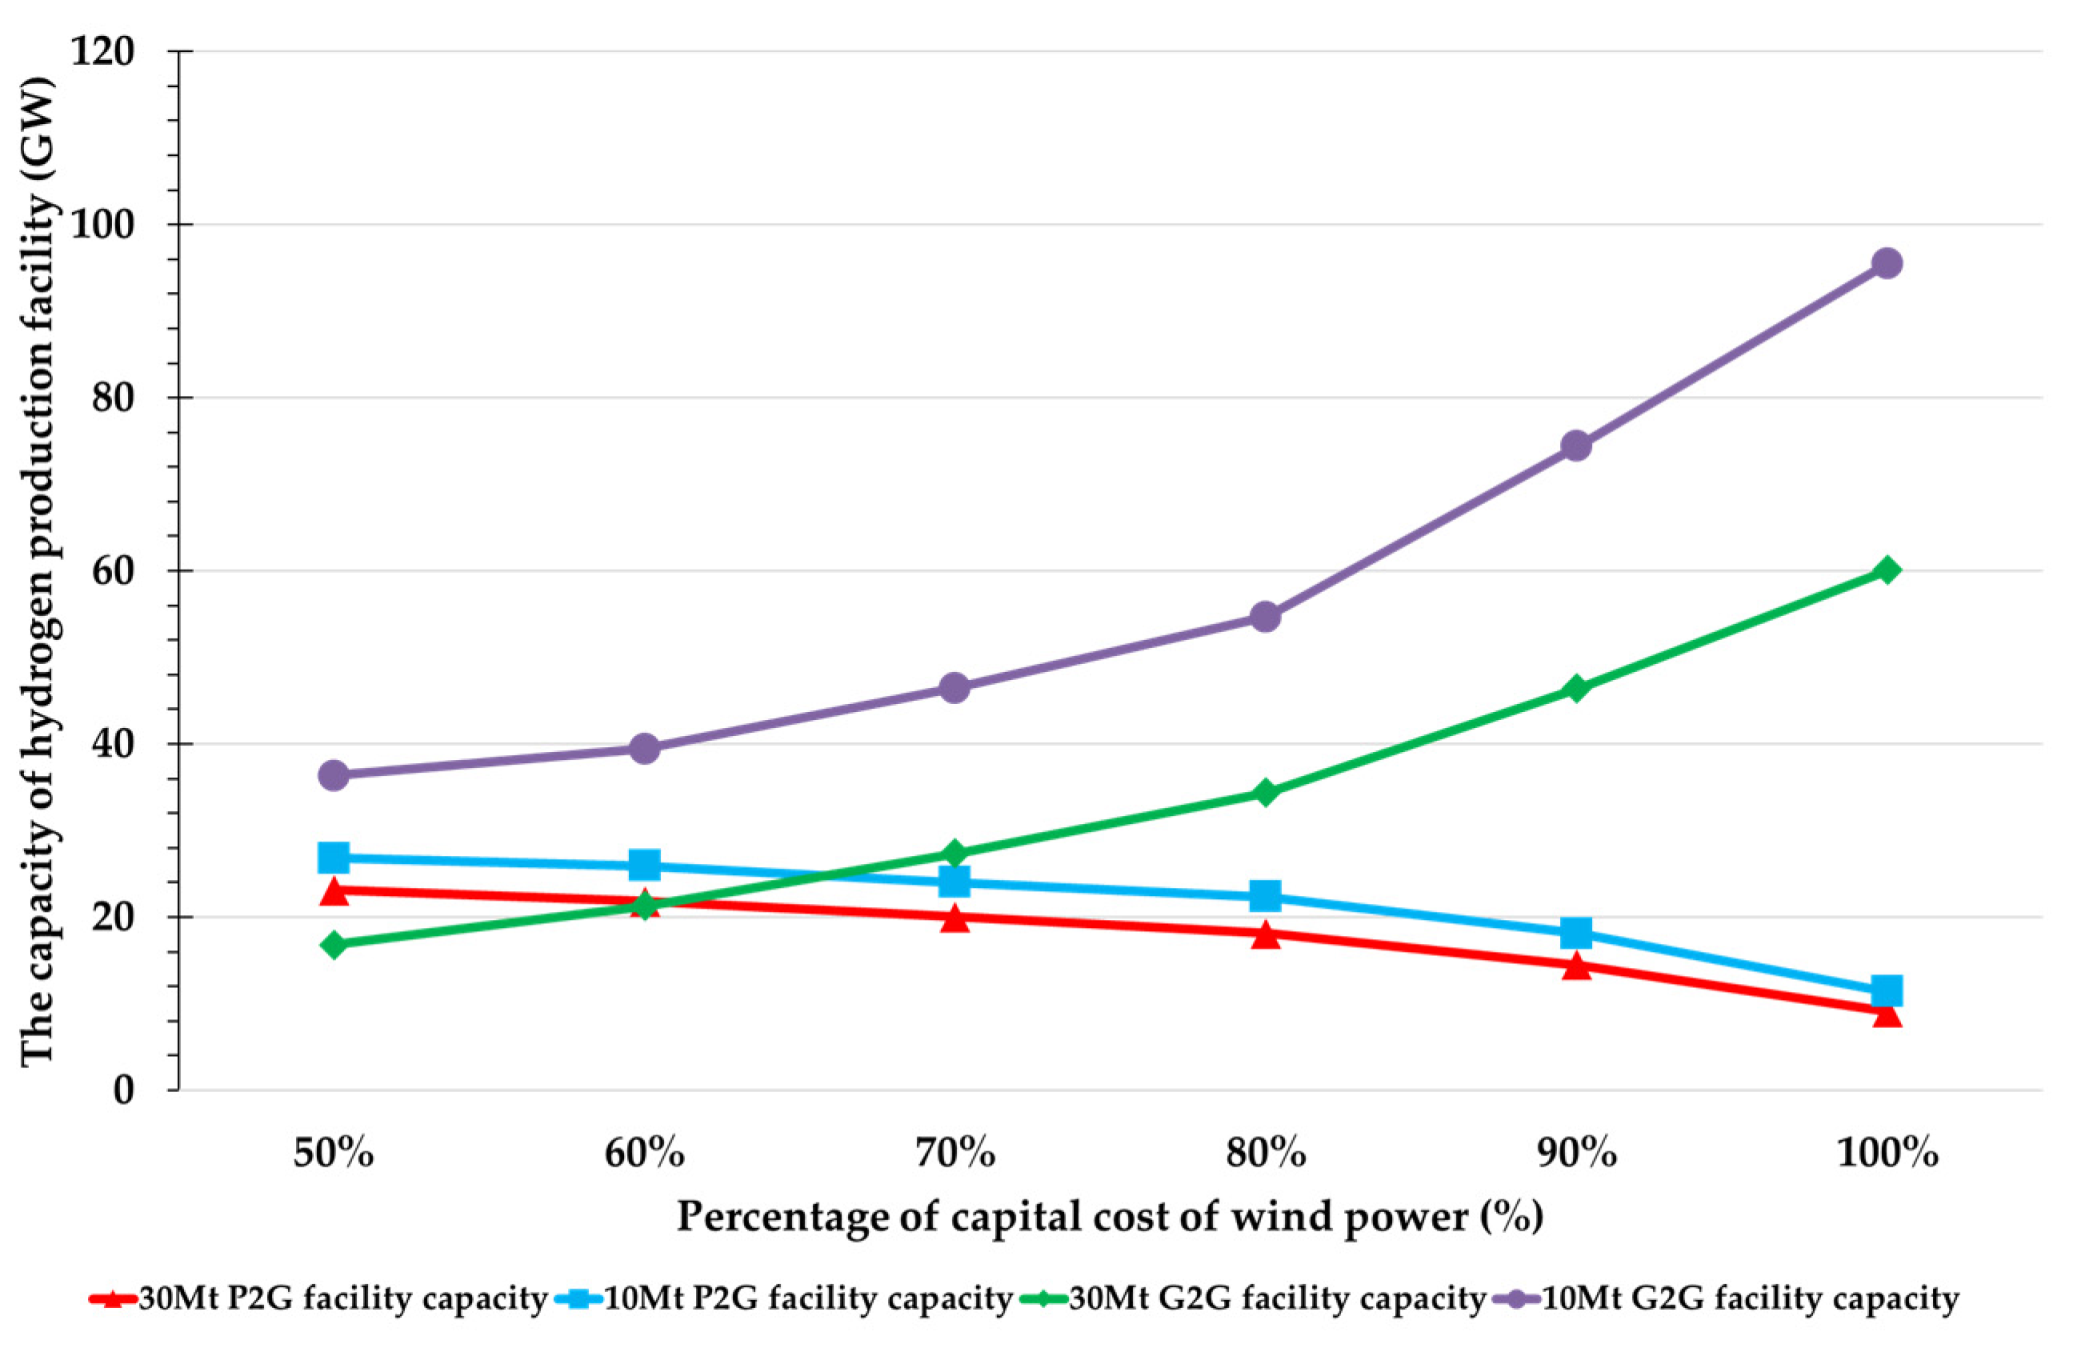
This section conducts sensitivity studies investigating the drivers for different hydrogen production technologies. The impact of two important drivers (i.e., the capital cost of wind power and natural gas price on the hydrogen production mixes) are investigated below.

3.9.1. Sensitivity Analysis of Wind Power Capital Cost

Figure 10 illustrates the wind power capacity and hydrogen production technology capacity mix in a series of wind power capital cost scenarios under the carbon targets of 30 Mt and 10 Mt. It can be observed that the competitiveness of the P2G facility is highly sensitive to the variation of wind power capital cost, while the penetration of the P2G facility is much more robust under the stricter carbon targets. In terms of G2G capacity, with the increase in capital costs of wind power, less wind power will be installed; consequently, the G2G capacity will need to increase to achieve the overall carbon target.

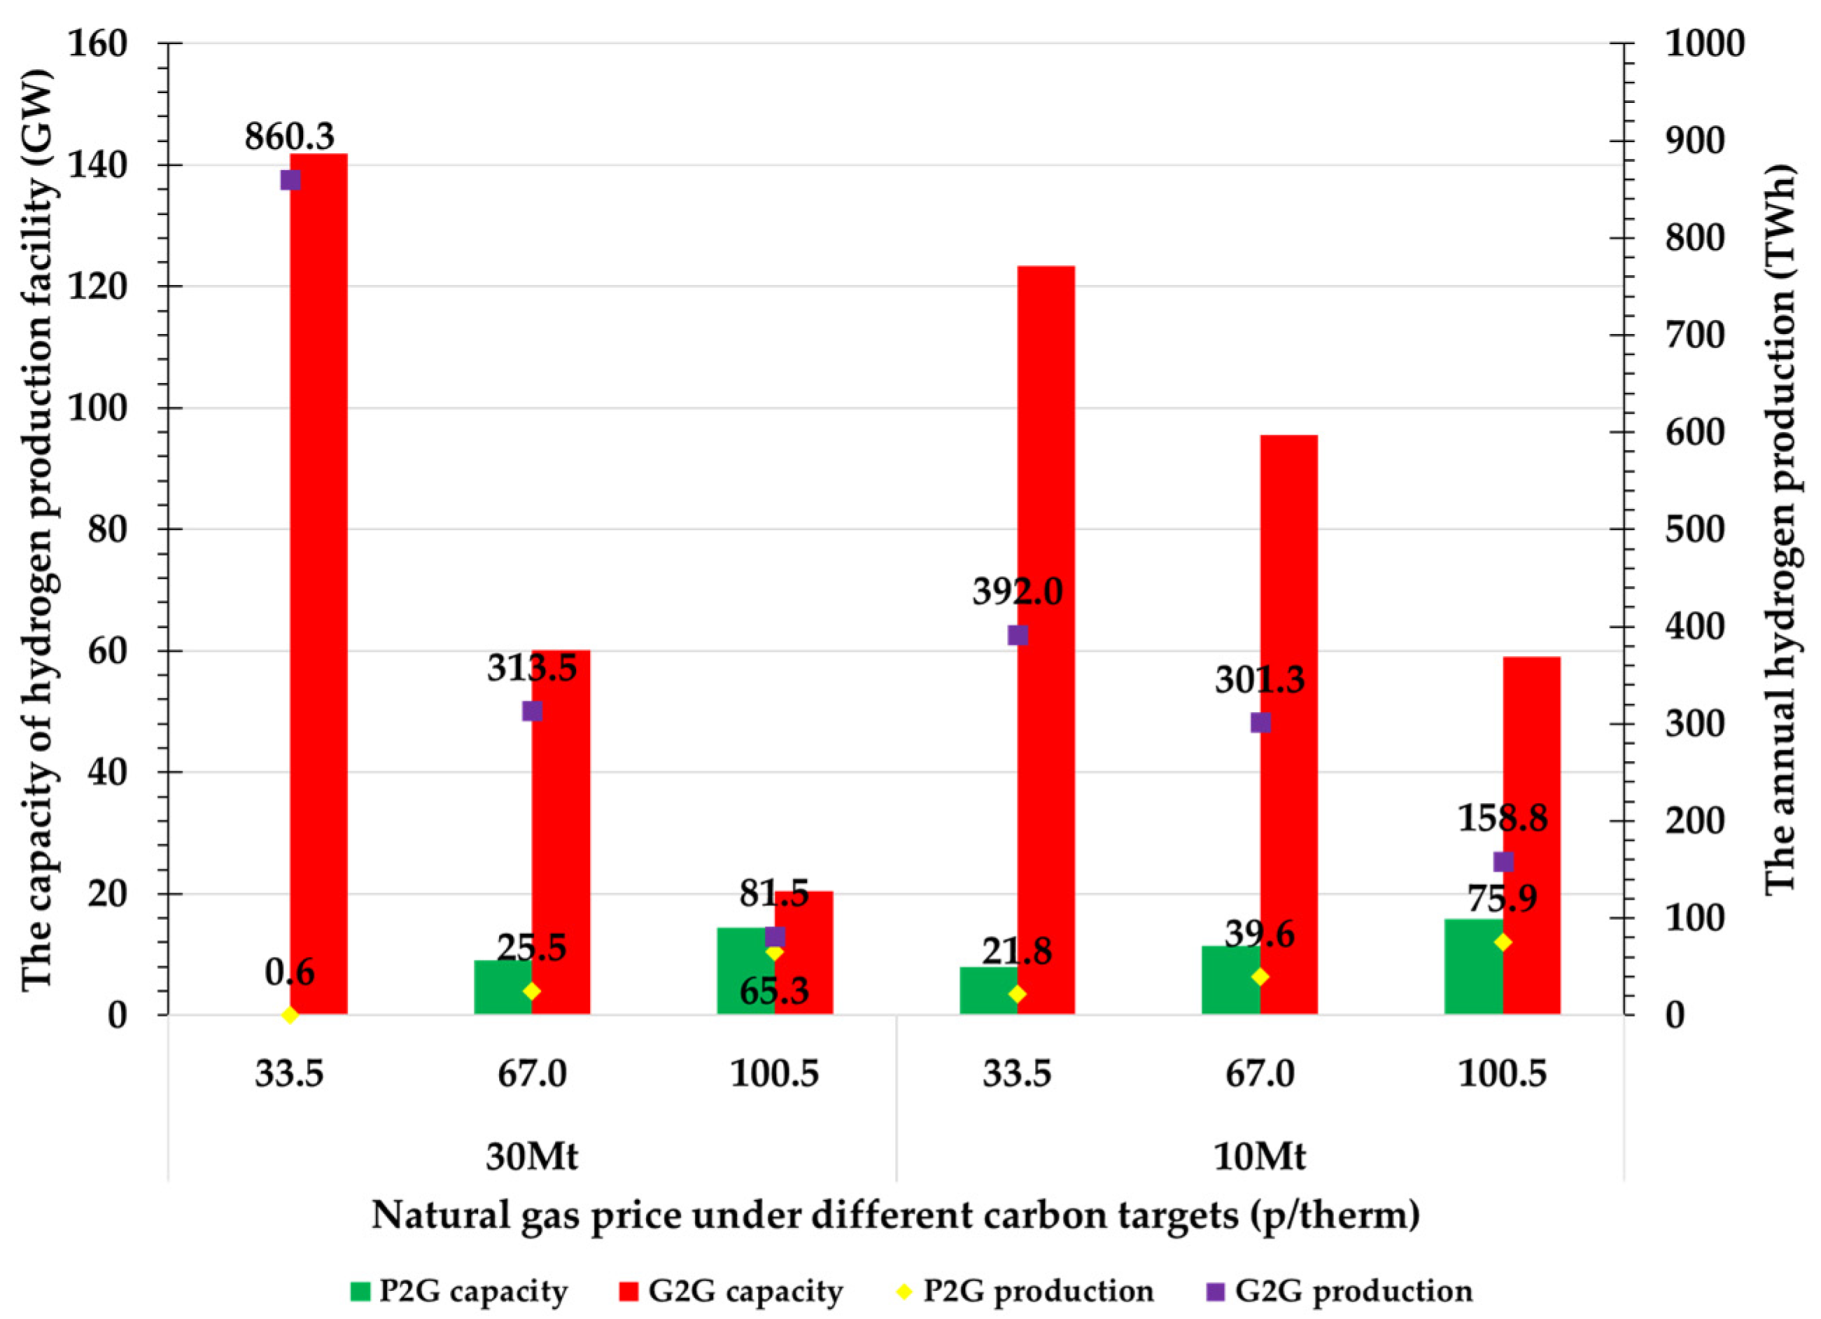
3.9.2. Sensitivity Analysis of Natural Gas Price

As mentioned before, the cost of large-scale hydrogen integration is dominated by the operation cost of the hydrogen system, which is highly sensitive to the natural gas price. The above case studies are based on the natural gas price of 67 p/therm. The G2G process has a dominating role in the integration of hydrogen in the OPT scenario. As shown in Figure 11, when the natural gas price drops by 50% to 33.5 p/therm, the overall integration cost of the G2G facilities will be reduced due to the decrease of the natural gas price, which will weaken the integration of P2G facilities. On the contrary, if the price of natural gas increases by 50% to 100.5 p/therm, the P2G’s zero-emission advantage will enable it to integrate more capacity than the G2G process under the 30 Mt carbon target. However, the capacity of G2G is still higher than that of P2G due to the higher demand for hydrogen integration under the 10 Mt carbon target. The G2G still has an economic advantage compared to P2G. In terms of hydrogen production, the rise of natural gas prices has significantly reduced the production of G2G, in contrast, the production of P2G is slowly rising, and exceeds that of G2G under the 30 Mt carbon target when the natural gas price is 100 p/therm.

4. Conclusions

This paper proposes an integrated electricity, heat, transport, and hydrogen energy systems model to investigate the impact of different hydrogen production technologies on multi-energy systems. The model was applied to optimise the decarbonisation strategies of the whole energy system while assessing the values of hydrogen integration. The studies demonstrate that hydrogen integration through the G2G process brings more economic benefits when compared to the P2G process, which can deliver £3.9 bn/year and £14.2 bn/year cost savings under the 30 Mt and 10 Mt carbon targets, respectively. The OPT pathway can offset the carbon emissions from the G2G process and achieve further cost savings. The results also clearly demonstrate the changes in the electricity side driven by the different hydrogen integration strategies. The G2G process can reduce the total power generation capacity requirement from 71 GW to 53 GW, and the P2G can increase the integration of wind power capacity from 83 GW to 130 GW under the 30 Mt carbon target. The integration of hydrogen will promote the deployment of HB, which, combined with HP, will dominate the heating market, which is up to 73% in the OPT scenario under the 10 Mt carbon target. From the perspective of the transport sector, the development of HFCV is highly related to the integration cost of the hydrogen system, especially in a demanding carbon scenario. The HFCVs can occupy 90% market share in the OPT scenario under a 30 Mt carbon target, however, when the carbon target becomes tighter (10 Mt), the integration cost of the hydrogen system increases, and the market share of HFCV will decrease to 35% in the OPT scenario. Finally, the series of sensitivity studies indicate that the integration of the P2G facility is highly sensitive to the wind power capital cost, and the G2G facility is highly sensitive to the natural gas price. The uncertainty in various costs will need to be taken into consideration when deciding the hydrogen production technologies.
It is worth mentioning that we only considered the direct carbon emissions of all the technologies during their energy production in this study. The indirect emissions generated during the equipment construction or energy transmission were ignored. The carbon emissions along the life cycle of the energy supply were investigated in [28,29]. Our future work will address this limitation, making carbon emission analysis more integrated.

Author Contributions

P.F. and D.P. developed the models used in the paper and conducted quantitative case studies and interpreted the results. X.Z. provided the technical data regarding the heat network and other parameters in the heating system and also gave valuable suggestions on the design of the case studies and analysis of the results. G.S. provided research guidance and led the drafting of the main conclusions. All authors have read and agreed to the published version of the manuscript.

Funding

The authors are grateful for the valuable support and funding received from the UK EPSRC IDLES project (reference: EP/R045518/1) and from the UK EPSRC The Active Building Centre (reference: EP/S016627/1). All contents and views expressed in this paper are the sole responsibility of the authors and do not necessarily express the views of the project consortia.

Conflicts of Interest

The authors declare no conflicts of interest.

Abbreviations

G2GGas-to-gas
CCSCarbon capture and storage
P2GPower-to-gas
GBGreat Britain
RESRenewable energy sources
CHPCombined heat and power
MILPMixed-integer linear programming
CAPEXCapital expenditures
OPEXOperative expenditures
GHR-CCSGas-heated reformers combined with carbon capture storage (GHR-CCS)
ELElectrolyser
H2SHydrogen storage
EVElectric vehicle
HFCVHydrogen fuel-cell vehicle
PVPhotovoltaics
HVHigh voltage
LVLow voltage
DHNDistrict heating network
IGBIndustrial natural gas boiler
IHPIndustrial heat pump
IHBIndustrial hydrogen boiler
HPEnd-use heat pump
NGBEnd-use natural gas boiler
HBEnd-use hydrogen boiler
HP-BHybrid end-use heat pump and natural gas boiler
HP-HBHybrid end-use heat pump and hydrogen boiler
HBEnd-use hydrogen boiler
COPCoefficient of performance
Notation
Sets
I Set of locations
R Set of regions
T Set of operating time intervals
D Set of operating days
G Set of conventional generators
P V Set of PV generation units
H V High voltage distribution network
L V Low voltage distribution network
L Set of transmission/interconnection corridors
D H N Set of district heating network
Functions
Z ( · ) Generation operating cost function
F ( · ) Power flow function
D ( · ) District heating network cost function
Parameters
Δ t Time interval (h)
π g Generation investment cost (£/GW/year)
π f Transmission network cost (£/GW/year)
π h v Electricity high-voltage distribution network cost (£/GW/year)
π l v Electricity low-voltage distribution network cost (£/GW/year)
π h p Industrial heat pump cost (£/GW/year)
π e h p End-use heat pump cost (£/GW/year)
π n g b Industrial natural gas boiler cost (£/GW/year)
π e n g b End-use natural gas boiler cost (£/GW/year)
π h b Industrial hydrogen boiler cost (£/GW/year)
π e h b End-use hydrogen boiler cost (£/GW/year)
π e l Electrolyser investment cost (£/GW/year)
π s m r GHR-CCS investment cost (£/GW/year)
π h s Hydrogen storage investment cost (£/GW/year)
π h t Hydrogen pipeline investment cost (£/GW/km/year)
π n l Generation no-load cost (£/h)
π s t Generation start-up cost (£/start)
γ The operation cost of each system (£/GWh)
D E Electricity demand (GW)
D H Heat demand (GW)
D T Transport demand (GW)
f ¯ Existing electricity transmission capacity (GW)
h v s ¯ Existing high-voltage distribution network capacity (GW)
l v s ¯ Existing low-voltage distribution network capacity (GW)
P ¯ The power rating of a generation unit (GW)
P _ Minimum stable generation (GW)
R u p Ramping up limit (GW/h)
R d o w n Ramping down limit (GW/h)
r s p ¯ Frequency response limit (GW)
r e s ¯ Spinning reserve limit (GW)
S F ¯ System frequency response requirement (GW)
S R ¯ System operation reserve requirement (GW)
η Energy conversion efficiency (%)
ε The ratio of flexible transport demand (%)
κ The ratio of electricity demand at high-voltage distribution level (%)
σ Reverse power flow coefficient (%)
S H S T Hydrogen storage duration (h)
C T Carbon target (tCO2/year)
C Direct carbon emission of each technology (tCO2/GWh)
Variables
n The additional capacity of technologies (GW)
f Additional transmission network capacity (GW)
d Reduction in transport load due to DSR (GW)
d + Increased transport load due to DSR (GW)
P Electricity generation (GW)
s t Number of generating units being synchronized
d s t Number of generating units being de-synchronized
μ Number of units in operation
H Heating production (GW)
Q Hydrogen production (GW)
V Transportation supply (GW)
θ Voltage angle
λ Penetration of production technologies (%)
r s p Frequency response (GW)
r e s Spinning reserve (GW)
S H + Hydrogen production by storage (GW)
S H Hydrogen consumed by storage (GW)
S H S The energy content of hydrogen storage (GWh)

References

  1. Sanders, D.; Hart, A.; Ravishankar, M.; Brunert, J.; Strbac, G.; Aunedi, M. An Analysis of Electricity System Flexibility for Great Britain; Carbon Trust/Imperial College: London, UK, 2016. [Google Scholar]
  2. Strbac, G.; Pudjianto, D.; Sansom, R.; Djapic, P.; Ameli, H.; Shah, N.; Brandon, N.; Hawkes, A.; Qadrdan, M. Analysis of Alternative UK Heat Decerbonisation Pathways; Imperial College London: London, UK, 2018. [Google Scholar]
  3. Mancarella, P. MES (multi-energy systems): An overview of concepts and evaluation models. Energy 2014, 65, 1–17. [Google Scholar] [CrossRef]
  4. Pudjianto, D.; Aunedi, M.; Djapic, P.; Strbac, G. Whole-systems assessment of the value of energy storage in low-carbon electricity systems. IEEE Trans. Smart Grid 2013, 5, 1098–1109. [Google Scholar] [CrossRef]
  5. Zhang, X.; Strbac, G.; Teng, F.; Djapic, P. Economic assessment of alternative heat decarbonisation strategies through coordinated operation with electricity system—UK case study. Appl. Energy 2018, 222, 79–91. [Google Scholar] [CrossRef]
  6. Zhang, X.; Strbac, G.; Shah, N.; Teng, F.; Pudjianto, D. Whole-system assessment of the benefits of integrated electricity and heat system. IEEE Trans. Smart Grid 2018, 10, 1132–1145. [Google Scholar] [CrossRef]
  7. Chaudry, M.; Jenkins, N.; Strbac, G. Multi-time period combined gas and electricity network optimisation. Electr. Power Syst. Res. 2008, 78, 1265–1279. [Google Scholar] [CrossRef]
  8. Damen, K.; van Troost, M.; Faaij, A.; Turkenburg, W. A comparison of electricity and hydrogen production systems with CO2 capture and storage—Part B: Chain analysis of promising CCS options. Prog. Energy Combust. Sci. 2007, 33, 580–609. [Google Scholar] [CrossRef] [Green Version]
  9. Almansoori, A.; Shah, N. Design and operation of a future hydrogen supply chain: Snapshot model. Chem. Eng. Res. Des. 2006, 84, 423–438. [Google Scholar] [CrossRef]
  10. Samsatli, S.; Staffell, I.; Samsatli, N.J. Optimal design and operation of integrated wind-hydrogen-electricity networks for decarbonising the domestic transport sector in Great Britain. Int. J. Hydrog. Energy 2016, 41, 447–475. [Google Scholar] [CrossRef]
  11. Samsatli, S.; Samsatli, N.J. The role of renewable hydrogen and inter-seasonal storage in decarbonising heat–Comprehensive optimisation of future renewable energy value chains. Appl. Energy 2019, 233, 854–893. [Google Scholar] [CrossRef]
  12. Li, G.; Zhang, R.; Jiang, T.; Chen, H.; Bai, L.; Li, X. Security-constrained bi-level economic dispatch model for integrated natural gas and electricity systems considering wind power and power-to-gas process. Appl. Energy 2017, 194, 696–704. [Google Scholar] [CrossRef]
  13. Clegg, S.; Mancarella, P. Integrated modeling and assessment of the operational impact of power-to-gas (P2G) on electrical and gas transmission networks. IEEE Trans. Sustain. Energy 2015, 6, 1234–1244. [Google Scholar] [CrossRef]
  14. Qadrdan, M.; Ameli, H.; Strbac, G.; Jenkins, N. Efficacy of options to address balancing challenges: Integrated gas and electricity perspectives. Appl. Energy 2017, 190, 181–190. [Google Scholar] [CrossRef] [Green Version]
  15. Li, J.; Lin, J.; Song, Y.; Xing, X.; Fu, C. Operation optimization of power to hydrogen and heat (P2HH) in ADN coordinated with the district heating network. IEEE Trans. Sustain. Energy 2019, 10, 1672–1683. [Google Scholar] [CrossRef]
  16. Fu, P.; Pudjianto, D.; Zhang, X.; Strbac, G. Evaluating strategies for decarbonising the transport sector in Great Britain. In Proceedings of the IEEE Milan PowerTech, Milan, Italy, 23–27 June 2019; pp. 1–6. [Google Scholar]
  17. Teng, F.; Strbac, G. Full stochastic scheduling for low-carbon electricity systems. IEEE Trans. Autom. Sci. Eng. 2017, 14, 461–470. [Google Scholar] [CrossRef]
  18. Brandon, N.; Kurban, Z. Clean energy and the hydrogen economy. Philos. Trans. R. Soc. A Math. Phys. Eng. Sci. 2017, 375, 20160400. [Google Scholar] [CrossRef] [PubMed]
  19. Speirs, J.; Balcombe, P.; Johnson, E.; Martin, J.; Brandon, N.; Hawkes, A. A greener gas grid: What are the options. Energy Policy 2018, 118, 291–297. [Google Scholar] [CrossRef]
  20. Heap, R. Potential Role of Hydrogen in the UK Energy System; Energy Research Partnership: Birmingham, UK, 2016. [Google Scholar]
  21. Villasana, R.; Garver, L.; Salon, S. Transmission network planning using linear programming. IEEE Trans. Power App. Syst. 1985, PAS-104, 349–356. [Google Scholar] [CrossRef]
  22. FICO Xpress Optimization. Available online: https://www.fico.com/en/products/fico-xpress-optimization (accessed on 28 March 2020).
  23. BEIS. Electricity Generation Costs; The Stationery Office: London, UK, 2016. [Google Scholar]
  24. Element Energy. Hy-Impact Series Study 3: Hydrogen for Power Generation Opportunities for hydrogen and CCS in the UK Power Mix; Element Energy: Cambridge, UK, 2019. [Google Scholar]
  25. Walker, I.; Madden, B.; Tahir, F. Hydrogen Supply Chain Evidence Base; Element Energy Ltd.: Cambridge, UK, 2018. [Google Scholar]
  26. Efficiency Compared: Battery-Electric 73%, Hydrogen 22%, ICE 13%. Available online: https://insideevs.com/news/332584/efficiency-compared-battery-electric-73-hydrogen-22-ice-13/ (accessed on 24 October 2019).
  27. Offer, G.; Howey, D.; Contestabile, M.; Clague, R.; Brandon, N. Comparative analysis of battery electric, hydrogen fuel cell and hybrid vehicles in a future sustainable road transport system. Energy Policy 2010, 38, 24–29. [Google Scholar] [CrossRef] [Green Version]
  28. Chen, G.; Chen, B.; Zhou, H.; Dai, P. Life cycle carbon emission flow analysis for electricity supply system: A case study of China. Energy Policy 2013, 61, 1276–1284. [Google Scholar] [CrossRef]
  29. Kannan, R.; Leong, K.; Osman, R.; Ho, H. Life cycle energy, emissions and cost inventory of power generation technologies in Singapore. Renew. Sustain. Energy Rev. 2007, 11, 702–715. [Google Scholar] [CrossRef]
Figure 1. Interaction of integrated electricity–heat–transport–hydrogen system.
Energies 13 01606 g001
Figure 2. The simplified topology of the interconnected GB system.
Energies 13 01606 g002
Figure 3. Saving from hydrogen integration under different carbon targets.
Energies 13 01606 g003
Figure 4. Optimal generation capacity portfolio in different scenarios.
Energies 13 01606 g004
Figure 5. Optimal electricity production in different scenarios.
Energies 13 01606 g005
Figure 6. Heating technology capacity and production portfolio under different carbon targets.
Energies 13 01606 g006
Figure 7. The proportion of each transport technology.
Energies 13 01606 g007
Figure 8. Carbon emission mix under different carbon targets.
Energies 13 01606 g008
Figure 9. The wind power capacity and its load factor under different carbon targets.
Energies 13 01606 g009
Figure 10. The sensitivity study on the capital cost of wind power.
Energies 13 01606 g010
Figure 11. The sensitivity study on the natural gas price.
Energies 13 01606 g011
Table 1. Economic and operational parameters of the generation units.
GenerationCapital Cost (£/kW)Fixed O&M (£/kW/year)Discount Rate (%)Lifetime (Years)Marginal Cost (£/MWh)Carbon Emissions (kg/MWh)
Nuclear519183.49.5%405.00
CCGT58116.67.5%2537.7318.8
OCGT3128.27.5%3054.2520.6
Gas-CCS236141.613.8%2533.131.9
Coal-CCS340382.013.5%2535.480.5
H2-CCGT69717.07.5%2500
H2-OCGT3748.57.5%3000
Wind164230.98.9%2300
PV4526.25.8%2500
Table 2. Economic and operational parameters of the heating technologies.
Heating TechnologyCapital Cost (£/kW)Fixed O&M (£/kW/year)COP (%)Discount Rate (%)Lifetime (Years)
End-use HP60022.0200%–300%3.5%12
End-use NGB756.095%3.5%12
End-use HB756.095%3.5%12
Industrial HP48017.6380%3.5%12
Industrial NGB352.898%3.5%12
Industrial HB352.898%3.5%12
Table 3. Economic and operational parameters of the hydrogen production technologies.
Hydrogen productionCapital Cost (£/kW)Fixed O&M (£/kW/year)Discount Rate (%)Lifetime (Years)Carbon Emission (kg/MWh)Efficiency (%)
Electrolyser46548.510%30074%
GHR-CCS38424.410%4021.984%
Table 4. Capacity and the annual output of different hydrogen production technologies.
ScenariosCapacity (GW)Proportion (%)Production (TWh)Proportion (%)
ELGHRELGHRELGHRELGHR
30 MtP2G19.30100%0%93.40100%0%
G2G079.70%100%0461.40%100%
OPT9.160.113.1%86.9%25.5313.57.5%92.5%
10 MtP2G27.20100%0%128.30100%0%
G2G0103.00%100%0353.50%100%
OPT11.495.510.7%89.3%39.6301.311.6%88.4%

