Article

Nanostructured Carbon Material Effect on the Synthesis of Carbon-Supported Molybdenum Carbide Catalysts for Guaiacol Hydrodeoxygenation

Instituto de Carboquímica, CSIC, C/Miguel Luesma Castán 4, 50018 Zaragoza, Spain
*
Author to whom correspondence should be addressed.
Energies 2020, 13(5), 1189; https://doi.org/10.3390/en13051189
Submission received: 15 January 2020 / Revised: 25 February 2020 / Accepted: 3 March 2020 / Published: 5 March 2020

Abstract

:
The impact of using different nanostructured carbon materials (carbon nanofibers, carbon nanotubes, graphene oxide and activated carbon) as a support for Mo2C-based catalysts on the hydrodeoxygenation (HDO) of guaiacol was studied. To optimise the catalyst preparation by carbothermal hydrogen reduction (CHR), a thermogravimetric study was conducted to select the optimum CHR temperature for each carbon material, considering both the crystal size of the resulting β-Mo2C particles and the extent of the support gasification. Subsequently, catalysts were prepared in a fixed bed reactor at the optimum temperature. Catalyst characterization evidenced the differences in the catalyst morphology as compared to those prepared in the thermogravimetric study. The HDO results demonstrated that the carbon nanofiber-based catalyst was the one with the best catalytic performance. This behaviour was attributed to the high thermal stability of this support, which prevented its gasification and promoted a good evolution of the crystal size of Mo species. This catalyst exhibited well-dispersed β-Mo2C nanoparticles of ca. 11 nm. On the contrary, the other supports suffered from severe gasification (60–70% wt. loss), which resulted in poorer HDO efficiency catalysts regardless of the β-Mo2C crystal size. This exhibited the importance of the carbon support stability in Mo2C-based catalysts prepared by CHR.

Graphical Abstract

1. Introduction

Since the development in 1985 by Boudart et al. of high specific surface area carbides and nitrides by temperature-programmed reduction [1], several authors have synthetised Mo2C catalysts by this method using hydrocarbon/hydrogen mixtures [2,3,4,5,6,7,8]. Alternatively, for carbon-supported Mo2C catalysts, the carbothermal hydrogen reduction (CHR) method may transform Mo oxides into hexagonal-close-packed carbides (β-Mo2C) at relatively moderate temperatures (<800 °C) using pure hydrogen [9,10,11,12,13,14]. CHR has attracted scientific attention due to the fact that it might avoid carbide contamination by polymeric carbon deposition on the active sites when hydrocarbons are used as a carbon source [15]. Besides, the use of milder temperature conditions may mitigate the low specific surface area obtained due to the partial destruction of the support [16]. Nevertheless, several parameters are involved in the resulting crystallographic and morphological characteristics of the Mo2C phase, such as carburization temperature, heating rate, carburization time, Mo precursor, Mo content and the nature of the carbon support [11,12,14,17,18,19].
The carbon support, besides being the carbon source in CHR, is regarded as one of the best choices as a support in biomass-based liquid phase reactions [15,20,21,22,23,24], with the high efficiency in oxygen removal minimizing the H2 consumption [25]. Thus, these materials have been widely studied both in the CHR and as catalyst support. Mordenti et al. studied Mo2C formation from activated carbon (AC) in CHR at 700 °C, showing complete carburization which led to Mo2C crystals of 14 nm on average. In addition, the authors observed an increase of the metal loading and a depletion of the specific surface area after CHR due to gasification [9]. Pielaszek et al. compared the use of two different ACs (NC100 and carbon monolith from expanded graphite) in the formation of Mo2C by CHR at temperatures up to 700 °C [26]: for the former support, at 700 °C, the authors observed the formation of hexagonal close packing Mo2C crystals smaller than 10 nm; for the latter, this crystal formation took place at lower temperatures (450 °C). The monolith also showed a Mo metal signal in some cases. Additionally, the authors explored different carburization times (1 h and 108 h) for this support at relatively low temperatures 450–600 °C. Longer times led to a slight increase of the crystal size in contrast to the relative high increase obtained in the Mo metal phase. Liang et al. [10] used a high surface area carbon obtained from petroleum coke as the support of a Mo catalyst with 10% Mo content by CHR. They obtained 6 nm Mo2C crystals at 700 °C; this was accompanied with a surface area depletion from 3234 m2/g to 2341 m2/g [10]. Wang et al. [12] used a similar petcoke with 10%Mo; in contrast, they determined 750 °C to be the optimum carburization temperature to obtain a mesoporous catalyst without suffering Mo2C sintering and support collapse. In turn, they extended the carburization time for 90 min, provoking an enlargement of the Mo2C crystal and an increase on the mesoporous volume. This resulted in a higher catalytic activity in 4-methyl phenol hydrodeoxygenation (HDO) [12]. In order to determine the carburization temperature effect in CHR using an activated charcoal, Wang et al. prepared Mo2C/AC catalysts varying the CHR temperature from 600 °C to 800 °C. They concluded that an increase in temperature led to a higher crystallization degree and less oxygen in the intermediate MoOxCy species commonly obtained in the carburization process. However, an overpass at 700 °C resulted in a metallic agglomeration, which diminished the catalytic activity in the HDO of 4 methyl phenol [11]. He et al. studied the effect of Mo loading (10 wt.%, 20 wt.%, 30 wt.%, 50 wt.% and 80 wt.%) on raw AC activated with HNO3 on the CHR at 700 °C. Higher Mo loading resulted in a decrease of the BET surface area and total volume pore due to the partial destruction of the support and in turn resulted in larger Mo2C crystals and agglomerations [27]. They tested these catalysts in the vanillin HDO, concluding that the optimum Mo loading was 20 wt.% due to a good balance between the Mo content and the absence of particle agglomeration [27].
Nanofilamentous supports such as carbon nanofibers (CNF) and nanotubes (CNT) were also studied in CHR. For CNT, Frank et al. evaluated the CHR conditions (gas flow, heating rate and Mo loading), and they noticed that the defects of the CNT structure were crucial in the MoxC crystal formation, which led to a highly active catalyst in the steam reforming of methanol (SRM) [28]. Subsequently, aiming to enhance the Mo2C/CNT properties in this reaction, they modified the CNT surface with heteroatoms (O, N and S). The performed functionalization affected the final nature of the Mo2C nanoparticles and, in particular, N-doped CNT increased the Mo dispersion and the catalytic activity [29]. For the same purpose, Barthos et al. transformed the Mo precursor (ammonium heptamolybdate) into MoO3 prior to CHR and used the resulting Mo2C/CNT as a catalyst for SRM. In the preparation, they observed by X-ray photoelectron spectroscopy (XPS) the appearance of Mo2C at 500 °C and the complete transformation of MoO3 to Mo2C at 700 °C [30]. Li et al. studied the CHR process using CNT (as-received and nitric-treated) at four different carburization temperatures ranging from 500 °C to 700 °C; Mo2C formation was observed at a relatively low temperature of 580 °C for both supports. However, the nitric treatment prevented the metallic agglomerations and the destruction of the support after the process even if the CHR was conducted at high temperatures [31]. Although some works have been undertaken using CNF as a catalytic support of Mo2C nanoparticles [20,23] most of them have been based on carbothermal reduction using N2, and only a few have focused on CHR. With regard to flowing N2, Stellwagen and Bitter compared the catalytic activity of CNF-supported W and Mo carbide catalysts in the deoxygenation of stearic acid and related intermediates. An apolar CNF treated with HCl and a polar CNF functionalised with HNO3 were prepared and used as the supports. The catalyst prepared on the apolar support showed larger crystals compared to the oxidised CNF, which was more stable due to its higher resistance against the metal oxidation [32]. With regard to flowing H2, Moreira et al. prepared Mo2C supported on commercial CNF at 750 °C and subsequently used this in the HDO of guaiacol under different operating conditions. They reported the possibility of suffering etching during the CHR when this support is used [33].
The effect of different carbon supports on the formation of Mo2C during CHR needs to be further studied. Santillana et al. tested three carbon supports (AC, CNT and CNF) with 7.5 Mo wt.% or 20 Mo wt.% in diluted 10% H2/He at 1000 °C in the HDO of guaiacol. For Mo2C/AC, only an amorphous Mo phase was observed, in contrast to Mo2C/MoC crystalline particles for the filamentous carbon. Indeed, due to the well-dispersed Mo2C nanoparticles on CNF, this catalyst showed the highest selectivity to phenol and catalytic activity at 350 °C [24]. In two different works, Qin et al. compared several carbon supports: AC, CNF, CNT carburised at 700 °C [21]; and AC, graphite, fullerenes and reduced graphene oxide (RGO) carburised at 500–700 °C in CHR [34]. The work optimised the Mo2C loading in 20 wt.% and compared the three supports in the HDO of methyl palmitate. In this reaction, all the catalysts showed a similar conversion, even though the Mo2C/CNT showed different product distribution compared to Mo2C/CNF and Mo2C/AC. The latter work was focused on the Mo2C formation in CHR at ranging temperatures of 500–700 °C and their catalytic activity in the HDO of maize oil. Particularly, the catalyst prepared on RGO by means of oxidation and a reduced method showed the highest catalytic activity, enhanced by the active sites and Mo2C particle size. These authors attributed a catalytic behaviour comparable to noble metal catalysts to the Mo2C-based catalyst due to C insertion into the Mo lattice, which shows that the d-electron density of the states of the early transition metal becomes higher at the Fermi level [35].
In addition, when Mo2C is prepared by CHR using carbon materials as a support, the formation of coke on the surface of the catalysts, typically associated with the use of hydrocarbons in the carburization step, is avoided [28]. Normally, Mo2C supported in metal oxides (TiO2, ZrO2, CeO2, SiO2 or Al2O3) prepared by temperature programmed reduction with hydrocarbons shows deactivation problems due to coke deposition, resulting in a low specific surface area and low stability, and thus low catalytic activity [14].
As described in this brief introduction, CHR is a complex process in which the carbon source is one of the key factors. Depending on the nature of the carbon structure, the CHR conditions may not necessarily remain the same. Therefore, in order to compare the influence of carbon as a Mo2C support, it is mandatory to determinate the most suitable CHR conditions individually in order to simultaneously preserve the physicochemical properties of the support and achieve well-developed Mo2C crystal formation. The successful development of carbon-supported Mo2C catalysts may pave the way for the deployment of HDO technologies, which is of utmost importance to effectively producing high value-added products from biomass resources.
In this work, differently nanostructured carbon nanomaterials (CNF, CNT, RGO and a commercial AC) were used as Mo2C supports. Within the framework described above for the CHR, it is of utmost importance to carefully select the CHR condition since each carbon support shows its inherent properties in the carburization of Mo, resulting in different β-Mo2C crystal sizes and affecting considerably the final textural properties of the catalyst. Thus, prior to the carburization process, Mo-impregnated supports were subjected to a thermogravimetric study mimicking the CHR conditions, followed by the characterization by X-ray diffraction of the resulting catalysts. The objective was to determine the optimal CHR temperature, aiming to preserve the support and achieve a well-developed β-Mo2C crystal structure. Once the carburization temperatures were selected for each support, the catalyst was prepared by CHR in a fixed bed reactor. Subsequently, its catalytic activity was tested in the HDO of guaiacol at relatively mild conditions (300 °C, 20 H2 bar and 2 h). The guaiacol molecule is widely used as an aromatic model compound of fast pyrolysis oil [36,37,38]. The catalysts were compared regarding theur guaiacol conversion, product distribution and selectivities, and oxygen removal efficiency.

2. Materials and Methods

2.1. Synthesis of Nanostructured Carbon Materials

Carbon nanofibers were produced in a rotatory bed reactor by CH4:CO2 (50:50 vol.%) catalytic decomposition at 650 °C using a Ni-Co/Al2O3 catalyst (33.5:33.5:33 molar%). This material was purified with concentrated HCl at 60 °C for 4 h and under mild sonication. After that, the solid was filtered, rinsed with distillate water until a pH of 7 was reached and dried overnight at 60 °C. Subsequently, an oxidation stage was performed with concentrated HNO3 at boiling point for 1 h and under reflux. After oxidation, the product was filtered, washed and dried as in the previous purification stage. These purified and oxidised carbon nanofibers are referred to as CNF in the manuscript. More details of this synthesis can be found in previous works [18,19].
CNTs were produced by the decomposition of a methane-rich stream (H2 = 10 L/h; CH4 = 48 L/h; N2 = 38 L/h) in a rotatory bed reactor, as elsewhere described [39]. Fe-Mo/MgO (7.5:1.5:91.0 molar %) prepared by co-precipitation was used as a catalyst at 900 °C and for 30 min. The synthesis of these catalysts and the procedures of CNT growth are described elsewhere [40,41]. Additionally, CNTs were purified and oxidised as previously described for CNF.
RGO was synthetised by the chemical unzipping of CNT using a modification of Hummers’ method [42] and subsequent hydrothermal reduction. In this case, CNTs were produced in the rotatory bed reactor with a massive Fe-based catalyst, as described in [42]. Aiming to remove the high oxygen content obtained after Hummers’ method, the graphene oxide was reduced hydrothermally at 180 °C and for 6 h in an autoclave reactor [43]. After reduction, RGO was dried overnight at 60 °C.
Commercial activated carbon (NORIT C GRAN, CABOT), designed as AC, was used as received. This material was ground in a mortar, and no further treatments were performed. All these carbon materials were grouped under the acronym NCM (nanostructured carbon material).

2.2. Mo Precursor Impregnation and Carbothermal Hydrogen Reduction

Mo was incorporated on the NCM by incipient wetness impregnation using an (NH4)6Mo7O24·4H2O aqueous solution (AHM) [18] in order to obtain a Mo content of 10 wt.% after drying (10.6 wt.% of Mo after the transformation of AHM into Mo2C in CHR process). These materials were labelled as AHM/NCM (where NCM refers to CNF, CNT, RGO or AC). Although the temperature program used in the CHR was established in previous works for CNF-supported catalysts [18,19], the CHR temperature was initially optimised for the different carbon supports by using a thermobalance coupled with a mass spectrometer (TG-MS) (NETZSCH TG 209 F1 Libra® thermobalance coupled to a MICROMERITICS AutoChemTM II 2920 mass spectrometer), where the reduction process was simulated followed by the structural analysis of the resulting catalysts (labelled as Mo2C/NCM) by X-ray diffraction (XRD). The impregnated NCM was introduced in the thermobalance and carboreduced for 2 h at temperatures ranging from 650 °C to 800 °C, using H2/Ar (10/90 vol./vol.) as reduction gas and with a temperature ramp of 10 °C/min.
Once the carburization temperature for each support was selected, the CHR of each AHM/NCM was carried out in a fixed-bed tubular quartz reactor using 2.0 g of the sample, 100 mL/min of pure H2 and atmospheric pressure. The carboreduction program consisted of three steps: fast heating to 350 °C at 10 °C/min, slow heating to the optimal temperature at 1 °C/min [18], and an isothermal period of 1 h at this temperature. Subsequently, the reactor was cooled down under an N2 atmosphere, and the catalysts were passivated with an O2/N2 (1/99 vol./vol.) mixture using a flow rate of 24 mL/min at 25 °C for 2 h. The carboreduced catalysts (reduced to their optimal temperatures) were named as Mo2C/NCM and used in the HDO of guaiacol.

2.3. Catalytic Hydrodeoxygenation of Guaiacol Using Mo2C/NCM

The catalytic tests were conducted in an autoclave reactor at 300 °C and 20 bar of H2 (at room temperature). In a typical run, 1.2 mL of guaiacol was dissolved in 40 mL of n-decane and introduced in the reactor with 0.2 g of catalyst. This mixture was heated to 300 °C at 10 °C/min under soft stirring (300 rpm) to minimize the contact. Once the operating temperature was reached, the reaction was performed for 2 h under vigorous stirring (1000 rpm). The liquid products were filtered and analysed by Gas Chromatography with a Flame Ionization Detector (GC-FID) as in previous works [18].
Briefly, the guaiacol conversion, HDO ratio (parameter which allows comparing the oxygen proportion in the products), specific product yield (SPY) and mass balance were calculated as follows:
Conversion (%) = (mol of guaiacol in feed − mol of guaiacol in the product)/mol of guaiacol in feed × 100
HDO ratio (%) = (mol of O in feed − mol of O in the product)/ mol of O in feed × 100
Mass balance (%) = (mass of products + mass of unreacted guaiacol)/mass of guaiacol in feed × 100
SPY (wt.%) = (mass of product/mass of Mo in the catalyst) × 100

2.4. Characterization of NCM and Mo2C/NCM Catalysts

The physical properties of the carbon supports were determined by means of Micrometrics ASAP2020 equipment. Through the 77 K N2 physisorption, the specific surface area according to the BET method (SBET) and the total pore volume (Vt) at a relative pressure of P/P0 > 0.971 were calculated. Additionally, for RGO, CO2 physisorption at 273 K was performed in order to determine the micropore surface area by the Dubinin–Radushkevich equation. The residual catalyst of the prepared support and the metallic impurities of AC were determined by thermo-gravimetric analysis by flowing 50 mL/min of air and heating the NCM to 1000 °C at 10 °C/min; the mass loss was recorded in a TG 209 F1 Libra (NETZSCH®). The textural properties of the prepared NCM were observed by transmission electron microscopy (TEM), supporting the NCM in copper grids covered with a lacey amorphous carbon film. TEM images were captured using a JELO-2000 FXII microscope operating at 200 KeV for CNF; for AC, CNT and RGO, a Tecnai F30 (FEI) at 300 KeV was employed. For the identification and size determination of the crystal phases, a DIFRAC PLUS EVA 8.0 diffractometer was used. The identification of the crystal phases was determined by TOPAS software using Rietveld refinement, while the phase identification was realised according to the EVA software package with the International Centre for Diffraction Data database.
The sample scanning was performed at = 20°–80° by 0.02°/s by means of a Bruker D8 Advance Series 2 diffractometer equipped with Ni-filtered CuKα radiation and a secondary graphite monochromator. The catalyst surface was determined by an ESCAPlus (OMICROM) spectrometer under a <5 × 10⁻⁹ Torr vacuum and analysed using CASA XPS software applying a Shirley-type background. The emitted radiation was generated by a hemispherical electron energy analyser, an X-ray at 225 W (15 mA and 15 KV) and a non-monochromatised MgAlα. In order to determine the metallic final composition, the catalyst was treated following the sodium peroxide fusion procedure prior to introduction in a Spectroblue (AMETEK) inductively coupled plasma-optical emission spectrometer (ICP-OES). To obtain the high-angle annular dark field (HAADF) images, the samples were deposited in amorphous carbon-coated copper grids an introduced into a Tecnai F30 (FEI) at 300 KeV using the scanning transmission electron microscope (STEM) mode. The STEM mode allows the use of a coupled energy-dispersive X-ray spectroscope (EDX) for in situ chemical composition analysis.

3. Results and Discussion

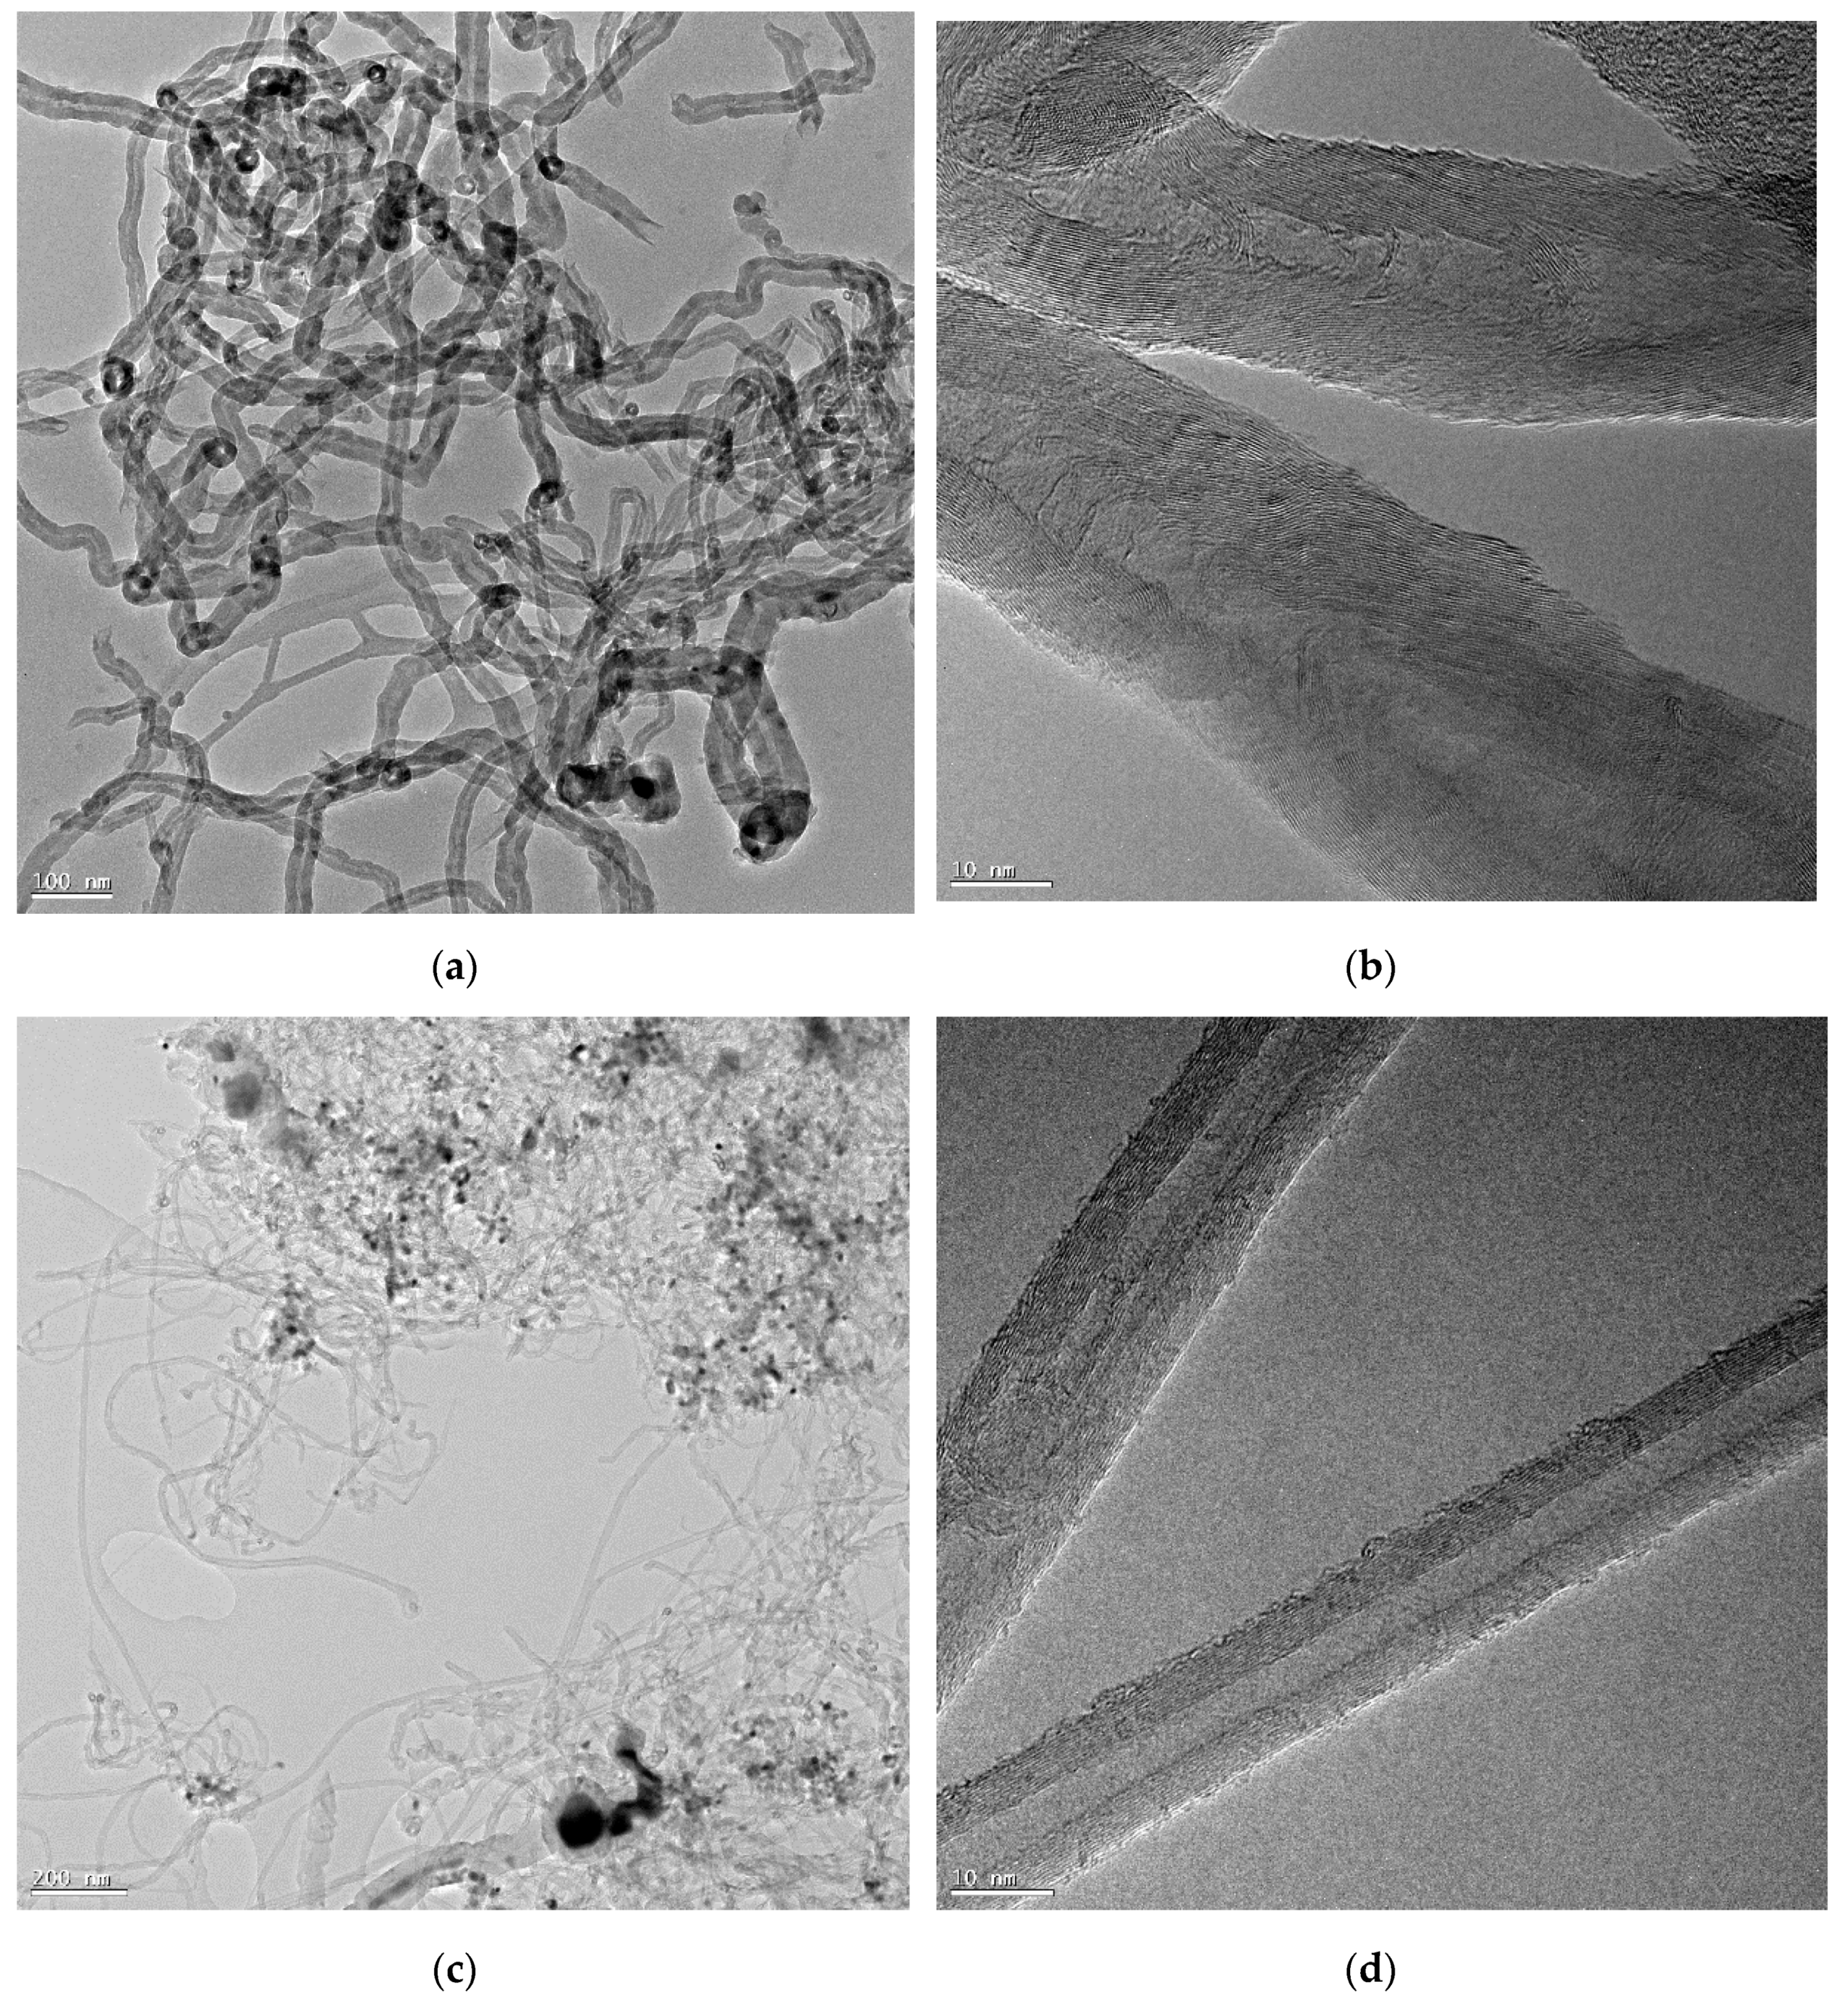
3.1. Characterization of NCM

The morphological appearance of the supports was observed by TEM, as shown in Figure 1. CNF showed a graphite stacking in the form of a fishbone-type nanofilament, with an inner hollow core of around 6 nm in diameter and an average outer diameter of 20–30 nm (Figure 1a,b). CNT showed narrower diameters (10–15 nm) with a regular stacking of 8–20 concentric layers (Figure 1c–d). RGO was composed by agglomerates of wrinkled sheets of 4–6 layers (Figure 1e–f). The commercial AC consisted of spherical aggregates composed of randomly aligned small graphite crystallites (Figure 1g–h).
In order to determine the surface chemistry of the supports, XPS analysis was performed. The results are summarised in Table 1. All samples are mostly compounds of C and O, related to the functionalities introduced in the oxidation stage, and minor elements (N, P, B, Ni, Co or Al) from their different synthesis routes accounting for below 2 at.%. CNFs could be observed at the surface of Ni, Co and Al, related to the catalysts used in the preparation and which were not completely removed after the oxidation treatment. Commercial AC showed the presence of surface B and P.
The textural properties of carbon supports were determined by N2 physisorption and are shown in Table 1. AC had a high surface area value (1230 m2/g), which was higher than carbon nanofilaments (99–104 m2/g) and RGO (23 m2/g). Likewise, Vt, ranging from 0.1 cm3/g to 0.9 cm3/g, followed the same order as SBET. RGO showed the lowest values of surface area and pore volume, although this material presented a high content of micropores (up to 76 m2/g of micropore surface area calculated with Dubinin–Radushkevich using CO2 as adsorbate).

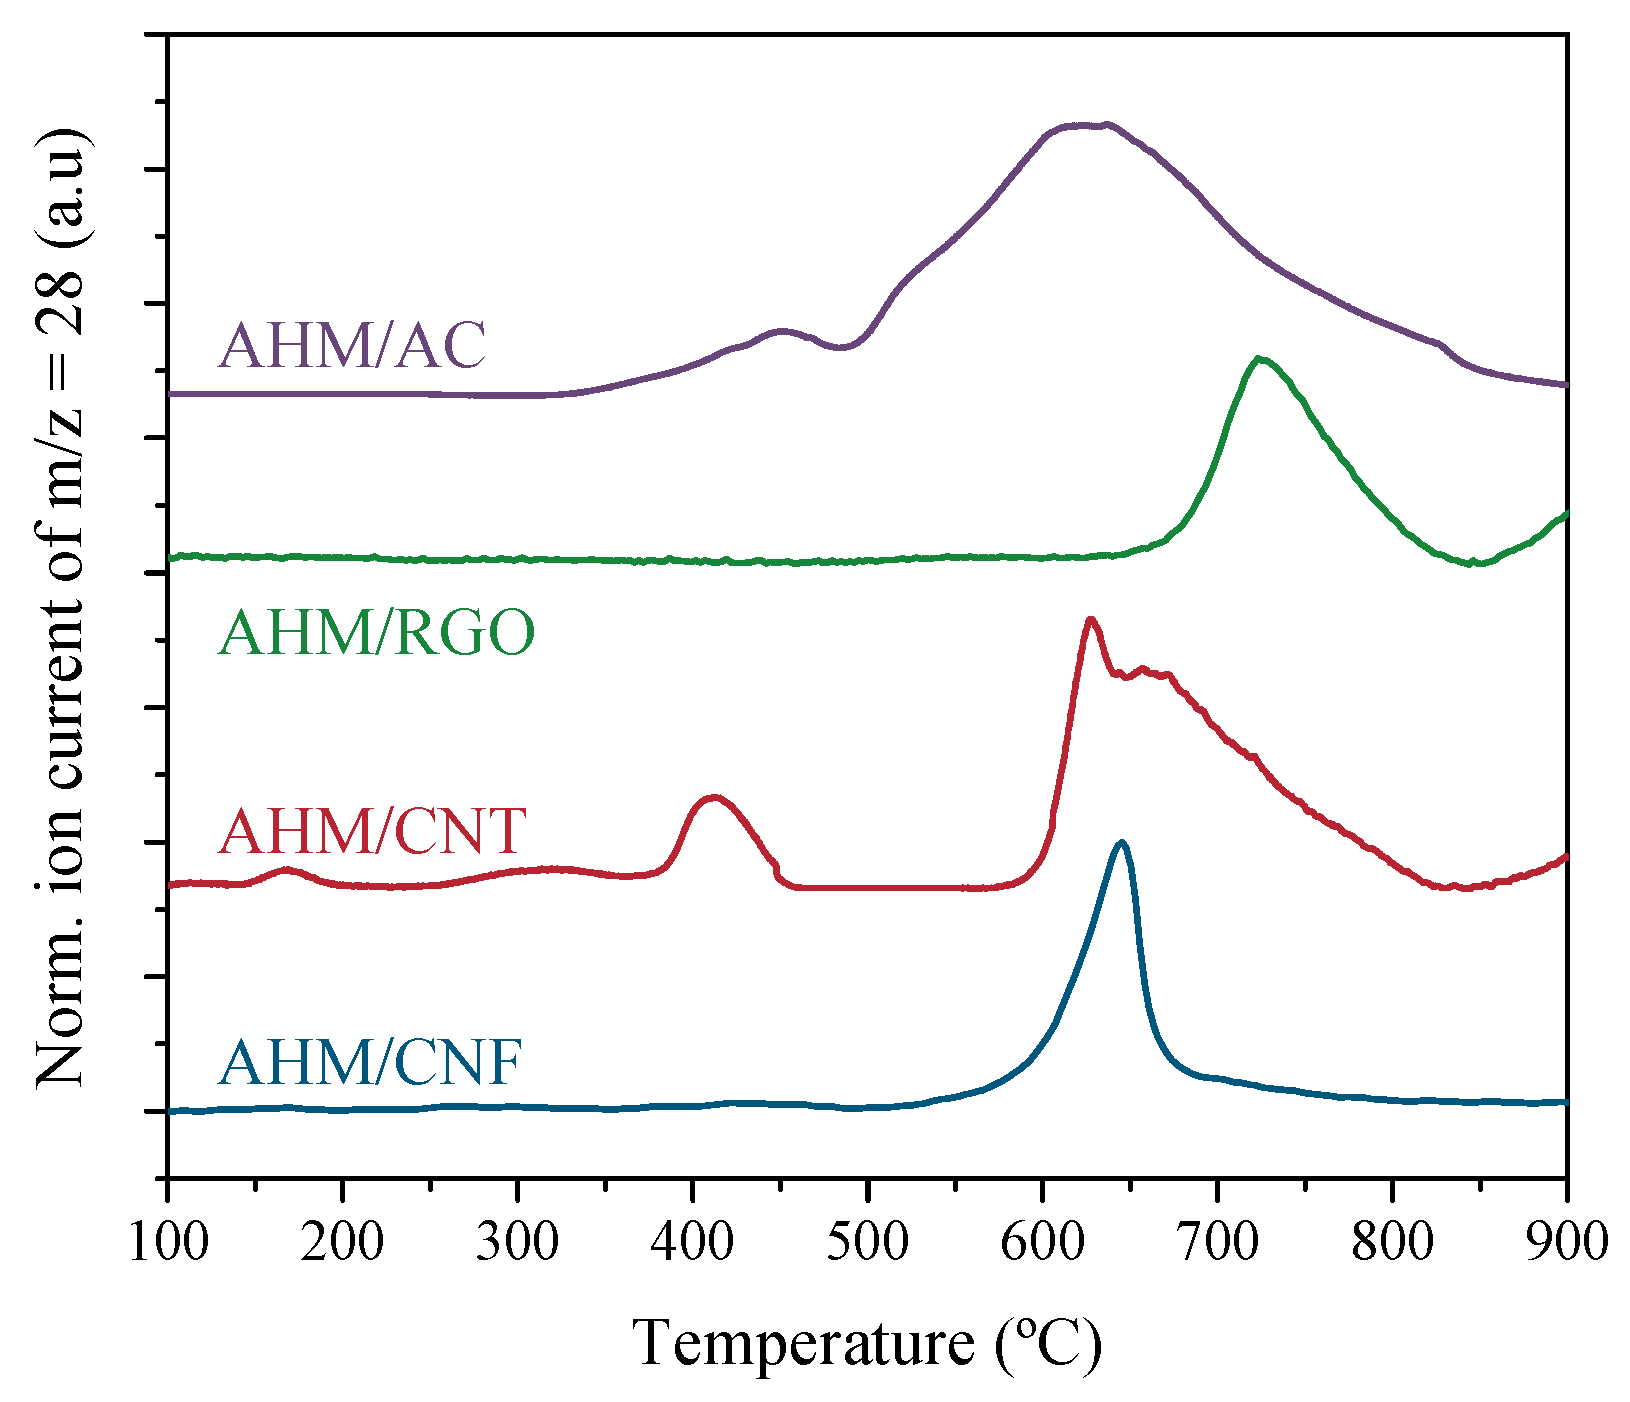
3.2. Carburization Study in Thermobalance

In order to determine the optimal CHR temperature, the carburization of AHM/NCM samples was carried out in a thermobalance coupled with MS (TG-MS). As previously reported [18], the evolution of m/z = 28 during the CHR stage allowed us to select the temperature necessary to carry out the carburization process. This m/z value is related to the CO formed during the carburization of MoO2 to Mo2C. Figure 2 shows this evolution with temperature. The appearance of a CO signal started at different temperatures depending on the support used in the AHM carboreduction. Thus, an m/z = 28 signal appeared at around 500 °C for AHM/AC, at around 560 °C for carbon nanofilaments (CNF and CNT) and at around 630 °C for RGO. An m/z = 28 signal reached a maximum at temperatures centred around 625–645 °C, except for RGO, for which the MoO2 carburization (and CO formation) was hindered and shifted up to around 725 °C. These differences may be tentatively attributed to the physicochemical properties. Thus, the lower oxygen content in the support resulted in lower CO onset temperature. This factor may influence the dispersion and interaction between the Mo precursor and the support, thus affecting the CO evolution during carbide formation.
The transformation of AHM/NCM (10.0 Mo wt.%) to Mo2C/NCM entails a theoretical mass loss of 5.4% (AHM→ MoO3→MoO2→Mo2C); nevertheless, all materials exhibited larger mass losses, which were attributed to the gasification of the carbon support (Figure 3a). Gasification is a key parameter to be considered in CHR, since it may modify not only the catalyst porosity but also the final Mo content [18]. Besides this, the CH4 released during the support gasification may also increase the carburization degree and the β-Mo2C crystal size. In this way, the weight changes suffered by AHM/NCM materials after an isothermal period of 2 h at different CHR temperatures were analysed (Figure 3a). AHM/CNF suffered mild gasification (13.0–14.3 wt.%) regardless of the final carburization temperature, indicating the larger thermal stability of this material. On the contrary, the gasification in the other NCM was more severe, with the weight loss observed being higher when the carburization temperature was increased. The largest weight loss was observed for the AHM/CNT, ranging from 51.6% to 83.5% when the temperature was increased from 650 °C to 750 °C. AHM/RGO and AHM/AC showed similar behaviours, with weight loss values ranging from 34.4% to 66.1% as the temperature was raised. In the case of RGO, the principal cause may be derived from the removal of the large amount of oxygen functional groups and the subsequent defect generation. Likewise, the thinness of the RGO may favour the fast gasification of this material, contributing to the mass loss. Equally, AC presents a high surface area and a pseudo-amorphous structure, which makes it easier for gasification to occur during CHR.
After carburization, Mo2C/NCM catalysts were analysed by XRD in order to quantify the size of the β-Mo2C crystal phase (Figure 3b). For temperatures that resulted in crystal sizes below the XRD detection limit, no data are shown. As previous work revealed [18], the optimal β-Mo2C crystal size for the HDO of guaiacol is around 10 nm. Generally, an increase in the carburization temperature led to larger β-Mo2C crystals, although the extension of this growth was markedly different depending on the support. CNT showed larger β-Mo2C crystals than those obtained for RGO and AC at the same temperature: for instance, at 700 °C, the β-Mo2C crystal size of these last catalysts was 2.6 nm and below the detection limit, respectively, in contrast to the 15.0 nm obtained for CNT. The formation of β-Mo2C over CNF showed an intermediate behaviour: 5.8 and 11.4 nm crystals were achieved at 650 and 750 °C, respectively. Likewise, as important as the formation of well-developed β-Mo2C crystals is the mitigation of the gasification of the support. The deep gasification of the support hampers the control of the Mo loading, reducing the surface area of the catalyst and worsening the Mo dispersion on the support surface. Therefore, carbon gasification should be avoided as far as possible to achieve the best catalytic behaviour. It is important to observe that not all NMC tested led to the formation of β-Mo2C crystals of ca. 10 nm. Instead of this, an optimal carburization temperature for each NCM was selected, minimizing the support gasification and aiming to form β-Mo2C crystals as close to 10 nm as possible. In the case of the CNT-supported catalyst, 10 nm β-Mo2C crystals were formed when performing the CHR at 650 °C. Besides this, the selection of this temperature minimizes the gasification of the support (51.6% weight loss). The CHR temperature selected for the CNF-supported catalyst was 750 °C. This support withstood this temperature without suffering a significant mass loss (14.2%) and led to 11.4 nm β-Mo2C crystals. Regarding the optimal CHR temperature for RGO, 750 °C was the temperature selected despite obtaining relatively small β-Mo2C crystals (4.9 nm) and high weight loss (48.4%). Finally, in the case of AC, only temperatures above 800 °C resulted in β-Mo2C crystals over the detection limit, so this temperature was selected as the optimal one, resulting in ca. 6.3 nm crystals and 66.1% weight loss.

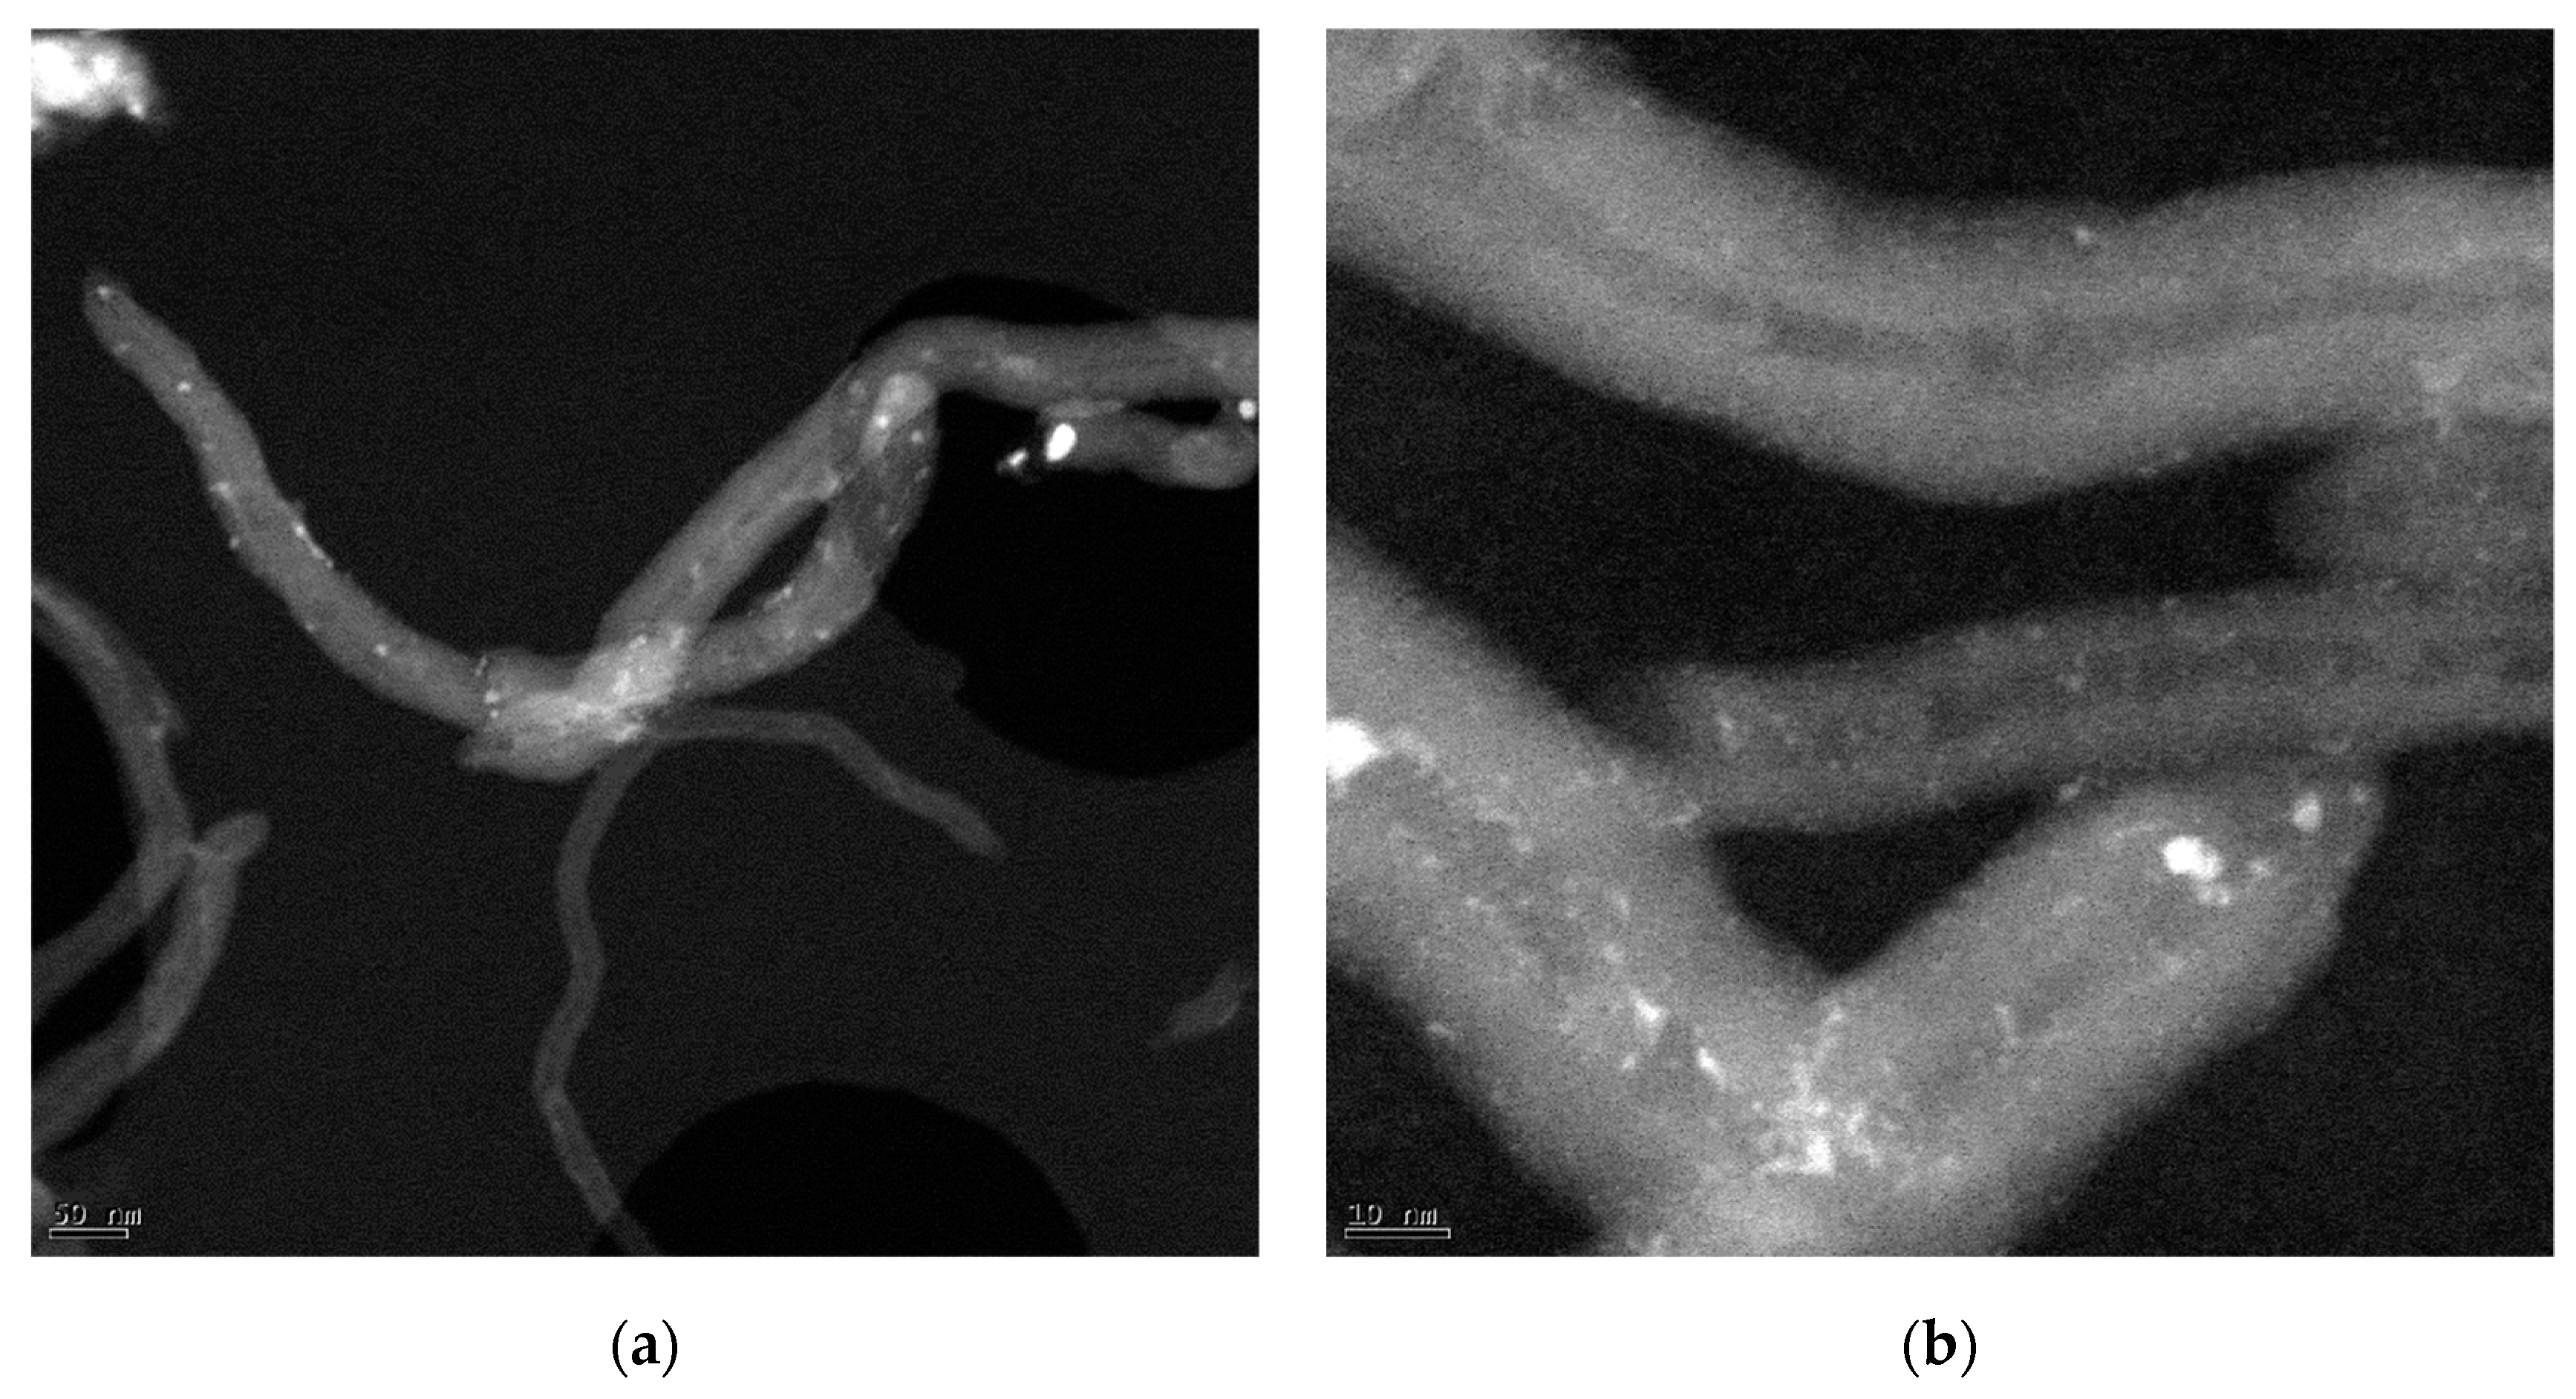
3.3. Characterization of Catalysts Using Different NCM

The carburization of AHM/NCM samples was conducted in a fixed-bed reactor at the optimal temperature selected in the previous section. In this case, 100% of H2 flow and a 1 h isothermal period were employed. Figure 4 and Table 2 show the XRD patterns and β-Mo2C crystal sizes of the different catalysts. Catalysts showed the typical reflections associated with graphite and the hexagonal close packing structure of β-Mo2C. AC also showed the presence of MoO2 and an oxycarbide specie related to MoC2O4, which indicates the incomplete carburization of this catalyst. Additional reflections were assigned to support impurities (tge diffractograms of supports are shown in Figure S1 in the Supplementary Information): Mo2C/CNT contained metallic Fe from the CNT catalyst, and Mo2C/AC, B and BPO4 from the AC functionalization treatment. Regarding the β-Mo2C crystal sizes obtained, they differed from those obtained in the thermobalance (previous section), but this discrepancy was attributed to the H2 concentration used (10 vol.% vs. 100 vol.%). Pure H2 flow may facilitate the initial reduction of AHM to MoO2 [44], hence promoting the carburization of MoO2 to Mo2C at lower temperature [28]. Mo2C is known to act as a gasification catalyst with the concomitant production of CH4 [9]. This would explain the relatively large β-Mo2C crystal sizes obtained in the fixed-bed reactor, except for Mo2C/CNF, which presented a similar β-Mo2C crystal size than that obtained in TGA. It seems obvious that gasification promotes the sintering of the Mo2C crystals upon reaction with the CH4 formed, at least for the AC and CNT-supported catalysts. The gasification of the support during the CHR was further evidenced by the ICP-OES results (Table 2), where a drastic increase of the Mo content was observed for these two catalysts. Taking into consideration the fact that the theoretical Mo value should be around 10.6 wt.% in the final catalyst, the increase in the weight loss observed is entirely provoked by the partial gasification of the support. The fact that the RGO-supported catalyst did not follow this trend could be attributed to the fact that most of the weight loss observed during the CHR stage might be related to the loss of oxygen surface groups rather than carbon gasification.
The surface atomic composition of all catalysts was measured by XPS. XPS survey spectra showed different Mo contents depending on the catalyst (Table 2). The catalysts presented Mo surface compositions in the range of 2.3–3.2 at.%, except for Mo2C/RGO, which exhibited a higher Mo content (6.6 at.%). In the case of Mo2C/RGO, 11.8 at.% of S was identified, which was related to the H2SO4 used in the RGO synthesis by Hummers’ method; no other element, with the exceptions of Mo, C and O, was detected. Finally, the Mo2C/AC catalyst showed 3.13 at.% of impurities (B and P). On the other hand, the impurities detected at the surface for Mo2C/CNT and Mo2C/CNF were negligible. Regarding the oxygen content, a part of the oxygen measured belonged to the O2 passivation and the formation of MoOxCy species [11,34], except for the RGO catalyst, in which the oxygen content is inherent to its structure. Before passivation, CHR removed most of the oxygen groups created in the functionalization of carbon nanofilaments [45].
Aiming to determine the oxidation state of Mo on the catalysts, the deconvolution of the XPS Mo 3d region was undertaken (see Figure S2 in the Supplementary Information). The most oxidised species, Mo6+ and Mo4+, are related to MoO3 and MoO2, respectively, and are mostly due to the passivation treatment. Several authors reported that the Mo surface is extremely sensitive to oxidation when the sample is in contact with air or O2 in the passivation treatment [23,32,34,46]. An intermediate oxidation state found between MoO2 and Mo2C, named Moδ+ (2 < δ+ < 3), was associated with oxycarbides [18,19]. Mo2+, located at 228.2–228.4 eV, was related to the Mo2C specie. Even though the carbide was the desired phase in the catalyst, the results suggested that both species, Mo2+ and Moδ+, may contribute to its hydrodeoxygenation activity [11,18,47]. In any case, the Mo active phase content (Mo2+ and Moδ+) followed this order: Mo2C/CNF > Mo2C/CNT > Mo2C/RGO >> Mo2C/AC.
SBET and Vt of the Mo2C/NCM catalysts were measured by N2 physisorption, and the results are listed in Table 2. As a general rule, the catalysts showed smaller SBET and Vt values than their respective supports, motivated by the partial covering of the pores by the Mo phase (Table 1), except for the Mo2C/GO catalyst which had a slight increase in the porosity values due to the formation of meso and micropores upon the removal of the oxygen and sulphur surface groups, as evidenced in Figure S3 in the Supplementary Information. The AC-based catalyst had a much more pronounced SBET and Vt reduction, attributed to a partial destruction of its micro and mesoporosity (see Figure S3 in the Supplementary Information).
The morphology of all catalysts was observed by STEM. Likewise, the composition of bright particles was determined by EDX (see Figures S4–S6 in the Supplementary Information). Particle size was calculated by measuring the diameter of isolated metallic bright particles from TEM images. In order to do so, more than 250 particles were considered in the analysis. Mo2C/CNF (Figure 5) showed a β-Mo2C particle size distribution around 4.9 ± 2.1 nm along with the nanofiber structure. The particle sizes of these nanoparticles shown by the HAADF images are different from those calculated by XRD (10.9 nm). On the other hand, a homogeneous dispersion of nanoparticles lower than 2 nm was observed covering the CNF (Figure 5b). However, these nanoparticles were under the detection limit of EDX and XRD techniques due to their small size. In the case of Mo2C/CNT (Figure 6), the STEM micrographs revealed some differences in the morphology and composition of particles in the sample. Figure 6a shows a representative image of this material, showing some areas of metal accumulation probably motivated by a heterogeneous impregnation of the precursor (white rectangle). These areas coexisted with the presence of long CNTs decorated with β-Mo2C particles of different sizes both in the inner and in the outer surface (white circles) and iron particles from the catalyst employed on the support growth embedded in the inner core (white arrows), as determined by EDX (see Figure S4 in the Supplementary Information). In the case of Mo2C/RGO (Figure 7), this catalyst showed a high concentration of well-dispersed small metallic nanoparticles (2–4 nm). Besides, the chemical composition of bright particles was related exclusively to Mo species as shown in Figure S5 (see Supplementary Information). Similarly, Mo2C/AC showed a high metal concentration covering the support (Figure 8). According to the performed EDX (see Figure S6 in the Supplementary Information), the support was comprised of Mo, C and P, with the bright round nanoparticles being the dispersed Mo2C.

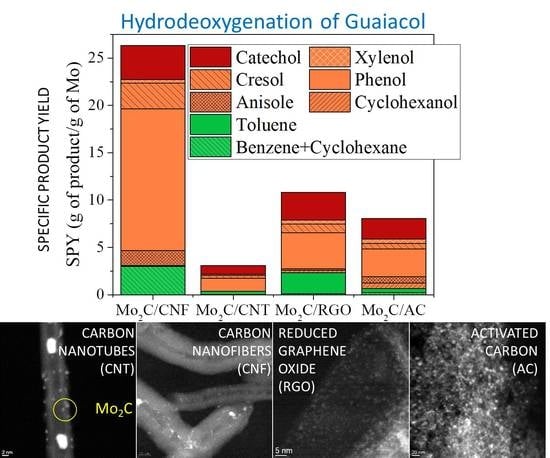
3.4. Catalytic HDO of Guaiacol

Catalysts prepared by CHR were tested in the HDO of guaiacol: Mo2C/CNF carboreduced at 750 °C, Mo2C/CNT at 650 °C, Mo2C/RGO at 750 °C and Mo2C/AC at 800 °C. As previously stated, the temperatures used in the carburization of each catalyst correspond to the optimum temperature for each support as determined in the previous section. The reaction was performed at 300 °C, 20 H2 bar measured at room temperature and 2 h of reaction time. The results for each catalyst are summarised in Table 3 and Figure 9. Overall, the catalytic activity (guaiacol conversion and HDO ratio) followed this order: Mo2C/CNF > Mo2C/AC > Mo2C/RGO > Mo2C/CNT. With regard to the characterization results, the β-Mo2C crystal size measured by XRD, which for this set of catalysts ranged from 10.9 to 15.5 nm, was inversely proportional to the guaiacol conversion. However, this feature cannot solely explain the catalytic activity. A plethora of other parameters, such as the textural properties and the Mo content in the bulk and at the surface, as well as the Mo and composition, have to be also taken into consideration. For instance, the Mo content determined by ICP was 12.9–13.7 wt.% for the CNF and RGO-supported catalysts, where it almost doubled in the case of AC and CNT-based catalysts as a result of the different gasification extents.
Mo2C/CNF showed the best catalytic performance towards the HDO of guaiacol: 67.0% conversion and a HDO ratio of 37.2%. Although Ni and Co traces were detected for this support, the catalytic contribution of these metals were low due to their small proportion and localization [18]. Thus, the catalytic activity of this catalyst can be entirely attributed to Mo2+ and Moδ species, which according to the literature are the most active Mo phases [11]. Mo2C/CNF showed the largest values, suffering from very soft gasification, and hence the morphology of the support was mostly preserved. Mo2C/AC followed in terms of the conversion and HDO ratio (42.0% and 25.0%, respectively). It should be noted that this catalyst exhibited a high Mo concentration (24 wt.%) with a similar β-Mo2C crystal size to Mo2C/CNF (12.4 nm). The HAADF-STEM images showed a high concentration of metallic particles without agglomerations covering the AC surface. Nonetheless, the low values of surface Mo active phases determined by XPS are striking. Beside this, the microporous nature of this material (see Figure S3 in the Supplementary Information) may account for the lower catalytic activity as compared to the CNF-supported catalysts, despite the larger amount of Mo. The active sites in CNF are much more accessible since they are composed mainly of meso and macropores. A plausible explanation for this observation is that part of the β-Mo2C in AC is deposited in the micropores, and its activity is hindered by the diffusion constraints of the relatively bulky guaiacol molecule.
Mo2C/RGO showed low catalytic activity (20.7% conversion and a 9.6% HDO ratio). According to the TEM study, it is clear that this material is mostly composed of very finely dispersed small Mo particles whose oxidation state is not possible to elucidate by this technique. XRD showed the presence of β-Mo2C, although the small size of the diffraction peak showed that the contribution of this phase is relatively low. Therefore, this catalyst seems to be formed mostly by Mo oxide nanoparticles with a low catalytic activity towards HDO, hence explaining the low activity observed.
Mo2C/CNT showed the poorest catalytic activity and HDO ratio (14.2% and 9.1%, respectively), even though the catalyst exhibited relatively large Mo2C crystals (15.5 nm), a similar concentration of Mo active phases in the surface as compared to the Mo2C/CNF catalyst and a relatively high SBET (105.9 m2/g). This phenomenon may be tentatively explained by the partial destruction of the support morphology, as evidenced the TEM study, highlighting the importance of the support in not only dispersing the active phase but also possibly serving as a hydrogen reservoir for the hydrogenation reactions [48]. In addition, the exposure of the iron particles that were originally embedded on the inner part of the tubes upon the excessive gasification that takes place during the CHR may also have affected the catalytic behaviour due to the competitive adsorption of guaiacol molecules in Fe and Mo particles.
In addition to the catalytic activity, the product distribution may also be affected by the support used in the catalyst synthesis, as is shown in Figure 9a. The product distribution was split into three categories according to the number of oxygen atoms: 2 (catechol), 1 (phenol, anisole, cresol, xylenol and methyl-cyclohexanol) and 0 (toluene and benzene/cyclohexane. All catalysts showed a higher production of one-oxygen products (O × 1) as a consequence of the removal of one oxygen atom. Likewise, phenol was the main product obtained by the remotion of –OCH3 (see Table S1 in the Supplementary Information).
All catalysts allowed guaiacol to transform into O-free products (under the reaction scheme suggested in previous works [18,48]), and the content was increased for the catalysts with larger Mo2C crystals. However, only Mo2C/CNF and Mo2C/CNT showed a relevant concentration of these compounds in the final liquid (ca. 10%). Despite this, both show a similar catalytic distribution; in the case of O-free products, the Mo2C/CNF favoured the cyclohexane +benzene production in contrast to Mo2C/CNT, which exhibited toluene as the main O-free product. Likewise, Mo2C/RGO showed the highest 0-Oxy concentration due to its selectivity to toluene. Toluene may be formed by the dihydroxylation of cresol or as a consequence of partial deoxygenation from anisole. Regarding the product distribution, the non-detection of anisole for Mo2C/CNT may be due to the fast conversion of toluene, although a relative proportion of it is identified in Mo2C/AC and Mo2C/RGO (2.25% and 0.34%, respectively).
On the other hand, cyclohexane + benzene could be formed by the demethoxylation of anisole or dihydroxylation of phenol; both reaction paths may take place, because both compounds were detected. Particularly, the Mo2C/CNF catalyst showed a relatively high concentration of those compounds in the final liquid (10%); this fact probably was due to the good catalytic activity shown (with a guaiacol conversion of 66.98%) in the HDO of guaiacol, which led to the reaction achieving the largest product formation.
Catechol was the only product detected by GC which did not show any oxygen removal (2-O product). This product is considered to be an intermediate in the phenol production, and it may form via the cleavage of the O-CH3 bond from guaiacol [47]. Some authors conclude that the formation of 2-O was favoured by the support acidity [49]. In contrast to this hypothesis, some authors attributed higher 2-Oxy production to acidic/basic nature of Mo2C, which is created by the Mo-C mass transfer [50]. For both cases, the support plays a crucial role in the catalytic behaviour of the active Mo2C sites. Regarding the 2-O product concentration, higher production was obtained for RGO, which had the largest value of oxygen content and hence the largest acidity, followed by Mo2C/CNT and Mo2C/AC. Nonetheless, the possibility that catalytic activity may be affected by other factors such as Mo content, β-Mo2C crystal size or Mo2+/Moδ+ ratio cannot be discarded.
The selectivity to the most important and relevant deoxygenated products is shown in Table S2, where phenol, cyclohexane + benzene and toluene were listed. All catalysts were more selective to phenol (1-Oxy product), although there were differences in 0-Oxy selectivity. The CNF-supported catalyst showed higher cyclohexane + benzene selectivity as compared to CNT and RGO-supported catalysts, which were more selective to toluene.
The last group of products plotted was named “Others”; these compounds were calculated by the mass difference between the conversion and the final mass obtained in the identified products. These high molecular compounds were solubilised in the liquid phase but could not be detected by GC [20]. The production of “Others” was augmented as long as conversion increased (see Table S1 in the Supplementary Information), although their final content was masked by the increase of the formation of detected products with the guaiacol conversion. For that reason, the Mo2C/AC showed a higher “Others” concentration than Mo2C/CNF when the production in both reaction tests was similar.
Finally, catalysts were compared according to the specific product yield (SPY), as previously reported in [19] (Figure 9b), which considered the amount of Mo present in the catalyst. Mo2C/CNF clearly exhibited the highest total yield (as the sum of SPY) compared to the rest of the catalysts. In turn, Mo2C/AC showed a lower total yield than Mo2C/RGO, which means that the catalytic activity of the former is more related to the high amount of Mo than to the effectiveness of the active phase. Mo2C/CNT shows the lowest SPY as a consequence of the possible Fe competition with Mo2C.
Considering all factors, Mo2C/CNF showed the best catalytic activity, with good selectivity to oxygen-free HDO products and high guaiacol conversion. This performance was related to its higher gasification resistance, good Mo2C dispersion and crystal formation in CHR, which makes it the most suitable CNM support for Mo2C-based catalysts.

4. Conclusions

The nanostructured carbon materials had a direct effect on the formation of β-Mo2C in the carbothermal hydrogen reduction and hence in the hydrodeoxygenation of guaiacol. The carbon nanofiber-based catalyst resulted in the best catalytic performance, obtaining the highest conversion and yield of desired products (mainly phenol, benzene and cyclohexane). This behaviour was attributed to the higher thermal stability of CNF, which prevented its gasification and promoted a good evolution of the crystal size of Mo species. This catalyst exhibited well-dispersed β-Mo2C nanoparticles of ca. 11 nm. On the contrary, the other supports suffered from severe gasification (60–70% wt. loss), which resulted in poorer HDO efficiency catalysts regardless of the β-Mo2C crystal size. This demonstrated the importance of the stability of carbon supports in the Mo2C-based catalyst prepared by CHR.

Supplementary Materials

The following are available online at https://www.mdpi.com/1996-1073/13/5/1189/s1. Figure S1: XRD patterns of supports after their corresponding purification and functionalization treatments; Figure S2: Mo 3d deconvolution of the Mo2C/NMC catalysts; Figure S3: DFT Pore size distributions of catalysts and supports measured by N2 physisorption; Figure S4: EDX performed to Mo2C/CNT; Figure S5: EDX performed to Mo2C/RGO; Figure S6: EDX performed to Mo2C/AC. Table S1: Product distribution (wt.%). Table S2: Selectivity (mol %).

Author Contributions

Conceptualization, J.L.P. and I.S.; methodology, E.O.; validation, D.T. and J.L.P.; formal analysis, E.O.; data curation: E.O.; investigation, E.O.; Supervision, J.L.P. and I.S.; writing—Original draft preparation, E.O.; writing—Review and editing, D.T., J.L.P. and I.S.; funding acquisition, J.L.P. and I.S. All authors have read and agreed to the published version of the manuscript.

Funding

This work was funded by European Regional Development Fund and the Spanish Economy and Competitiveness Ministry (MINECO) (ENE2017-83854-R).

Acknowledgments

EO is grateful for the award of her PhD under the frame of the aforementioned project. JLP thanks CSIC for the financial support (PII 201850I039 project). The authors gratefully acknowledge the “Laboratorio de Microscopías Avanzadas” at “Instituto de Nanociencia de Aragón - Universidad de Zaragoza” for offering access to their microscope and expertise.

Conflicts of Interest

The authors declare no conflict of interest. The funders had no role in the design of the study; in the collection, analyses, or interpretation of data; in the writing of the manuscript, or in the decision to publish the results.

References

  1. Volpe, L.; Boudart, M. Compounds of molybdenum and tungsten with high specific surface area: II. Carbides. J. Solid State Chem. 1985, 59, 348–356. [Google Scholar] [CrossRef]
  2. Dhandapani, B.; Clair, T.S.; Oyama, S.T. Simultaneous hydrodesulfurization, hydrodeoxygenation, and hydrogenation with molybdenum carbide. Appl. Catal. A: Gen. 1998, 168, 219–228. [Google Scholar] [CrossRef]
  3. Claridge, J.B.; York, A.P.E.; Brungs, A.J.; Green, M.L.H. Study of the Temperature-Programmed Reaction Synthesis of Early Transition Metal Carbide and Nitride Catalyst Materials from Oxide Precursors. Chem. Mater. 2000, 12, 132–142. [Google Scholar] [CrossRef]
  4. Xiao, T.-C.; York, A.P.E.; Williams, V.C.; Al-Megren, H.; Hanif, A.; Zhou, X.-Y.; Green, M.L.H. Preparation of Molybdenum Carbides Using Butane and Their Catalytic Performance. Chem. Mater. 2000, 12, 3896–3905. [Google Scholar] [CrossRef]
  5. Brungs, A.J.; York, A.P.E.; Claridge, J.B.; Márquez-Alvarez, C.; Green, M.L.H. Dry reforming of methane to synthesis gas over supported molybdenum carbide catalysts. Catal. Lett. 2000, 70, 117–122. [Google Scholar] [CrossRef]
  6. Xiao, T.; Hanif, A.; York, A.P.E.; Sloan, J.; Green, M.L.H. Study on preparation of high surface area tungsten carbides and phase transition during the carburisation. Phys. Chem. Chem. Phys. 2002, 4, 3522–3529. [Google Scholar] [CrossRef]
  7. Hanif, A.; Xiao, T.; York, A.P.E.; Sloan, J.; Green, M.L.H. Study on the Structure and Formation Mechanism of Molybdenum Carbides. Chem. Mater. 2002, 14, 1009–1015. [Google Scholar] [CrossRef]
  8. Ramanathan, S.; Oyama, S.T. New Catalysts for Hydroprocessing: Transition Metal Carbides and Nitrides. J. Phys. Chem. 1995, 99, 16365–16372. [Google Scholar] [CrossRef]
  9. Mordenti, D.; Brodzki, D.; Djéga-Mariadassou, G. New Synthesis of Mo2C 14 nm in Average Size Supported on a High Specific Surface Area Carbon Material. J. Solid State Chem. 1998, 141, 114–120. [Google Scholar] [CrossRef]
  10. Liang, C.; Ying, P.; Li, C. Nanostructured β-Mo2C Prepared by Carbothermal Hydrogen Reduction on Ultrahigh Surface Area Carbon Material. Chem. Mater. 2002, 14, 3148–3151. [Google Scholar] [CrossRef]
  11. Wang, H.; Liu, S.; Smith, K.J. Synthesis and Hydrodeoxygenation Activity of Carbon Supported Molybdenum Carbide and Oxycarbide Catalysts. Energy Fuels 2016, 30, 6039–6049. [Google Scholar] [CrossRef]
  12. Wang, H.; Liu, S.; Liu, B.; Montes, V.; Hill, J.M.; Smith, K.J. Carbon and Mo transformations during the synthesis of mesoporous Mo2C/carbon catalysts by carbothermal hydrogen reduction. J. Solid State Chem. 2018, 258, 818–824. [Google Scholar] [CrossRef]
  13. Liang, C.; Wei, Z.; Xin, Q.; Li, C. Synthesis and characterization of nanostructured Mo2C on carbon material by carbothermal hydrogen reduction. In Studies in Surface Science and Catalysis; Gaigneaux, E., de Vos, D.E., Grange, P., Jacobs, P.A., Martens, J.A., Ruiz, P., Poncelet, G., Eds.; Elsevier: Amsterdam, The Netherlands, 2000; pp. 975–982. [Google Scholar]
  14. Wang, H.; Liu, S.; Govindarajan, R.; Smith, K.J. Preparation of Ni-Mo2C/carbon catalysts and their stability in the HDS of dibenzothiophene. Appl. Catal. A: Gen. 2017, 539, 114–127. [Google Scholar] [CrossRef]
  15. Souza Macedo, L.; Stellwagen, D.R.; Teixeira da Silva, V.; Bitter, J.H. Stability of Transition-metal Carbides in Liquid Phase Reactions Relevant for Biomass-Based Conversion. ChemCatChem 2015, 7, 2816–2823. [Google Scholar] [CrossRef]
  16. Lee, J.S.; Oyama, S.T.; Boudart, M. Molybdenum carbide catalysts. J. Catal. 1987, 106, 125–133. [Google Scholar] [CrossRef]
  17. Guil-López, R.; Nieto, E.; Botas, J.A.; Fierro, J.L.G. On the genesis of molybdenum carbide phases during reduction-carburization reactions. J. Solid State Chem. 2012, 190, 285–295. [Google Scholar] [CrossRef]
  18. Ochoa, E.; Torres, D.; Moreira, R.; Pinilla, J.L.; Suelves, I. Carbon nanofiber supported Mo2C catalysts for hydrodeoxygenation of guaiacol: The importance of the carburization process. Appl. Catal. B 2018, 239, 463–474. [Google Scholar] [CrossRef]
  19. Ochoa, E.; Torres, D.; Pinilla, J.L.; Suelves, I. Influence of carburization time on the activity of Mo2C/CNF catalysts for the HDO of guaiacol. Catal. Today 2019. [Google Scholar] [CrossRef]
  20. Jongerius, A.L.; Gosselink, R.W.; Dijkstra, J.; Bitter, J.H.; Bruijnincx, P.C.A.; Weckhuysen, B.M. Carbon Nanofiber Supported Transition-Metal Carbide Catalysts for the Hydrodeoxygenation of Guaiacol. ChemCatChem 2013, 5, 2964–2972. [Google Scholar] [CrossRef]
  21. Qin, Y.; Chen, P.; Duan, J.; Han, J.; Lou, H.; Zheng, X.; Hong, H. Carbon nanofibers supported molybdenum carbide catalysts for hydrodeoxygenation of vegetable oils. RSC Adv. 2013, 3, 17485–17491. [Google Scholar] [CrossRef]
  22. Han, J.; Duan, J.; Chen, P.; Lou, H.; Zheng, X. Molybdenum Carbide-Catalyzed Conversion of Renewable Oils into Diesel-like Hydrocarbons. Adv. Synth. Catal. 2011, 353, 2577–2583. [Google Scholar] [CrossRef]
  23. Hollak, S.A.W.; Gosselink, R.W.; van Es, D.S.; Bitter, J.H. Comparison of Tungsten and Molybdenum Carbide Catalysts for the Hydrodeoxygenation of Oleic Acid. ACS Catal. 2013, 3, 2837–2844. [Google Scholar] [CrossRef]
  24. Santillan-Jimenez, E.; Perdu, M.; Pace, R.; Morgan, T.; Crocker, M. Activated Carbon, Carbon Nanofiber and Carbon Nanotube Supported Molybdenum Carbide Catalysts for the Hydrodeoxygenation of Guaiacol. Catalysts 2015, 5, 424. [Google Scholar] [CrossRef]
  25. Liu, S.; Wang, H.; Smith, K.J.; Kim, C.S. Hydrodeoxygenation of 2-Methoxyphenol over Ru, Pd, and Mo2C Catalysts Supported on Carbon. Energy Fuels 2017, 31, 6378–6388. [Google Scholar] [CrossRef]
  26. Pielaszek, J.; Mierzwa, B.; Medjahdi, G.; Marêché, J.F.; Puricelli, S.; Celzard, A.; Furdin, G. Molybdenum carbide catalyst formation from precursors deposited on active carbons: XRD studies. Appl. Catal. A: Gen. 2005, 296, 232–237. [Google Scholar] [CrossRef]
  27. He, L.; Qin, Y.; Lou, H.; Chen, P. Highly dispersed molybdenum carbide nanoparticles supported on activated carbon as an efficient catalyst for the hydrodeoxygenation of vanillin. RSC Adv. 2015, 5, 43141–43147. [Google Scholar] [CrossRef]
  28. Frank, B.; Friedel, K.; Girgsdies, F.; Huang, X.; Schlögl, R.; Trunschke, A. CNT-Supported MoxC Catalysts: Effect of Loading and Carburization Parameters. ChemCatChem 2013, 5, 2296–2305. [Google Scholar] [CrossRef]
  29. Frank, B.; Xie, Z.-L.; Ortega, K.F.; Scherzer, M.; Schlogl, R.; Trunschke, A. Modification of the carbide microstructure by N- and S-functionalization of the support in MoxC/CNT catalysts. Catal. Sci. Technol. 2016, 6, 3468–3475. [Google Scholar] [CrossRef] [Green Version]
  30. Barthos, R.; Széchenyi, A.; Solymosi, F. Efficient H2 Production from Ethanol over Mo2C/C Nanotube Catalyst. Catal. Lett. 2008, 120, 161–165. [Google Scholar] [CrossRef]
  31. Li, X.; Ma, D.; Chen, L.; Bao, X. Fabrication of molybdenum carbide catalysts over multi-walled carbon nanotubes by carbothermal hydrogen reduction. Catal. Lett. 2007, 116, 63–69. [Google Scholar] [CrossRef]
  32. Stellwagen, D.R.; Bitter, J.H. Structure-performance relations of molybdenum- and tungsten carbide catalysts for deoxygenation. Green Chem. 2015, 17, 582–593. [Google Scholar] [CrossRef]
  33. Moreira, R.; Ochoa, E.; Pinilla, J.; Portugal, A.; Suelves, I. Liquid-Phase Hydrodeoxygenation of Guaiacol over Mo2C Supported on Commercial CNF. Effects of Operating Conditions on Conversion and Product Selectivity. Catalysts 2018, 8, 127. [Google Scholar] [CrossRef] [Green Version]
  34. Qin, Y.; He, L.; Duan, J.; Chen, P.; Lou, H.; Zheng, X.; Hong, H. Carbon-Supported Molybdenum-Based Catalysts for the Hydrodeoxygenation of Maize Oil. ChemCatChem 2014, 6, 2698–2705. [Google Scholar] [CrossRef]
  35. Choi, J.-S.; Bugli, G.; Djéga-Mariadassou, G. Influence of the Degree of Carburization on the Density of Sites and Hydrogenating Activity of Molybdenum Carbides. J. Catal. 2000, 193, 238–247. [Google Scholar] [CrossRef]
  36. He, Z.; Wang, X. Hydrodeoxygenation of model compounds and catalytic systems for pyrolysis bio-oils upgrading. Catal. Sustain. Energy 2012, 1, 28–52. [Google Scholar] [CrossRef]
  37. Roldugina, E.A.; Naranov, E.R.; Maximov, A.L.; Karakhanov, E.A. Hydrodeoxygenation of guaiacol as a model compound of bio-oil in methanol over mesoporous noble metal catalysts. Appl. Catal. A: Gen. 2018, 553, 24–35. [Google Scholar] [CrossRef]
  38. Zhao, H.Y.; Li, D.; Bui, P.; Oyama, S.T. Hydrodeoxygenation of guaiacol as model compound for pyrolysis oil on transition metal phosphide hydroprocessing catalysts. Appl. Catal. A 2011, 391, 305–310. [Google Scholar] [CrossRef]
  39. Pinilla, J.L.; Utrilla, R.; Lázaro, M.J.; Suelves, I.; Moliner, R.; Palacios, J.M. A novel rotary reactor configuration for simultaneous production of hydrogen and carbon nanofibers. Int. J. Hydrog. Energy 2009, 34, 8016–8022. [Google Scholar] [CrossRef]
  40. Torres, D.; Pinilla, J.L.; Suelves, I. Unzipping of multi-wall carbon nanotubes with different diameter distributions: Effect on few-layer graphene oxide obtention. Appl. Surf. Sci. 2017, 424, 101–110. [Google Scholar] [CrossRef]
  41. Torres, D.; Pinilla, J.L.; Lázaro, M.J.; Moliner, R.; Suelves, I. Hydrogen and multiwall carbon nanotubes production by catalytic decomposition of methane: Thermogravimetric analysis and scaling-up of Fe–Mo catalysts. Int. J. Hydrog. Energy 2014, 39, 3698–3709. [Google Scholar] [CrossRef] [Green Version]
  42. Torres, D.; Pinilla, J.L.; Moliner, R.; Suelves, I. On the oxidation degree of few-layer graphene oxide sheets obtained from chemically oxidized multiwall carbon nanotubes. Carbon 2015, 81, 405–417. [Google Scholar] [CrossRef]
  43. Torres, D.; Pinilla, J.L.; Galvez, E.M.; Suelves, I. Graphene quantum dots from fishbone carbon nanofibers. RSC Adv. 2016, 6, 48504–48514. [Google Scholar] [CrossRef]
  44. Ciembroniewicz, G.; Dziembaj, R.; Kalicki, R. Thermal decomposition of Ammonium paramolybdate (APM). J. Therm. Anal. 1983, 27, 125–138. [Google Scholar] [CrossRef]
  45. Kundu, S.; Wang, Y.; Xia, W.; Muhler, M. Thermal Stability and Reducibility of Oxygen-Containing Functional Groups on Multiwalled Carbon Nanotube Surfaces: A Quantitative High-Resolution XPS and TPD/TPR Study. J. Phys. Chem. C 2008, 112, 16869–16878. [Google Scholar] [CrossRef]
  46. Liu, C.; Lin, M.; Fang, K.; Meng, Y.; Sun, Y. Preparation of nanostructured molybdenum carbides for CO hydrogenation. RSC Adv. 2014, 4, 20948–20954. [Google Scholar] [CrossRef]
  47. Chang, J.; Danuthai, T.; Dewiyanti, S.; Wang, C.; Borgna, A. Hydrodeoxygenation of Guaiacol over Carbon-Supported Metal Catalysts. ChemCatChem 2013, 5, 3041–3049. [Google Scholar] [CrossRef]
  48. Pinilla, J.L.; García, A.B.; Philippot, K.; Lara, P.; García-Suárez, E.J.; Millan, M. Carbon-supported Pd nanoparticles as catalysts for anthracene hydrogenation. Fuel 2014, 116, 729–735. [Google Scholar] [CrossRef]
  49. Lu, M.; Lu, F.; Zhu, J.; Li, M.; Zhu, J.; Shan, Y. Hydrodeoxygenation of methyl stearate as a model compound over Mo2C supported on mesoporous carbon. React. Kinet. Mech. Catal. 2015, 115, 251–262. [Google Scholar] [CrossRef]
  50. Bej, S.K.; Bennett, C.A.; Thompson, L.T. Acid and base characteristics of molybdenum carbide catalysts. Appl. Catal. A: Gen. 2003, 250, 197–208. [Google Scholar] [CrossRef]
Figure 1. Transmission electron microscope (TEM) images of carbon nanofibers (CNF) (a,b), carbon nanotubes (CNT) (c,d), reduced graphene oxide (RGO) (e,f) and commercial activated carbon (AC) (g,h).
Energies 13 01189 g001aEnergies 13 01189 g001b
Figure 2. m/z = 28 evolution of the different (NH4)6Mo7O24·4H2O aqueous solution (AHM)/NCM measured by a thermobalance coupled with mass spectrometer (TG-MS).
Energies 13 01189 g002
Figure 3. Weight loss (a) and β-Mo2C crystal size (b) of AHM/NCM and catalysts, respectively, after 2 h carburization in TGA at different temperatures. Dashed lines delimit the optimal β-Mo2C crystal sizes.
Energies 13 01189 g003
Figure 4. XRD patterns of Mo2C/NCM catalysts obtained after carbothermal hydrogen reduction (CHR) at the optimum temperature using a heating rate of 1 °C/min and a 1 h isothermal period.
Energies 13 01189 g004
Figure 5. Low (a) and high-magnification (b) STEM images of Mo2C/CNF.
Energies 13 01189 g005
Figure 6. Low (a) and high-magnification (b) STEM images of Mo2C/CNT.
Energies 13 01189 g006
Figure 7. Low (a) and high-magnification (b) STEM images of Mo2C/RGO.
Energies 13 01189 g007
Figure 8. Low (a) and high-magnification (b) STEM images of Mo2C/AC.
Energies 13 01189 g008
Figure 9. Catalytic results obtained in the HDO of guaiacol using different NCMs as a support of Mo2C: (a) product distribution grouped by oxygen content; (b) product production per gram of Mo (SPY).
Energies 13 01189 g009
Table 1. Physicochemical properties of nanostructured carbon materials. NCM: nanostructured carbon material; XPS: X-ray photoelectron spectroscopy.
NCMXPS (at.%)N2 Physisorption
COSNOthersSBET (m2/g)Vt (cm3/g)
CNF93.24.80.00.02.0990.463
CNT95.04.30.00.70.01040.590
RGO70.320.56.72.50.0230.105
AC90.77.40.00.01.912300.913
Table 2. Results of characterization of Mo2C/NCM catalysts obtained in fixed-bed reactor. XRD: X-ray diffraction; ICP-OES: inductively coupled plasma-optical emission spectrometry.
CHRXRD (nm)ICP-OES (wt.%)XPS (at.%)N2 Phys.
CatalystT (°C)Wt. loss (%)β-Mo2CMoCOMoOthersMo6+Mo4+Moδ+Mo2+SBET (m2/g)Vt (cm3/g)
Mo2C/CNF7503010.912.992.65.12.30.0168.82.611.716.8640.398
Mo2C/CNT6507015.525.689.77.03.20.1469.83.310.416.51060.551
Mo2C/RGO7505813.613.769.212.56.611.880.61.93.114.5400.097
Mo2C/AC8007012.523.685.87.93.13.1389.67.90.042.55720.653
Table 3. The conversion, hydrodeoxygenation (HDO) ratio and mass balance obtained for all Mo2C/NCM catalysts in the HDO of guaiacol at 300 °C, 20 H2 bar and under a 2 h reaction.
CatalystConversion (%)HDO Ratio (%)Mass Balance (%)
Mo2C/CNF67.037.2083.28
Mo2C/CNT14.239.0994.34
Mo2C/RGO20.689.5999.99
Mo2C/AC42.0024.9783.72

