Improved Photovoltaic Self-Consumption in Residential Buildings with Distributed and Centralized Smart Charging of Electric Vehicles


Abstract
1. Introduction
1.1. Related Work and Motivation
1.2. Aim and Structure of the Paper
- (1)
- The potential of improved synergy between PV generation and household load, including EV home-charging, by smart charging schemes quantified by self-consumption and self-sufficiency metrics.
- (2)
- The impact of the aggregation of multiple households with smart charging schemes on energy performances.
- (3)
- A comparison between centralized smart charging and aggregation of distributed smart charging on energy performances.
- (4)
- The impact on different PV power shares relative to self-consumption and self-sufficiency improvements by smart charging schemes.
2. Methodologies
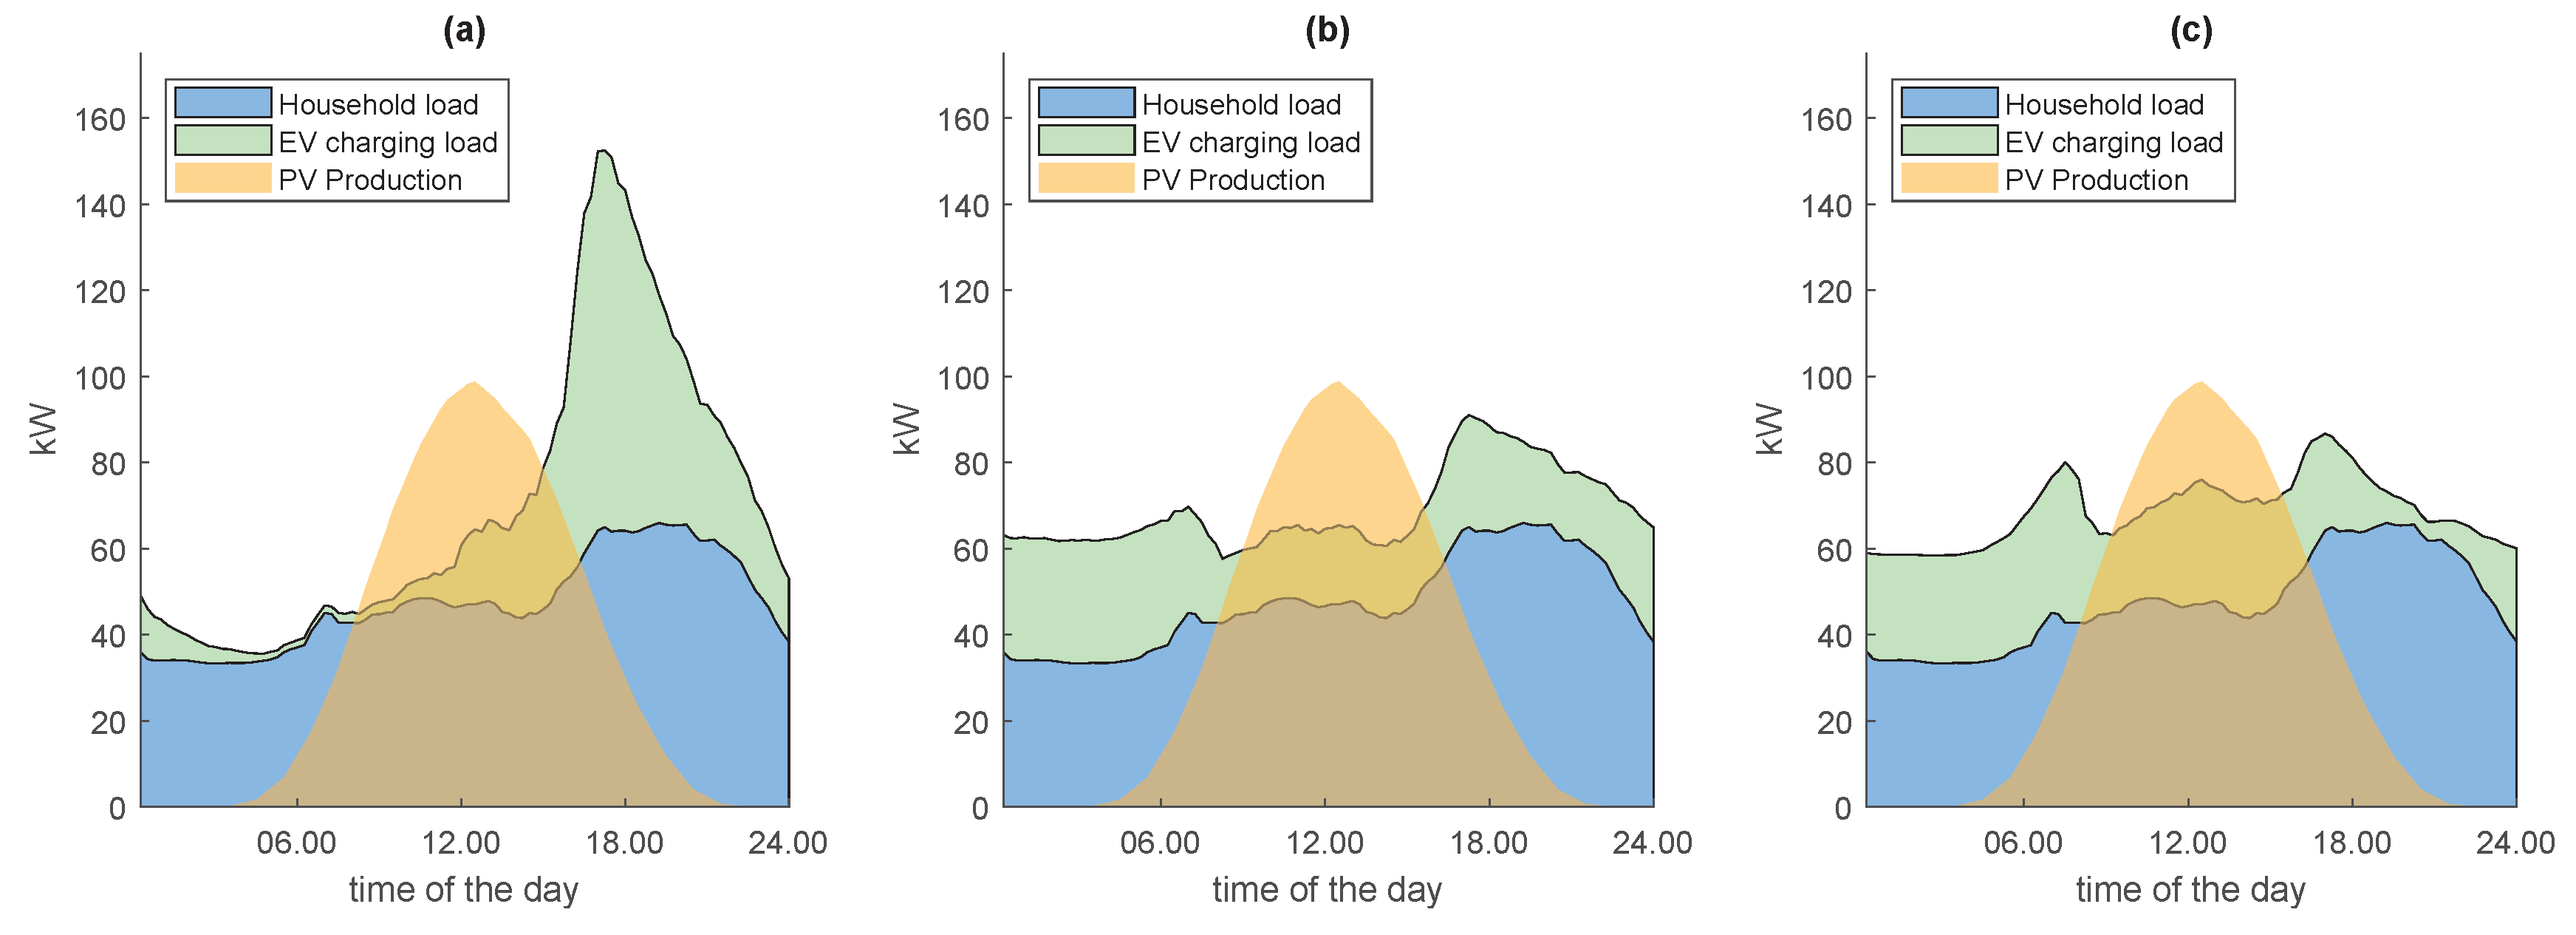
2.1. EV Charging Schemes
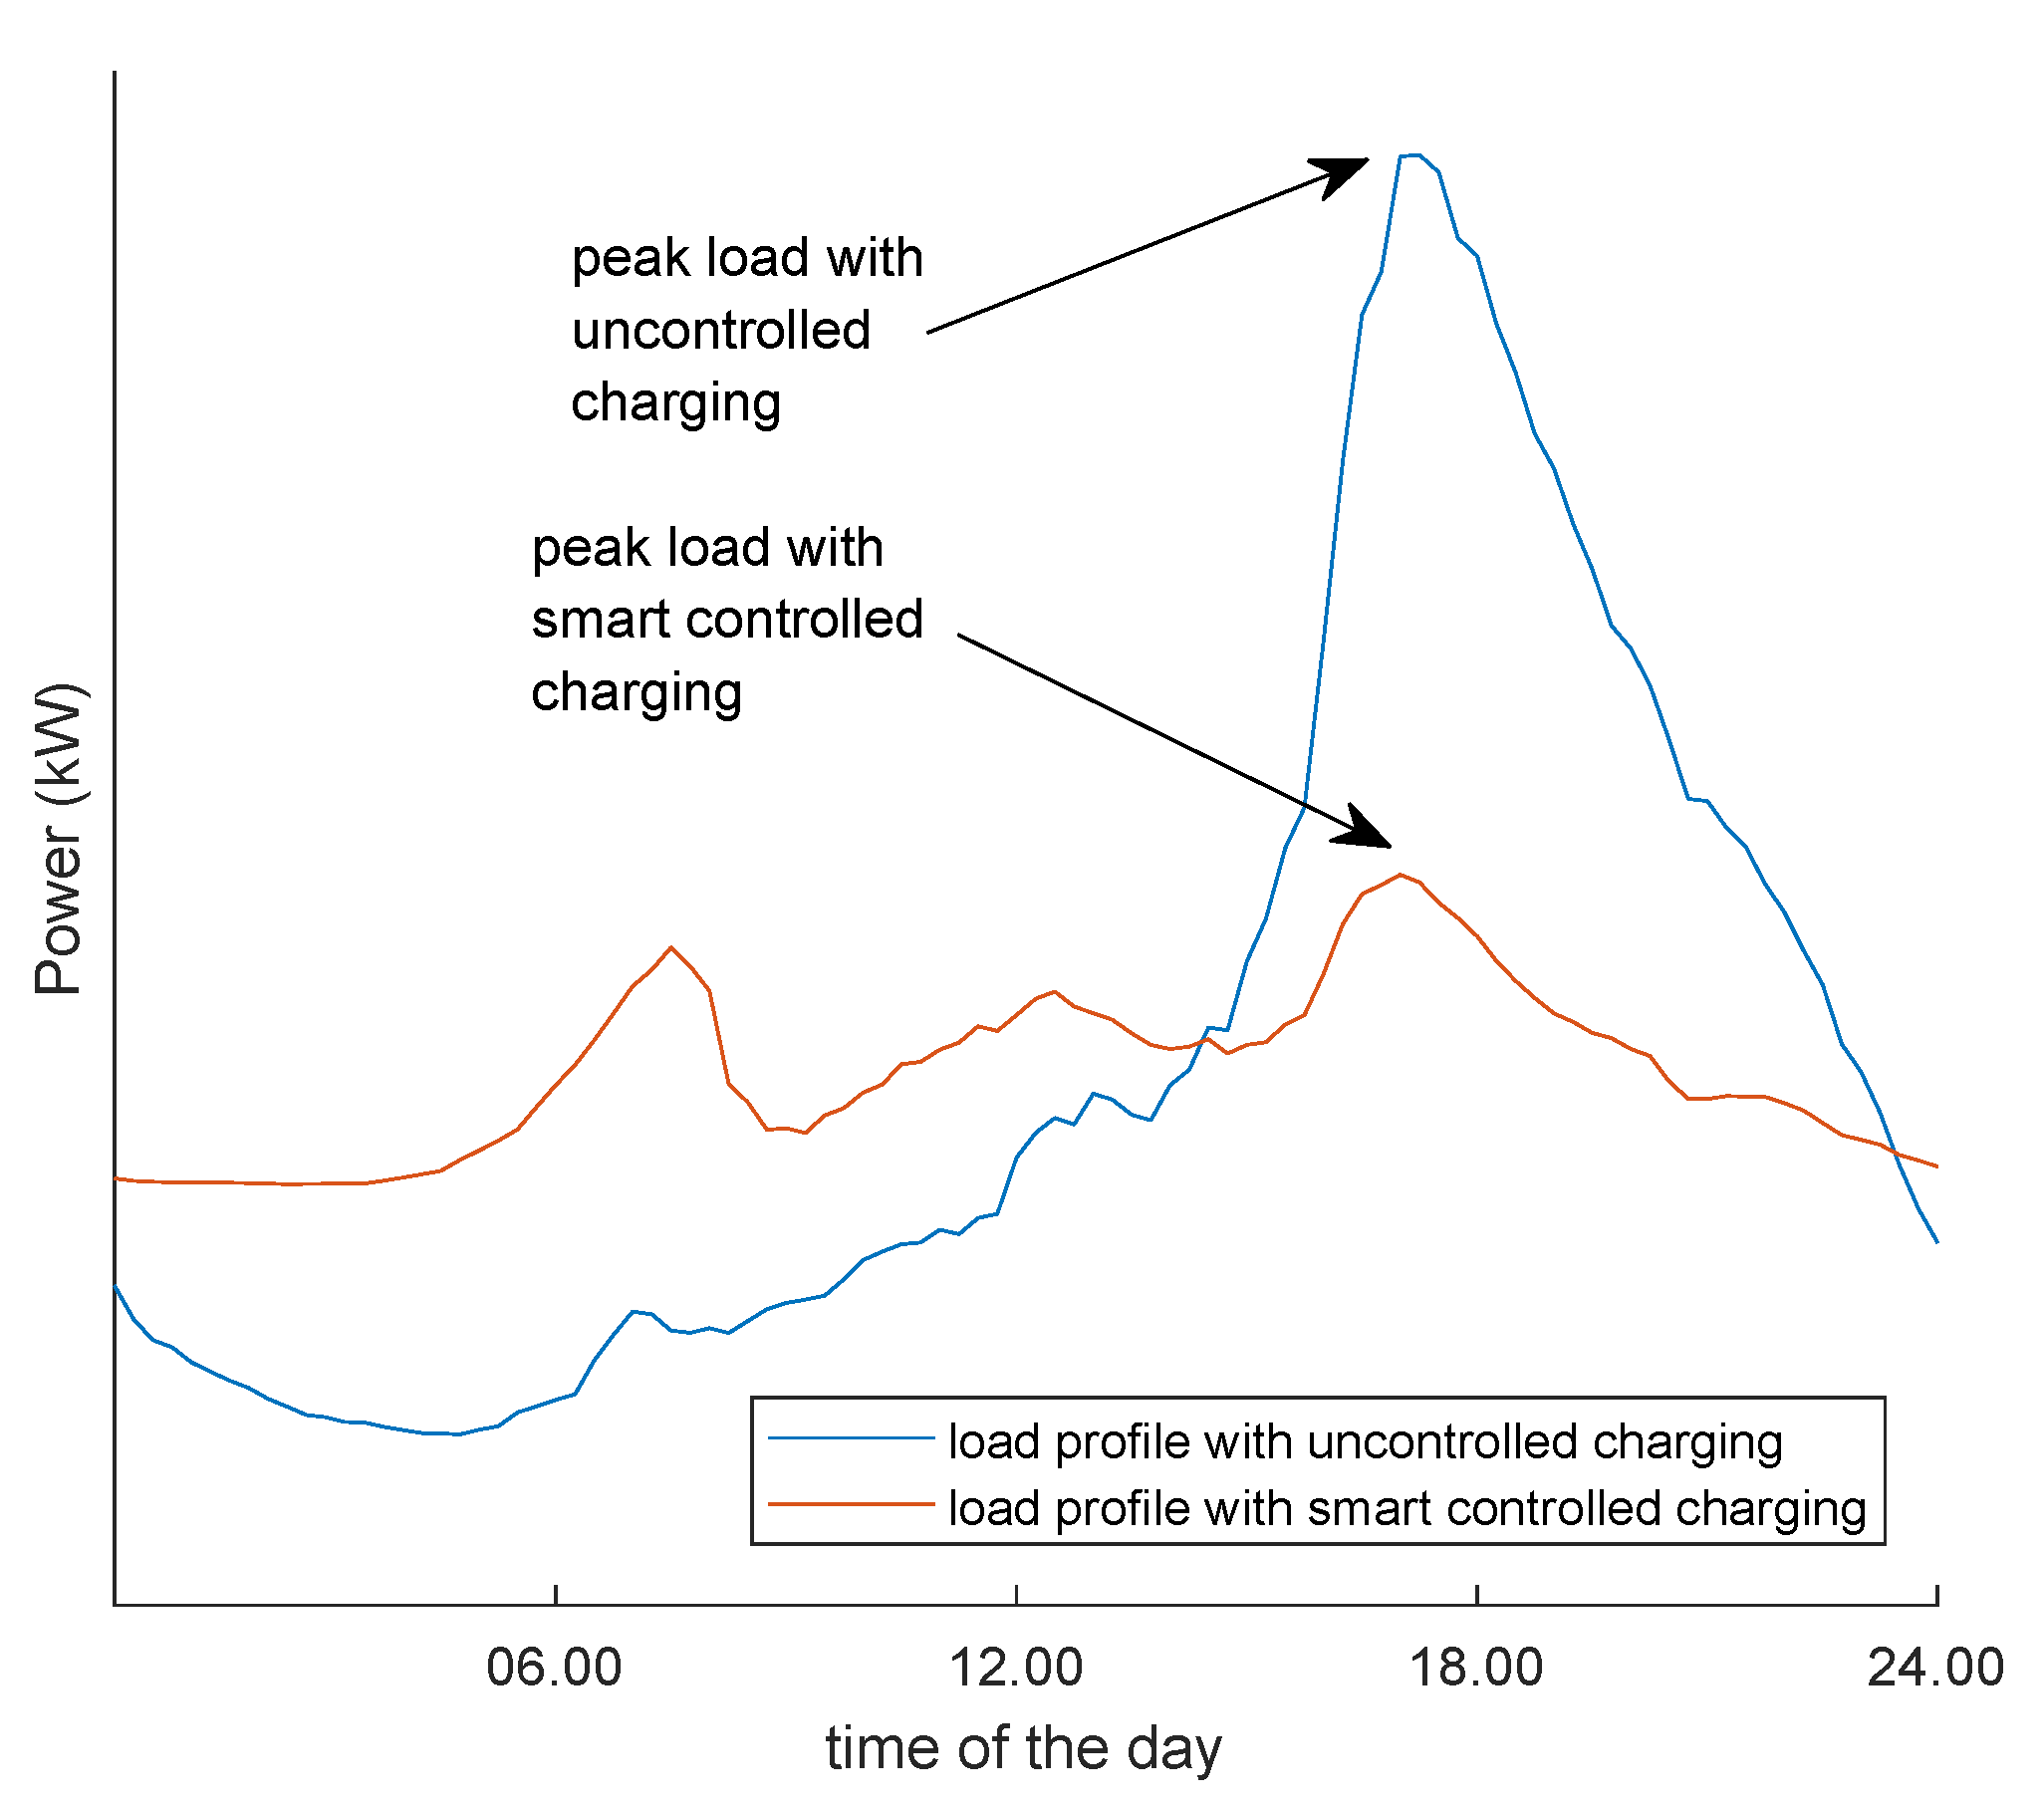
2.1.1. Uncontrolled Charging
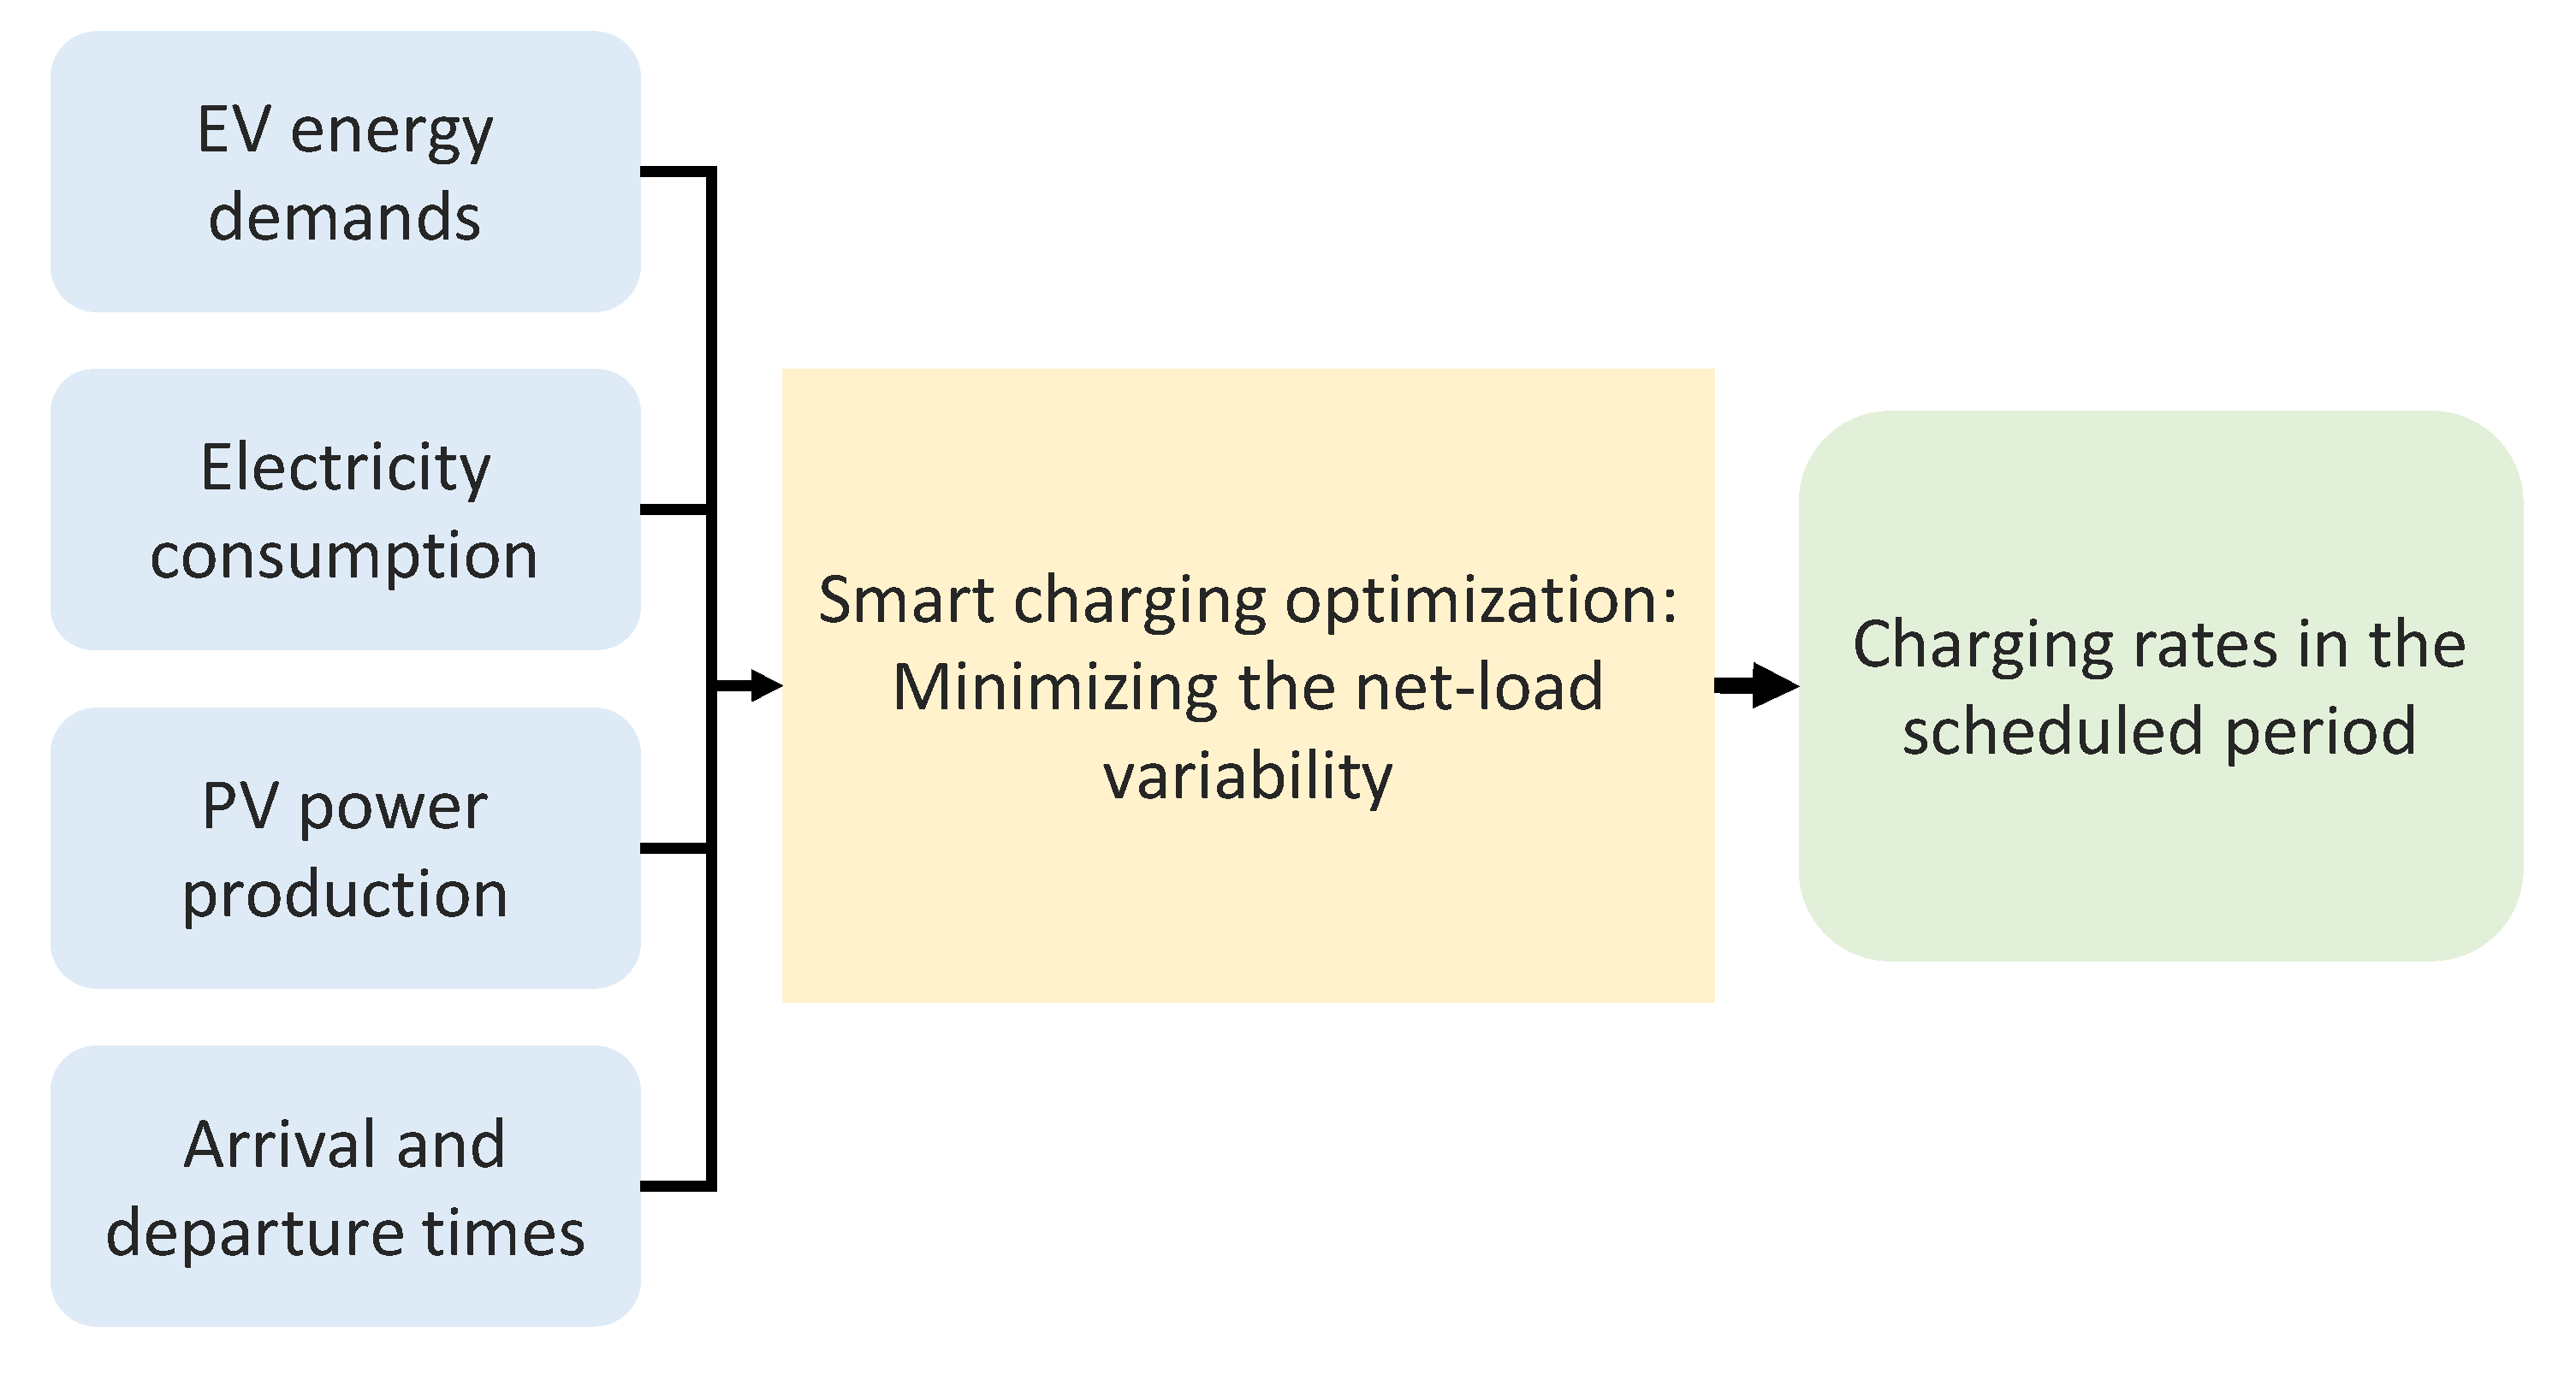
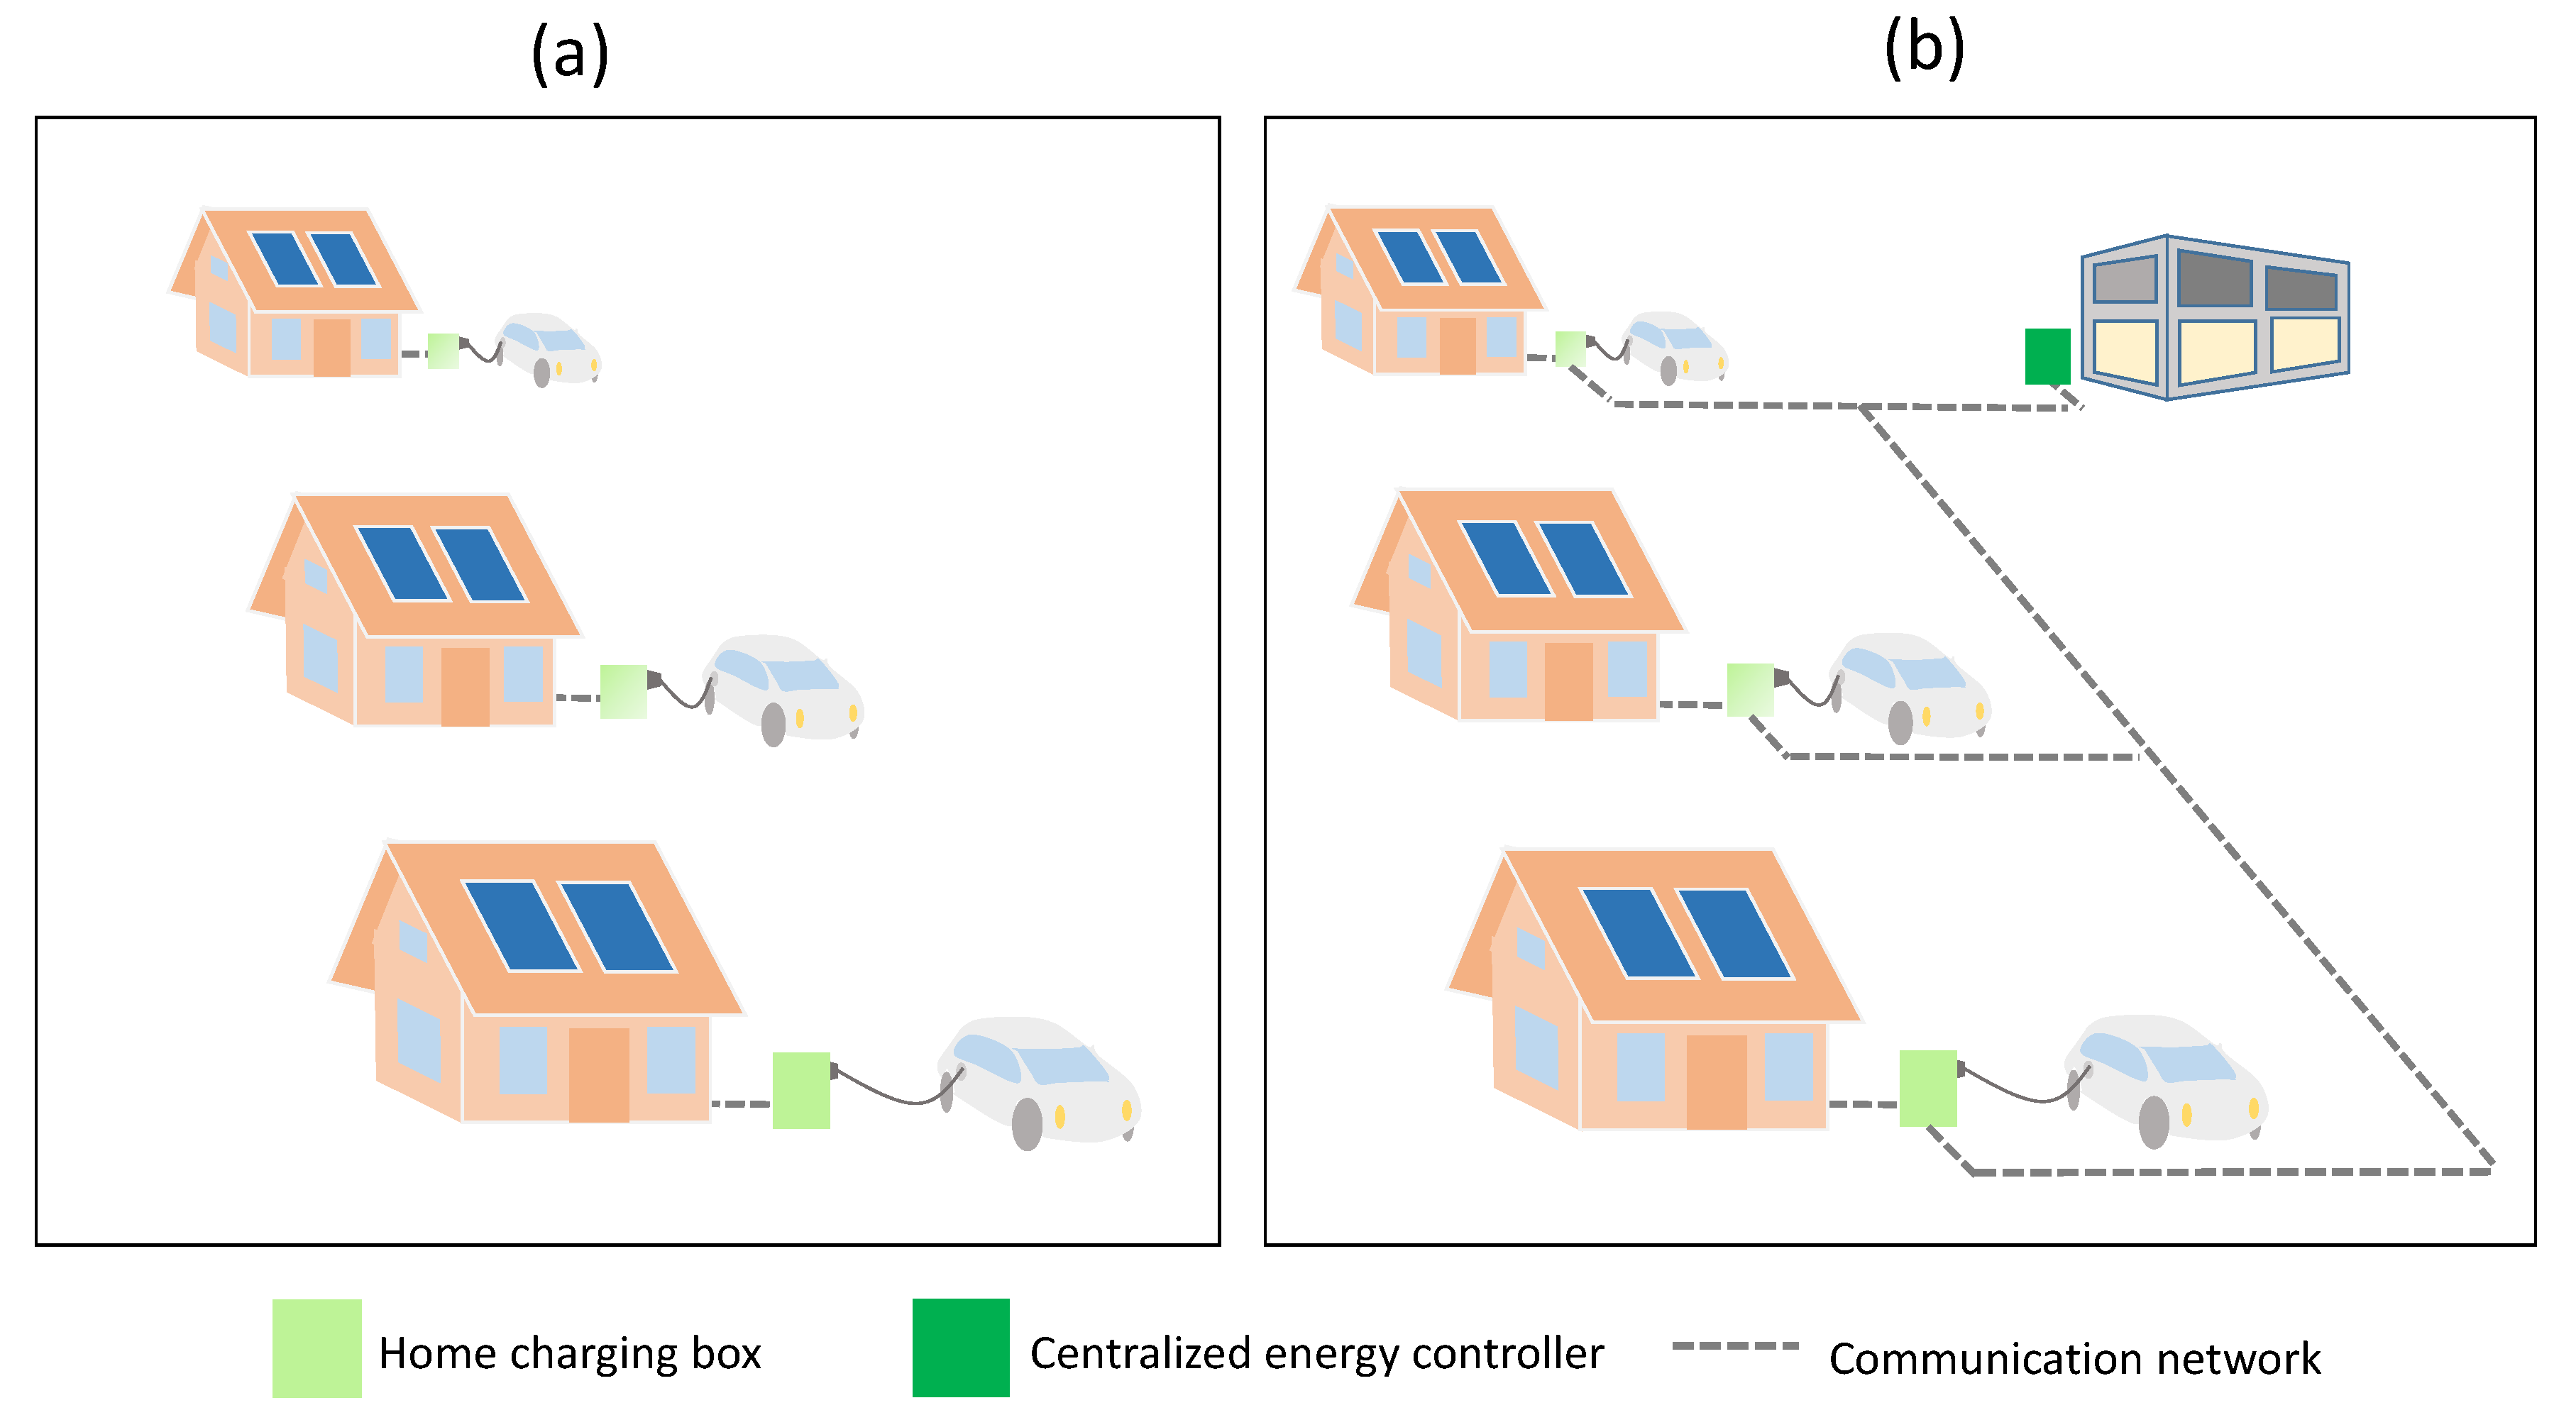
2.1.2. Distributed/Local Smart Charging
2.1.3. Centralized Smart Charging
2.2. Data and Case Study
2.2.1. Residential Household Load
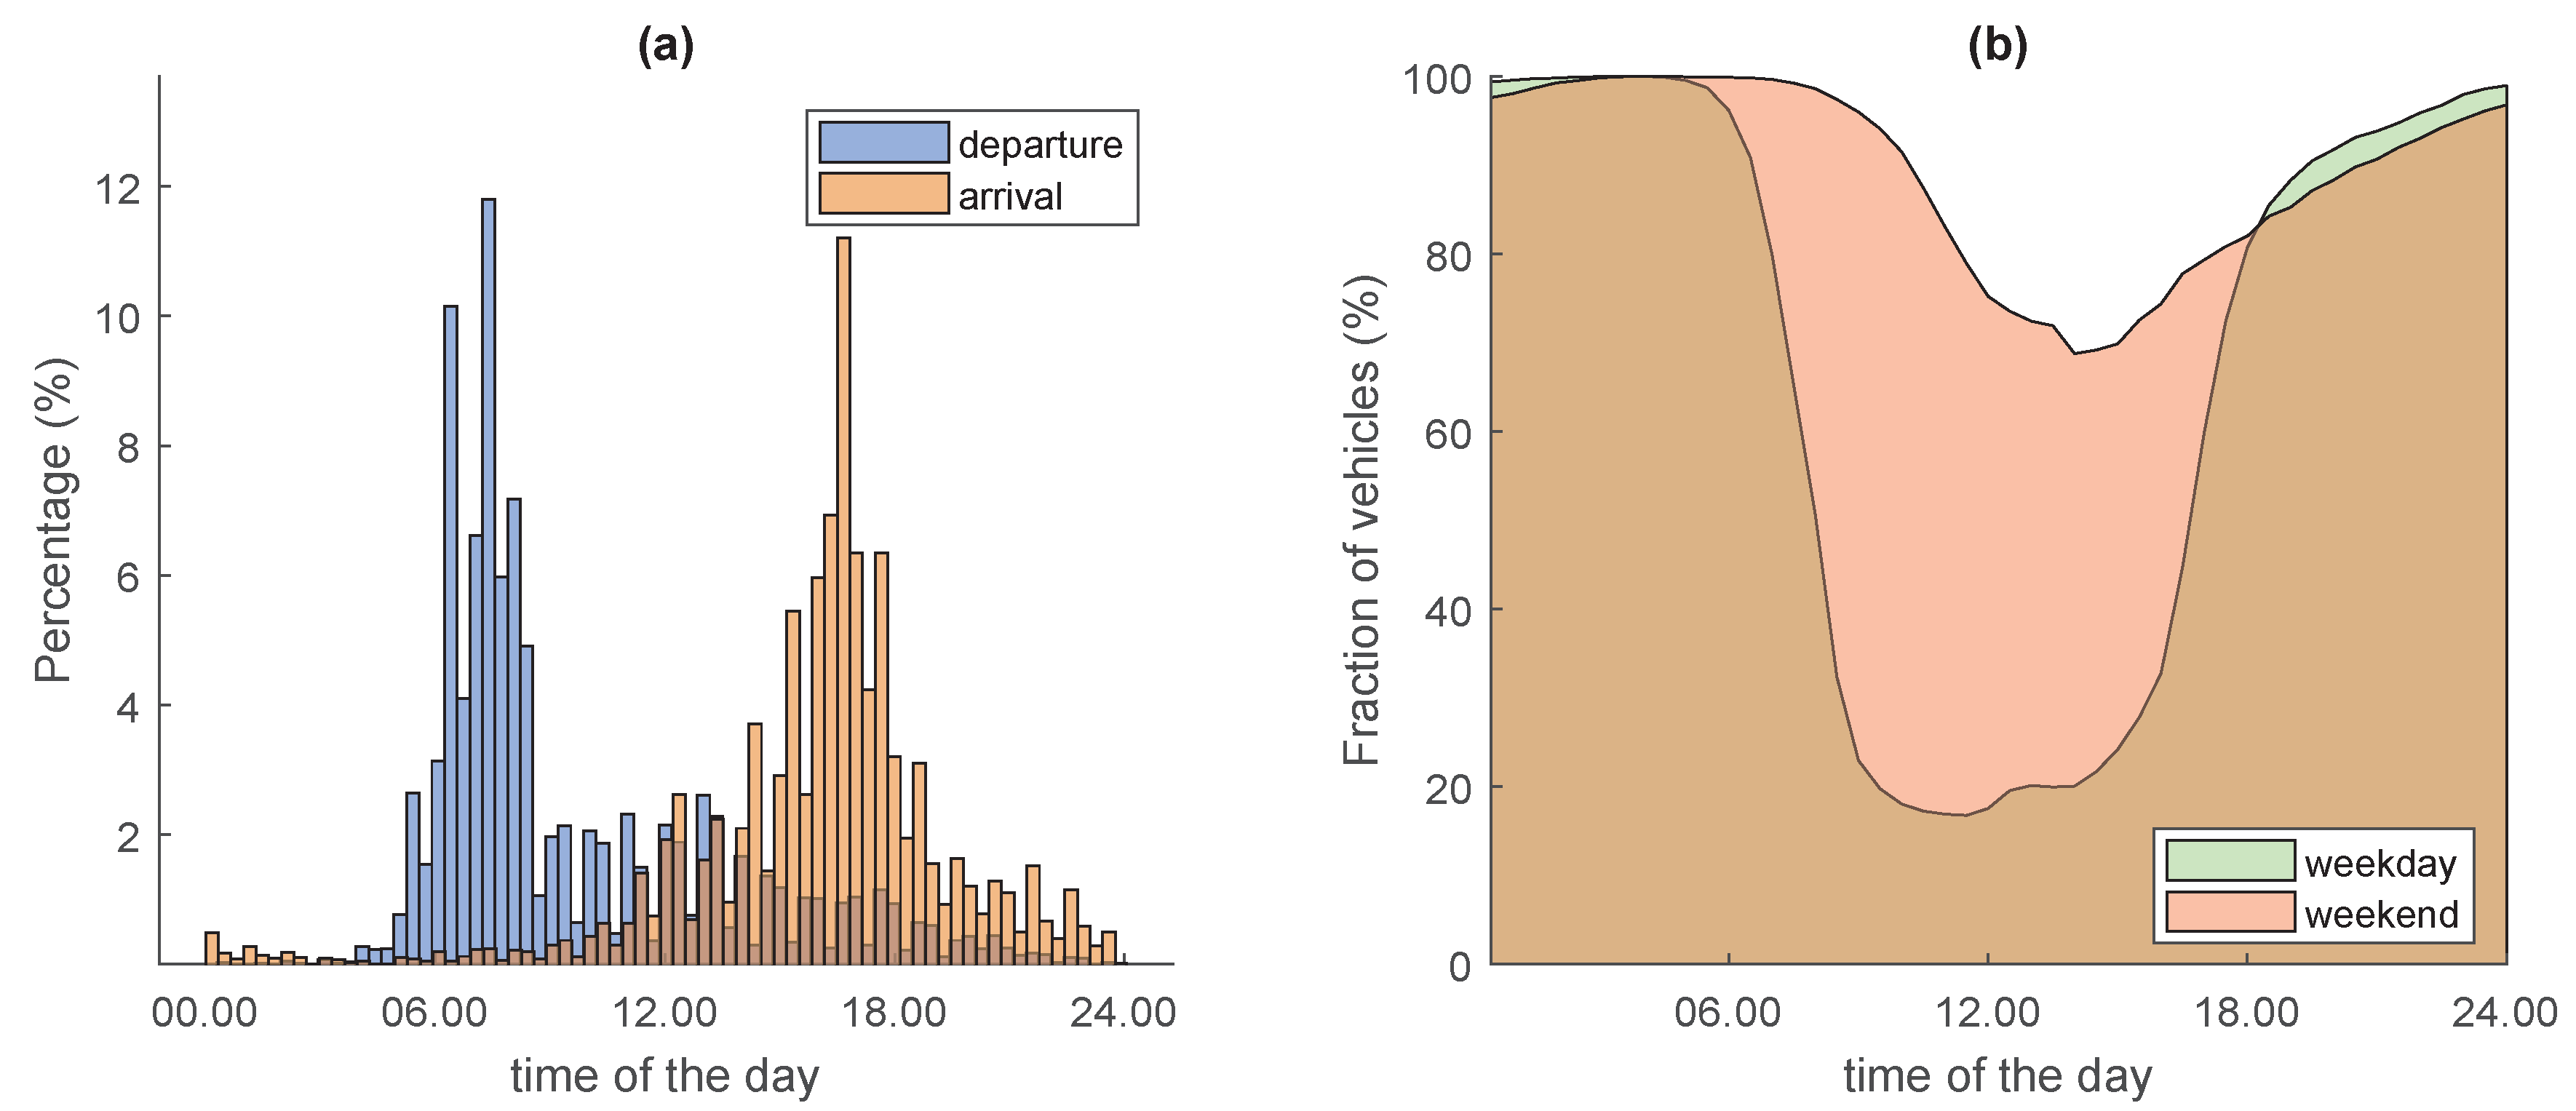
2.2.2. Mobility Patterns and Daily Charging Demands
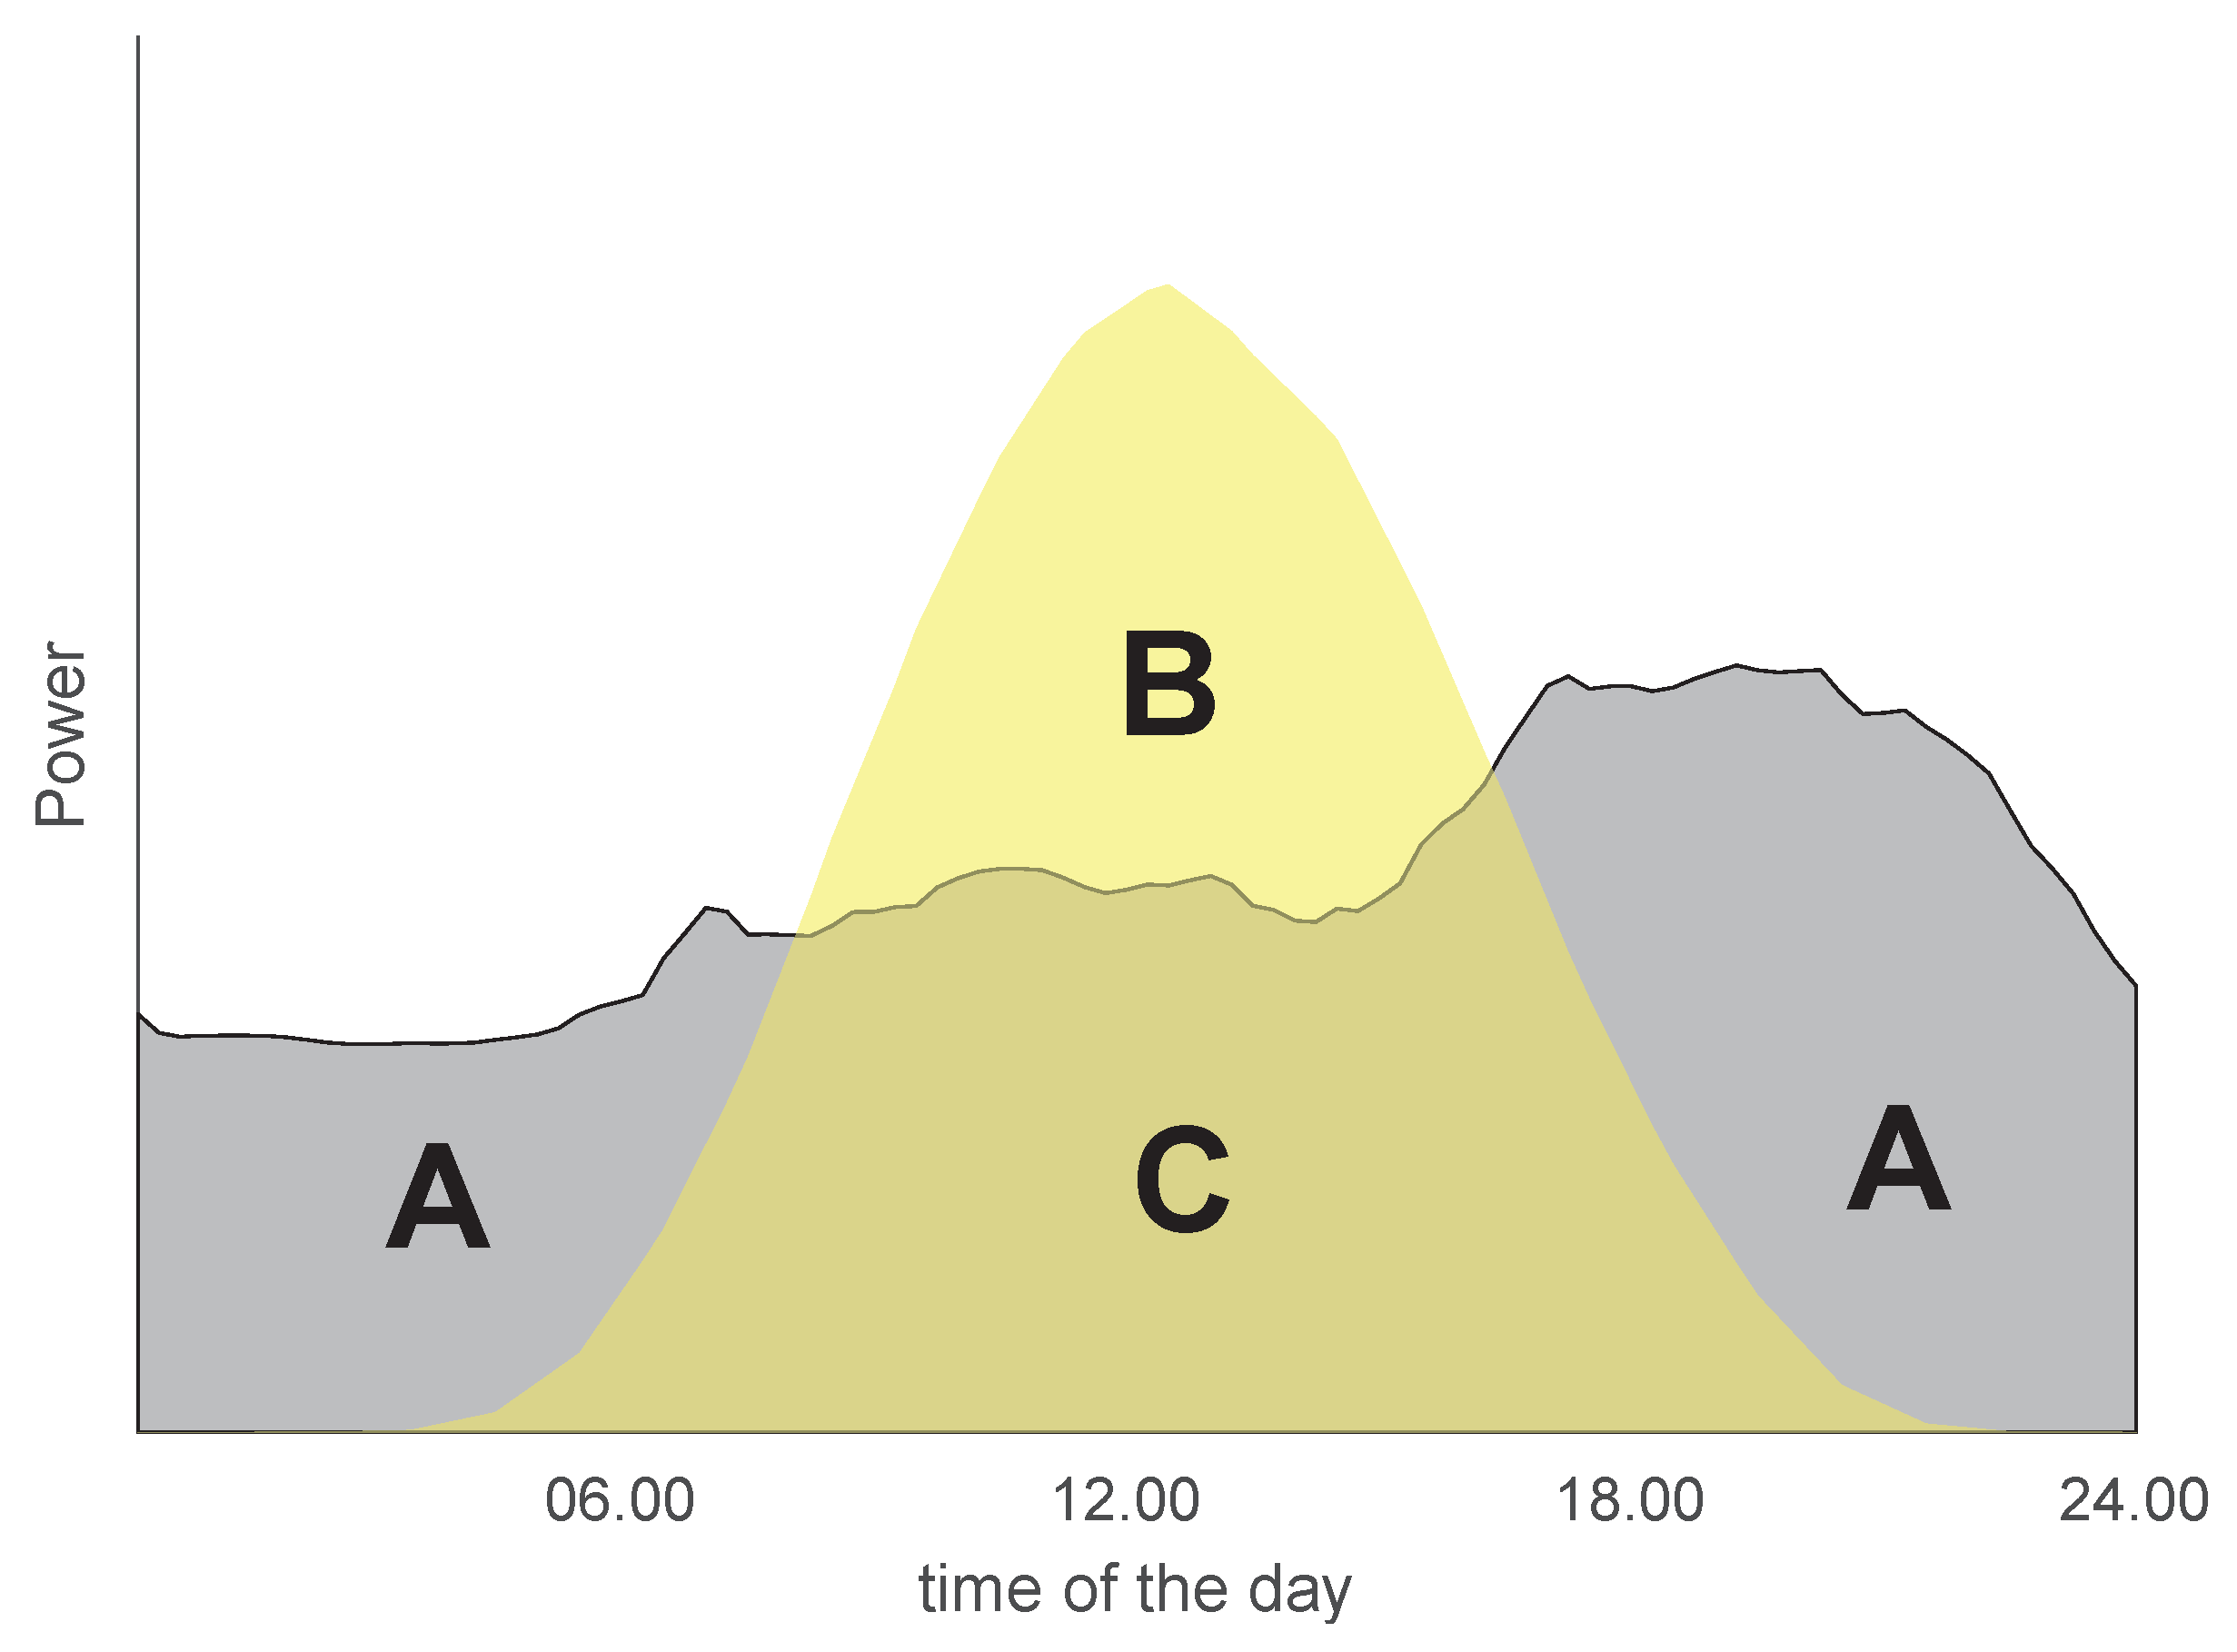
2.2.3. Solar PV Power Production
2.3. Definitions and Measures
2.3.1. PV Self-Consumption and Self-Sufficiency
2.3.2. Peak Load Reduction
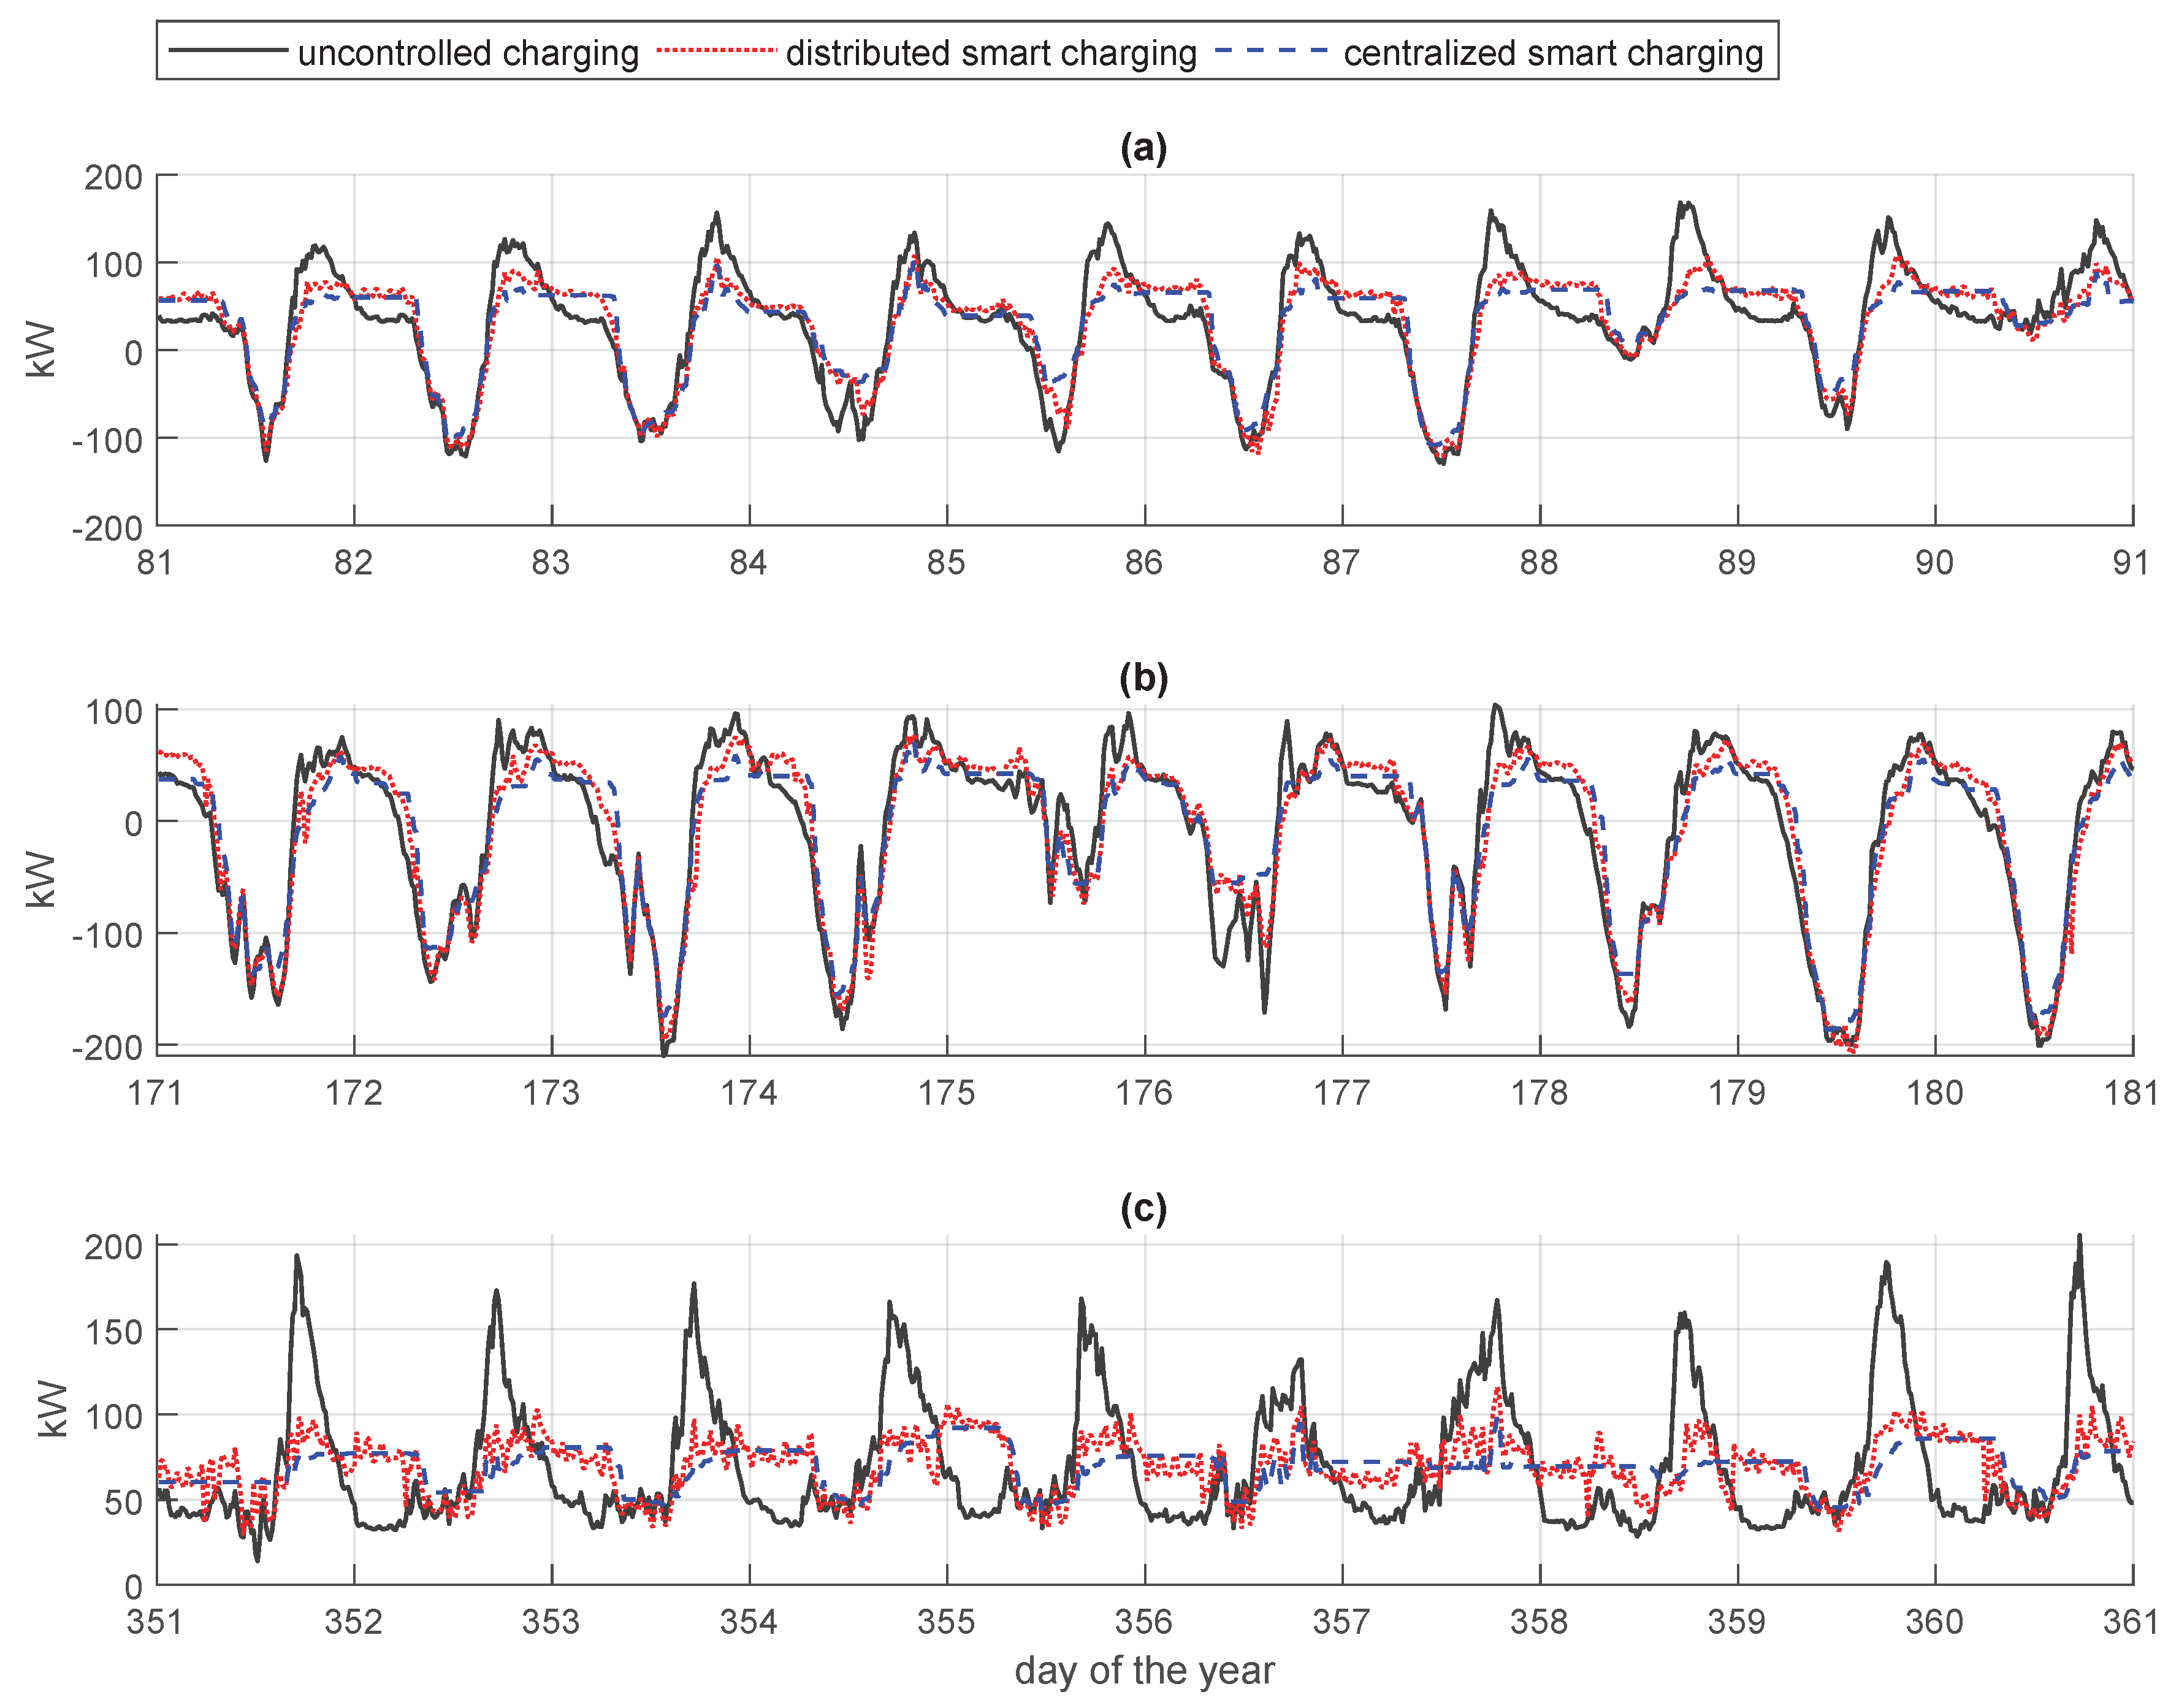
2.3.3. Net Load Variability
3. Results
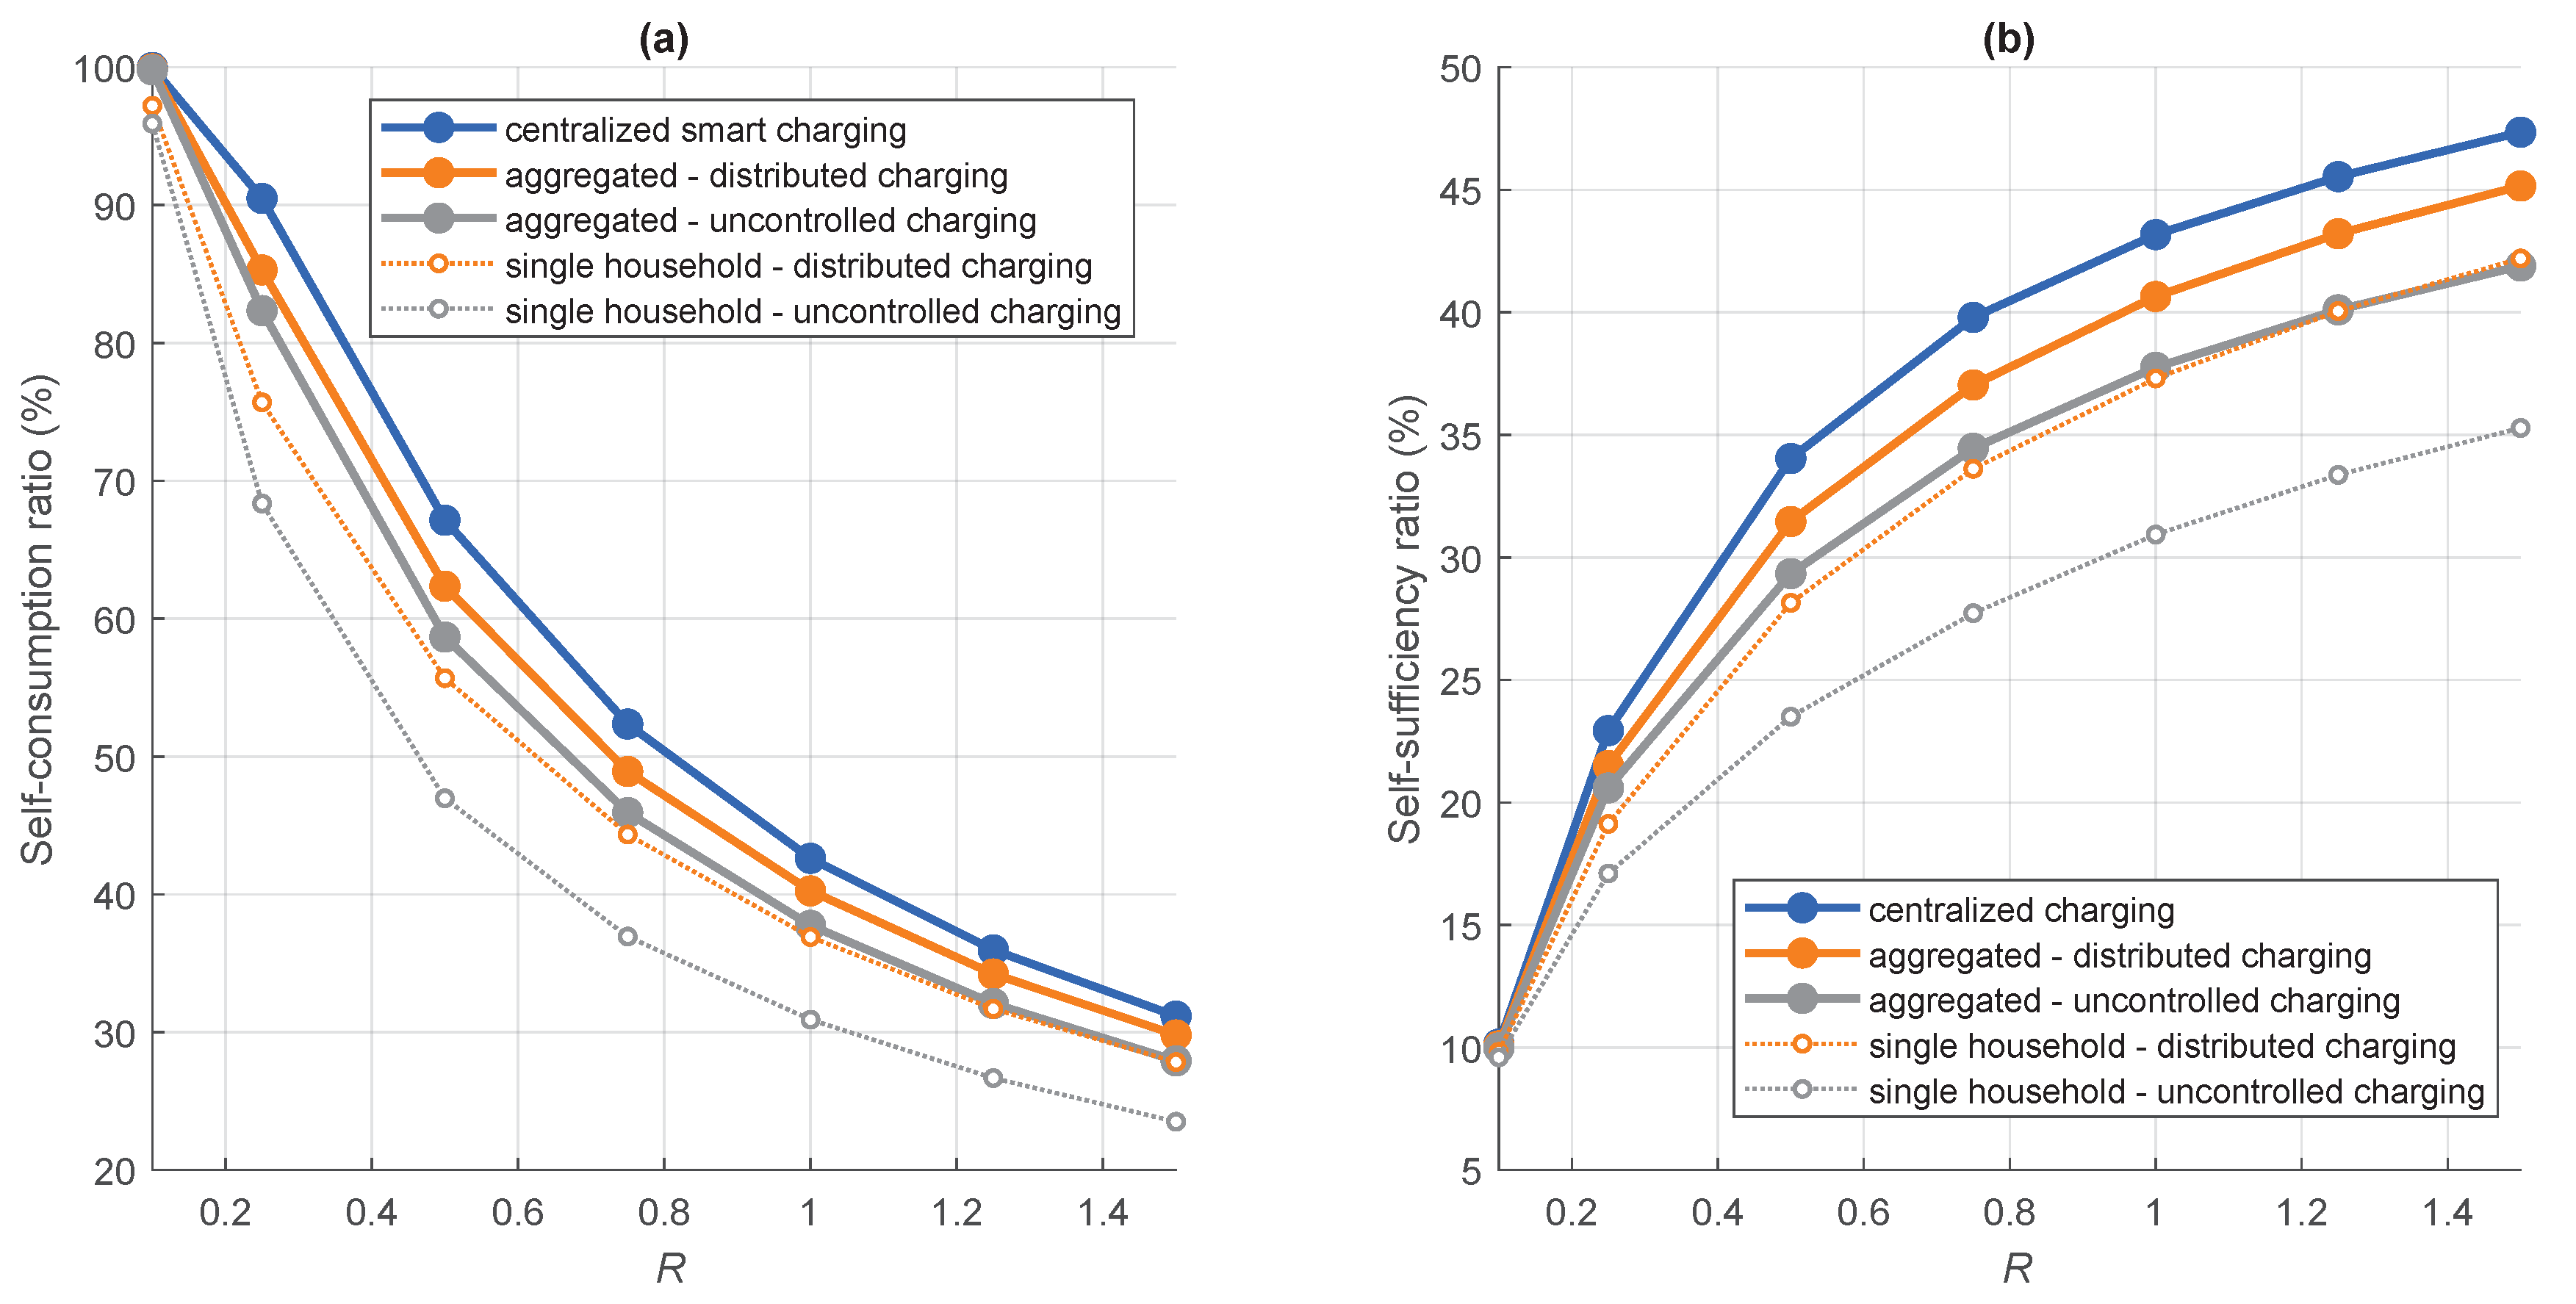
3.1. PV Self-Consumption and Self-Sufficiency
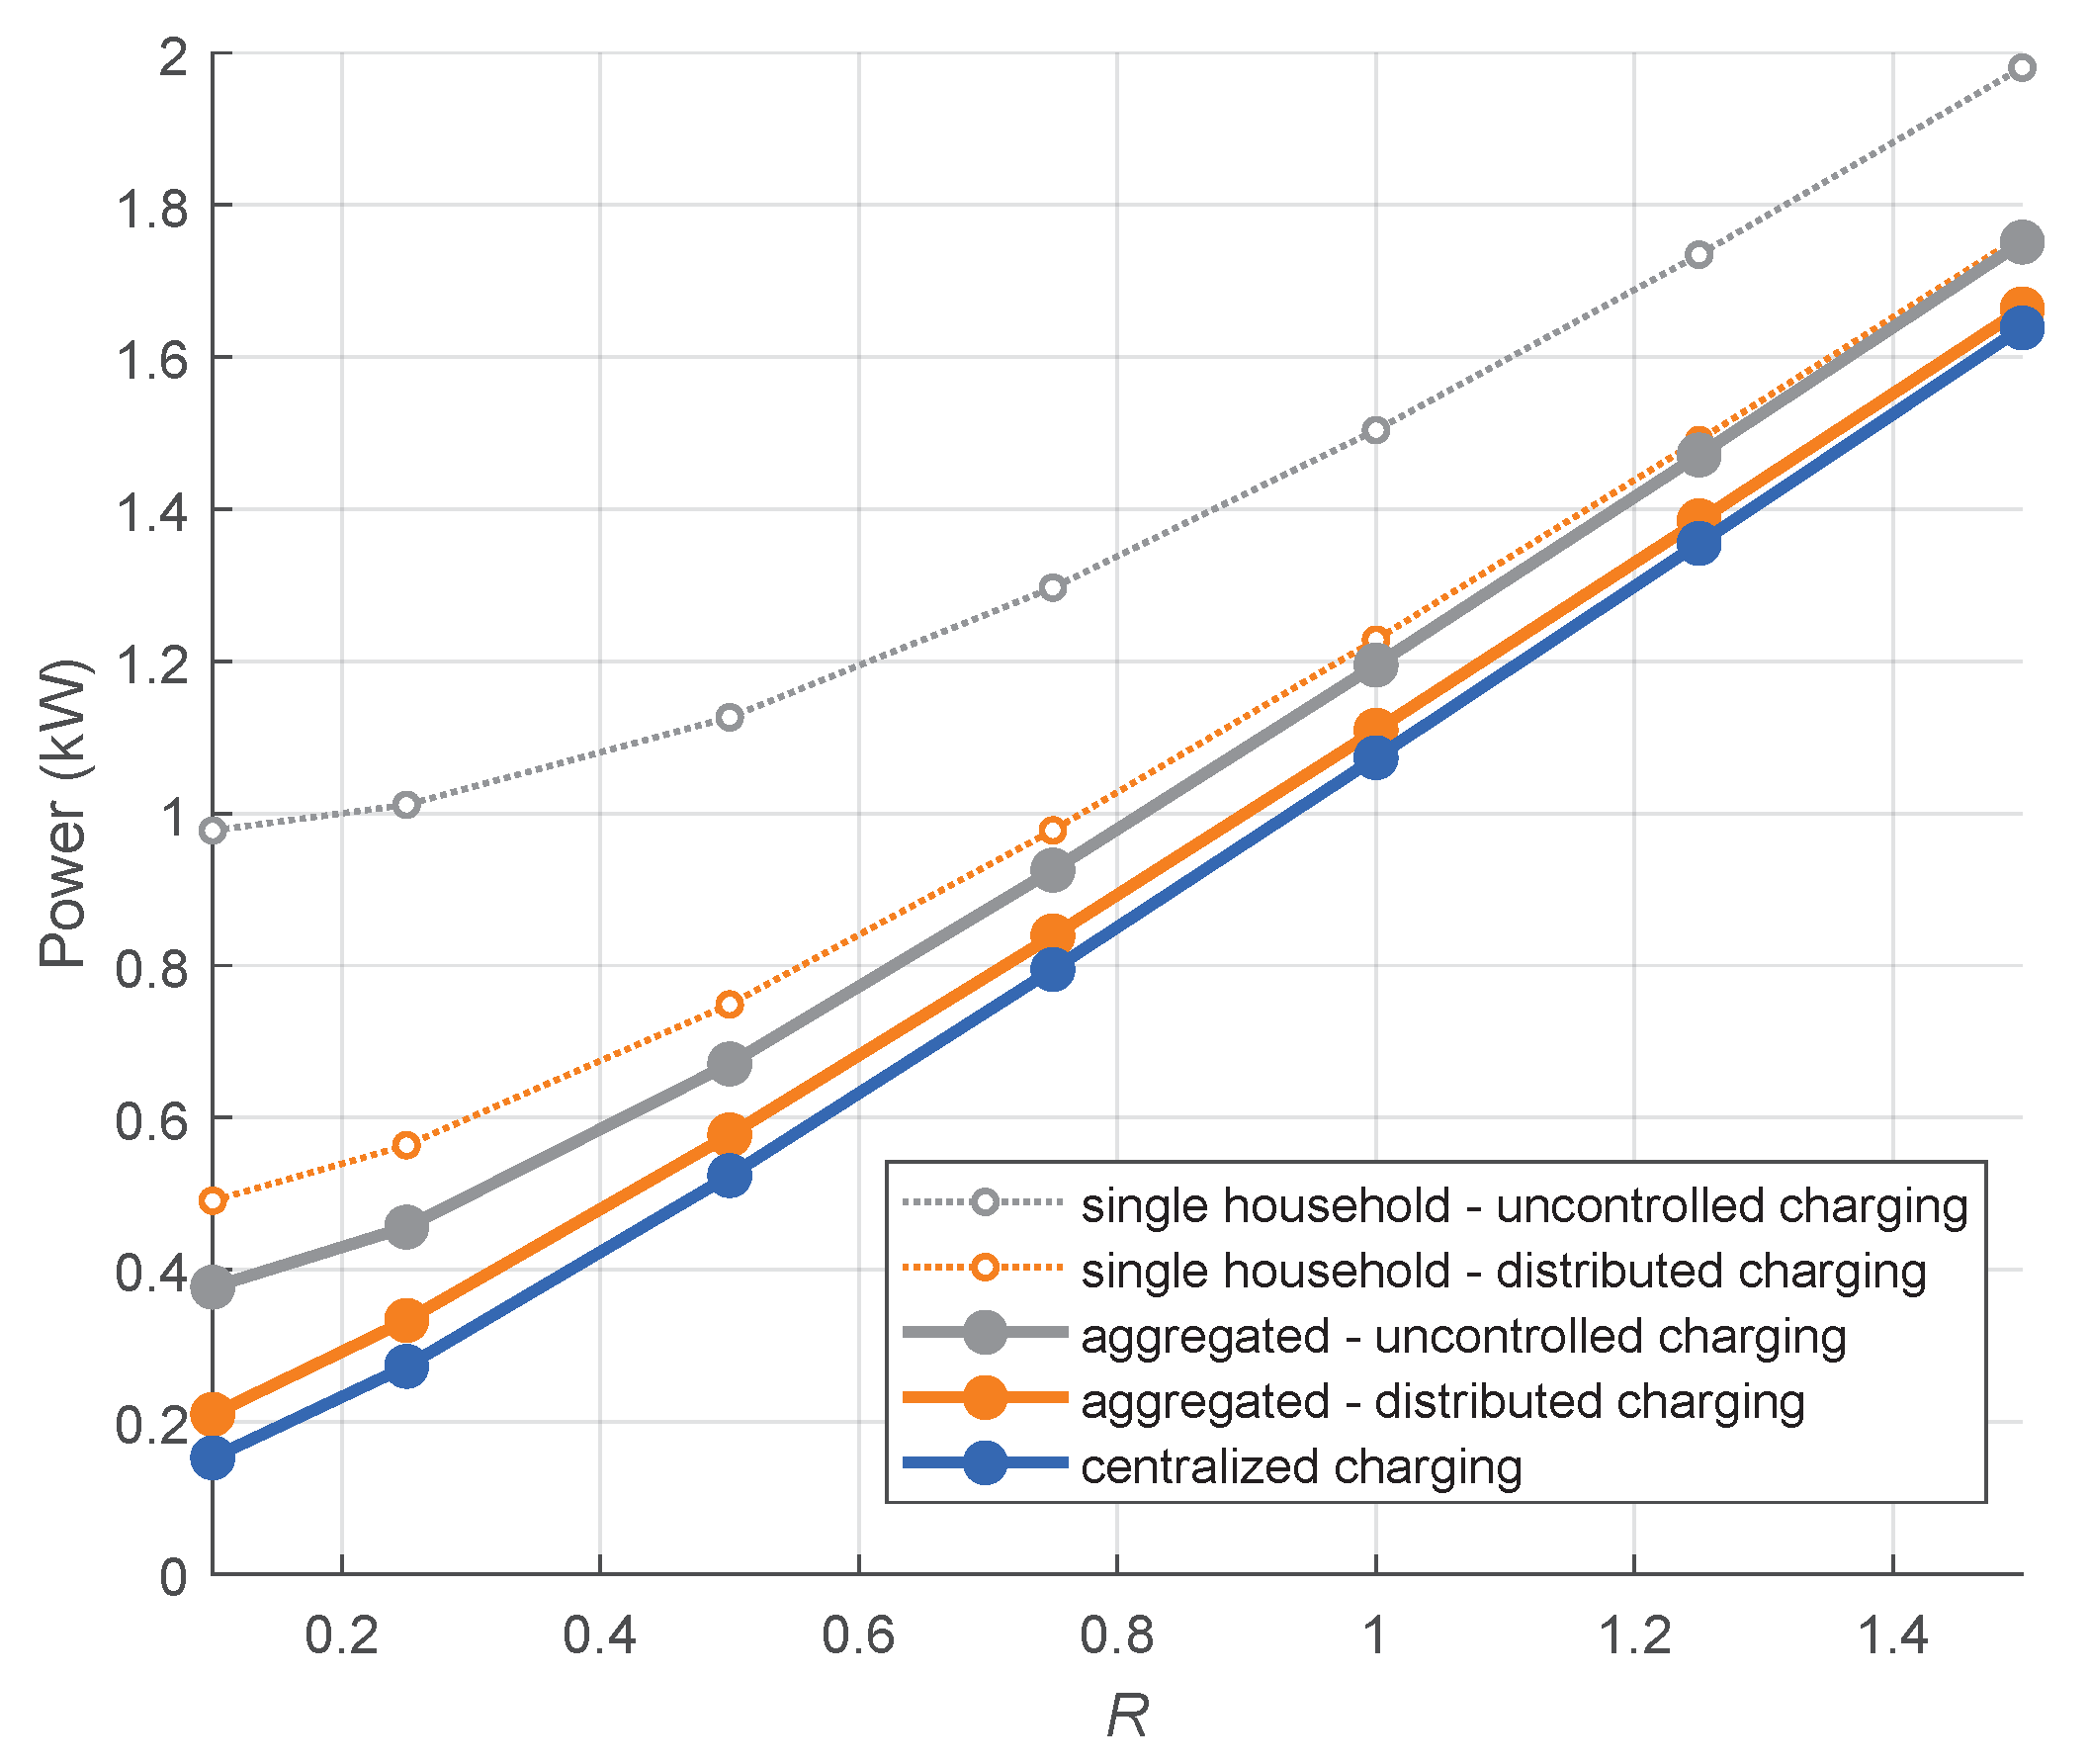
3.2. Peak Load Reduction
3.3. Net Load Variability
4. Concluding Discussion
- Self-consumption and self-sufficiency in residential buildings could be improved with EV charging schemes; however, the improvements were limited by low vehicle occupancy adjacent to the buildings during the period of high solar power production.
- Self-consumption and self-sufficiency improvements by the distributed smart charging scheme on the aggregate level were lower than for a single household. This was due to the fact that the aggregation of multiple households already improved self-consumption and self-sufficiency, leaving less room for the smart charging scheme to improve the performance.
- On the community level, the centralized charging scheme was superior at improving self-consumption and self-sufficiency compared with the distributed charging scheme.
- The higher the PV power share, the higher the load variability due to unconsumed PV power. The improvement in load variability by the smart charging schemes became less significant with higher PV power share.
Author Contributions
Funding
Acknowledgments
Conflicts of Interest
References
- Intergovernmental Panel on Climate Change (IPCC). Global Warming of 1.5 °C; Technical Report; Intergovernmental Panel on Climate Change: Geneva, Switzerland, 2019. [Google Scholar]
- Intergovernmental Panel on Climate Change (IPCC). Climate Change 2014 Mitigation of Climate Change; Technical Report; Intergovernmental Panel on Climate Change: Geneva, Switzerland, 2014. [Google Scholar]
- Tran, M.; Banister, D.; Bishop, J.D.; McCulloch, M.D. Realizing the electric-vehicle revolution. Nat. Clim. Chang. 2012, 2, 328–333. [Google Scholar] [CrossRef]
- International Energy Agency. Global Energy & CO2 Status Report; Technical Report; International Energy Agency: Paris, France, 2017. [Google Scholar]
- García-Villalobos, J.; Zamora, I.; San Martín, J.I.; Asensio, F.J.; Aperribay, V. Plug-in electric vehicles in electric distribution networks: A review of smart charging approaches. Renew. Sustain. Energy Rev. 2014, 38, 717–731. [Google Scholar] [CrossRef]
- Luthander, R.; Shepero, M.; Munkhammar, J.; Widén, J. Photovoltaics and opportunistic electric vehicle charging in the power system – a case study on a Swedish distribution grid. IET Renew. Power Gener. 2019, 13, 710–716. [Google Scholar] [CrossRef]
- Barone, G.; Buonomano, A.; Calise, F.; Forzano, C.; Palombo, A. Building to vehicle to building concept toward a novel zero energy paradigm: Modelling and case studies. Renew. Sustain. Energy Rev. 2019, 101, 625–648. [Google Scholar] [CrossRef]
- Luthander, R.; Nilsson, A.M.; Widén, J.; Åberg, M. Graphical analysis of photovoltaic generation and load matching in buildings: A novel way of studying self-consumption and self-sufficiency. Appl. Energy 2019, 250, 748–759. [Google Scholar] [CrossRef]
- Luthander, R.; Widén, J.; Nilsson, D.; Palm, J. Photovoltaic self-consumption in buildings: A review. Appl. Energy 2015, 142, 80–94. [Google Scholar] [CrossRef]
- Finn, P.; Fitzpatrick, C.; Connolly, D. Demand side management of electric car charging: Benefits for consumer and grid. Energy 2012, 42, 358–363. [Google Scholar] [CrossRef]
- Rinaldi, S.; Pasetti, M.; Sisinni, E.; Bonafini, F.; Ferrari, P.; Rizzi, M.; Flammini, A. On the mobile communication requirements for the demand-side management of electric vehicles. Energies 2018, 11, 1220. [Google Scholar] [CrossRef]
- Nyholm, E.; Goop, J.; Odenberger, M.; Johnsson, F. Solar photovoltaic-battery systems in Swedish households – Self-consumption and self-sufficiency. Appl. Energy 2016, 183, 148–159. [Google Scholar] [CrossRef]
- Parra, D.; Walker, G.S.; Gillott, M. Modeling of PV generation, battery and hydrogen storage to investigate the benefits of energy storage for single dwelling. Sustain. Cities Soc. 2014, 10, 1–10. [Google Scholar] [CrossRef]
- Gustafsson, M.; Karlsson, B.; Rönnelid, M. How the electric meter configuration affect the monitored amount of self-consumed and produced excess electricity from PV systems—Case study in Sweden. Energy Build. 2017, 138, 60–68. [Google Scholar] [CrossRef]
- Widén, J. Improved photovoltaic self-consumption with appliance scheduling in 200 single-family buildings. Appl. Energy 2014, 126, 199–212. [Google Scholar] [CrossRef]
- Vanhoudt, D.; Geysen, D.; Claessens, B.; Leemans, F.; Jespers, L.; Van Bael, J. An actively controlled residential heat pump: Potential on peak shaving and maximization of self-consumption of renewable energy. Renew. Energy 2014, 63, 531–543. [Google Scholar] [CrossRef]
- Castillo-Cagigal, M.; Caamaño-Martín, E.; Matallanas, E.; Masa-Bote, D.; Gutiérrez, A.; Monasterio-Huelin, F.; Jiménez-Leube, J. PV self-consumption optimization with storage and Active DSM for the residential sector. Sol. Energy 2011, 85, 2338–2348. [Google Scholar] [CrossRef]
- Munkhammar, J.; Grahn, P.; Widén, J. Quantifying self-consumption of on-site photovoltaic power generation in households with electric vehicle home charging. Sol. Energy 2013, 97, 208–216. [Google Scholar] [CrossRef]
- Muratori, M. Impact of uncoordinated plug-in electric vehicle charging on residential power demand. Nat. Energy 2018, 3, 193–201. [Google Scholar] [CrossRef]
- Hoarau, Q.; Perez, Y. Interactions between electric mobility and photovoltaic generation: A review. Renew. Sustain. Energy Rev. 2018, 94, 510–522. [Google Scholar] [CrossRef]
- Pasaoglu, G.; Fiorello, D.; Martino, A.; Zani, L.; Zubaryeva, A.; Thiel, C. Travel patterns and the potential use of electric cars - Results from a direct survey in six European countries. Technol. Forecast. Soc. Chang. 2014, 87, 51–59. [Google Scholar] [CrossRef]
- Pearre, N.S.; Ribberink, H. Review of research on V2X technologies, strategies, and operations. Renew. Sustain. Energy Rev. 2019, 105, 61–70. [Google Scholar] [CrossRef]
- Turker, H.; Hably, A.; Bacha, S.; Chatroux, D. Rule based algorithm for Plug-in Hybrid Electric Vehicles (PHEVs) integration in residential electric grid areas. In Proceedings of the 2012 IEEE PES Innovative Smart Grid Technologies (ISGT), Washington, DC, USA, 16–20 January 2012; pp. 1–7. [Google Scholar] [CrossRef]
- Turker, H.; Hably, A.; Bacha, S. Smart charging of plug-in hybrid electric vehicles (PHEVs) on the residential electric grid regarding the voltage plan. In Proceedings of the 2013 IEEE International Electric Vehicle Conference (IEVC), Santa Clara, CA, USA, 23–25 October 2013; pp. 5173–5178. [Google Scholar] [CrossRef]
- Jian, L.; Xue, H.; Xu, G.; Zhu, X.; Zhao, D.; Shao, Z.Y. Regulated charging of plug-in hybrid electric vehicles for minimizing load variance in household smart microgrid. IEEE Trans. Ind. Electron. 2013, 60, 3218–3226. [Google Scholar] [CrossRef]
- Mets, K.; Verschueren, T.; Haerick, W.; Develder, C.; De Turck, F. Optimizing smart energy control strategies for plug-in hybrid electric vehicle charging. In Proceedings of the 2010 IEEE/IFIP Network Operations and Management Symposium Workshops, Osaka, Japan, 19–23 April 2010; pp. 293–299. [Google Scholar] [CrossRef]
- Mets, K.; Verschueren, T.; De Turck, F.; Develder, C. Exploiting V2G to optimize residential energy consumption with electrical vehicle (dis)charging. In Proceedings of the 2011 IEEE First International Workshop on Smart Grid Modeling and Simulation (SGMS), Brussels, Belgium, 17 October 2011; pp. 7–12. [Google Scholar] [CrossRef]
- Van Der Meer, D.; Mouli, G.R.C.; Mouli, G.M.E.; Elizondo, L.R.; Bauer, P. Energy Management System with PV Power Forecast to Optimally Charge EVs at the Workplace. IEEE Trans. Ind. Inform. 2018, 14, 311–320. [Google Scholar] [CrossRef]
- Liu, N.; Chen, Q.; Liu, J.; Lu, X.; Li, P.; Lei, J.; Zhang, J. A Heuristic Operation Strategy for Commercial Building Microgrids Containing EVs and PV System. IEEE Trans. Ind. Electron. 2015, 62, 2560–2570. [Google Scholar] [CrossRef]
- Zhang, T.; Chu, C.C.; Gadh, R. A two-tier energy management system for smart electric vehicle charging in UCLA: A Solar-To-Vehicle (S2V) case study. In Proceedings of the 2016 IEEE Innovative Smart Grid Technologies - Asia (ISGT-Asia), Melbourne, Australia, 28 November–1 December 2016; pp. 288–293. [Google Scholar] [CrossRef]
- Galus, M.D.; Vayá, M.G.; Krause, T.; Andersson, G. The role of electric vehicles in smart grids. Wiley Interdiscip. Rev. Energy Environ. 2013, 2, 384–400. [Google Scholar] [CrossRef]
- Amjad, M.; Ahmad, A.; Rehmani, M.H.; Umer, T. A review of EVs charging: From the perspective of energy optimization, optimization approaches, and charging techniques. Transp. Res. Part D Transp. Environ. 2018, 62, 386–417. [Google Scholar] [CrossRef]
- Jakobsson, N.; Gnann, T.; Plötz, P.; Sprei, F.; Karlsson, S. Are multi-car households better suited for battery electric vehicles? - Driving patterns and economics in Sweden and Germany. Transp. Res. Part C Emerg. Technol. 2016, 65, 1–15. [Google Scholar] [CrossRef]
- Sears, J.; Roberts, D.; Glitman, K. A comparison of electric vehicle Level 1 and Level 2 charging efficiency. In Proceedings of the 2014 IEEE Conference on Technologies for Sustainability (SusTech), Portland, OR, USA, 24–26 July 2014; pp. 255–258. [Google Scholar] [CrossRef]
- Luthander, R. Self-Consumption of Photovoltaic Electricity in Residential Buildings; Uppsala University: Uppsala, Sweden, 29 November 2018. [Google Scholar]
- Jordehi, A.R. Optimisation of demand response in electric power systems, a review. Renew. Sustain. Energy Rev. 2019, 103, 308–319. [Google Scholar] [CrossRef]
- Van der Meer, D.W.; Widén, J.; Munkhammar, J. Review on probabilistic forecasting of photovoltaic power production and electricity consumption. Renew. Sustain. Energy Rev. 2018, 81, 1484–1512. [Google Scholar] [CrossRef]
- Quadratic Programming- MATLAB Quadprog- MathWorks Nordic. Available online: https://se.mathworks.com/help/optim/ug/quadprog.html (accessed on 20 February 2020).
- Widén, J.; Lundh, M.; Vassileva, I.; Dahlquist, E.; Ellegård, K.; Wäckelgård, E. Constructing load profiles for household electricity and hot water from time-use data–Modelling approach and validation. Energy Build. 2009, 41, 753–768. [Google Scholar] [CrossRef]
- Widén, J.; Wäckelgård, E. A high-resolution stochastic model of domestic activity patterns and electricity demand. Appl. Energy 2010, 87, 1880–1892. [Google Scholar] [CrossRef]
- RES 2005 – 2006 The National Travel Survey; Technical Report No. 2007:19; Swedish Institute for Transport and Communications Analysis, SIKA: Stockholm, Swedish, 2007.
- Swedish Meteorology and Hydrology Institute. 2018. Available online: https://www.smhi.se/data/meteorologi/ladda-ner-meteorologiska-observationer#param=globalIrradians,stations=all,stationid=98735 (accessed on 10 March 2019).
- Van der Meer, D.W.; Munkhammar, J.; Widén, J. Probabilistic forecasting of solar power, electricity consumption and net load: Investigating the effect of seasons, aggregation and penetration on prediction intervals. Sol. Energy 2018, 171, 397–413. [Google Scholar] [CrossRef]


| R | Self-Consumption Increase | |||
|---|---|---|---|---|
| Distributed Charging | Centralized Charging | |||
| Single Household | Community | Averaged Per Household | Community | |
| 0.10 | 1.3% | 0.1% | 0.4% | 0.2% |
| 0.25 | 7.3% | 2.9% | 2.8% | 8.1% |
| 0.50 | 8.7% | 3.7% | 3.8% | 8.5% |
| 0.75 | 7.4% | 3.0% | 3.5% | 6.4% |
| 1.00 | 6.0% | 2.5% | 3.4% | 4.9% |
| 1.25 | 5.0% | 2.1% | 3.0% | 3.9% |
| 1.50 | 4.3% | 1.9% | 2.7% | 3.2% |
| R | Self-Sufficiency Increase | |||
|---|---|---|---|---|
| Distributed Charging | Centralized Charging | |||
| Single Household | Community | Averaged Per Household | Community | |
| 0.10 | 0.2% | 0.1% | 0.2% | 0.2% |
| 0.25 | 2.0% | 0.9% | 1.0% | 2.3% |
| 0.50 | 4.6% | 2.1% | 2.3% | 4.7% |
| 0.75 | 5.9% | 2.6% | 3.3% | 5.3% |
| 1.00 | 6.4% | 2.9% | 3.8% | 5.4% |
| 1.25 | 6.7% | 3.1% | 4.7% | 5.4% |
| 1.50 | 6.9% | 3.2% | 4.7% | 5.5% |
| R | Peak Load Reduction | ||
|---|---|---|---|
| Single Household | Community: Distributed | Community: Centralized | |
| 0.10 | 52.8% | 36.1% | 48.6% |
| 0.25 | 53.6% | 34.9% | 47.3% |
| 0.50 | 53.7% | 32.7% | 44.1% |
| 0.75 | 52.4% | 32.4% | 42.6% |
| 1.00 | 49.2% | 32.3% | 41.8% |
| 1.25 | 46.6% | 32.5% | 41.3% |
| 1.50 | 44.9% | 32.7% | 41.0% |
© 2020 by the authors. Licensee MDPI, Basel, Switzerland. This article is an open access article distributed under the terms and conditions of the Creative Commons Attribution (CC BY) license (http://creativecommons.org/licenses/by/4.0/).
Share and Cite
Fachrizal, R.; Munkhammar, J. Improved Photovoltaic Self-Consumption in Residential Buildings with Distributed and Centralized Smart Charging of Electric Vehicles. Energies 2020, 13, 1153. https://doi.org/10.3390/en13051153
Fachrizal R, Munkhammar J. Improved Photovoltaic Self-Consumption in Residential Buildings with Distributed and Centralized Smart Charging of Electric Vehicles. Energies. 2020; 13(5):1153. https://doi.org/10.3390/en13051153
Chicago/Turabian StyleFachrizal, Reza, and Joakim Munkhammar. 2020. "Improved Photovoltaic Self-Consumption in Residential Buildings with Distributed and Centralized Smart Charging of Electric Vehicles" Energies 13, no. 5: 1153. https://doi.org/10.3390/en13051153
APA StyleFachrizal, R., & Munkhammar, J. (2020). Improved Photovoltaic Self-Consumption in Residential Buildings with Distributed and Centralized Smart Charging of Electric Vehicles. Energies, 13(5), 1153. https://doi.org/10.3390/en13051153