Article

Variability in Measured Real-World Operational Energy Use and Emission Rates of a Plug-In Hybrid Electric Vehicle

Department of Civil, Construction, and Environmental Engineering, North Carolina State University, Raleigh, NC 27695, USA
*
Author to whom correspondence should be addressed.
Energies 2020, 13(5), 1140; https://doi.org/10.3390/en13051140
Submission received: 17 February 2020 / Revised: 24 February 2020 / Accepted: 26 February 2020 / Published: 4 March 2020
(This article belongs to the Special Issue Smart Mobility and Energy Transitions)

Abstract

:
Compared to comparably sized conventional light duty gasoline vehicles (CLDGVs), plug-in hybrid electric vehicles (PHEVs) may offer benefits of improved energy economy, reduced emissions, and the flexibility to use electricity as an energy source. PHEVs operate in either charge depleting (CD) or charge sustaining (CS) mode; the engine has the ability to turn on and off; and the engine can have multiple cold starts. A method is demonstrated for quantifying the real-world activity, energy use, and emissions of PHEVs, taking into account these operational characteristics and differences in electricity generation resource mix. A 2013 Toyota Prius plug-in was measured using a portable emission measurement system. Vehicle specific power (VSP) based modal average energy use and emission rates are inferred to assess trends in energy use and emissions with respect to engine load and for comparisons of engine on versus engine off, and cold start versus hot stabilized running. The results show that, compared to CLDGVs, the PHEV operating in CD mode has improved energy efficiency and lower CO2, CO, HC, NOx, and PM2.5 emission rates for a wide range of power generation fuel mixes. However, PHEV energy use and emission rates are highly variable, with periods of relatively high on-road emission rates related to cold starts.

Graphical Abstract

1. Introduction

Plug-in hybrid electric vehicles (PHEVs) have the potential to lower carbon dioxide (CO2) and criteria pollutant emissions and to improve transportation energy efficiency and sustainability [1,2]. Compared to battery electric vehicles (BEVs), some vehicle purchasers prefer PHEVs because they can have lower total ownership cost, depending on the price of gasoline, and have the driving range advantages of conventional vehicles [3]. Most vehicle owners drive less than 32 km per day and the average one-way trip for a sample of PHEV owners was only 11 km [4]. Thus, PHEVs with relatively modest all-electric range (AER) can support a high percentage of electric-only operation for the daily needs of many users, while provided the capability for gasoline-powered hybrid electric operation for longer-range driving. The relatively small AER of PHEVs compared to BEVs is associated with a much smaller battery. Battery manufacturing is costly and CO2-intensive based on typical current electric power energy mixes [5]. Thus, PHEVs have advantages over BEVs and conventional light duty gasoline vehicles (CLDGVs).
In 2018, 124,493 PHEVs were sold in the U.S., for a cumulative U.S. total since 2011 of 528,838 PHEVs [6]. Globally, approximately 625,000 PHEVs were sold in 2018 [7]. As of January 2020, there were over 25 PHEV models available in the U.S., representing more than ten manufacturers [8].
However, although there are numerous studies that quantify PHEV energy consumption and CO2 emissions rates [1,2,4,5,9,10], few of them are based on real-world data. For example, only one study quantified the real-world energy use and emission rates of pollutants other than CO2, including carbon monoxide (CO), hydrocarbons (HCs), and nitrogen oxides (NOx), using a portable emission measurement system (PEMS), of a Toyota Prius hybrid-electric vehicle that had been retrofitted as a PHEV [11]. Although, like other vehicles with internal combustion engines (ICEs) and three-way catalysts (TWC), PHEVs will have cold start emissions [12,13], there has been relatively little quantification of cold-start emissions based on real-world data. The purpose of this paper is to demonstrate a method for quantifying the real-world activity, energy use and energy-related emissions (EU&E) of PHEVs based on in-use measurements, with a focus on different PHEV operating modes and taking into account cold starts. Like all vehicles with brakes and tires, PHEVs have brake and tire wear emissions. Like all vehicles with ICEs, PHEVs have crankcase, evaporative, and running loss emissions [14]. However, the focus of this paper is on tailpipe emissions and upstream emissions related to energy.
A PHEV is a hybrid electric vehicle (HEV) with a grid-based rechargeable traction battery (TB). The TB can be charged from the electric grid, regenerative braking or excess energy from the ICE [15,16]. PHEVs operate in charge depleting (CD) or charge sustaining (CS) mode [15,17,18]. In CD mode, the PHEV performs like an electric vehicle (EV), whose electric motor provides propulsion for the vehicle. The TB state of charge (SOC) generally decreases during CD mode until reaching a lower limit, at which point the PHEV switches to CS mode. In CS mode, the PHEV performs like an HEV; the ICE provides propulsion in combination with or instead of the electric motor. In CS mode, the TB SOC is maintained within a narrow range.
PHEV emissions related to energy consumption come from both grid electricity and gasoline usage. Grid electricity is only consumed in CD mode. CD mode emissions will be shifted to power plants, which are often located a distance from large populations [19,20]. Indirect CD mode emissions will depend on the electricity generation resource mix of the region where PHEVs operate [21,22]. Gasoline can be used in both CD and CS modes. When gasoline is used, tailpipe emissions will be produced. The energy economy of PHEVs depends on whether they are operating in CD or CS mode. For example, the overall gasoline and grid equivalent energy economy for CD mode for a retrofitted PHEV was found to be 7% lower than that for CS mode [11]. Differences in electricity generation mix among U.S. states were found to affect the total CD mode emission rates. However, upstream EU&E for gasoline production were not accounted for.
The PHEV ICE has the ability to turn on and off during operation, depending on power demand, the TB SOC, and the ability of the electric motor to provide demanded power [17,23,24]. During CD mode, the ICE is mainly off. For some PHEVs, the ICE can turn on during CD mode to assist propulsion when the electric motor cannot solely meet high power demand [17]. During CS mode, the ICE is mainly on. The ICE is off typically under situations of low power demand that can be met solely with the electric motor, or no power demand when driving downhill, coasting, or braking [24]. Therefore, EU&E for PHEVs depend not only on CD and CS modes, but also on engine on and off activity.
Vehicle specific power (VSP) correlates strongly with fuel use and tailpipe emission rates for conventional vehicles [25,26,27]. Thus, VSP can explain variability in energy use and emission rates associated with variability in power demand. However, few studies have quantified EU&E for PHEVs by applying a VSP-based modal model [11]. Thus, there is a lack of quantitative information regarding PHEV energy use and emission rates as a function of power demand.
Because the first PHEV engine start can occur after a trip has started, the spatial distribution of cold starts may differ from that of a CLDGV. Cold start is defined as an engine start that occurs after a long uninterrupted engine shut-down period of 12 hours or more [28]. During a cold start, the engine is typically commanded to run fuel rich to ensure sufficient fuel vapor for combustion, which can increase products of incomplete combustion including CO and HC. Until the catalytic converter warms to its “light-off temperature,” it will be ineffective at controlling emissions of CO, HC, and NOx, leading to high emission rates during the cold start period [28,29,30].
CLDGV cold starts occur at the point of origin of a trip. However, for a PHEV in CD mode, the first engine start could occur some distance from the trip origin, thus altering the real-world location of cold starts. Furthermore, PHEVs may have extended periods of engine off activity, during which engine coolant temperature (TEC) and catalyst temperature (Tcat) may decrease [29,30,31]. Thus, there could be multiple cold starts per trip for a PHEV.
Strategies to reduce PHEV cold start emissions have been evaluated, such as engine on and off control; however, the real-world effect of such strategies is not clear [12,32]. Empirical data for PHEV cold starts are lacking; however, HEV cold starts have been evaluated to some extent. For example, the cold start extra emissions (CSEEs) of CO, HC and NOx for five HEVs measured on a dynamometer were lower than for comparable CLDGVs [29]. An on-road study of a Toyota Prius HEV found that after longer engine shut-down periods, CO and NOx emissions after an engine start tended to increase [31].
The objectives here are to demonstrate a method for quantifying the real-world activity, energy use, and emissions of PHEVs, taking into account CD and CS modes, power demand, engine on and off activity, and cold start and hot stabilized operation, and to quantify the sensitivity of EU&E of PHEVs to these operational characteristics and differences in electricity generation resource mix. The method is based on in-use measurement of a production PHEV during actual on-road operation. This paper differs from others in being based on real-world measurements of a production PHEV that enable quantification of: (a) exhaust emission rates of pollutants other than CO2, including CO, HC, and NOx based on extensive field measurements representing variability in road types and traffic conditions; (b) quantification of cold start emission rates associated with the first engine starts during a trip; and (c) variability in direct and indirect operational energy use and multi-pollutant emission rates related to charge depleting mode, charge sustaining mode, and ICE operation, based on real-world second-by-second data and VSP. This work emphasizes that energy efficiency of PHEVs depends on upstream losses. The implications of this work for study design and sample size needed to quantify these sources of variability is also discussed.

2. Materials and Methods

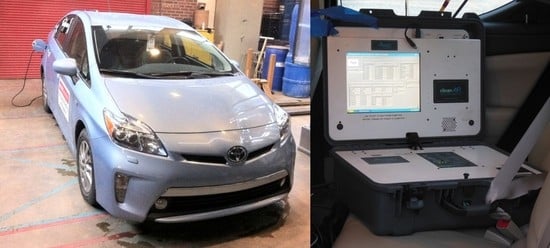
A 2013 Toyota Prius Plug-In Hybrid was measured on selected routes in the Research Triangle Park, North Carolina (USA) area during January 2013. Instruments used included a portable emissions measurement system (PEMS), an on-board diagnostic (OBD) scan tool, multiple global position system (GPS) receivers with barometric altimeter, and a watt-hour meter. Upstream EU&E for gasoline production, and indirect EU&E from electric grid were estimated. Quality assurance was performed to check for possible errors before data analysis. A comparison of EU&E between CD and CS modes was made, taking into account inter-state variablity in electricity generation resource mix. A VSP-based modal modeling approach was used to analyze energy use and exhaust gas emission rates with respect to engine loads, to compare engine on versus engine off, and to compare cold start versus hot stabilized running. Abbreviations are defined in Table 1.

2.1. Field Study Design

The PHEV was measured on eight previously specified study routes (A, B, C, D, E, 1, 2, 3) in Raleigh, North Carolina (NC) and Research Triangle Park (RTP), NC during January 2013 [11,33,34]. These routes are shown in Figure 1. The one-way distances for these routes range from 2.8 (4.5 km) miles on Route E to 20.2 miles (32.5 km) on Route 3. These routes are comprised of different percentages of travel distance on minor arterials, major arterials, and freeways. For example, the percentage of freeway travel by distance ranged from 0% for Route E to 80% for Route 1. Posted speed limits ranged from 25 mph (40 km/h) to 70 mph (113 km/h) for various segments on the routes. The routes included signalized intersections, roundabouts, and ramps. Road grade varies between ±10 percent. These routes were selected to provide a wide range of engine power demand. Routes A, B, C, and D originate at the North Carolina State University campus, where the TB was charged each night. Thus, it was possible to conduct CD mode measurements on these latter routes. The sequence of the routes was rotated from day to day. Measurements took place on eight days, during peak and off-peak travel times each day, and on both weekdays and weekends. Prior to each day of measurement, the fuel tank was topped off, and the TB was fully charged. Thus, total energy use per day was quantified.

2.2. Instruments

A GlobalMRV Axion PEMS was used to measure second-by-second tailpipe exhaust gas concentrations [35]. The PEMS uses non-dispersive infrared (NDIR) to measure CO2, CO and HC, and electrochemical sensors to measure NOx and O2. The PEMS has two parallel five-gas analyzers, which were calibrated before measurement using a cylinder gas of known composition and periodically during measurement using ambient air to prevent drift. The process of self-calibration during measurement is referred to as “zeroing” [36]. The ambient concentrations of analytes, such as NO, CO, and HC, are much lower than their concentrations in the tailpipe. The zeroing is mostly aimed at correcting drift in the HC measurement. Based on verification by measuring calibration gas after conducting a measurement, the instrument holds a calibration with no drift for NO and CO. This type of PEMS was validated in comparison to a reference method dynamometer laboratory as part of the U.S. Environmental Protection Agency (EPA) Environmental Technology Verification (ETV) program. The PEMS CO2, CO, and NO measurements were accurate to within 10% of the reference methods [37]. HC measurements were biased low by approximately a factor of 2. This is because NDIR responds well to straight-chain hydrocarbons but has lower response ratios for other hydrocarbons. The HC measurements are useful for assessing relative differences.
An OBD scan tool and multiple GPS receivers with barometric altimeters were used to record real-world vehicle activity data. The scan tool logged vehicle speed (VSS), engine speed (RPM), manifold absolute pressure (MAP), intake air temperature (IAT), mass air flow (MAF), mass fuel flow (MFF), TEC, Tcat, and SOC. Data from multiple GPS datasets were combined into one dataset to calculate 0.1 mile (0.16 km) segment average road grade for all such segments along each route [38]. A watt-hour meter was used to measure the grid electricity consumed to recharge the TB to full capacity after measurement.

2.3. Upstream Energy Use and Emissions for Gasoline Production

The gasoline upstream EU&E from crude oil recovery and transportation, and gasoline refining, transportation and distribution were estimated based on the Greenhouse Gases, Regulated Emissions, and Energy Use in Transportation (GREET) model [39]. Energy equivalent to 823 g of gasoline is needed to produce 1 gallon (3.78 liters) of gasoline. Upstream emissions for 1 gallon of gasoline delivered to the vehicle fuel tank are 1.61 × 10³ g CO2, 2.79 × 10³ mg CO, 3.40 × 10³ mg VOC, 5.98 × 10³ mg NOx, 4.73 × 10³ mg oxides of sulfur (SOx), 0.42 × 10³ mg particulate matter with diameter of 2.5 micrometers or less (PM2.5), and 0.59 × 10³ mg particulate matter with diameter of 10 micrometers or less (PM10).

2.4. Indirect Energy Use and Emissions for Electricity Generation

The rated fuel economy for PHEVs recommended by the Society of Automotive Engineers (SAE) and currently used by U.S. EPA unrealistically assumes 100% electricity generation efficiency and no transmission loss, which leads to a gasoline equivalent fuel use of 0.03 gallons per kWh of grid electricity [40,41]. Here, electricity generation efficiency and transmission loss are taken into account. Indirect energy use and emission factors are based on U.S. national average electricity transmission loss of 6% [42].
The sensitivity of the total EU&E of the measured PHEV to differences in electric generation mix are quantified based on inter-state variability in the generation mix. This sensitivity analysis is based on the assumption that the vehicle operates in the real world under conditions observed in the NC field measurements, but that the electricity would be obtained from an energy mix similar to that of any other state. Thus, references to “state” below refer only to electricity energy mix, not changes in climate or topography that might also affect on-road power demand. The insight sought from this analysis is the sensitivity of total energy use and emission rates attributable to PHEV operation to differences in energy mix, how these rates compare for CD versus CS modes (for which no grid electricity is used), and how the PHEV compares with conventional gasoline vehicles.
The percentages of coal, oil, natural gas, nuclear, water, wind, and biomass resources for electricity generation for each U.S. state [43,44], based on the 2011 data available at the time that the measurements were made, were input to GREET to estimate EU&E related to feedstock recovery (e.g., extraction of primary energy resources such as coal), transportation (e.g., transport of coal from the mine to power plant), and conversion (e.g., EU&E at the power plant) [39].
The Energy Information Administration (EIA) reports energy use for electricity generation for each U.S. state. For each state, 2011 electricity generation emission factors were estimated from EPA emission inventory data for each major fuel source (i.e., coal, oil, natural gas, and biomass) and from EIA net electricity generation data [43,44,45,46].
For NC, total energy use for generating 1 kWh of grid electricity is 10,217 BTU (10.780 MJ) of thermal energy. The lower heating value for reformulated or low-sulfur gasoline (RFG) is 113,602 BTU/gallon (31.7 MJ/liter), and the density of RFG is 2791 g/gallon [47,48]. Thus, each kWh of grid electricity corresponds to 251 g gasoline equivalent fuel use. For NC, total emissions for 1 kWh of grid electricity delivered to the vehicle in 2011 were 529 g CO2, 296 mg CO, 56 mg VOC, 455 mg NOx, 703 mg SOx, 63 mg PM2.5, and 118 mg PM10. As the power generation energy mix shifts over time toward less usage of coal and more usage of natural gas, wind, and solar for power generation, these numbers will generally decrease.
Results are presented based on NC, with sensitivity analysis for other states. These emission factors are based on the annual average energy mix and assume that PHEVs are charged at a random time of day. Although time of day of recharging is not quantified, the sensitivity analysis provides insight regarding how PHEV EU&E are sensitive to energy mix. The energy mix varies with time of day [49]. Thus, implications of differences in the energy mix provide insight regarding sensitivity of EU&E to factors that are associated with variability in energy mix, such as time of day.

2.5. Data Synchronization and Quality Assurance

OBD data were converted to a second-by-second basis using linear interpolation to match the time step of PEMS and GPS data. Data from the PEMS, OBD, and GPS were time aligned and combined into one dataset. The combined dataset was screened for possible errors, which were corrected if they could be, or removed if not. The data synchronization and quality assurance procedures are detailed elsewhere [49].

2.6. Charge Depleting (CD) and Charge Sustaining (CS) Modes

The TB was fully charged before each day of measurement. Thus, on each measurement day, the PHEV began operation in CD mode. The TB SOC generally decreased during CD mode, sometimes interspersed with brief periods of ICE operation in cases of episodes of high power demand. When CD mode ended, the engine turned on and SOC fluctuated within a narrow range in CS mode [15,17,18]. Trends in TB SOC and engine speed data were used to infer rules for identifying CD or CS mode. Taking into account EU&E of the PHEV in each of CD and CS modes, including the amount of electric power and gasoline consumed, and the electricity generation resource mix, the total energy use and pollutant mass emission rates for CD or CS mode were quantified. Upstream emissions for power generation and gasoline consumption were quantified as described earlier. Tailpipe exhaust emissions from ICE operation were quantified based on PEMS measurements.

2.7. Power Demand–Vehicle Specific Power (VSP)

VSP takes into account changes in kinetic and potential energy, rolling resistance, and aerodynamic drag. For a light duty vehicle, VSP is [25,50]:
V S P = v × 1.1 × a + 9.81 × r 100 + 0.132 + 0.000302 × v 3
where VSP is vehicle specific power (kW/ton), v is vehicle speed (m/s), a is vehicle acceleration (m/s2) and r is road grade (%).
VSP-based modal models have been widely used to estimate energy use and direct tailpipe emission rates for light duty vehicles, such as CLDGVs [27,51,52], HEVs [53], a retrofitted PHEV [11], and a production PHEV [34], and for on-road heavy duty vehicles, such as a PHEV school bus [54] and others [26].
On the basis of 1 Hz (second-by-second) speed, acceleration, and road grade, VSP was calculated at 1 Hz. A 14 mode VSP-based modal model developed by North Carolina State University for the U.S. EPA is used here to quantify variability in energy use and emission rates with respect to VSP [27]. The definitions of VSP modes are given in Table 2. Measured 1 Hz energy use and emission rates were binned into VSP ranges for each mode. VSP values for VSP modes 1 and 2 are negative, representing deceleration or driving downhill. VSP mode 3 includes idling. Positive VSP in modes 4 to 14 represents steady speed driving, acceleration, or hill climbing.
Sandhu and Frey document the method used here for calculating 1 Hz energy use and direct tailpipe pollutant mass emission rates, using combined, time-aligned, post quality assurance PEMS, OBD and GPS data [50]. Energy use and direct tailpipe pollutant mass emission rates were stratified into 14 VSP modes to estimate modal average energy use and exhaust gas emission rates.

2.8. Engine On and Engine Off

OBD reported engine speed and fuel use rate inferred from OBD and PEMS data were used as indicators of engine on or off operation. To quantify the sensitivity of EU&E of PHEVs to variability in power demand, and engine on and off operation, CD mode energy use and pollutant mass emission rates were quantified for engine on and off and for the 14 VSP modes. For engine off, the gasoline fuel use and tailpipe exhaust emission rates were zero, but electricity usage was quantified based on variation in the SOC. Changes in SOC account for electrical discharge of the TB and for recharge of the TB because of regenerative braking. For engine on, fluctuations in SOC and ICE fuel use were the basis for quantifying total energy use. Measured ICE tailpipe exhaust emission rates, as well as indirect upstream emissions for power generation (for CD mode only) and gasoline production, were quantified.

2.9. Cold Start and Hot Stabilized Operation

Cold start is related to TEC and Tcat, and affects fuel use and direct tailpipe emission rates [28,29,30,31]. Thus, TEC and Tcat were used as indicators of engine cold start or hot stabilized running. Trends in TEC and Tcat data after engine starts were used to infer rules for identifying cold start or hot stabilized running.
Cycle average fuel use and direct tailpipe emission rates for cold start and hot stabilized running were quantified and compared. An average cold start driving cycle, inferred from the distribution of time spent in each VSP mode during cold start operations, was used as the basis for comparison. Based on average travel time spent in each VSP mode for an average cold start, cycle average engine on fuel use and direct tailpipe pollutant emission rates for each of cold start and hot stabilized running were quantified.

2.10. Comparison with Conventional Light Duty Gasoline Vehicles

The energy use and emissions rates of the measured PHEV were compared to CLDGVs. There is not a CLDGV that is exactly identical to the Toyota Prius Plug-In. Therefore, an average of vehicles of similar weight and overall horsepower to weight ratio were used. Examples of vehicles that are approximately similar to the measured PHEV include the Toyota Corolla and the Honda Civic. The average VSP modal emission rates for 18 CLDGVs measured on Routes A, C, 1, and 3 using the same instrumentation [52] were weighted based on the amount of time spent in each VSP mode by the PHEV. The CLDGV emission rates are for hot stabilized operation only.

3. Results

Results are given for quality assurance, CD and CS modes, engine on and off, and cold start and hot stabilized running. The results are illustrated for one PHEV measured on eight study routes.

3.1. Quality Assurance

Less than 3% of data were excluded from the final quality assured dataset, resulting in 153,304 seconds of valid data that were collected during 90 miles (145 km) of CD mode and 935 miles (1504 km) of CS driving over eight days. The causes for errors were invalid IAT, both gas analyzers “zeroing” simultaneously, invalid RPM, and both gas analyzers recording negative exhaust HC concentrations which were statistically different from zero.

3.2. Charge Depleting (CD) and Charge Sustaining (CS) Modes

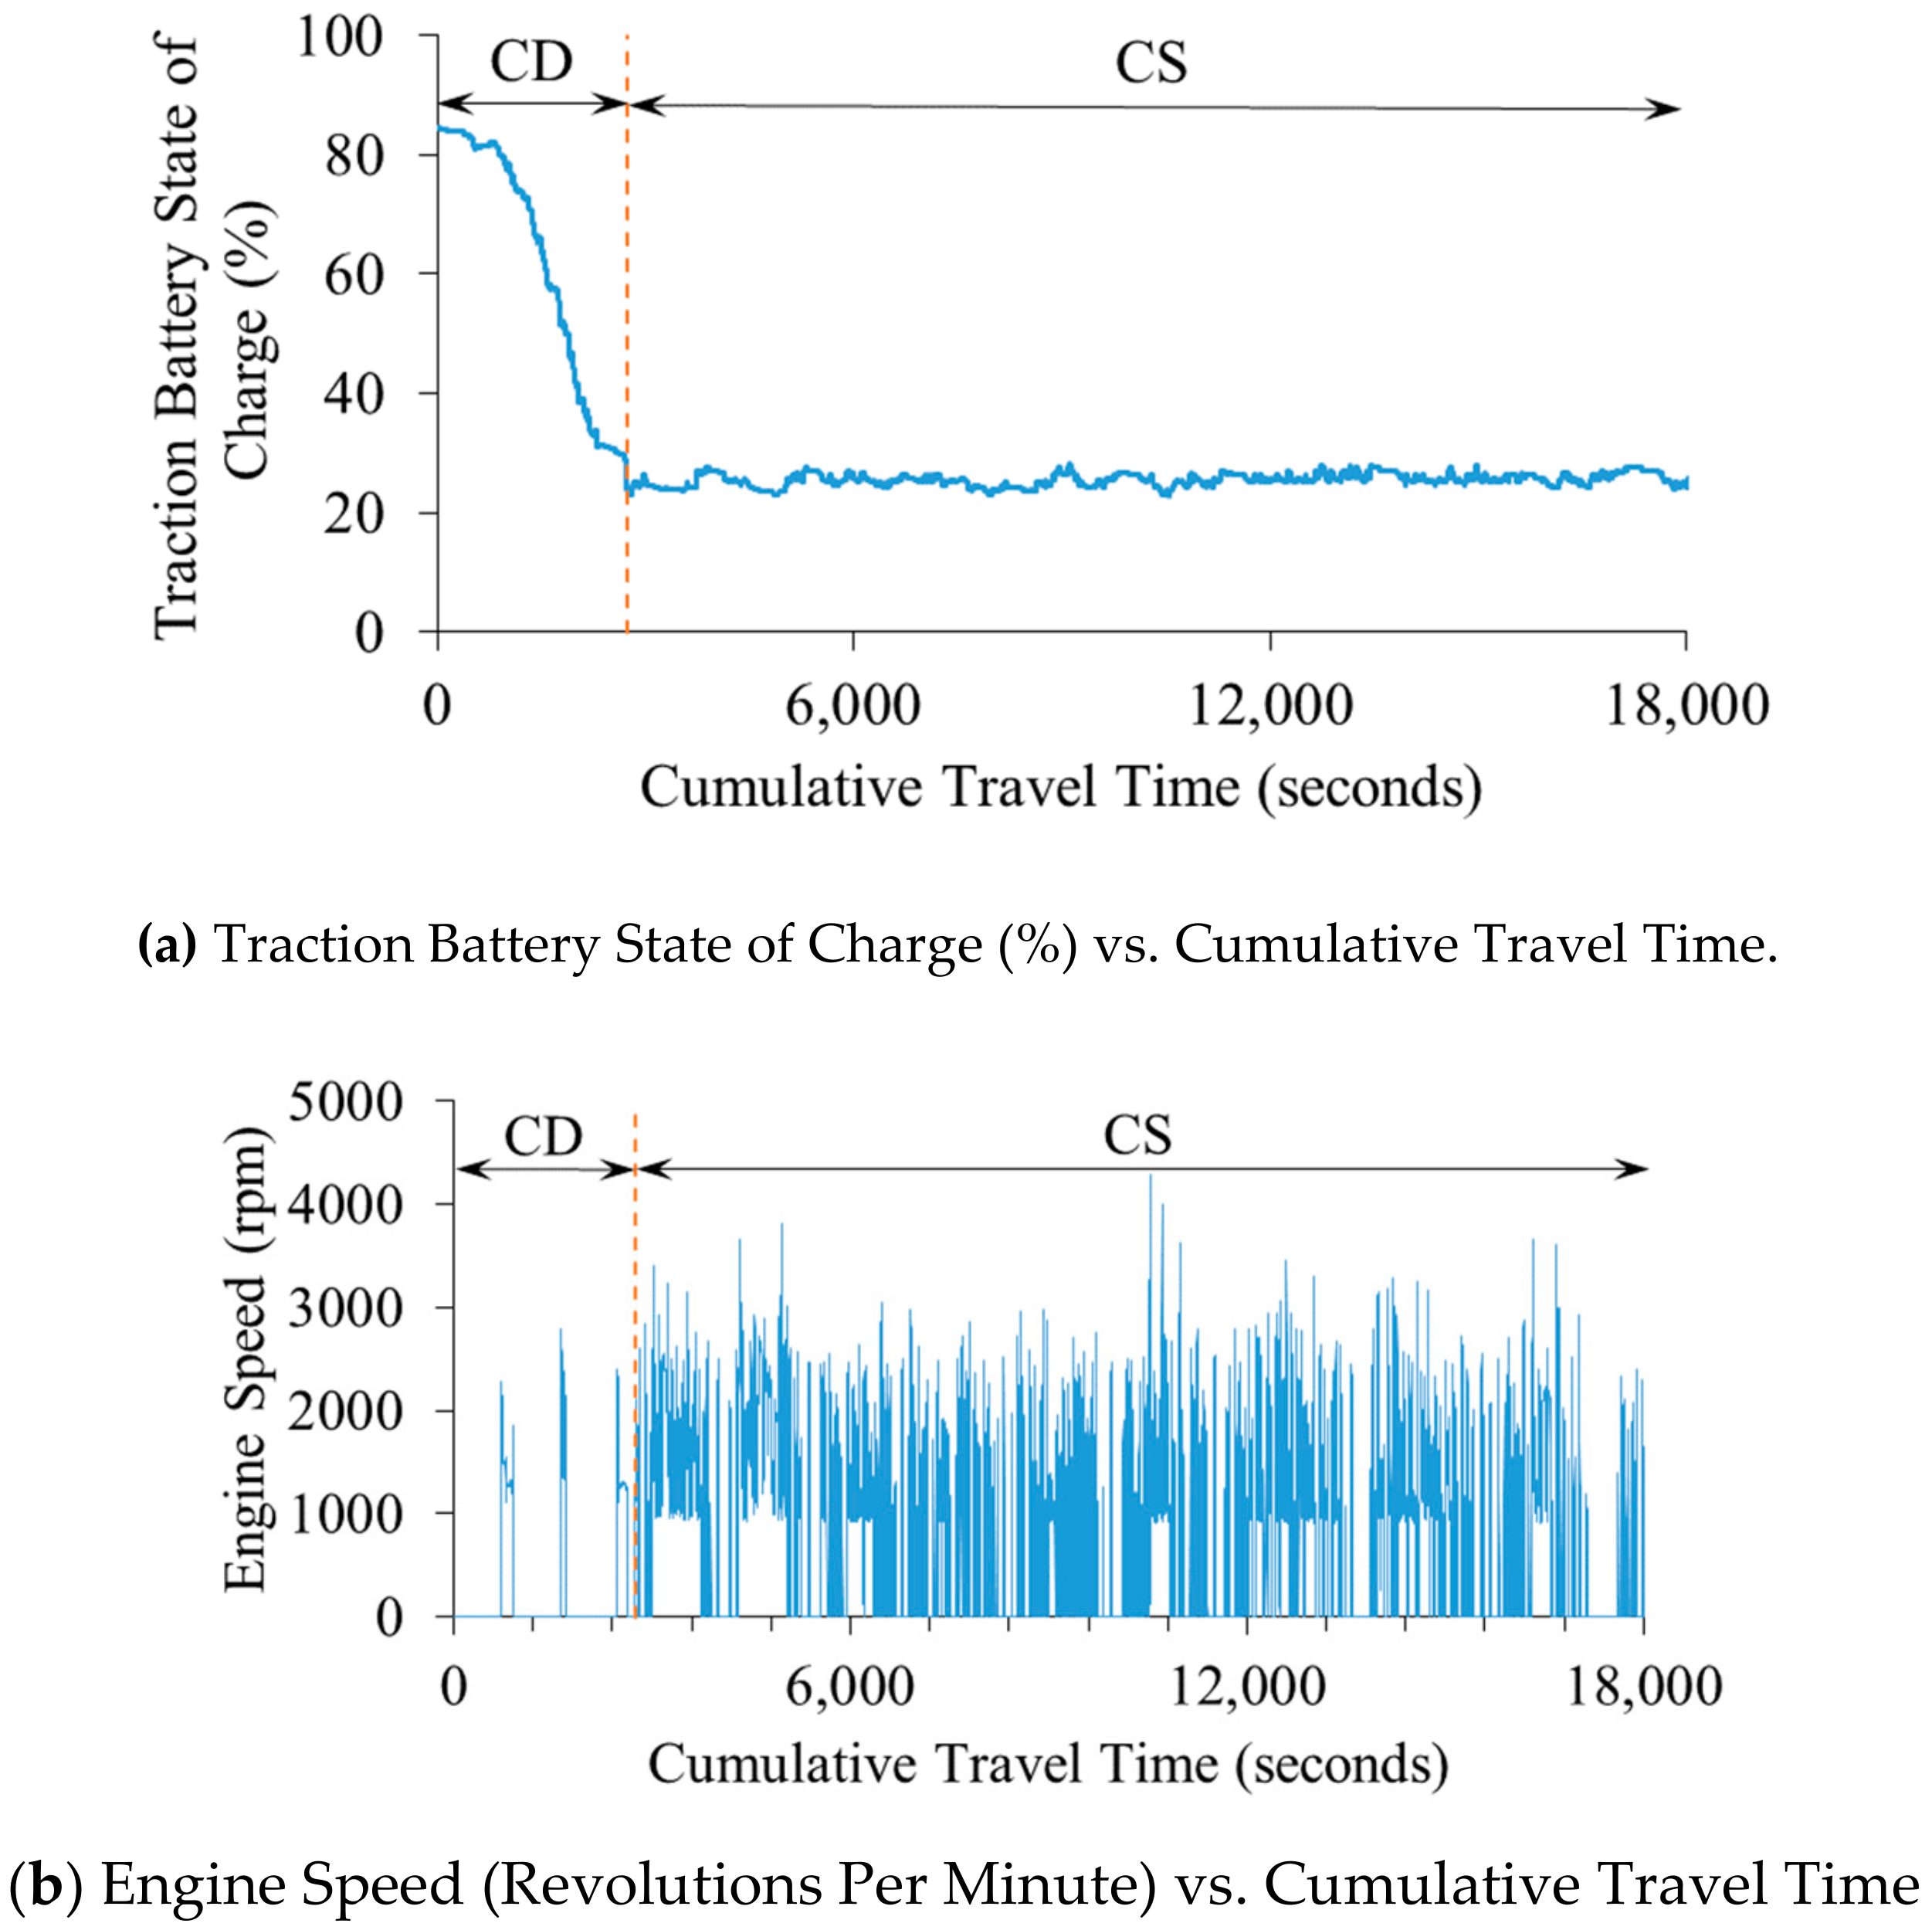
Based on the second-by-second TB SOC and engine speed data, CD mode was defined as operation that ends when the TB SOC reaches a set point concurrent with an engine start followed by SOC fluctuation within a narrow range, as illustrated in Figure 2. The rest of the operation was defined as CS mode. The observed SOC set point varied from 23.1% to 23.9% on a daily basis, with an average of 23.4% and a standard deviation of 0.3%. The engine is typically off during most, if not all, of CD mode, unless there is an episode of high power demand that cannot be met by electric drive alone. During CS mode, the engine is frequently on, but periodically shuts off depending on the power demand and SOC.
During CD mode, the percentage of time that the engine was on varied by route, typically ranging from 6% to 21% of travel time and accounting for typically one mile (1.6 km) or less traveled distance per each engine start. In contrast, for CS operation, the engine was on for typically 35% to 70% of travel time, accounting 34% to 93% of the traveled distance, depending on the route. During CS operation, as shown in Figure 3, the number of engine starts per mile varied inversely with route average speed, whereas the duration of, and distance traveled during, engine operation increased with route average speed. Thus, for higher route average speeds, there were fewer engine starts but the engine was on for longer periods of time and for longer distances traveled.
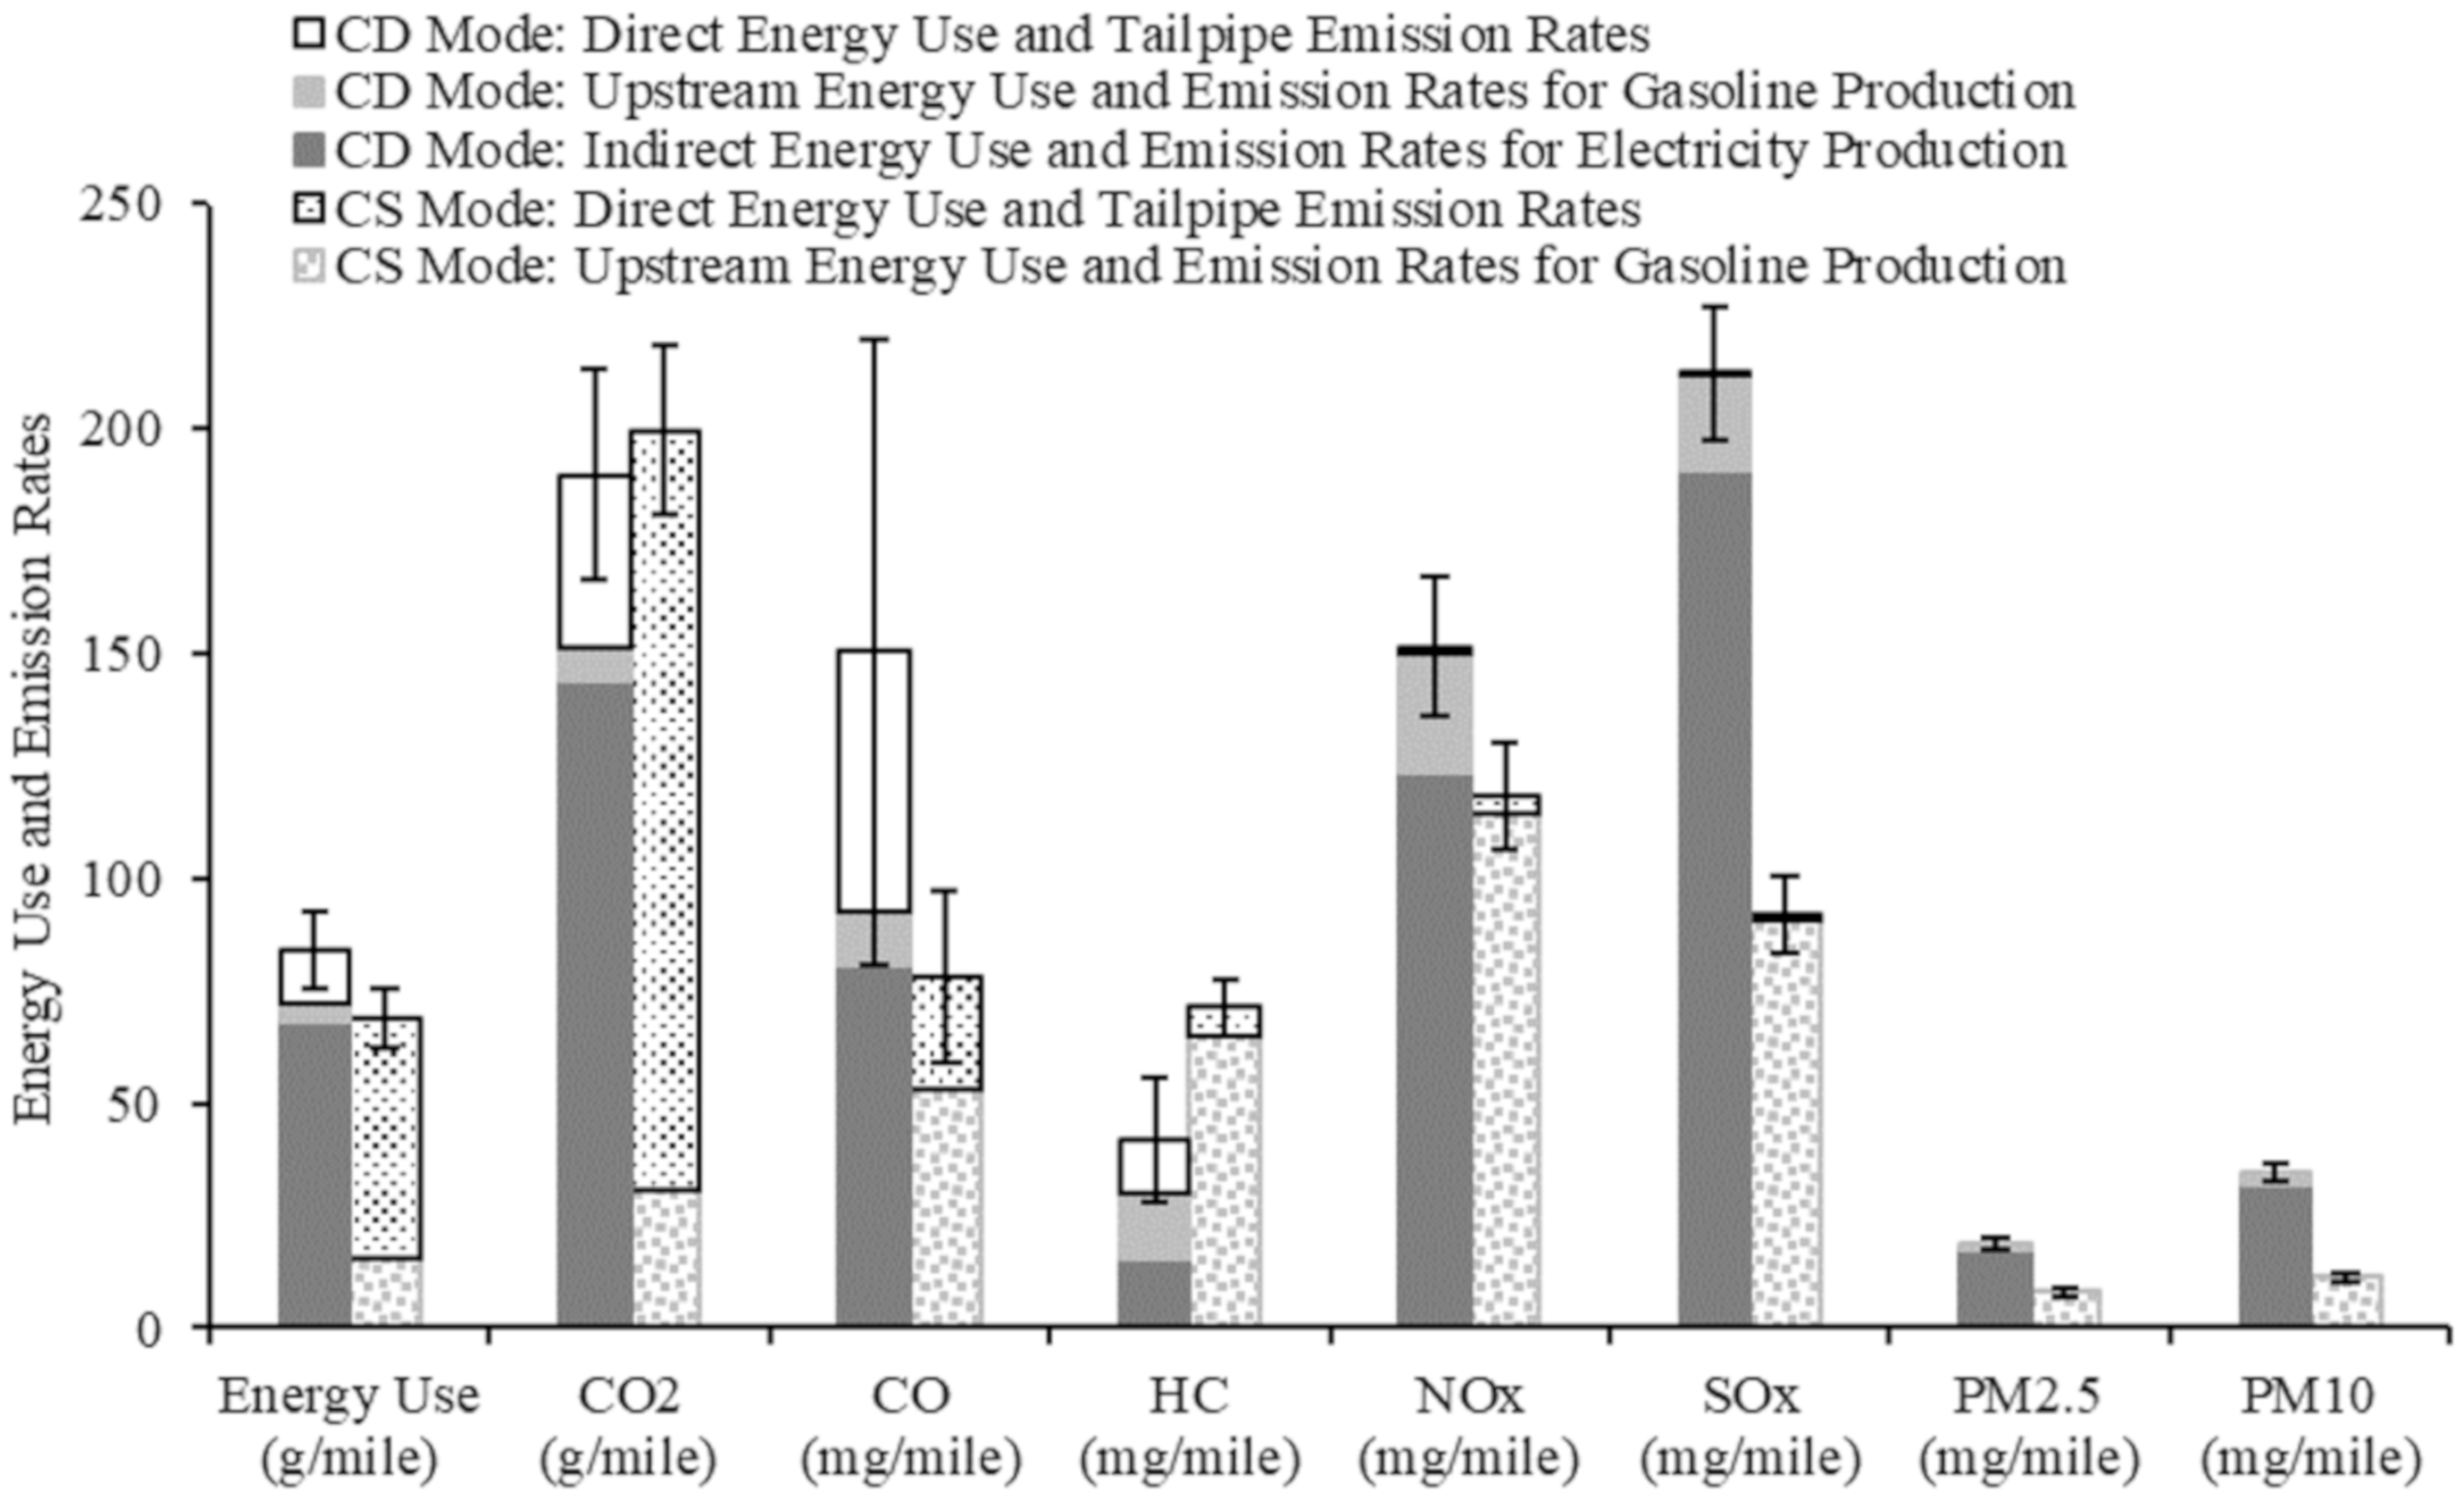
Figure 4 shows the daily average energy use and pollutant mass emission rates for CD and CS modes. When the PHEV operated in CD mode, its average total fuel economy was 34 mpg. This estimate is based on the primary energy input needed for electric power generation and takes into account power generation losses, transmission losses, and battery losses. The lower energy economy in CD versus CS mode is consistent with the findings of Graver et al. (2011) [11]. When the PHEV operated in CS mode, its average total fuel economy was 41 mpg, and its direct fuel economy (not accounting for losses from upstream gasoline production and distribution) was 53 mpg. The latter is similar to the EPA rating of 50 mpg. These results illustrate that the rated fuel economy does not take into account energy losses related to power generation and fuel production.
For CD mode, the emissions are mainly indirectly from the electric grid, except for HC, which has a low electricity generation emission factor. For CS mode, the CO2 emissions are mainly from direct gasoline consumption, and emissions of other pollutants are mainly from upstream gasoline production. Depending on the pollutant, direct emissions, upstream electricity generation emissions, and upstream gasoline production emissions are all important. Thus, changes in upstream emissions, such as from improvements in energy efficiency, feedstock substitutes, or emission reductions, can affect the overall environmental performance of PHEV operation.
The total energy use rate for CD mode is higher than for CS mode, which was also observed by Graver et al. for a retrofitted PHEV [11]. The total CO2 emission rate for CD mode is not significantly different from that for CS mode. Compared to CS mode, the CD mode CO, NOx, SOx, PM2.5, and PM10 emission rates are larger, and the HC emission rate is lower. This comparison is influenced by the more than 50% proportion of coal power generation in NC at the time that the measurements were made. A PHEV operating in CD mode would shift on-road CO2 emissions to power plant sites. Replacement of existing coal power plants with other energy sources could reduce CD mode indirect electricity emissions.
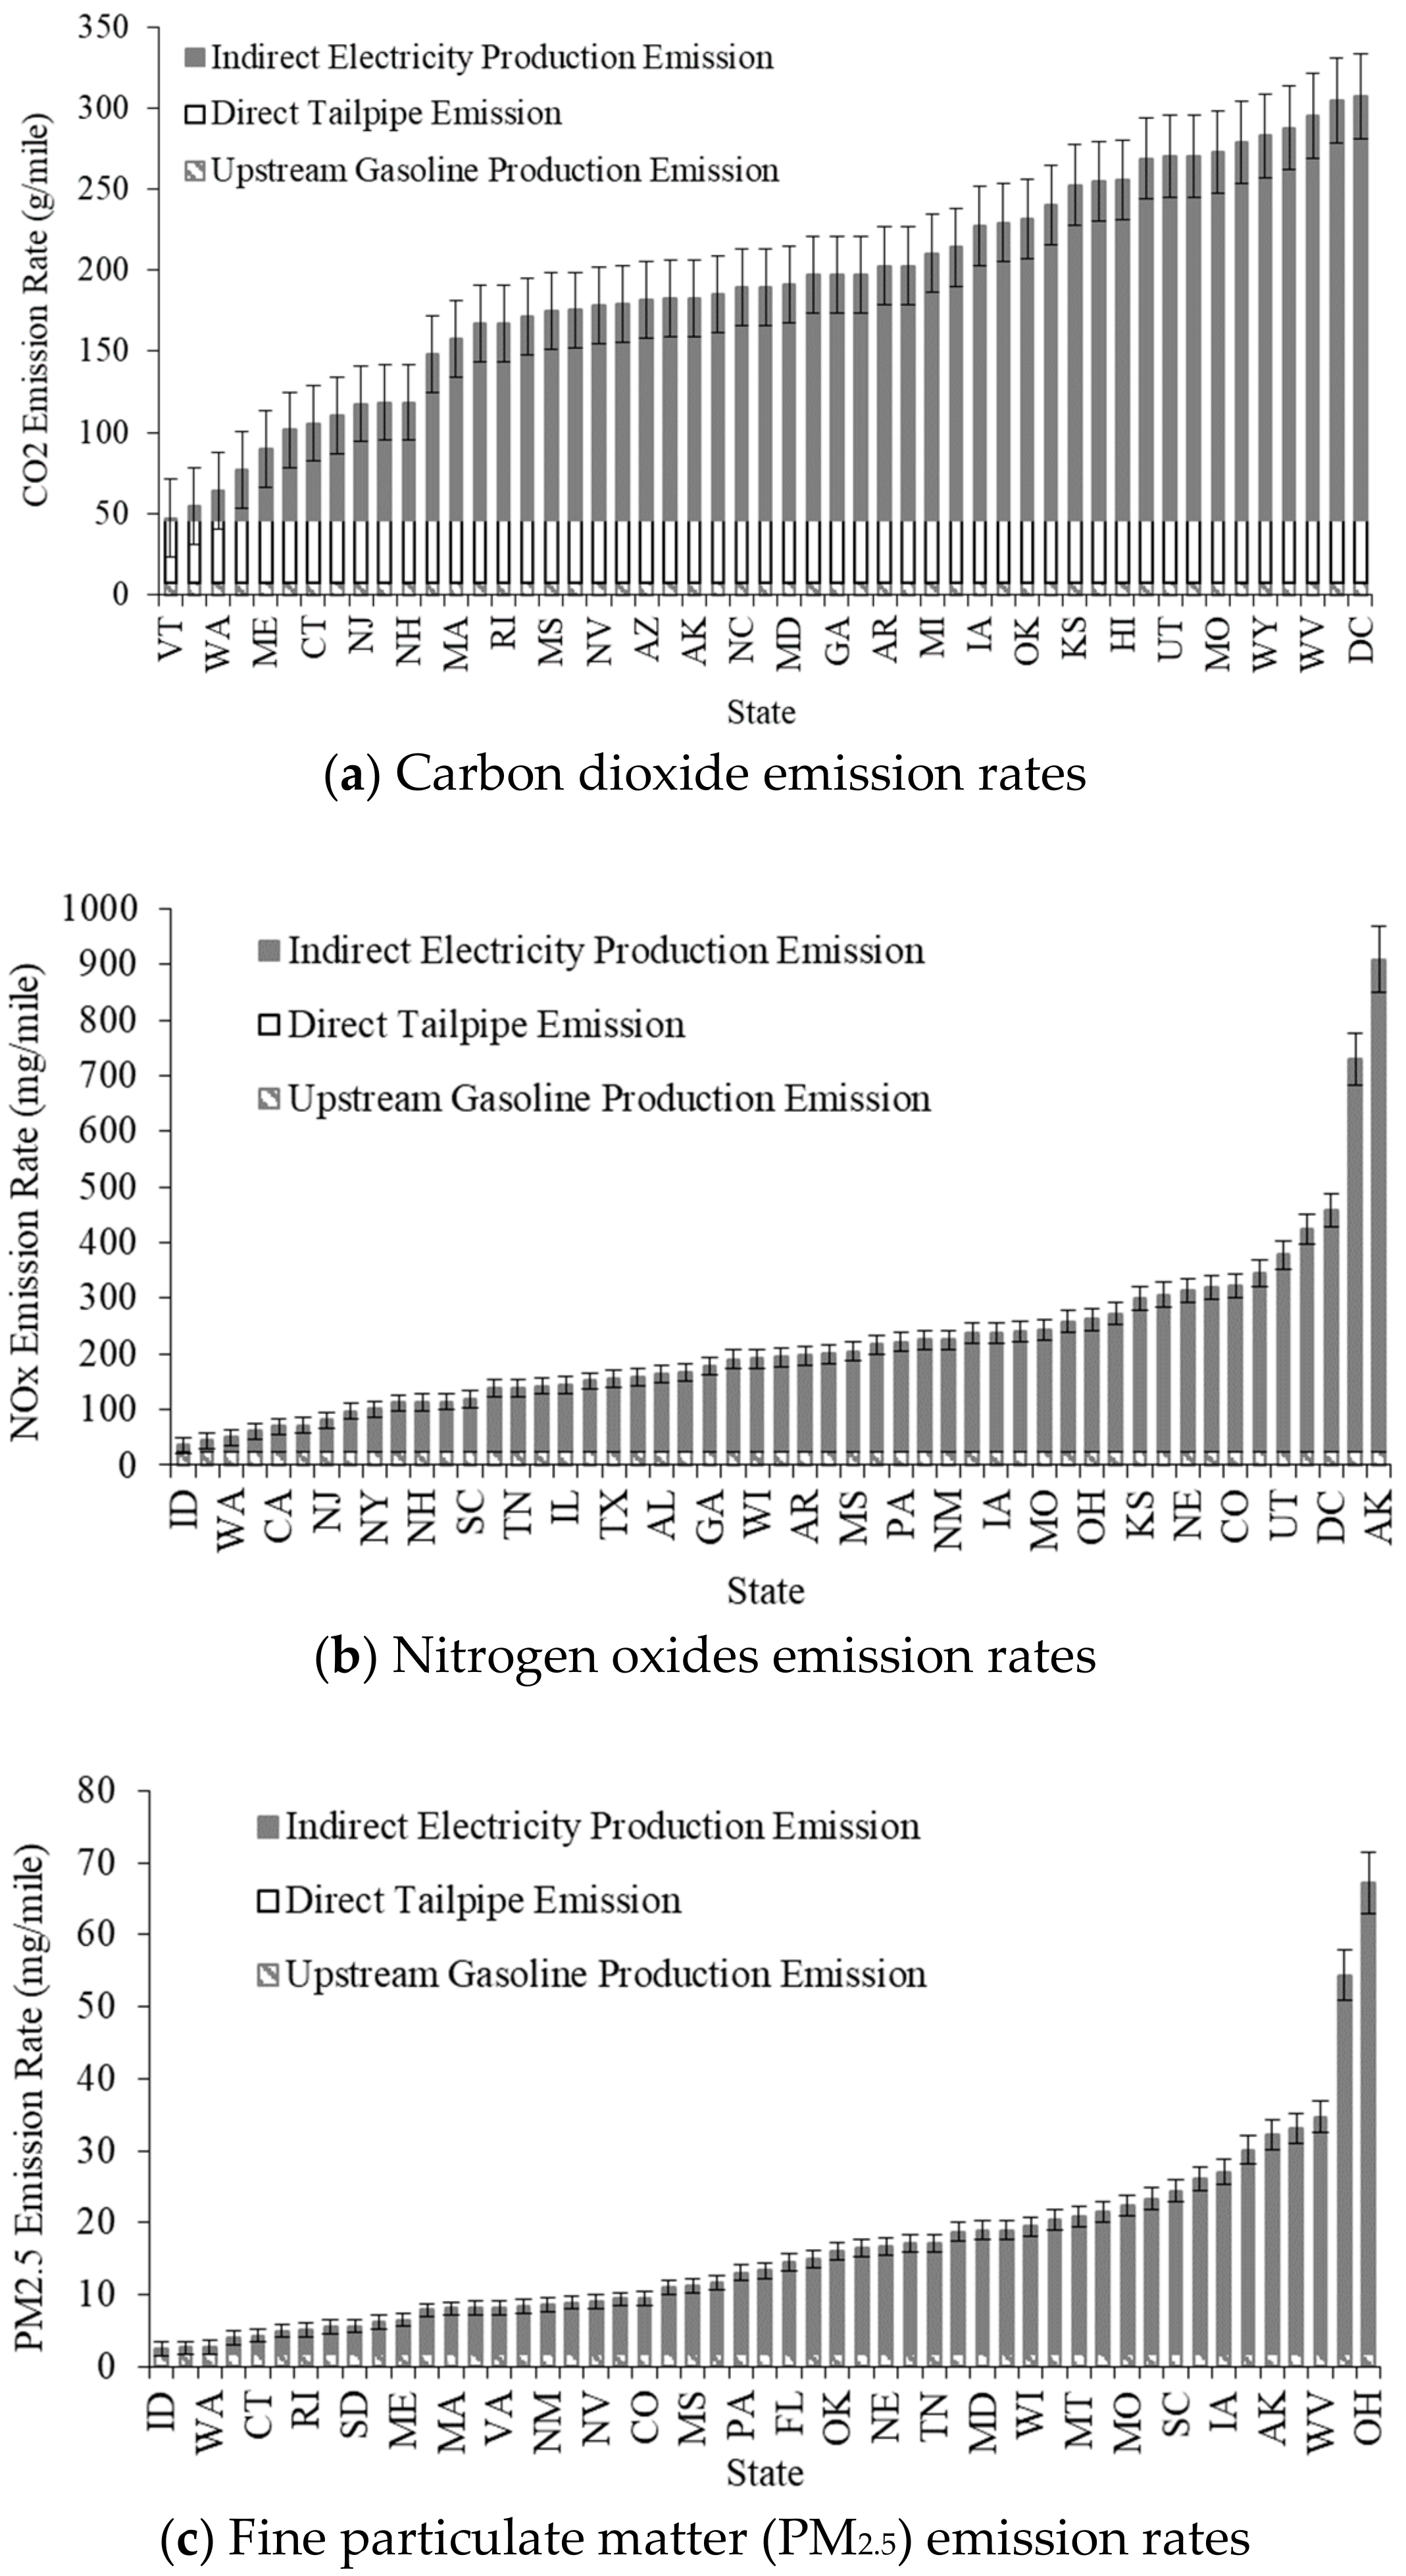
The average emission rates for CD mode based on inter-state variability in the state average energy mix is shown in Figure 5. Many studies have commented on the role of variability in energy mix with regard to CO2 emission rates [1,2,4,5,9,10,21,22]. However, there is an absence of data-based on real-world driving related to NOx and PM2.5 emission rates. The lower CO2 emission rates in Figure 5a are for states with a high proportion of renewable and nuclear energy, whereas the high emission rates are for states with a high proportion of coal-based power generation. The average CO2 emission rate for a CLDGV of comparable size to the measured PHEV is approximately 370 g/mile. Thus, as indicated in Figure 5a, the PHEV has a lower CO2 emission rate than the CLDGVs regardless of inter-state variability in electric power generation fuel mix. The CLDGVs had an average NOx emission rate of 260 mg/mile (including upstream emissions from gasoline production), which is higher than the PHEV CD mode emission rate based on the average energy mixes of approximately 80 percent of states. Thus, there are some energy mixes for which the PHEV CD mode NOx emission rate could be higher than that of a comparable average CLDGV. Of course, the indirect emissions from power generation occur at the power plant and not on the road, thus potentially displacing emissions from high traffic areas to the typically more rural areas at which power plants are typically located. Likewise, in CD mode, the PHEV typically has lower attributed energy-related PM2.5 emission rates than the comparable average CLDGV, but there are about 40% of state average energy mixes which could lead to higher attributed emission rates. Ongoing changes in power generation energy mixes in various states, away from coal and toward more natural gas, wind, and solar, are likely to be in favor of the PHEV.
The variations in grid-related indirect EU&E for with electricity generation resource mix is illustrated for a larger set of pollutants in Table 3. Based on current electricity generation efficiency and transmission loss, the PHEV operating in CD mode is less energy efficient than in CS mode for the energy mix of any state. The average HC emission rate for CD mode is lower than or similar to that for CS mode based on inter-state variability in energy mix. For the energy mix of most U.S. states, there would be lower CO2 emission rates in CD versus CS mode. Compared to CS mode, CD mode based on a larger share of either oil and coal leads to higher CO2, CO, NOx, SOx, PM2.5, and PM10 emissions. Compared to CLDGVs, the PHEV operating in CD mode has improved energy efficiency and lower CO2, CO, and HC emissions based on the energy mix of any state. The PHEV CD mode NOx and PM2.5 emissions rates are lower than for CLDGVs based on the energy mix of most states. However, for states that use coal, the SO2 and PM10 emission rates attributable to PHEVs tend to be larger than the rates attributable to CLDGVs for most states. Higher state average emission rates of NOx, SO2, and particulate matter are typically associated with a higher proportion of coal-based power generation.
The engine was defined as “on” for engine speed ≥ 500 rpm in combination with an OBD-reported fuel use rate ≥ 0.70 L/hr. The engine was defined as “off” for engine speed < 500 rpm in combination with an OBD-reported fuel use rate ≤ 0.15 L/hr. The engine operation was defined as either “shutdown” or “startup,” depending on engine transition from “on” to “off,” or from “off” to “on,” respectively. The sample size for engine “shutdown” (4520 s) or “startup” (795 s) was much smaller than “on” (60,379 s) or “off” (88,729 s). Compared to engine “on”, the fuel use and CO2 emission rates for engine “shutdown” and “startup” are 87% and 86% lower, respectively. For the sake of simplicity, and because of their small contribution to trip emissions, energy use and CO2 emission rates for engine “shutdown” or “startup” are not further discussed.
Figure 6 shows the CD modal engine on and off energy use rate versus VSP mode. For engine on, energy use is mainly from direct gasoline consumption. The gasoline and total energy use rates increase monotonically with increasing positive VSP. The ratio of highest to lowest VSP modal total engine on energy use rates is 10.5. For engine off, the energy use is mainly from indirect energy use from the electric grid. The electric grid and total energy use rates increase monotonically with increasing positive VSP. The ratio of highest to lowest VSP modal total energy use rates for engine off is 42.5. Therefore, VSP is able to explain a large range of variability. No data are shown in Modes 13 and 14 because in CD mode the vehicle cannot produce enough power to meet such high power demand.
For VSP modes 1 to 6, total energy use rates are larger for engine on versus off. For VSP modes 7 to 12, total energy use rates are not significantly different between engine on and off. Thus, the total CD mode energy use rate for a given VSP mode is dependent on whether the engine is on or off, particularly for lower VSP modes.
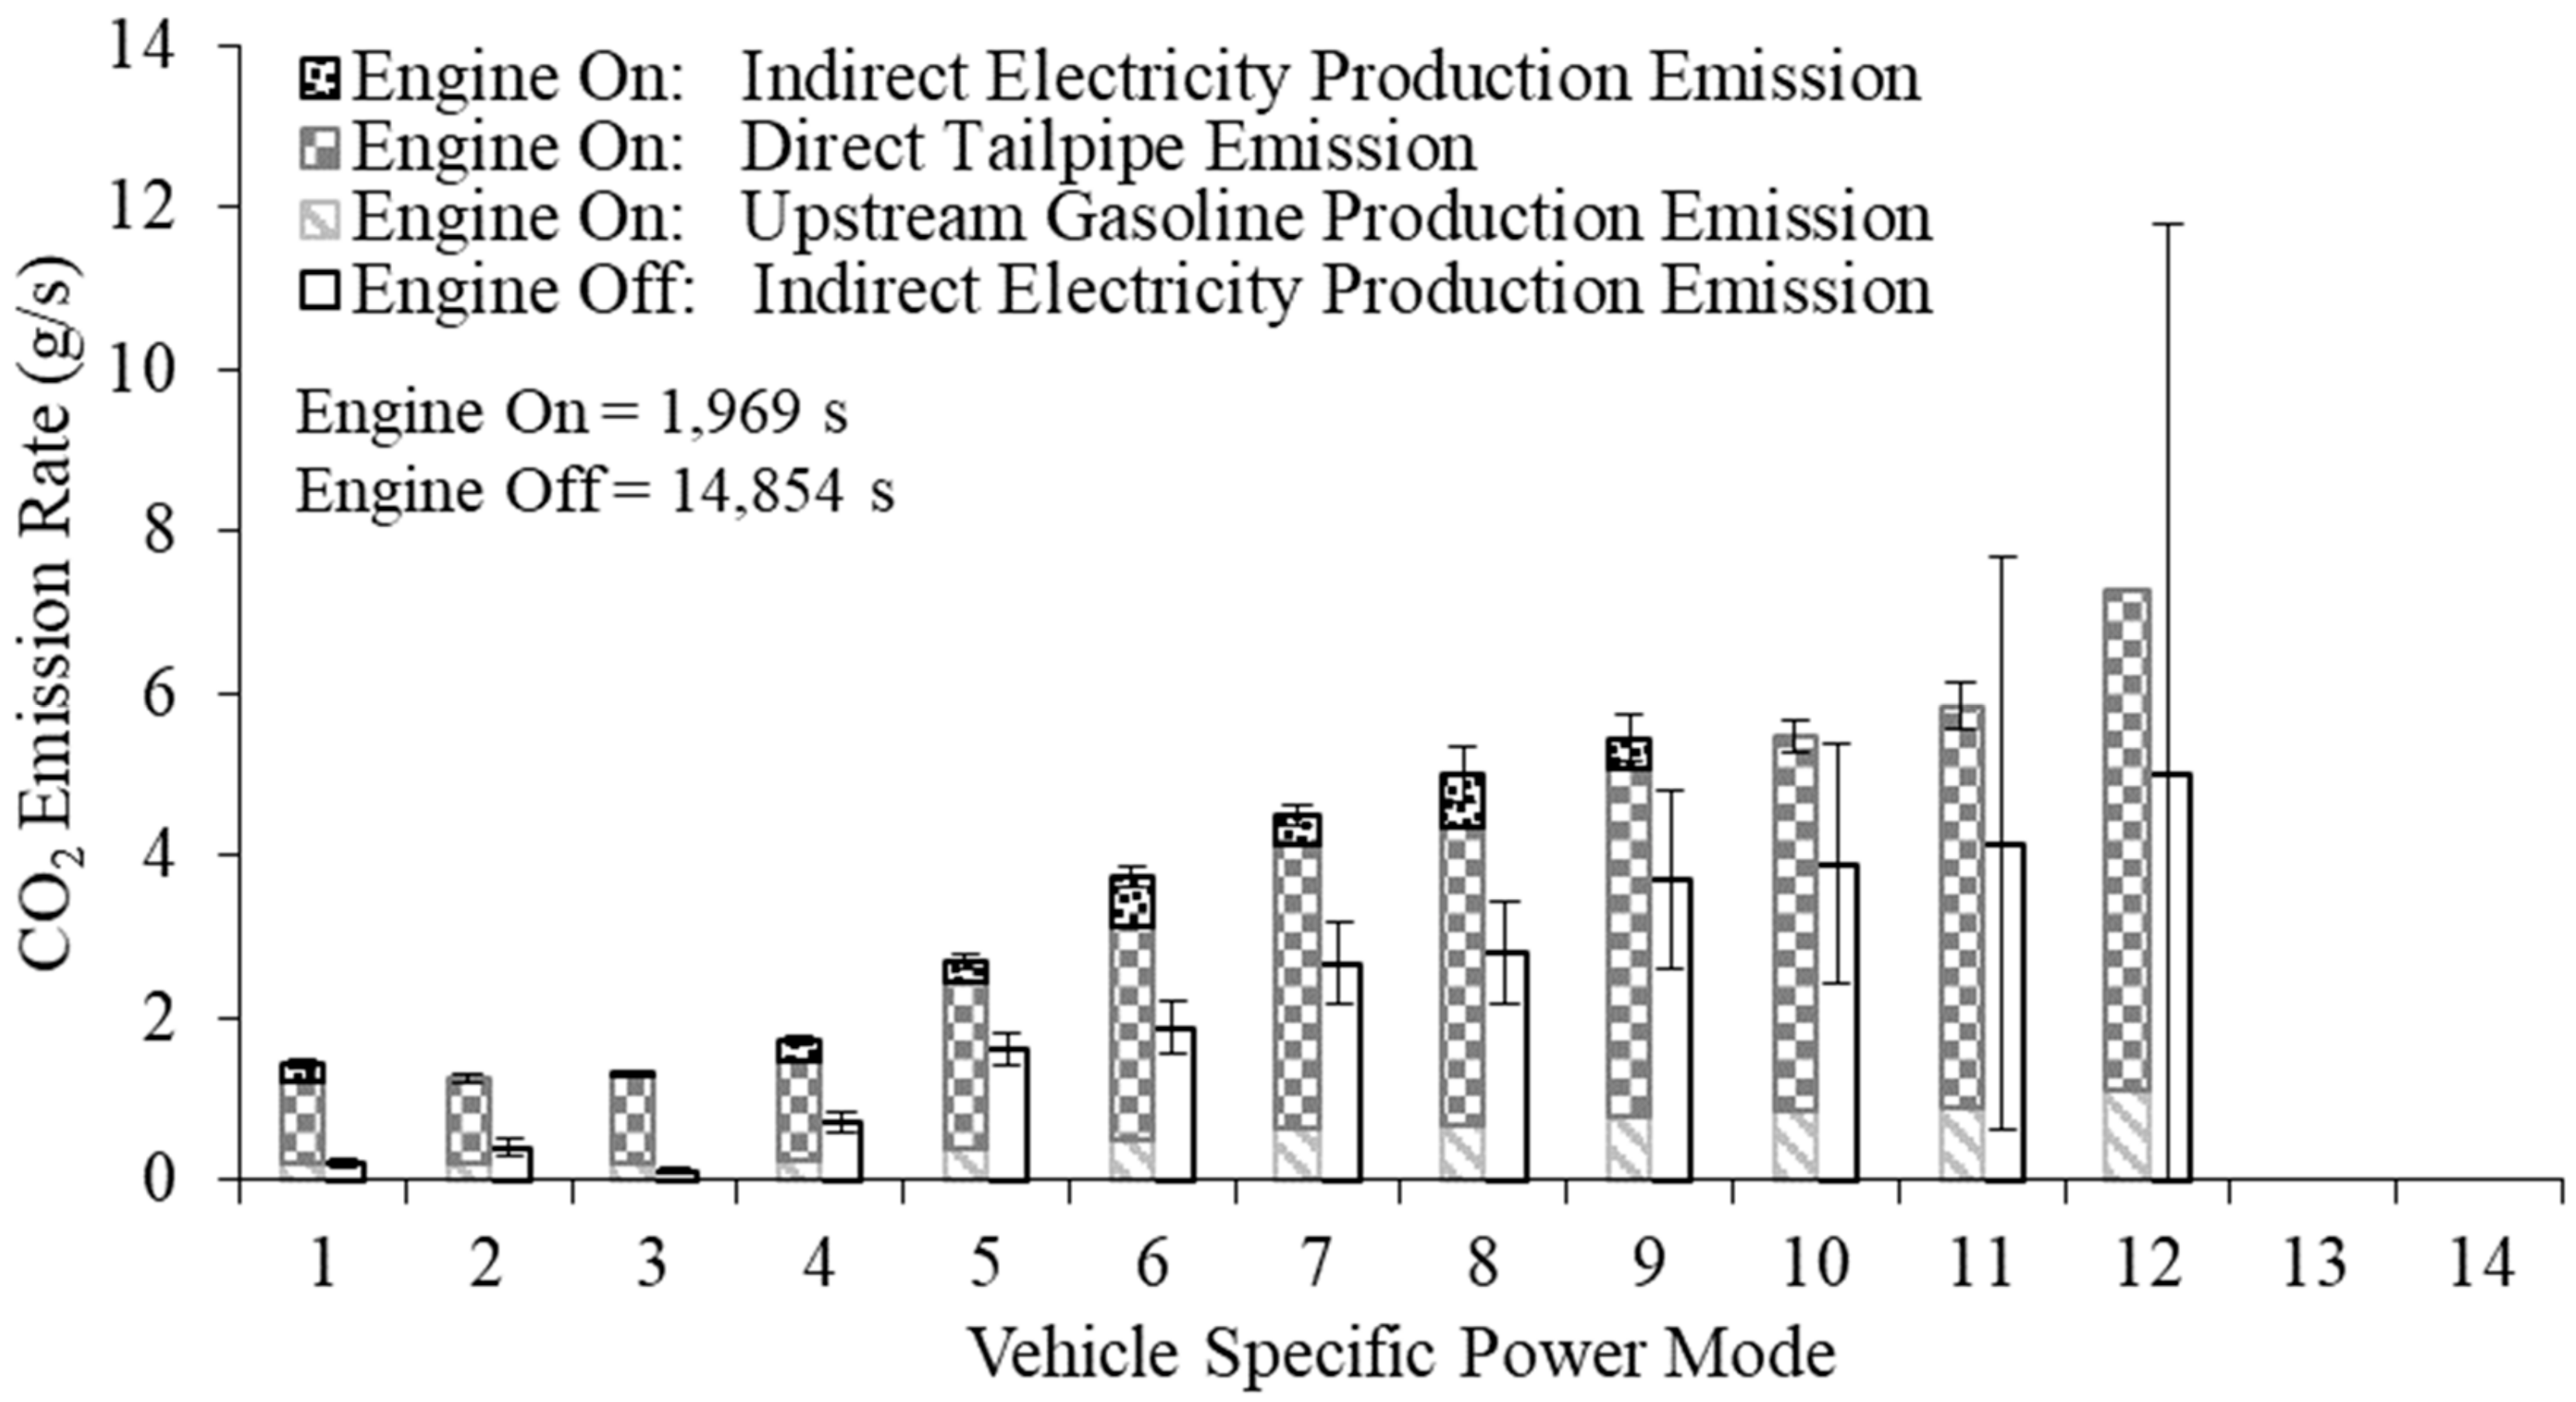
Figure 7 shows the CD model engine on and off CO2 emission rate versus VSP mode. For engine on, CO2 emissions are mainly from the tailpipe. The tailpipe and total CO2 emission rates increase monotonically with increasing positive VSP. The ratio of highest to lowest VSP modal total engine on CO2 emission rates is 5.8. For engine off, the total CO2 emission is only from the electric grid, and increases monotonically with increasing positive VSP. The ratio of highest to lowest VSP modal total engine off CO2 emission rates is 45. Therefore, VSP is useful in explaining variation in CO2 emission with respect to the power demand. For VSP modes 1 to 12, the CD mode engine on CO2 emission rates are larger than for engine off. Therefore, microscale emission rates are sensitive to whether the engine is on and to power demand.

3.3. Cold Start and Hot Stabilized Operation

In hot stabilized operation, TEC was typically 90 °C, and Tcat was typically 600 °C. Cold start was defined as when the ICE turned on during conditions of TEC < 90 °C and Tcat < 600 °C. An example time-plot of catalyst temperature and tailpipe exhaust CO concentration is given in Figure 8 to illustrate the dynamics of the first engine starts during a trip and the concurrently very high CO concentrations associated with those engine starts. The first engine start occurs 713 seconds after the start of driving, during which the catalyst warms from ambient temperature to approximately 460 °C. Concurrently, the exhaust CO concentration reaches nearly 1.4 vol. %, which is the highest value observed during the over 18,000 seconds of measurements on the example day. By 1,000 cumulative seconds, the engine shuts off, after which the catalyst cools to less than 400 °C prior to the second engine start. The second engine start occurs at 1,624 cumulative seconds. During an engine on period of approximately 110 seconds, the catalyst temperature increases to 660 °C. The second engine start produces a relatively small spike in CO exhaust concentration. The third and fourth engine starts produce the second and third highest CO exhaust concentration spikes of the entire day. The fourth engine start is the transition from CD to CS mode. Thus, after the fourth engine start, the engine cycles on and off frequently, and the catalyst temperature varies typically between 560 °C and 680 °C, representing hot stabilized operation. Short episodes of CO exhaust concentrations greater than 0.1 vol-%, but typically not exceeding 0.4 vol. %, occur during hot stabilized operation because of acceleration episodes. The example data illustrate that the highest CO concentrations occur each time there is an engine start before the catalyst is fully warmed, and that the peak CO concentrations are comparatively much lower during hot stabilized operation. Furthermore, the example data illustrate that there can be more than one engine start that exhibits cold start characteristics. Moreover, the cold starts occur after the vehicle has been operating for some time and, therefore, occur on the road rather than at the trip origin.
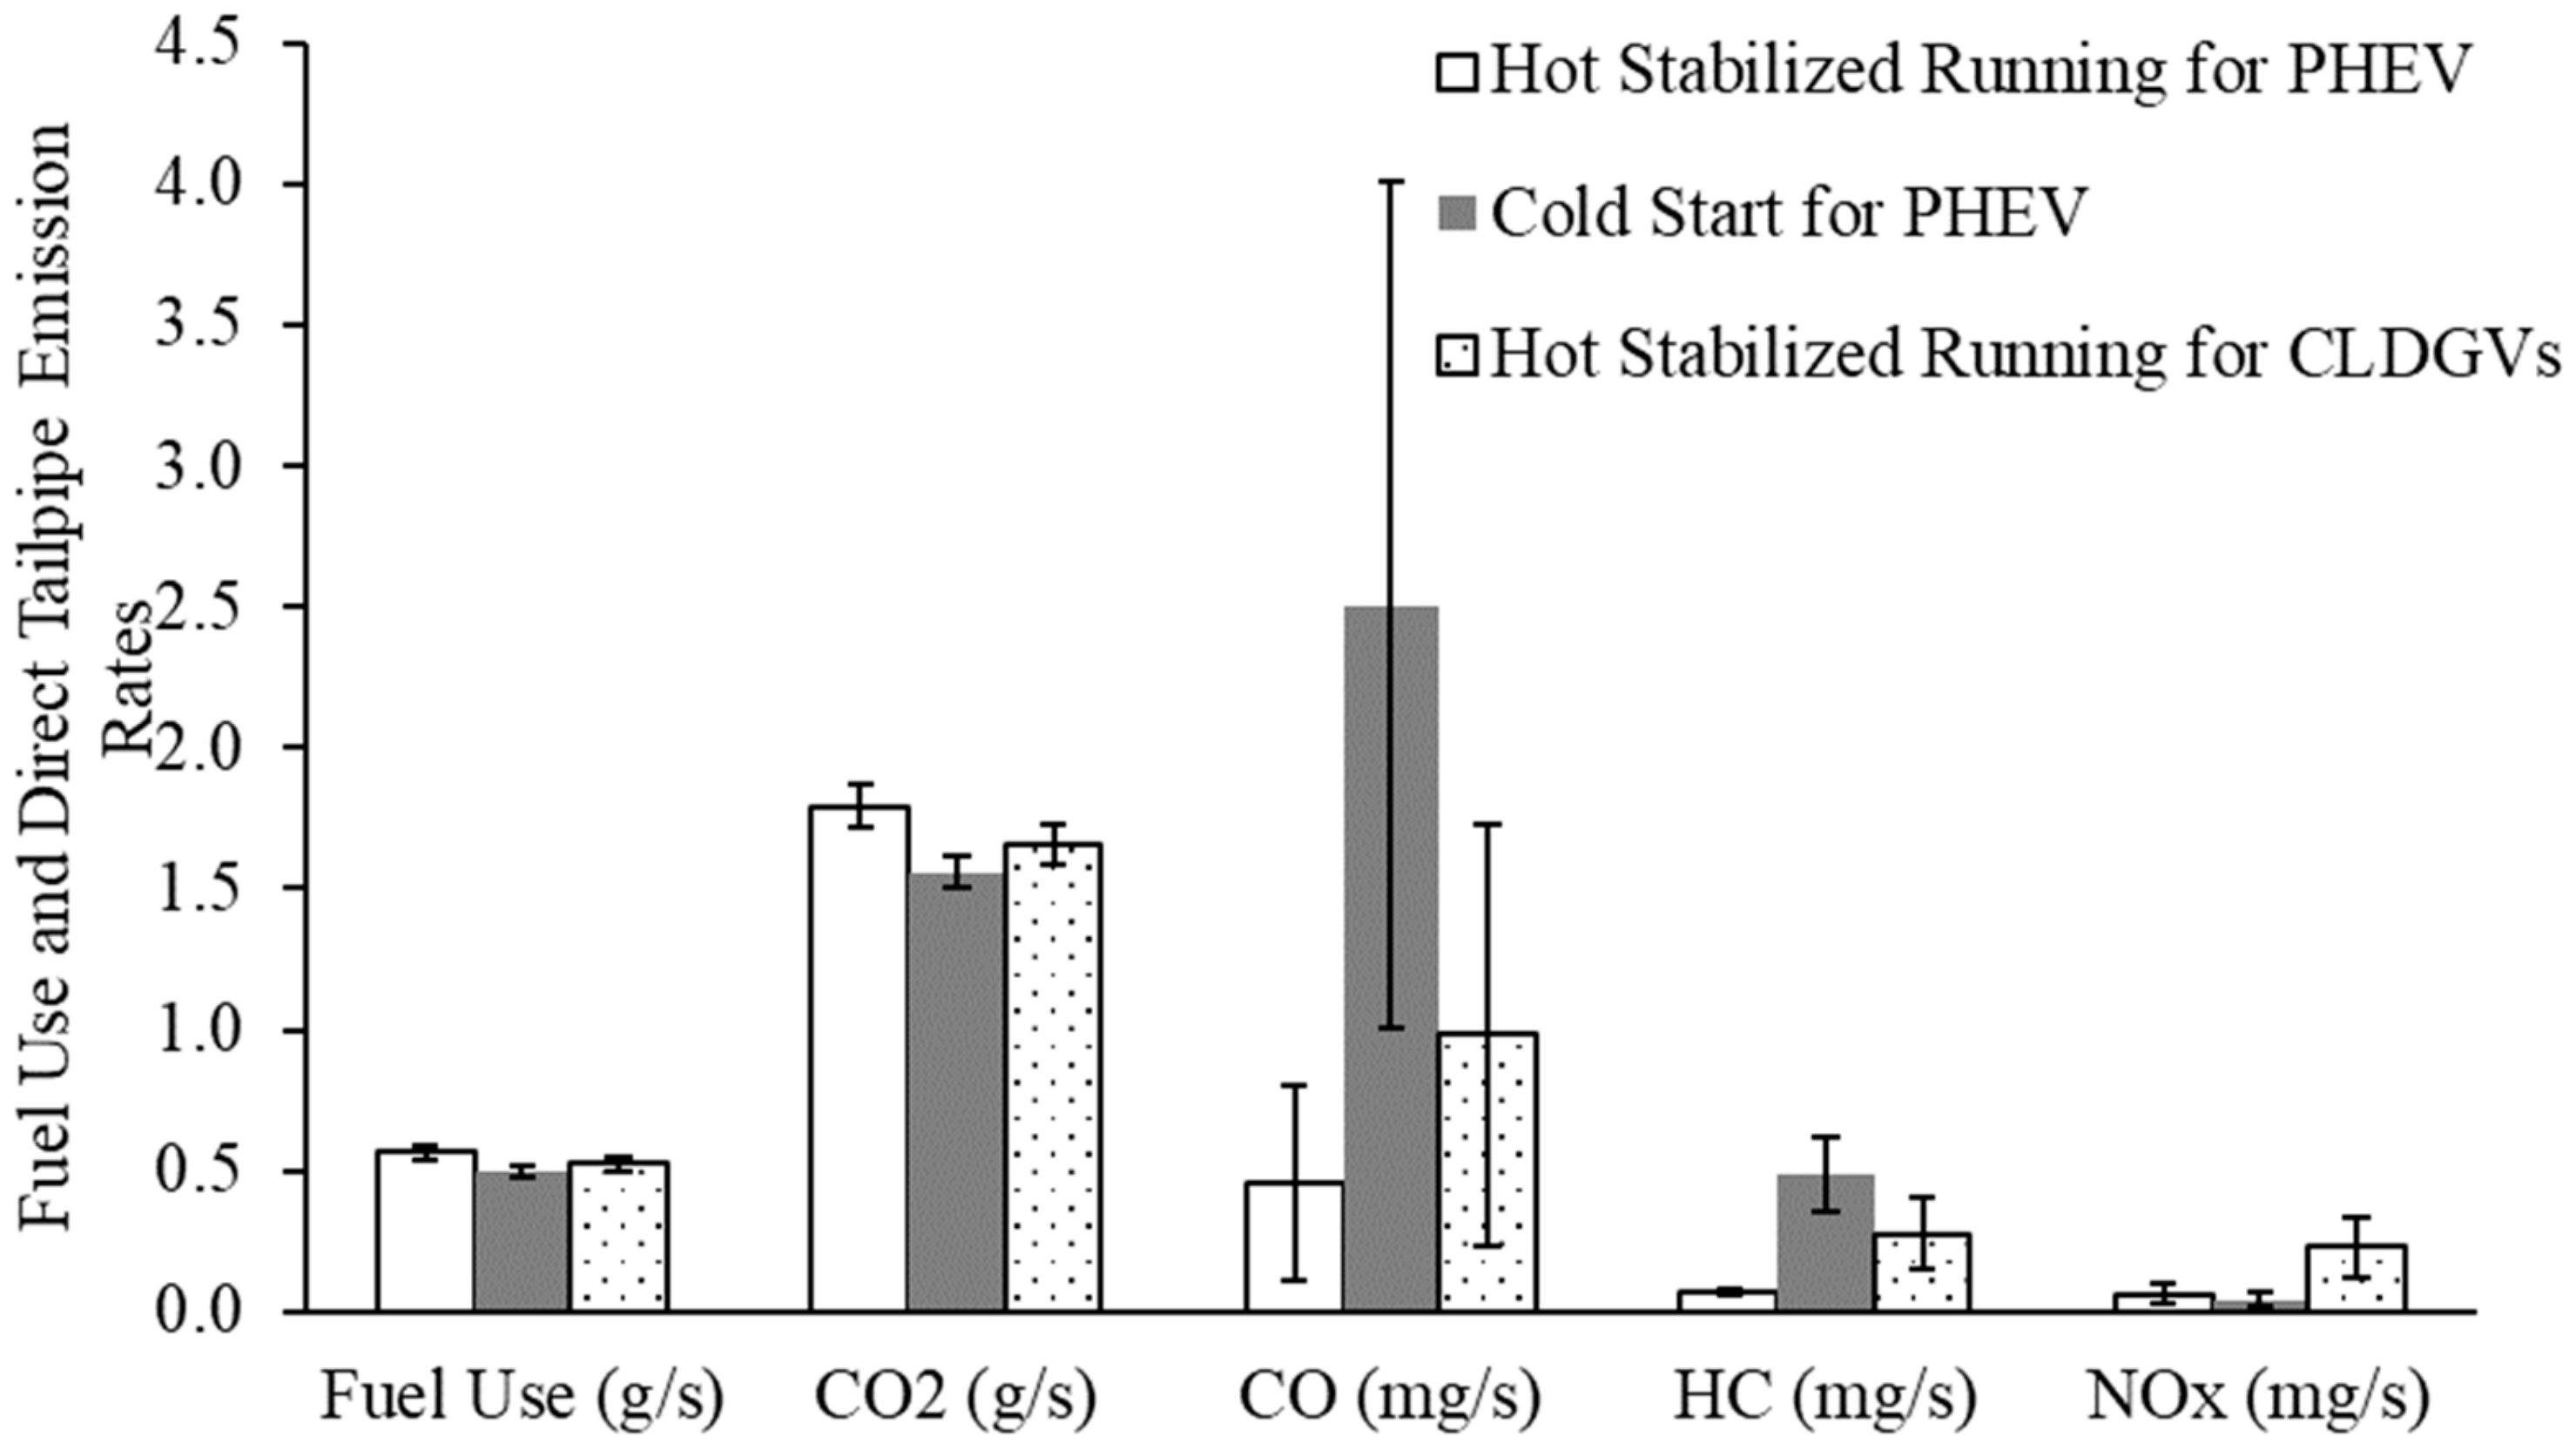
Figure 9 shows the cycle average energy use and direct tailpipe emission rates for cold start and hot stabilized running based on the average cold start cycle. The direct tailpipe NOx emission rates for cold start and hot stabilized running are not significantly different. The fuel use and direct tailpipe CO2 emission rates are 13% less for cold start versus hot stabilized running. The average air-to-fuel ratio (AFR) is 6% lower for cold start versus hot stabilized running. The lower AFR is a factor contributing to higher emissions rates of products of incomplete combustion, such as CO and HC. The tailpipe CO and HC emission rates are 4.5 and 6.2 times higher, respectively, for cold start versus hot stabilized running. Compared to CLDGVs, the on-road PHEV energy-related hot stabilized emissions are lower. However, compared to hot stabilized running for CLDGVs, the direct tailpipe CO and HC emission rates for PHEV cold start are 160% and 76% higher, respectively.

4. Discussion

Quantification of the operational energy use and emission rates of a PHEV is complex because of differences related to charge depleting and charge sustaining modes, the frequency and duration of internal combustion engine operation during charge sustaining mode which is related to cycle average speed, and hot stabilized versus cold start operation. The measurements made here were for a wide range of VSP and, therefore, represent a wide range of engine load. The sensitivity of operational emission rates to variability in electric power generation energy mix was quantified. The PHEV typically has lower operational energy-related emission rates during charge depleting mode than comparable CLDGVS, especially for CO2, CO, HC, NOx, and PM2.5.
Upstream EU&E for two sources of energy, grid electricity and gasoline, substantially contribute to the overall environmental performance of PHEV operation. Thus, fuel cycles for both grid electricity and gasoline should be taken into account when estimating EU&E for PHEVs. The total energy use and pollutant emission rates vary depending on whether PHEV is in CD or CS mode, and the electricity generation resource mix of the region where the PHEV operates.
Although time of day of recharging the TB is not quantified here, the implications of time of day can be inferred by comparing different electric power fuel mixes. Furthermore, policies and programs can be designed and implemented to promote smart charging toward the goal of reducing indirect emissions from power consumption. For example, as photovoltaic solar power generation capacity increases in a particular area, smart charging of PHEVs can be timed to coincide with periods of high solar power generation to reduce indirect emissions [55,56].
An advantage of any plug-in vehicle compared to vehicles that use only on-board fuels (e.g., gasoline) is that as the electric grid becomes cleaner, the vehicle passively becomes cleaner, without need for vehicle replacement. Thus, an entire vehicle fleet comprised of PHEVs can become cleaner without the lag needed for fleet turnover. The average PHEV currently available in the U.S. market has an all-electric range of 21.5 miles, varying from 11 miles for the Mercedes C350e to 47 miles for the Honda Clarity PHEV [8]. Thus, in many cases, a PHEV can meet the daily mobility needs of a user using electric power only, with the gasoline hybrid power train available for backup to mitigate against range anxiety [4,7]. Data collection was based on one complete traction battery charge per overnight. Electric range mileage could have been increased by recharging during the day, such as might be done at a work location.
The field measurements obtained here illustrate that a PHEV can have more than one engine cold start during a trip. All of the data in this study were collected in January during winter. Cold starts are related to the engine, catalytic converter, or both not being fully warmed [12,13,28,29,30,31]. Cold starts can occur in any climate condition, because the ‘light-off’ temperature of the catalyst, above which the catalyst is effective at controlling emissions, is much higher than any ambient temperature [14]. However, the duration and intensity of excess emissions during a cold start typically decreases as ambient temperature increases. Factors that lead to the first few engine starts include battery state of charge and power demand, which are affected by the driving cycle. Thus, although this study is illustrative of generalizable cold start behaviors of PHEVs, such as the likelihood that the first engine start is not at the trip origin, and the potential for multiple cold starts, it is not comprehensive with respect to factors that affect variability in the timing, location, and intensity of cold starts.
There was not sufficient data in this study to compare the cold start extra emissions from the measured PHEV to CLDGVs, because cold starts were not measured for the CLDGVs. For CLDGVs, it has generally been assumed that cold starts occur at the trip origin, since the trip origin is the location of the engine start for a CLDGV. For PHEVs, cold starts may occur many miles from the trip origin. For PHEVs with all electric range greater than typical daily commuting distances, it is also possible that there could be no engine starts and, hence, no cold start emissions related to daily commuting.
This study is unique in that it is based on real-world measurements of an actual PHEV. This research illustrates that a real-world study can be designed to elucidate key sources of variability in PHEV operation, such as CD and CD mode, cold and hot start, and inter-route variability, among others. However, the amount of data needed for this purpose is much larger than is needed to obtain an emissions ‘fingerprint’ of a CLDGV. Based on statistical analysis, the minimum sample size needed to quantify variability in fuel use and emission rates for a CLDGV is about three hours [51]. For PHEVs, the key challenge is to obtain sufficient ICE engine on data. The 2013 Toyota Prius measured here had a nominal electric range of about 15 miles, which varied depending on route choice and traffic conditions. The first few engine starts occur during CD mode and thus are the basis for quantification of cold start emissions. Because cold start must be preceded by a ‘soak’ time of at least 12 hours, there can only be one cold start measurement in a typical day. These considerations motivated an eight day study in which CD mode was measured at least once on each route that originated from the over-night charging location of the vehicle.
The field measurements here exceeded by more than a factor of 10 the typical sample size needed for a CLDGV. These measurements enabled detailed assessment of variability related to power demand, charge depleting and charge sustaining mode, and cold start. Furthermore, it was possible to infer indicators of the complex operations of a PHEV, such as the number of engine starts per mile and the sensitivity of such indicators to charging mode. The measured routes represent typical commuting trips between residential and central business district locations, and took place during peak and off-peak travel times. Thus, the data presented here are representative of a wide range of operating conditions.
However, there are sources of variability that were not addressed here. Examples include variability related to air conditioning and heating and related to passenger or cargo load [9,10,57]. The rigorous measurement of these would require repeating the real-world measurements with sufficient sample size for multiple space conditioning conditions and for multiple passenger or cargo loads.
Tire wear for BEVs is expected to be higher than for comparable CLDGVs because BEVs are heavier as a result of battery weight. BEV brake wear PM10 emissions were estimated to be 11.5 g/mi compared to 9.8 g/mi for conventional vehicles, and PM2.5 emissions were estimated to be 5.9 g/mi versus 4.6 g/mi [57]. PHEVs are also heavier than comparable conventional vehicles. Tire and brake wear emissions occur during both CD and CS modes. However, more data are needed to quantify differences between PHEVs and conventional vehicles with respect to tire and brake wear.
The overall impact and sustainability of PHEVs depends on other factors not addressed here. Examples include vehicle manufacturing, maintenance and repair, and disposal and recycling, and the multiple attributes associated with each of these. From a life cycle inventory perspective, examples of effects of substitution of PHEVs for conventional vehicles include impacts on water demand, electric power consumption, and greenhouse gas emissions [58,59,60]. Examples of life cycle impacts include human toxicity, terrestrial ecotoxicity, acidification [61]. Real-world studies such as the one presented here are needed to develop realistic inputs for life cycle inventory and impact assessment.
The traction battery contributes approximately 60 percent or more the manufacturing life cycle impacts of a PHEV [62]. Recycling of the battery pack helps mitigate against marine eutrophication, human toxicity, and abiotic resource depletion. Battery manufacturing is electricity-intensive. Thus, shifts toward a low carbon electricity mix will reduce the life cycle impacts of battery manufacturing. Attention to designing batteries to facilitate their later recycling could reduce the barriers to recycling and increase the fraction of recoverable materials. Advances that reduce the weight density of batteries could lead to lighter vehicles or vehicles with larger battery capacity [63]. However, the traction battery in a PHEV has a much lower contribution to vehicle weight than in a battery electric vehicle, and PHEVs retain an ICE-based powertrain. Thus, although a light weight and battery cost reduction is expected to reduce PHEV purchase prices, it is unlikely that PHEVs will achieve purchase price parity with conventional gasoline vehicles [64].
The consumer adoption of plug-in vehicles is sensitive to gasoline prices. Price reductions of plug-in vehicles are needed to enhance consumer adoption. Charging infrastructure much reach a critical mass before it will encourage broader plug-in vehicle adoption. Concepts of a sharing economy can be applied to sharing of charging infrastructure [65].
PHEVs are not explicitly accounted for in the U.S. Environmental Protection Agency’s Motor Vehicle Simulation (MOVES) model [66]. VSP-based analyses of measured real-world 1 Hz (second-by-second) data from PEMS can be used to create modal emission rates for incorporation into MOVES. Furthermore, data such as reported here can be used to benchmark and validate detailed vehicle simulation models, such as those developed using Autonomie [9], or others.
This paper demonstrates a methodological approach to quantifying activity, energy use, and emission rates of a PHEV based on real-world measurements. The method can be applied to other makes and models of PHEVs. PHEVs differ with respect to all electric range, battery size, ICE horsepower, vehicle weight, as well as with respect to the design and control of the hybrid system and its operations. For example, the electric driving range of the measured vehicle was approximately 15 miles and was interrupted from time to time by short episodes of ICE operation related to high power demand, whereas other PHEVs may have longer AER and may function solely on electric power until CD mode is completed. The production PHEV measured here is at the low end of the all-electric range of PHEVs currently on the market [8,67]. PHEVs will differ with regard to their electric power and gasoline fuel consumption rates, and these rates will vary also with respect to factors such as speed, acceleration, and road grade. However, although PHEVs may vary in terms of the duration of all electric driving mode, and whether the ICE engine is called upon during charge depleting mode, the methodology demonstrated here can be applied to other PHEVs to quantify these sources of variability.

5. Conclusions

A field study was designed and conducted to focus on key sources of variability in the energy use and emission rates related to PHEV operations, including power demand, charging mode, cold start and hot stabilized operation, and electricity generation resource mix. The results demonstrate that energy use and emission rates of the measured PHEV are sensitive to these factors. Taking into account overall average operations under a wide range of operating conditions, representing multiple routes, times of day, and days of week, the PHEV was typically found to have lower energy use and emission rates than comparable conventional light duty vehicles. These findings were generally robust to variability in energy generation resource mix. The amount of real-world measurement data needed to characterize the microscale energy use and emissions of a PHEV is substantially greater than that for a conventional vehicle because of the additional sources of variability related to charging mode. However, the larger data set enabled quantification of unique aspects of PHEV operation, such as the distribution of cold starts during charge depletion and the transition to charge sustaining operation, that are unlike those of conventional vehicles. PHEVs can produce episodic cold starts on the road rather than at the point of trip origin. The fuel economy rating schemes for PHEVs do not account for energy losses during power generation. However, the measured PHEV was generally more efficient and lower emitting than its comparably sized conventional counterparts. Real-world data such as developed here should be incorporated into life cycle inventory and impact models and can be used to calibrate and evaluate vehicle energy use and emissions simulation models. Given that current PHEVs typically have electric range sufficient to meet the daily driving needs of a large fraction of drivers, PHEVs have the potential to reduce local emissions while also meeting the need for occasional longer trips.

Supplementary Materials

The following are available online at https://www.mdpi.com/1996-1073/13/5/1140/s1, description of the routes tested with the PHEV, schedule of the routes driven each of the eight test days, distribution of travel time in each VSP mode for each route, comparison of upstream emission factors for gasoline production and direct tailpipe emission factors, state-by-state and U.S. national energy mix average emission factors for electricity generation, definitions of CD and CS modes, vehicle activity, energy economy and pollutant mass emission rates for CD and CS modes, pollutant mass emission rates for CD mode for each state depending on varying state electricity generation mix, energy economy and pollutant mass emission rates for CS mode for each study route, definitions of engine “on”, “startup”, “shutdown”, and “off”, pollutant mass emission rates versus VSP mode for CD mode for engine on and off, energy use and pollutant mass emission rates versus VSP mode for CS mode for engine on and off, definition of cold start, traction battery discharging, fuel use, and pollutant mass emission rates versus VSP mode for cold start and hot stabilized running, comparison of air to fuel ratio versus VSP mode between cold start and hot stabilized running, and comparison of cycle tailpipe emission and energy use rates between cold start and hot stabilized running based on average cold start cycle. The supplemental materials includes 54 figures and 26 tables on these topics.

Author Contributions

Conceptualization, H.C.F.; methodology, H.C.F., X.Z., J.H.; software, X.Z.; validation, X.Z.; formal analysis, X.Z., J.H.; investigation, H.C.F., X.Z., J.H.; resources, H.C.F.; data curation, H.C.F.; writing—original draft preparation, H.C.F., X.Z.; writing—review and editing, H.C.F.; supervision, H.C.F.; project administration, H.C.F.; funding acquisition, H.C.F. All authors have read and agreed to the published version of the manuscript.

Funding

This material is based upon work supported by the National Science Foundation under Grant No. 0853766.

Acknowledgments

Mid-Atlantic Toyota loaned the 2013 Toyota Prius Plug-In for use in this study. Susan Collet of Toyota North America assisted in obtaining the loan. Samaneh Babaee, Brandon Graver, Wan Jiao, Bin Liu, and Gurdas Sandhu participated in data collection and data processing.

Conflicts of Interest

The authors declare no conflict of interest.

References

  1. Millo, F.; Rolando, L.; Fuso, R. Real world operation of a complex plug-in hybrid electric vehicle: Analysis of its CO2 emissions and operating costs. Energies 2014, 7, 4554–4570. [Google Scholar] [CrossRef] [Green Version]
  2. Chen, Y.; Hu, K.; Zhao, J.; Li, G.; Johnson, J.; Zietsman, J. In-use energy and CO2 emissions impact of a plug-in hybrid and battery electric vehicle based on real-world driving. Int. J. Environ. Sci. Technol. 2018, 15, 1001–1008. [Google Scholar] [CrossRef]
  3. Lane, B.W.; Dumortier, J.; Carley, S.; Siddiki, S.; Clark-Sutton, K.; Graham, J.D. All plug-in electric vehicles are not the same: Predictors of preference for a plug-in hybrid versus a battery-electric vehicle. Transp. Res. Part D 2018, 65, 1–13. [Google Scholar] [CrossRef] [Green Version]
  4. Williams, B.; Martin, E.; Lipman, T.; Dammen, D. Plug-in-hybrid vehicle use, energy consumption, and greenhouse emissions: An analysis of household vehicle placements in Northern California. Energies 2011, 4, 435–457. [Google Scholar] [CrossRef] [Green Version]
  5. Plotz, P.; Funke, S.A.; Jochen, P. Empirical fuel consumption and CO2 emissions of plug-in hybrid electric vehicles. J. Ind. Ecol. 2017, 22, 773–784. [Google Scholar] [CrossRef] [Green Version]
  6. Alliance of Automobile Manufacturers (2019), Advanced Technology Vehicle Sales Dashboard. Available online: https://autoalliance.org/energy-environment/advanced-technology-vehicle-sales-dashboard/ (accessed on 16 February 2020).
  7. Kane, M. Global Sales December & 2018: 2 Million Plug-In Electric Cars Sold. Available online: https://insideevs.com/news/342547/global-sales-december-2018–2-million-plug-in-electric-cars-sold/ (accessed on 16 February 2020).
  8. EVAdoption, Available PHEVs (In the US): Currently Available Plug-in Hybrid EVs (PHEVs)—US (As of January 3. Available online: https://evadoption.com/ev-models/available-phevs/ (accessed on 16 February 2020).
  9. Mansour, C.; Haddad, M.; Zgheib, E. Assessing consumption, emissions and costs of electrified vehicles under real driving conditions in a developing country with an inadequate road transport system. Transp. Res. Part D 2018, 63, 498–513. [Google Scholar] [CrossRef]
  10. Zhou, B.; Zhang, S.; Wu, Y.; Ke, W.; He, X.; Hao, J. Energy-saving benefits from plug-in hybrid electric vehicles: Perspectives based on real-world measurements. Mitig. Adapt. Strateg. Glob. Chang. 2018, 23, 735–756. [Google Scholar] [CrossRef]
  11. Graver, B.M.; Frey, H.C.; Choi, H.W. In-use measurement of activity, energy use, and emissions of a plug-in hybrid electric vehicle. Environ. Sci. Technol. 2011, 45, 9044–9051. [Google Scholar] [CrossRef]
  12. Chambon, P.; Deter, D.; Irick, D.; Smith, D. PHEV Cold Start Emissions Management. SAE Intern. J. Altern. Powertrains 2013, 2, 252–260. [Google Scholar] [CrossRef]
  13. Hamza, K.; Laberteaux, K. A Study on optimal powertrain Sizing of plugin hybrid vehicles for minimizing criteria emissions associated with cold starts. SAE Intern. J. Altern. Powertrains 2018, 7, 183–193. [Google Scholar] [CrossRef]
  14. Frey, H.C. Critical Review: Trends in onroad transportation energy and emissions. J. Air Waste Manag. Assoc. 2018, 68, 514–563. [Google Scholar] [CrossRef] [PubMed]
  15. Karbowski, D.; Rousseau, A.; Pagerit, S.; Sharer, P. Plug-in Vehicle Control Strategy: From Global Optimization to Real Time Application. In Proceedings of the 22nd Electric Vehicle Symposium, Japan Automobile Research Institute, EVS22, Yokohama, Japan, 22–28 October 2006. [Google Scholar]
  16. Jefferson, C.M.; Barnard, R.H. Hybrid Vehicle Propulsion; WIT Press: Billerica, MA, USA, 2002. [Google Scholar]
  17. Wirasingha, S.G.; Emadi, A. Classification and review of control strategies for plug-in hybrid electric vehicles. IEEE Trans. Veh. Technol. 2001, 60, 111–122. [Google Scholar] [CrossRef]
  18. Sun, L.; Liang, R.; Wang, Q. The Control Strategy and System Preferences of Plug-in HEV. In Proceedings of the Vehicle Power and Propulsion Conference, IEEE, Hei Longjiang, China, 3–5 September 2008; pp. 1–5. [Google Scholar]
  19. Thompson, T.; Webber, M.; Allen, D.T. Air quality impacts of using overnight electricity generation to charge plug-in hybrid electric vehicles for daytime use. Environ. Res. Lett. 2009, 4, 014002. [Google Scholar] [CrossRef]
  20. Hajimiragha, A.H.; Cañizares, C.; Fowler, M.W.; Moazeni, S.; Elkamel, A. A robust optimization approach for planning the transition to plug-in hybrid electric vehicles. IEEE Trans. Power Syst. 2011, 26, 2264–2274. [Google Scholar] [CrossRef]
  21. Samaras, C.; Meisterling, K. Life cycle assessment of greenhouse gas emissions from plug-in hybrid vehicles: Implications for policy. Environ. Sci. Technol. 2008, 42, 3170–3176. [Google Scholar] [CrossRef] [PubMed] [Green Version]
  22. Elgowainy, A.; Burnham, A.; Wang, M.; Molburg, J.; Rousseau, A. Well-to-wheels energy use and greenhouse gas emissions of plug-in hybrid electric vehicles. SAE Tech. Pap. 2009, 2, 627–644. [Google Scholar]
  23. Bradley, T.H.; Frank, A.A. Design, demonstrations and sustainability impact assessments for plug-in hybrid electric vehicles. Renew. Sustain. Energy Rev. 2009, 13, 115–128. [Google Scholar] [CrossRef]
  24. Shidore, N.; Bohn, T.; Duoba, M.; Lohse-Busch, H.; Sharer, P. PHEV ‘All Electric Range’ and Fuel Economy in Charge Sustaining Mode for Low SOC Operation of The JCS VL41M Li-ion Battery Using Battery HIL. In Proceeding of the Electric Vehicle Symposium, Anaheim, CA, USA, 2–5 December 2007; Volume 23, pp. 2–5. [Google Scholar]
  25. Jimenez-Palacios, J.L. Understanding and Quantifying Motor Vehicle Emissions with Vehicle Specific Power and TILDAS Remote Sensing. Ph.D. Thesis, Massachusetts Institute of Technology, Cambridge, MA, USA, 1999. [Google Scholar]
  26. Zhai, H.; Frey, H.C.; Rouphail, N.M. A vehicle-specific power approach to speed-and facility-specific emissions estimates for diesel transit buses. Environ. Sci. Technol. 2008, 42, 7985–7991. [Google Scholar] [CrossRef]
  27. Frey, H.C.; Unal, A.; Chen, J.; Li, S.; Xuan, C. Methodology for Developing Modal Emission Rates for EPA’s Multi-scale Motor Vehicle & Equipment Emission System; EPA420-R-02–027, Prepared by North Carolina State University; USA Environmental Protection Agency: Ann Arbor, MI, USA, 2002.
  28. Markey, J. Federal Test Procedure Review Project: Preliminary Technical Report; EPA 420-R-93–007; USA Environmental Protection Agency: Ann Arbor, MI, USA, 1993.
  29. Weilenmann, M.; Favez, J.Y.; Alvarez, R. Cold-start emissions of modern passenger cars at different low ambient temperatures and their evolution over vehicle legislation categories. Atmos. Environ. 2009, 43, 2419–2429. [Google Scholar] [CrossRef]
  30. Alvarez, R.; Weilenmann, M. Effect of low ambient temperature on fuel consumption and pollutant and CO2 emissions of hybrid electric vehicles in real-world conditions. Fuel 2012, 97, 119–124. [Google Scholar] [CrossRef]
  31. Duarte, G.O.; Varella, R.A.; Gonçalves, G.A.; Farias, T.L. Effect of battery state of charge on fuel use and pollutant emissions of a full hybrid electric light duty vehicle. J. Power Sources 2014, 246, 377–386. [Google Scholar] [CrossRef]
  32. Kum, D.; Peng, H.; Bucknor, N.K. Optimal energy and catalyst temperature management of plug-in hybrid electric vehicles for minimum fuel consumption and tail-pipe emissions. IEEE Trans. Control Syst. Technol. 2013, 21, 14–26. [Google Scholar] [CrossRef]
  33. Frey, H.C.; Zhang, K.; Rouphail, N.M. Fuel use and emissions comparisons for alternative routes, time of day, road grade, and vehicles based on in-use measurements. Environ. Sci. Technol. 2008, 42, 2483–2489. [Google Scholar] [CrossRef] [PubMed]
  34. Frey, H.C.; Graver, B.M. Real-world activity, energy use, and emissions of a plug-in hybrid electric vehicle. In Grid Electrified Vehicle: Performance, Design, and Environmental Impact; Nova Science Publishers: New York, NY, USA, 2013; Chapter 9. [Google Scholar]
  35. OEM-2100AX Axion User’s Manual, Version 2; Clean Air Technologies International, Inc.: Buffalo, NY, USA, 2008.
  36. Frey, H.C.; Unal, A.; Rouphail, N.M.; Colyar, J.D. On-road measurement of vehicle tailpipe emissions using a portable instrument. J. Air Waste Manag. Assoc. 2003, 53, 992–1002. [Google Scholar] [CrossRef] [PubMed] [Green Version]
  37. Myers, J.; Kelly, T.; Dindal, A.; Willenberg, Z.; Riggs, K. Environmental Technology Verification Report: Clean Air Technologies International, Inc. REMOTE On-Board Emissions Monitor; USA Environmental Protection Agency: Cincinnati, OH, USA, 2003.
  38. Boroujeni, B.Y.; Frey, H.C. Road grade quantification based on global positioning system data obtained from real-world vehicle fuel use and emissions measurements. Atmos. Environ. 2014, 85, 179–186. [Google Scholar] [CrossRef]
  39. Wang, M. GREET 1.5—Transportation Fuel-Cycle Model - Volume 1: Methodology, Development, Use, and Results; Center for Transportation Research, Energy Systems Division, Argonne National Laboratory: Lemont, IL, USA, 1999.
  40. Hybrid-EV Committee. Recommended Practice for Measuring the Exhaust Emissions and Fuel Economy of Hybrid-Electric Vehicles, Including Plug-in Hybrid Vehicles. In Proceedings of the SAE Std. J1711_SAE World Congress, Detroit, MI, USA, 13–15 April 2010. [Google Scholar]
  41. USA Environmental Protection Agency. New Fuel Economy and Environment Labels for a New Generation of Vehicles; EPA-420-F-11–017a; Research Triangle Park: Durham, NC, USA, 2011. [Google Scholar]
  42. USA Environmental Protection Agency. eGRID 9th edition Version 1.0—Summary Tables for year 2010 data. Available online: https://www.epa.gov/energy/egrid-9th-edition-version-10-summary-tables-year-2010-data (accessed on 16 February 2020).
  43. USA Energy Information Administration. Electricity: Detailed State Data. Available online: http://www.eia.gov/electricity/data/state/ (accessed on 16 February 2020).
  44. USA Energy Information Administration. Electricity: Form EIA-923 detailed data with previous form data (EIA-906/920). Available online: http://www.eia.gov/electricity/data/eia923/ (accessed on 16 February 2020).
  45. USA Environmental Protection Agency. 2011 National Emissions Inventory (NEI) Data. Available online: https://www.epa.gov/air-emissions-inventories/2011-national-emissions-inventory-nei-data (accessed on 16 February 2020).
  46. USA Environmental Protection Agency. State CO2 Emissions from Fossil Fuel Combustion. Available online: https://www.epa.gov/statelocalenergy/state-co2-emissions-fossil-fuel-combustion (accessed on 16 February 2020).
  47. USA Department of Energy, Lower and Higher Heating Values of Hydrogen and Other Fuels. Available online: https://h2tools.org/hyarc/hydrogen-data/lower-and-higher-heating-values-hydrogen-and-other-fuels (accessed on 16 February 2020).
  48. International Carbon Bank & Exchange. Volume Calculation of One Ton CO. Available online: http://www.icbe.com/carbondatabase/CO2volumecalculation.asp (accessed on 16 February 2020).
  49. Andervazh, M.-R.; Javadi, S. Emission-economic dispatch of thermal power generation units in the presence of hybrid electric vehicles and correlated wind power plants. IET Gener. Transm. Distrib. 2017, 11, 2232–2243. [Google Scholar] [CrossRef]
  50. Sandhu, G.S.; Frey, H.C. Effects of errors on vehicle emission rates from portable emissions measurement systems. Trans. Res. Rec. 2013, 2340, 10–19. [Google Scholar] [CrossRef]
  51. Frey, H.C.; Zhang, K.; Rouphail, N.M. Vehicle specific emissions modeling based on On-Road measurements. Environ. Sci. Technol. 2010, 44, 3594–3600. [Google Scholar] [CrossRef]
  52. Liu, B.; Frey, H.C. Variability in light-duty gasoline vehicle emission factors from trip-based real-world measurements. Environ. Sci. Technol. 2015, 49, 12525–12534. [Google Scholar] [CrossRef]
  53. Zhai, H.; Frey, H.C.; Rouphail, N.M. Development of a modal emissions model for a hybrid electric vehicle. Transp. Res. Part D 2011, 16, 444–450. [Google Scholar] [CrossRef]
  54. Choi, H.W.; Frey, H.C. Method for in-use measurement and evaluation of the activity, fuel use, electricity use, and emissions of a plug-in hybrid diesel-electric school bus. Environ. Sci. Technol. 2010, 44, 3601–3607. [Google Scholar] [CrossRef] [PubMed]
  55. McLaren, J.; Miller, J.; O’Shaughnessy, E.; Wood, E.; Shapiro, E. Emissions Associated with Electric Vehicle Charging: Impact of Electricity Generation Mix, Charging Infrastructure Availability, and Vehicle Type; NREL/TP-6A20–64852; National Renewable Energy Laboratory: Golden, CO, USA, April 2016.
  56. Gadh, R. Demonstrating Plug-in Electric Vehicles Smart Charging and Storage Supporting the Grid; CEC-500–2018–020; UCLA Smart Grid Energy Research Center (SMERC) for California Energy Commission: Sacramento, CA, USA, 2016.
  57. Timmers, V.R.J.H.; Achten, P.A.J. Non-exhaust pm emissions from electric vehicles. Atmos. Environ. 2016, 10–17. [Google Scholar] [CrossRef]
  58. Faria, R.; Marques, P.; Moura, P.; Freire, F.; Delgado, J.; de Almeida, A.T. Impact of the electricity mix and use profile in the life-cycle assessment of electric vehicles. Renew. Sustain. Energy Rev. 2013, 24, 271–287. [Google Scholar] [CrossRef]
  59. Onat, N.C.; Kucukvar, M.; Tatari, O. Well-to-wheel water footprints of conventional versus electric vehicles in the United States: A state-based comparative analysis. J. Clean. Prod. 2018, 204, 788–802. [Google Scholar] [CrossRef]
  60. Bicer, Y.; Dincer, I. Life cycle environmental impact assessments and comparisons of alternative fuels for clean vehicles. Resour. Conserv. Recycl. 2018, 132, 141–157. [Google Scholar] [CrossRef]
  61. Onat, N.C.; Kucukvar, M.; Afshar, S. Eco-efficiency of electric vehicles in the United States: A life cycle assessment based principal component analysis. J. Clean. Prod. 2019, 212, 515–526. [Google Scholar] [CrossRef]
  62. Cusenza, M.A.; Bobba, S.; Ardente, F.; Cellura, M. Energy and environmental assessment of a traction lithium-ion battery pack for plug-in hybrid electric vehicles. J. Clean. Prod. 2019, 215, 634–649. [Google Scholar] [CrossRef]
  63. Zanchi, L.; Delogu, M.; Ierides, M.; Vasiliadis, H. Life Cycle Assessment and Life Cycle Costing as Supporting Tools for EVs Lightweight Design. In Sustainable Design and Manufacturing SDM Smart Innovation, Systems and Technologies; Setchi, R., Howlett, R., Liu, Y., Theobald, P., Eds.; Springer: Cham, Switzerland, 2016. [Google Scholar]
  64. Lutsey, N.; Nicholas, M. Update on Electric Vehicle Costs in the United States Through Working Paper 2019. In Proceedings of the International Council on Clean Transportation, Ankara, Turkey, 2 April 2019. [Google Scholar]
  65. Feng, B.; Ye, Q.; Collins, B.J. A dynamic model of electric vehicle adoption: The role of social commerce in new transportation. Inf. Manag. 2019, 52, 196–212. [Google Scholar] [CrossRef]
  66. USA Environmental Protection Agency. MOVES2014a User Guide; EPA-420-B-15–095; USA Environmental Protection Agency: Ann Arbor, MI, USA, November 2015.
  67. Kane, M. PHEV Car Range, Price & More Compared For, USA—July. Available online: https://insideevs.com/news/361183/phev-car-compared-us-july-2019/ (accessed on 24 February 2020).
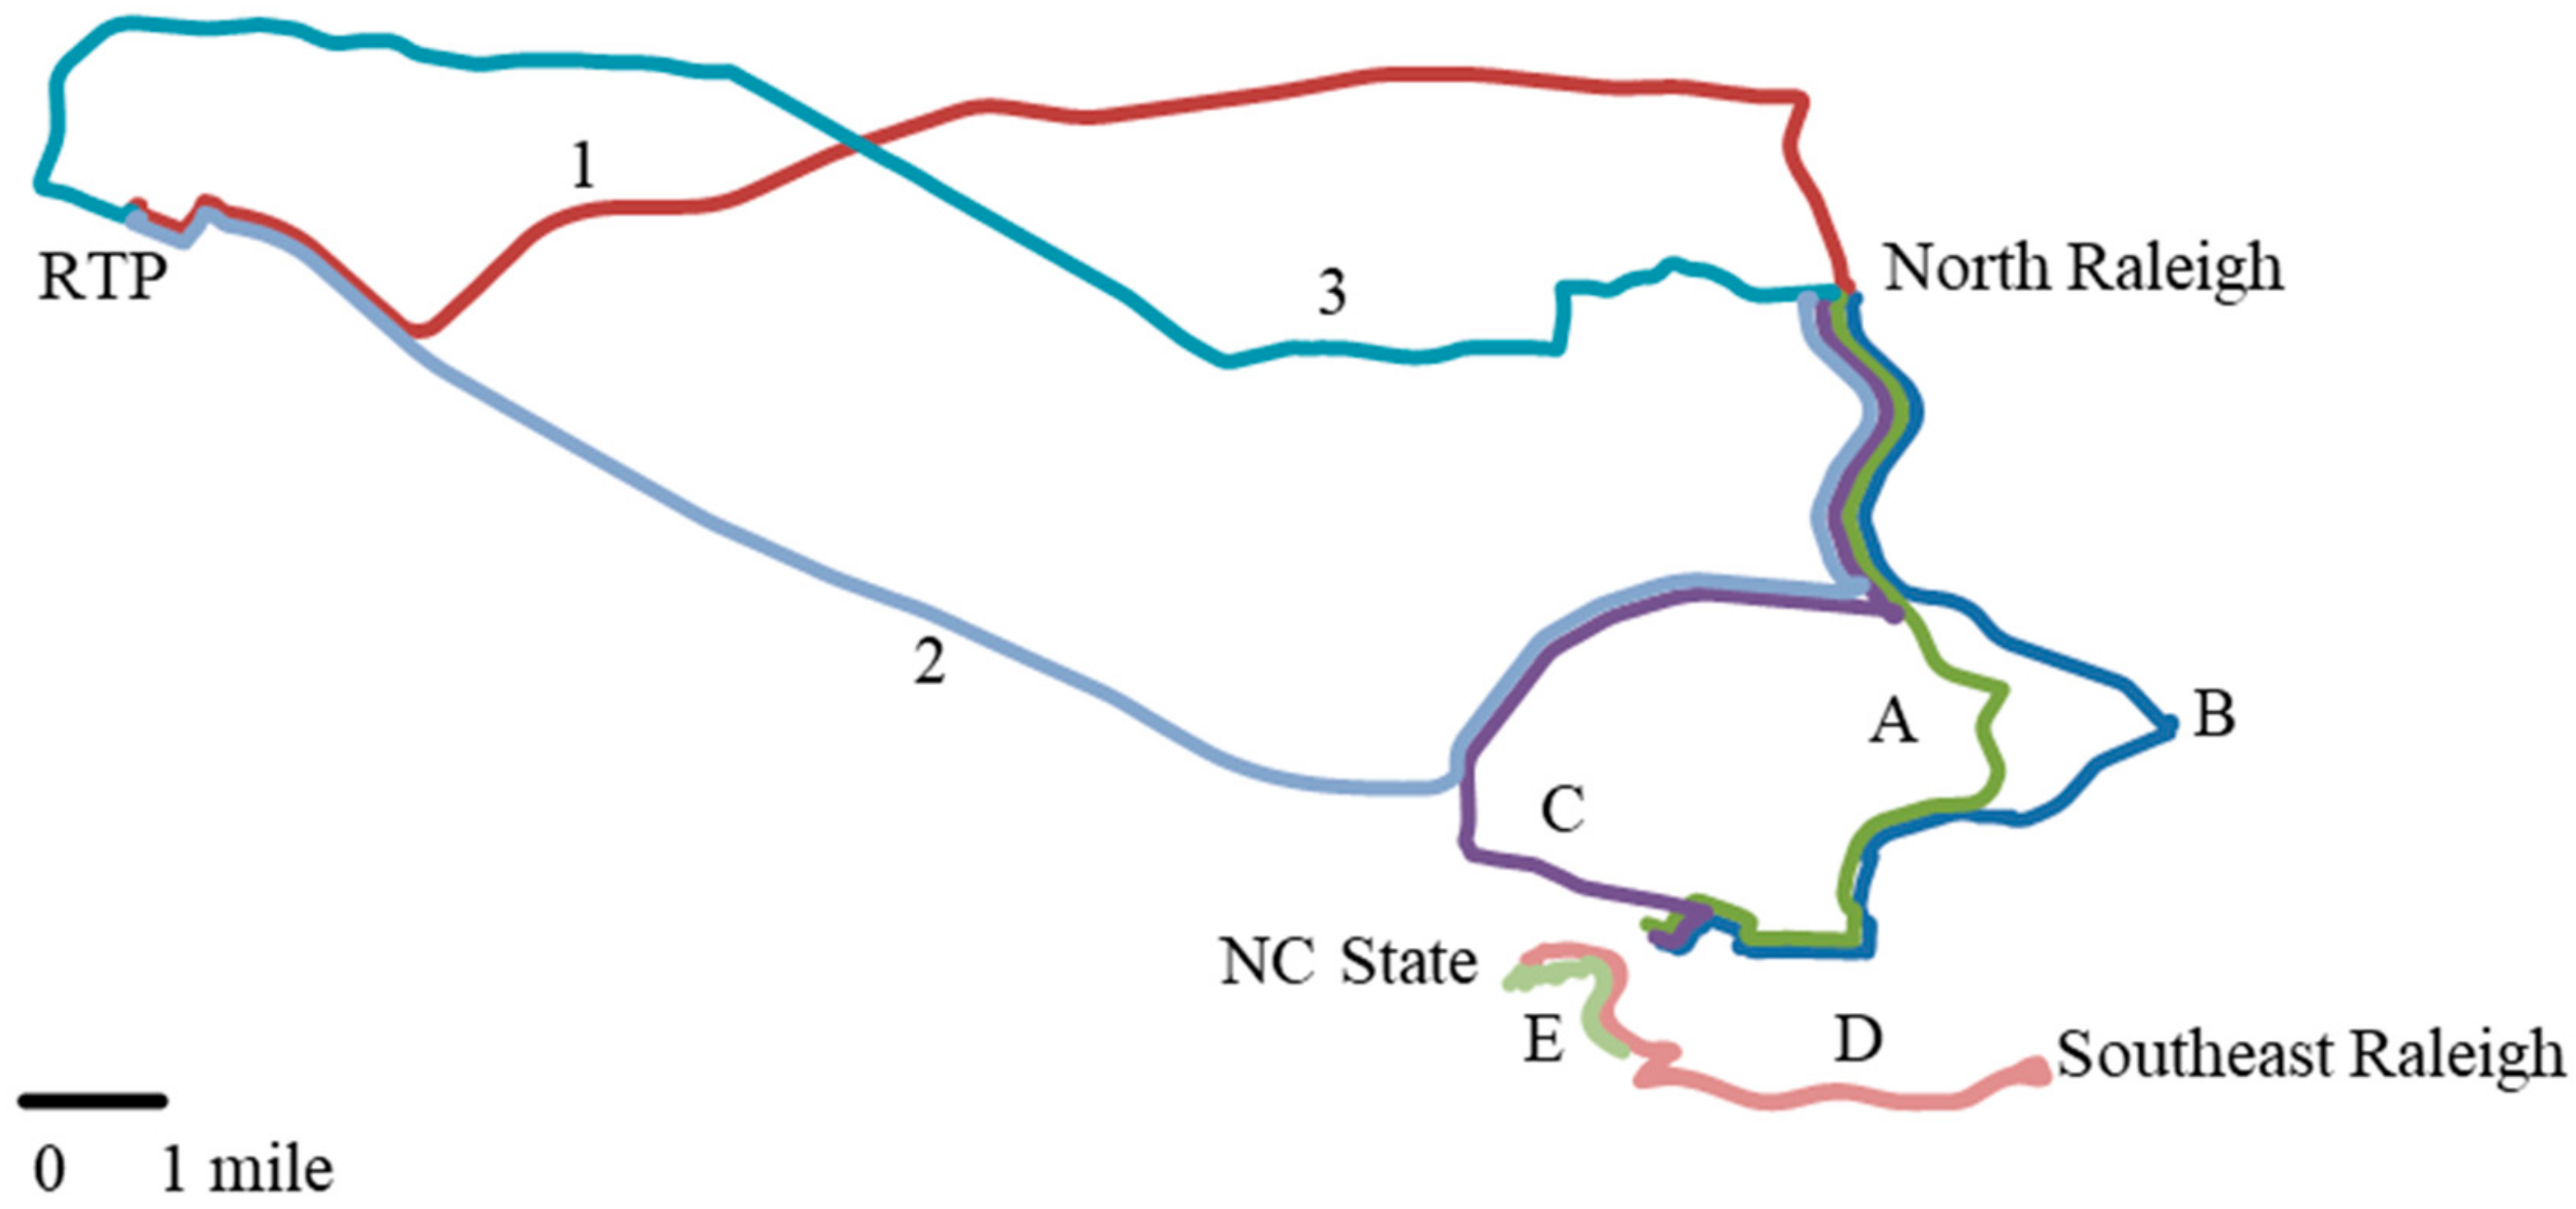
Figure 1. Map of Study Routes in the Raleigh, North Carolina, USA area for Routes A, B, and C between North Carolina (NC) State University and North Raleigh, Route D between NC State University (NC State) and Southeast Raleigh, Route E within NC State, and Routes 1, 2 and 3 between North Raleigh and Research Triangle Park (RTP).
Energies 13 01140 g001
Figure 2. Second-by-second (a) traction battery state of charge and (b) engine speed versus cumulative travel time for one example measurement day for a 2013 Toyota Pruis Plug-In Hybrid vehicle, with Charge Depleting (CD) and Charge Sustaining (CS) modes indicated. During charge depleting mode, there are infrequent engine starts during episodes of high power demand. These data are from the On-Board Diagnostic (OBD) data link. State of charge is reported to the nearest percent and engine speed is reported to the nearest revolution per minute.
Energies 13 01140 g002
Figure 3. The route average number of engine starts, duration of engine on operation, and proportion of distance traveled during engine on operation versus route average speed, based on both travel directions for Routes A, B, C, 1, 2, and 3 and a complete circuit on Routes D and E.
Energies 13 01140 g003
Figure 4. The daily average gasoline equivalent energy use and pollutant mass emission rates for Charge Depleting (CD) and Charge Sustaining (CS) modes for a 2013 Toyota Prius Plug-In Hybrid, based on the North Carolina electric power energy mix. Error bars indicate 95% confidence intervals on the mean based on day-to-day variability (Sample Size = 8). For CD mode, the total energy use and emissions include indirect electric grid energy use and emissions, upstream energy use and emissions for gasoline production, and direct gasoline consumption and tailpipe emissions. For CS mode, the total energy use and emissions include upstream energy use and emissions for gasoline production and direct gasoline consumption and tailpipe emissions.
Energies 13 01140 g004
Figure 5. The daily average charge depleting mode emission rates based on state average power generation energy mixes for (a) carbon dioxide (CO2), (b) nitrogen oxides (NOx), and (c) fine particulate matter (PM2.5). Error bars indicate 95% confidence intervals on the mean based on day-to-day variability (n = 8 days). The emission rates include indirect emissions for electricity production (including feedstock recovery, production and transportation, and electricity generation and transmission), upstream emissions from gasoline production (including crude oil recovery and transportation, and gasoline refining, transportation and distribution), and direct tailpipe emissions. For PM2.5 only, direct tailpipe emissions are assumed to be negligible. Data are shown for all 50 states and the District of Columbia, with labels visible for example states.
Energies 13 01140 g005
Figure 6. The gasoline equivalent energy use rate versus Vehicle Specific Power (VSP) Mode for engine on and off for Charge Depleting (CD) Mode for a 2013 Toyota Prius Plug-In Hybrid, based on the North Carolina state average electric power generation energy mix in 2011. Error bars indicate 95% confidence intervals on the mean based on second-by-second variability in total energy use. The vehicle does not have enough power in CD mode to operating in VSP modes 13 or 14. For engine on, the total energy use includes upstream energy use for gasoline production, direct gasoline consumption, energy use from regenerative braking, and indirect energy use from electric grid. For engine off, the total energy use includes energy use from regenerative braking, and indirect energy use from electric grid.
Energies 13 01140 g006
Figure 7. The carbon dioxide (CO2) emission rate versus Vehicle Specific Power (VSP) Mode for engine on and off for Charge Depleting (CD) Mode for a 2013 Toyota Prius Plug-In Hybrid, on the North Carolina state average electric power generation energy mix in 2011. Error bars indicate 95% confidence intervals on the mean based on second-by-second variability. The vehicle does not have enough power in CD mode to operating in VSP modes 13 or 14. For engine on, the total CO2 emission includes upstream emission for gasoline production, direct tailpipe emission, and indirect emission from electric grid. For engine off, the total CO2 emission includes indirect emission from electric grid.
Energies 13 01140 g007
Figure 8. Example second-by-second time plots of catalyst temperature and tailpipe exhaust carbon monoxide (CO) concentration for one day of real-world measurements of 2013 Toyota Prius Plug-In. Engine starts S1, S2, and S3 occur during Charge Depleting mode. Engine start S4 is the transition from Charge Depleting to Charge Sustaining mode. Catalyst temperature shown is reported by the On-Board Diagnostic (OBD) data link. Carbon monoxide concentration is based on raw data reported by the Portable Emission Measurement System. Exhaust CO concentrations are precise to within plus or minus 0.02 volume percent.
Energies 13 01140 g008
Figure 9. The cycle average gasoline fuel use and direct tailpipe emission rates for a 2013 Toyota Prius Plug-In Hybrid Electric Vehicle (PHEV) for Cold Start and Hot Stabilized Running, and for the average of 18 Conventional Light Duty Gasoline Vehicles (CLDGVs) for Hot Stabilized Running, based on an average cold start cycle.
Energies 13 01140 g009
Table 1. Definitions of Abbreviations.
AbbreviationDefinitionAbbreviationDefinition
AERAll Electric RangeMFFMass Fuel Flow
BEVBattery Electric VehicleNDIRNon-Dispersive Infrared
CDCharge Depleting NOxNitrogen Oxides
CLDGVConventional Light Duty Gasoline VehiclePHEVPlug-in Hybrid Electric Vehicle
COCarbon MonoxidePM10Particulate Matter less than 10 micro-meters in aerodynamic diameter
CSCharge SustainingPM2.5Particulate Matter less than 2.5 micro-meters in aerodynamic diameter
CSEECold Start Extra EmissionsRFGReformulated Gasoline
EIAEnergy Information AdministrationRPMRevolutions Per Minutee
ETVEnvironmental Technology VerificationSAESociety of Automotive Engineers
EU&EEnergy Use & EmissionsSOCState of Charge
GPSGlobal Position SystemSOxSulfur Oxides
GREETGreenhouse Gases, regulated Emissions, and Energy use in TransportationTBTraction Battery
HCHydrocarbonsTcatCatalyst Temperature
HEVHybrid Electric VehicleTECEngine Coolant Temperature
IATIntake Air TemperatureTWCThree Way Catalyst
ICEInternal Combustion EngineVOCVolatile Organic Compound
MAFMass Air FlowVSPVehicle Specific Power
MAPManifold Absolute PressureVSSVehicle Speed
Table 2. Definitions of Vehicle Specific Power (VSP) Modes.
ModeVSP Range (kW/ton)ModeVSP Range (kW/ton)ModeVSP Range (kW/ton)
LowerUpperLowerUpperLowerUpper
1−∞< −26≥ 7< 1011≥ 23< 28
2≥ −2< 07≥ 10< 1312≥ 28< 33
3≥ 0< 18≥ 13< 1613≥ 33< 39
4≥ 1< 49≥ 16< 1914≥ 39+∞
5≥ 4< 710≥ 19< 23
Table 3. Sensitivity of Plug-In Hybrid Electric Vehicle (PHEV) Charge Depleting (CD) Mode Gasoline Equivalent Energy Use and Emission Rates to Electricity Generation Mix and Comparison to Charge Sustaining (CS) Mode and Conventional Light Duty Gasoline Vehicles (CLDGVs).
Vehicle TypeModeStateaMain Energy ResourceEnergy UseCO2COHCNOxSOxPM2.5PM10
g/milemg/mile
PHEVCDbHIOil90.42.6× 1022.9× 102557.3 × 1025.8 × 1025465
WVCoal84.43.0 × 1021.1 × 102512.4 × 1023.3 × 1023562
RIGas72.71.7 × 1021.5 × 102471.1 × 102515.26.0
VTNuclear87.2471.1 × 1022845222.63.6
IDHydro80.654772836232.53.4
CSc----69.02.0 × 10278711.2 × 102928.011
CLDGVsd------1.27 × 1023.7 × 1024.2 × 1021.7 × 1022.6 × 1021.7 × 1021521
a. HI = Hawaii, WV = West Virginia, RI = Rhode Island, VT = Vermont, and ID = Idaho. b. For PHEV in CD mode, the total energy use and emissions include indirect energy use and emissions from electric grid, upstream energy use and emissions for gasoline production, and direct gasoline consumption and tailpipe emissions. c. For PHEV in CS mode and CLDGVs, the total energy use and emissions include upstream energy use and emissions for gasoline production and direct gasoline consumption and tailpipe emissions. d. Based on the average of 18 vehicles measured in prior work. Includes upstream emissions from gasoline production and distribution. The 95% confidence interval on the mean energy use and CO2 emission rates is ± 5%. The 95% confidence intervals are typically ± 50% for each pollutant emission rate, except for CO for which the uncertainty in the mean is approximately a factor of 2.