Abstract
This is an overview of a Key Note lecture; the quote for this lecture is from T.S. Eliot: “We must not cease from exploration and at the end of all our exploring will be to arrive, where we began, and, to know the place for the first time”. This quote highlights that the process of scientific development goes in circles, yet each of them goes above the previous circle, building up the ladder of knowledge. Closing one circle and opening the next may be either be a quiet, unnoticeable event or a roaring loud, scientific revolution. Building science (physics) was started about 100 years ago, but only now are we closing its second circle. Perhaps, because of building physics’ role in the fourth industrial revolution, this discipline itself is undergoing a scientific revolution The first industrial revolution was based on steam generated by burning coal, the second was based on petroleum, and the third on electricity and concentrated electricity production. The current one, i.e., the fourth, is based on distributed energy sources combined with information technology.
1. Creating Building Physics (1925–1950)
Before we go to the future Building Science transformation and the scientific revolution [1] we need to start with the history.
In 1919, a commercial thermal insulation called “Pal-O-Pack” was manufactured in Saskatoon, Canada. It used shredded newsprint with a small admixture of lime solution [2]. In 1926, this insulation was pneumatically applied using the discharge of air from an “Electrolux” vacuum cleaner into a wood frame house. This event, a first recorded retrofitting of a wood frame house, can be considered as the birth of the new endeavor that became very popular 50 years later.
Within the 1930s, the University of Minnesota introduced the weather barrier (asphalt impregnated kraft paper), and the University of Wisconsin introduced the first water vapor retarder, because adding thermal insulation in the wall cavity created a new problem. It lowered a dew point inside the wall causing a winter condensation of water vapor. So, in 1950, we had all the elements of building physics: materials for environmental control, moisture problems created by condensation of water vapor, and first methods for calculating the drying rates of walls.
2. Simplification and Stagnation in Building Physics (1950–1975)
The theoretical development of building physics took place in Germany and Russia, where several published books dealt with the thermal stability of buildings [3,4] and calculations of masonry drying [5]. As the post-war construction boom introduced changes in housing and new wood products increased the airtightness of wood frame houses (called timber houses in Germany), the presence of excessive condensation became apparent.
In 1958, Glaser explained, with help of simple graphics, what scientists had known since 1939 [6]. Yet, his explanation, in a time of visible condensation, was translated from German into different languages and enshrined in various standards. The condensation actually happens, but water and vapor continue moving on, making the calculations based on Glaser theory null and void.
This situation highlights that an easy to understand explanation of a perceived problem stays in the mind better than a description of the problem’s complexity. To explain the real phenomena in materials, over the course of a decade (until the mid-1970s), the Lund University team [7,8] published experiments, and developed two simultaneous heat and moisture transfer models, but to no avail. The era of building physics stagnation was firmly established.
The simultaneous transfer of heat and mass (the latter being: moist air, water vapor, liquid water attached to material surface, and liquid water with entrapped air bubbles in large voids of material), i.e., a standard interacting heat and mass transfer in porous materials, was too complex in comparison to the simple graphics of Glaser’s. In 1972, during the meeting of the international heat and moisture transfer committee (CIB W40) in Washington, USA, delegates from all countries tried to convince German colleagues that one cannot use Glaser theory, even with a variable vapor transfer coefficient.
The rescue came 20 years later, when a model [9] that was close to 1970s Swedish models got commercial recognition, sufficient enough to make an impact in this field. As a curiosity, in 2016, the author, who was invited to teach a course of building physics in Poland, was told that the EU curriculum requires teaching Glaser’s theory—he replied: “Of course, I always teach it, as an example that you cannot simplify the nature of phenomena, before you understand it.”
3. New Objectives Give Building Physics New Life (1975–2000)
With building physics following a group of ignorant people, North America followed professor Neil B. Hutcheon [10], who, in 1971, when invited to give a talk at building research institute in India, said:
“Knowledge about building, called, for convenience, building science is valuable largely because it is useful in predicting the outcome of the result of some building situation. Rational design is possible only when there is a capability to establish, each time a choice is made, the probability of a particular result.”
Hutcheon explained that predictability of performance requires both the trained professional (buildability depends on the designer) and a method (that can be based on tradition, testing or an integrated test and model), but this method must involve:
- The environment
- Adjacent materials in the assembly
- On-site factors (workmanship)
Nevertheless, the impulse for a real change came from another unusual event highlighted in Figure 1.

Figure 1.
For a few days during so-called energy crisis, all private cars were banned in some EU countries (Holland is shown in this picture, source unknown).
The energy crisis of 1973 brought to people’s attention that petroleum, while plentiful today, must be considered as a finite resource. The gloom that it forecasted in 1973 did not happen; yet the people’s attitude to energy was slowly changing. While the airtightness of houses in Canada in the years 1946 to 1960 and 1961 to 1976 was practically the same, varying in the range of 2 to 10 ACH, that measured in the years 1977–1980 was between 0.5 and 3 ACH, when tested at 50 Pa pressure difference.
This implies that the energy crisis brought the northern housing (Sweden, Canada) to an average 1.4–1.5 ACH at 50 Pa pressure. Using exponent n = 0.71 in the pressure equation for recalculation, one obtains 0.30 to 0.35 ACH at 3 to 4 Pa pressure difference (i.e., a practical service range), that describes a requirement for people’s breathing.
In 1976, researchers at Illinois TU designed a low energy house and in 1977, in the province of Saskatchewan in Canada, 10 houses were built along their concepts. A demonstration house for this new technology (Figure 2) was built in Regina, province of Saskatchewan, Canada.
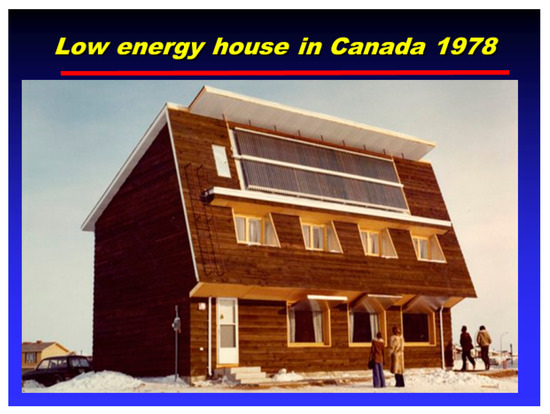
Figure 2.
Saskatchewan Energy Conservation house designed by the Illinois U demonstrated passive technology in 1978 (Regina). Solar exposed surface with large windows is slightly inclined. Evacuated solar pipes are placed on the attics level. It was provided with air-sourced heat pump and polyethylene-based heat recovery ventilator. Reprinted with permission of Harold Orr.
One may be surprised to see that 40 years ago we had almost current technology. This then begs the question: Why was this technology not used in the market place?
Primarily because there was no real contact between the building science and the socioeconomic forces driving the evolution of building construction. The design and construction shown in Figure 2 represented the idea of building science leaders in North America, but the construction industry was not prepared to follow, because it did not see the need. The gap between building science (physics) and builders was then, and is today, a critical issue that slows progress in climate change reduction [11]. Builders, however, respond to what the public wants them to do. Effectively, as our university does not teach a holistic view of society and technology, it takes time to develop a grass root understanding. Recently, while talking with Harold Orr, we agreed that 40 years ago we had the knowledge of the technology, but not the understanding of building performance.
This question was analyzed in the paper [12] and the following observations summarize the difference between then and now:
- Heat, air and moisture transports are inseparable and cannot be assessed in separation from each other. Today, we talk about “environmental control”.
- Often, when in practice one modifies materials or construction details, one finds that the cost of repairs following these minute changes is significant. This happens each time when we analyze only the detail itself and forget about its interaction with the other elements of the system [13]. In other words, we fail when we lose track of the holistic approach.
- The modification of details in the building enclosure is slow but continuing. Note that leaky and poorly insulated walls dried quickly. Airtight, insulated on exterior, walls are drying slowly. If water enters around the window frame, it will stay inside the wall. This highlights the need for an environmental control design.
- Building physics followed the evolution of practice [14] and lessons from any solution of the encountered problems enhanced understanding of construction performance.
Yet, in the 1980s there was no practice of low energy housing construction and, Timusk [15], when reviewing moisture control issues of the previous decade, stated:
“At the moment we are in a position where the traditional approach of learning from failures and copying what worked, has broken down. ….it is extremely difficult to accommodate all of the new information in view of the rapid changes in materials, details and performance expectations.”
The paper [12] refers to the Canadian R-2000 and Build America programs as a guide for the future design of housing, highlighting that university education must be complemented by seminars for consultants and building practitioners. Indeed, this became the widespread practice in the USA. Furthermore, the white paper [12] states:
“We need to expand the approach of environmental control in two dimensions:
Note, in the legal language of Canadian code, the word “performance” is replaced by the word “objective” to avoid separation between the concepts of properties and performance. We, however, use “performance”, as it is defined for high performance buildings in the 2005 US Congress “energy act”. The new performance expectations emerged slowly, and mainly as an effect of the accelerated pace of building physics discoveries. Here are a few critical performance issues:
- Discovery of interstitial air pressure fields [16,17,18]
- Introduction of air barrier systems [19,20]
- The need for exterior insulating sheathing [21]
- An ecological complex in the field performance [22]
- Introduction of an integrated design process [23]
- Capillary active technology to modify humidity in indoor air [24]
The key observations in Item 1 were:
- There may be several airflow paths between any two points in a structure
- The total airflow resistance is a sum of all local airflow resistances,
- The total airflow resistance decides in which way most air goes,
- The presence of interstitial airflows permits the mechanical equipment to modify air pressure in the indoor spaces, as well as to modify the thermal performance of walls
- As airflows carry water, they further impact the thermal performance of walls
In summary, we have the following four types of airflows in building [18]:
- (1)
- Exterior (caused by wind)
- (2)
- Interior (HVAC operation and ducts)
- (3)
- Across the walls (stack effect)
- (4)
- Interstitial (connectivity walls, rooms, staircases, ventilation plenum)
One should observe that the impact of interstitial pressure field became significant only when the building enclosure becomes more airtight. Figure 3 highlights the effect of interstitial air pressure field in mold growth on an interior wall in Florida.
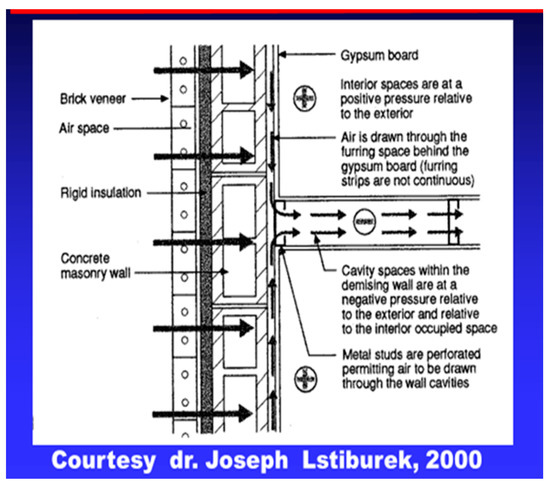
Figure 3.
Interstitial airflow results in mold growth on the interior in a Florida hotel Reprinted with permission of dr. J. W. Lstiburek.
Another practical observation is explained in Figure 4.
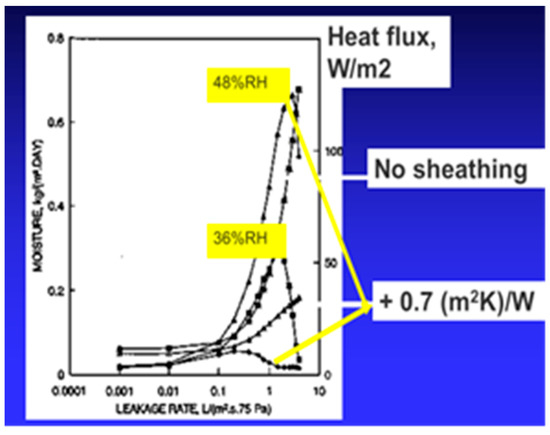
Figure 4.
Effect of a thermal insulating sheathing compared with the case of cellulose fiber insulation discussed in stage 1 (from author archive).
Effectively, during the third development stage, the difference between building physics and science disappeared; on the request of the Architect General for the US, soon this discipline of knowledge will be taught in American schools. Hopefully, in Europe, more attention will be paid to the practical know-how necessary for an academic discipline to have an impact and an engineering value. The introduction of integrated design processes and post-occupancy commissioning is a breakthrough that has initiated a new development of building science.
At the moment, the framework for the quality assurance in construction is very shallow. In the author’s opinion, there is a legal framework, but also a lack of field performance modeling and testing. Nevertheless, the mere recognition of the need for a holistic approach to the integration of technology and the request to map the quality assurance in design stage is the step forward necessary to continue the progress of building performance based QA.
Figure 5 presents the last of the critical elements in the progress of building physics, namely, introduction of the capillary active layers.
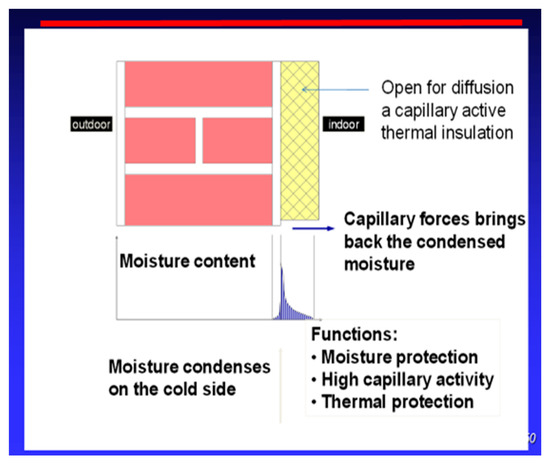
Figure 5.
Explanation of the capillary active layer (CAL) Reprinted with permission of Peter Haeupl [25].
Effectively, the wide scope of technological developments in stage 3 permits us to define stage 4 as the opportunity for ensuring that the holistic technology is going to reach the needed socio-economic impact.
4. Towards the Socio-Economic Impact of the Building Science (2000–2025)
Modern buildings have eliminated the effect of thermal mass on energy consumption through:
- Large areas of glazing, combined with leaky wall window interfaces that increased both air and solar energy transfer across the wall
- A high precision in the control of indoor air temperature that eliminated dynamic performance
We must observe that a large area of glazing delivers solar radiation to the floor and an effective air re-circulation system is needed to remove this heat. As air has a much smaller heat capacity than water, one recommends employment of hydronic systems built into the floors or walls. This is more efficient than airborne systems [26].
Forty years ago, energy consumption in new residential buildings in North America was 200–300 kWh/(m2∙y), and today this is about 50% less, and advanced buildings use about 25% of the original number—70 kWh/(m2∙y). Such a high efficiency of the building enclosure will make solar exposed rooms over-heated while other rooms still require heating. For simultaneous heating and cooling, the best method is a heat pump with one or two buffer tanks. The hot tank is also integrated with solar thermal panels that are typically placed as an outer skin in the wall facade, or as a shading device above the solar-exposed windows.
The integrated design process (IDP), in the conceptual design stage, should include four critical steps:
- Step 1 includes space organization, passive measures and factors affecting indoor environment such as thermal comfort, indoor air quality, acoustics, daylight, illumination, hot and sewer water management, aesthetics and building resilience.
- Step 2 deals with the building automatic control system that integrates heating, cooling, ventilation, and other indoor climate controls including the geothermal and solar means for energy generation and storage.
- Step 3 provides an economic analysis to determine the level of investment that limits the 1st stage of new construction or retrofitting.
- Step 4 develops a comprehensive operational manual for the building and provides the design and cost for stage 2 of the new construction or retrofitting.
4.1. Example of a New Technology
Engineering practice prefers to highlight technology on its application examples. Even though this example may be modified each time when a new design is made, the example discussed in the following section provides a better insight into the significance of different factors.
We propose the use of an adaptable interior climate that allows temperature changes of 1 °C per hour and up to 6 °C per day, during either summer or winter. Experience with some zero energy buildings in the US indicated that air re-circulation is a critical component needed for temperature equalization in different rooms. To this end, we discuss:
- Individual ventilation on-demand in rooms with solar heating.
- Using a hybrid ventilation system with overpressure of the supply air. In this case, one must improve the moisture management in the walls.
Using a periodic overpressure on the supply air induces airflow from the supply point to the kitchen and bathroom exhaust points and the natural ventilation, as long as a pressure difference exists in the indoor space. After the air pressure equalization, both the supply and the exhaust ventilation will start operating. An air handling unit delivers a part of the return air to the supply air.
The fraction of outdoor air needed for the supply air depends on several factors such as number of people in the space, function of the space, floor area, temperature of the outer air, difference between outdoor and indoor air, or difference between preheated and indoor air, and even the season of the year. The latter is because we use minimum ventilation in some periods of the year but over-ventilation in others. Experience from the high environmental performance house [27,28] indicated that fresh air could be delivered only for 20 min during each hour, and for 20 min the air should be re-circulated and the natural ventilation could also last for up to 20 min.
During the building retrofitting, one provides a partial air gap between the old wall and the additional thermal insulation on the interior that will be used for ventilation channels. We are talking about dynamic or ventilated walls. This concept is not new and studies on dynamic walls in Centre Recherche’ Industrielle de Rantigny (CRIR), France, in the 1980s, showed that the difference between thermal resistance of the wall exposed to static or dynamic performance was negligible.
So, when the wall acts as a ventilated heat exchanger, covering the wall surface with capillary active materials can create a new method for moisture management. The air gap is contained between a capillary active layer on the exterior side, and interior thermal insulation is provided with a water-vapor retarder. In cold climates, in the winter, the interior relative humidity is typically below 50%, so air passing through a major part of the wall height will slowly remove moisture from the old wall after the retrofit has been completed. At the same time, the capillary-active layer is designed so that it enables the transport of moisture from the existing wall to the ventilated space [24].
Dynamic operation of heating, cooling and ventilation systems is controlled by a control system, but there is a major control problem, namely a lack of field performance models. As we discussed elsewhere [29], currently used energy models are parametric and the EQM technology requires a real-time control under variable climatic conditions. The EQM control system collects information from all subsystems and uses advanced control algorithms to set parameters for heating, cooling, and ventilation based on indoor and outdoor climatic conditions.
As heating/cooling pipes are located in the walls, the water flow and temperature sensors must also be placed there. Some rudimentary control algorithms may be delivered with the equipment, but fine tuning (optimization of the heating/cooling or ventilation devices) will be done during the operation of the system. For this purpose, the building automatic specialist must be incorporated in the design team.
4.2. Two-Stage Design Process
Figure 6 shows that the integrated design process (IDP) invariably starts with lowering utility bills without cost increase and that all passive measures create only a small increase in the ownership cost that is here expressed as mortgage [30]. With increased use of these measures, the ownership cost (mortgage cost plus utilities) passes through a minimum. There is another characteristic point on the curve shown in Figure 6, namely a point of equilibrium in which the use of photovoltaic (PV) panels is the same as traditional passive measures.
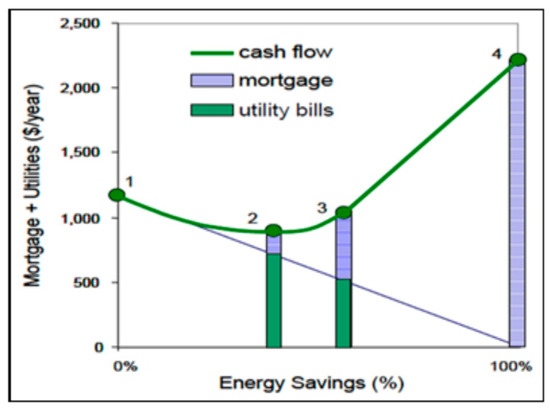
Figure 6.
Costs of utilities (green) and mortgage (blue) versus energy savings from zero to 100% savings. Point 1 denotes the start, 2 the passive measures alone, and 3 the beginning of PV contribution (With permission of Wright & Klingenberg [31]).
One may continue until reaching zero energy at a substantial mortgage investment, typically about 50–70% increase of the minimum cost. The typical investor will not go that far, and one stops after placing a few solar panels.
Thus, the rational design of low energy buildings hinges now on the capability of selecting the reference point for the photovoltaic (PH) technology. In line with this need, the American PH Institute selected reference buildings based on the ASHRAE/DOE climate zones [28] and considered 115 locations for cost optimization that included air tightness, window upgrades with a 15 °C minimum interior surface temperature, heating and cooling demands, and peak heating and cooling loads.
Statistical models were fit so that the cost of the target properties can be generated for any location from parameters such as degree–days and design temperatures. In this manner, both the German and American PH developments moved housing toward the goal of sustainable development, but have not yet reached the goal.
Figure 6 illustrates that investors making the cost–benefit analysis stop investing when the return on investment reaches a prescribed level. This is typically somewhere between 10 and 15 years and in Figure 6, it falls between points 3 and 4. Yet, this is far below that of the zero-energy building. The best way to alleviate this conflict would be to introduce a two-stage construction process.
In such a process, stage one is designed to achieve a performance level limited by a selected cost, while stage two continues to the selected performance level and has a predefined scope of work and cost. In the first stage, the building is completed at a minimum performance level that is acceptable to both the building code and the investor, yet the design predicts continuation of construction to the zero energy level.
The second stage starts a few years later, and completes already designed actions to the required performance level. In many instances, the zero level will also include the night charging vehicles used in the household. For the two-stage solution to be successful, one must design both stages at the same time, and the construction process is only divided into two parts to secure funding when the basic level of the building is in existence.
Figure 7 shows the application of a multi-stage construction process in a building cluster called “Atelier Rosemount” in Montreal [32], that included a mix of different types, e.g., social or ecological dwellings. Initial construction began in 2008 and stepwise upgraded until reaching 92% of the cumulative reduction 10 years later. The retrofitting included the following steps:
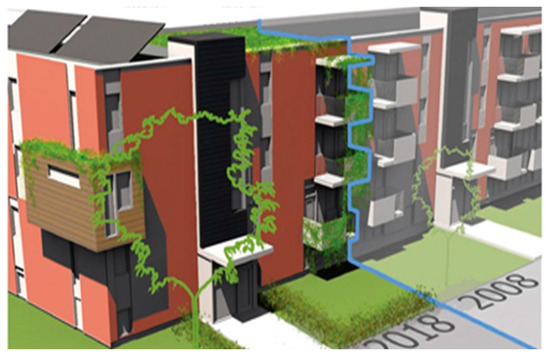
Figure 7.
Stages of improvements from 2008 to 2018 in Atelier Rosemount, Montreal [22] (Reprinted with permission of CMHC and credit L’OeuF s.e.n.c.)
- High performance enclosure; common water loop; solar wall—36% reduction
- Gray water power, the cumulative energy reduction grows to 42%
- Heat pump heating—all passive measures give a 60% reduction
- Domestic hot water with evacuated solar panels, a further 14%
- Photovoltaic panels reduce the total energy to a total of 92%
This project highlights that modern thinking in construction eliminates the boundary between new construction and the retrofitting of old buildings.
Assume that in the first stage of building, or before retrofitting program, your heating/cooling bill is US$330 a month or US$3960 a year, and you intend to upgrade to zero energy in two years. In stage one, or in retrofit estimate, you have the total cost of the retrofit equal to US$88,800.00, and you will be asking for a US$90,000 loan. Taking US$90,000 out on and a 4% 25-year second mortgage gives you a monthly payment of US$175, but your saving is US$330–175 a month, i.e., US$155.00 a month. Your borrowing cost is US$37,475, so it is paid after 20 years and 2 months.
Currently in the US, a number of financial institutions will provide a loan based on existing capital resources and the federal government is in the process of revising the appraisal documents for buildings. All that a homeowner needs is a detailed cost of stage two to reduce energy expenses. As lenders calculate a borrower’s expenses as principal, interest, taxes, and insurance (PITI), adding energy bills to their calculation (PITI+E) opens up an interesting new investment opportunity.
We must observe that this investment does not increase the cost of living, as the local economy gets a boost, and yet CO2 emissions are dramatically reduced. A win-win-win situation.
Finally, Figure 8, published 12 years ago, reminds us that to reach 2030 targets, one must put retrofitting as a priority. We are glad that Horizon 2020 in Europe came to this conclusion and would like to highlight that while a permit for new buildings requires a lot of decisions, interior retrofitting requires only one—when to start it.
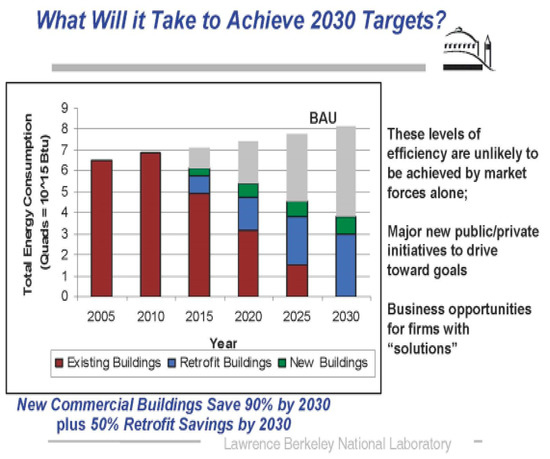
Figure 8.
The need for retrofitting existing buildings. Reprinted with permission of Lawrence Berkeley National Laboratory.
5. Steps to the Scientific Revolution
Kuhn [1] spoke about a small step that makes the previous development take a new form, calling it a scientific revolution. In the opinion of the author, a two-stage construction approach combined with a dynamic operation of functionally integrated (or smart) buildings is also going to provide a scientific revolution. The two-step construction approach links the financial security of investment with the social need for the accelerated reduction of carbon dioxide.
To the previously listed technology development, namely:
- Discovery of interstitial air pressure fields
- Introduction of air barrier systems
- The need for exterior insulating sheathing
- An ecological complex in the field performance
- Introduction of an integrated design process
- Capillary active technology to modify humidity in indoor air
We are adding the following measures of the occupant centered control (OCC) of the indoor climate:
The dynamic characteristics of buildings that comply with the environmental control management (EQM) technology are as follows.
- Use of an adaptive comfort approach in the indoor environment and improved comfort measures [33]
- Use of heat pump technology for simultaneous heating and cooling
- Integration of heating, cooling and ventilation within the building fabric
- Integrated control systems to operate and optimize the HVAC operation
For EQM details look [34,35,36,37] and for neural networks in [38,39,40]
Thus, a development that started about 30 years ago with integrated design process, is now formulated as a strong technological package that can lead the fourth scientific revolution. With the path now evident, we propose adding new expertise to the IDP team, namely a building automatic control (BAC) expert.
Author Contributions
M.B. building science, A.R.-Z. automatics, D.Y. writing text. All authors have read and agreed to the published version of the manuscript.
Funding
This research received no external funding.
Conflicts of Interest
The authors declare no conflict of interest.
References
- Kuhn, T. The Structure of Scientific Revolutions; University of Chicago Press: Chicago, IL, USA, 1970. [Google Scholar]
- Bomberg, M.; Solvason, K.R. How to ensure good thermal performance of cellulose fiber insulation. Part 1. Horizontal applications. J. Build. Phys. 1980, 4, 93. [Google Scholar] [CrossRef]
- Szklowier, A.M.; Wasiliew, B.F.; Uszkow, F.B. The Foundations of Building Thermal Science of Residential and Public Buildings; Architectural Academy of Soviet Union, 1959. (In Russian) [Google Scholar]
- Luikow, A.W. Stroitielna Teplotiechnika (Building Thermal Technology), 1966. (In Russian)
- Uszkow, F.B. Methods for Calculation of Wetting of Components of the Exterior Enclosure in Buildings; Ministry of Communal Matters: Moscow, Russia, 1955. (In Russian) [Google Scholar]
- Rowley, F.B.; Algren, A.B.; Lund, C.E. Condensation within walls. ASHVE Trans. 1938, 44. [Google Scholar]
- Bomberg, M. Moisture Flow through Porous Building Materials. Ph.D. Thesis, Lund Institute of Technology, Lund, Sweden, Report 52. 1974; pp. 1–188. [Google Scholar]
- Sandberg, P.I. Water Vapor Transport Calculations. Ph.D. Thesis, Lund Institute of Technology, Lund, Sweden, 1973. [Google Scholar]
- Kuenzel, H.M. Simultaneous Heat and Moisture Transport in Building Components, One- and TWo- Dimensional Calculations Using Simple Parameters; Fraunhofer IRB Verlag: Stuttgart, Germany, 1995. [Google Scholar]
- Hutcheon, N.B. The utility of building science, reprint of the 1971 lecture. J. Build. Phys. 1998, 22, 4. [Google Scholar]
- Romanska-Zapala, A.; Bomberg, M.; Yarbrough, D. Towards reduction of the impact of residential buildings on climate change. Unpublished work.
- Bomberg, M.; Onysko, D. (Eds.) Energy Efficiency and Durability of Buildings at the Crossroads. 2008. Available online: http://thebestconference.org/BEST1 (accesed on 25 February 2020).
- Kwasnowski, P.; Fedorczak-Cisak, M.; Knap, K. Problems of technology of energy-saving buildings and their impact on energy efficiency in buildings. In IOP Conference Series: Materials Science and Engineering; IOP Publishing: Bristol, UK, 2017; Volume 245, p. 072043. [Google Scholar]
- Kisilewicz, T.; Fedorczak-Cisak, M.; Barkanyi, T. Active thermal insulation as an element limiting heat loss through external walls. Energy Build. 2019, 205, 109541. [Google Scholar] [CrossRef]
- Bomberg, M.; Kisilewicz, T.; Mattock, C. Methods of Building Physics; Timusk 1992; Cracow University Press: Cracow, Poland, 2016; pp. 1–300. [Google Scholar]
- Sasaki, J.R.; Wilson, A.G. Air leakage for residential windows. ASHRAE Trans. 1965, 71, 81–88. [Google Scholar]
- Bomberg, M.; Kisilewicz, T.; Nowak, K. Is there an optimum range of airtightness for a building? J. Build. Phys. 2016, 39, 395–420. [Google Scholar] [CrossRef]
- Lstiburek, J.W. Toward an Understanding and Prediction of Air Flow in Buildings. Ph.D. Thesis, University of Toronto, Toronto, ON, Canada, 1999. [Google Scholar]
- Quirouette, R.L. The difference between a vapor barrier and an air barrier. In Building Practice Note 54; IRC; NRC: Ottawa, ON, Canada, 1985. [Google Scholar]
- Perrault, J.C. Air barrier systems: Construction applications. In An Air Barrier for the Building Envelope; Building Science Insight; NRC: Ottawa, ON, Canada, 1986; pp. 20–24. [Google Scholar]
- Kumaran, M.K.; Ojanen, T.R. Effect of exfiltration on hygrothermal behavior of a residential wall assembly. J. Build. Phys. 1996, 19, 215–228. [Google Scholar]
- Hutcheon, N.B.; Handegord, G.O. Building Science for A Cold Climate; Construction Technology Centre Atlantic Inc.: Ottawa, ON, Canada, 1983. [Google Scholar]
- IDP. Available online: https://www.stategiaconseil.ca/en/2018/ (accessed on 2 February 2020).
- Bomberg, M. A concept of capillary active, dynamic insulation integrated with heating, cooling and ventilation, air conditioning system. Front. Architect. Civ. Eng. China 2010, 4, 431–437. [Google Scholar] [CrossRef]
- Häupl, P.; Grunewald, J.; Fechner, H. Moisture behavior of a “Gründerzeit”-house by means of a capillary active interior insulation. In Proceedings of the Building Physics in the Nordic Countries, Gothenburg, Sweden, 24–26 August 1999; pp. 225–232. [Google Scholar]
- Mattock, C.H. Harmony House EquilibriumTM project, Canada Green Building Council. In Proceedings of the Annual Conference, Vancouver, BC, Canada, 8–10 June 2010. [Google Scholar]
- Brennan, T.; Henderson, H.; Stack, K.; Bomberg, M. Quality Assurance and Commissioning Process in High Environmental Performance (HEP) Demonstration House in NY State. 2008. Available online: www.thebestconference.org/best1 (accessed on 12 October 2019).
- Wallburger, A.; Brennan, T.; Bomberg, M.; Henderson, H. Energy Prediction and Monitoring in a High-Performance Syracuse House. 2010. Available online: http://thebestconference.org/BEST2 (accessed on 2 October 2019).
- Karagiozis, A.K.; Kumaran, M.K. Computer Model Calculation of the Performance of Vapor Barriers in Canadian Residential Buildings. ASHRAE Trans. 1993, 99, 991–1003. [Google Scholar]
- Klingenberg, K.; Kernagis, M.; Knezovich, M. Zero energy & carbon buildings based on climate specific passive building standards for North America. J. Build. Phys. 2016, 39, 503–521. [Google Scholar]
- Wright, G.; Klingenberg, K. Climate-Specific Passive Building Standards; U.S. Department of Energy, Building America, Office of Energy Efficiency and Renewable Energy: Washington, DC, USA, 2015.
- Rosemount, A. Information Notesp; Canadian Mortgage and Housing Corporation: Ottawa, ON, Canada, 2016.
- Piasecki, M.; Fedorczak-Cisak, M.; Furtak, M.; Biskupski, J. Experimental confirmation of the reliability of Fanger’s thermal comfort model—Case study of a near-zero energy building office building. Sustainability 2019, 11, 2461. [Google Scholar] [CrossRef]
- Bomberg, M.; Yarbrough, D.; Furtak, M. Buildings with environmental quality management (EQM), part 1: Designing multi-functional construction materials. J. Build. Phys. 2017, 41, 193–208. [Google Scholar] [CrossRef]
- Romanska-Zapala, A.; Bomberg, M.; Fedorczak-Cisak, M.; Furtak, M.; Yarbrough, D.; Dechnik, M. Buildings with environmental quality management (EQM), part 2: Integration of hydronic heating/cooling with thermal mass. J. Build. Phys. 2018, 41, 397–417. [Google Scholar] [CrossRef]
- Yarbrough, D.W.; Bomberg, M.; Romanska-Zapala, A. Buildings with environmental quality management (EQM), part 3: From log houses to zero-energy buildings. J. Build. Phys. 2018, 42, 672–691. [Google Scholar] [CrossRef]
- Romanska-Zapala, A.; Bomberg, M.; Yarbrough, D. Buildings with environmental quality management (EQM), part 4: A path to the future NZEB. J. Build. Phys. 2018, 43, 3–21. [Google Scholar] [CrossRef]
- Gadek, K.; Dudzik, M.; Strek, A. A Novel Three-Head Ultrasonic System for Distance Measurements Based on the Correlation Method. Meas. Sci. Rev. 2014, 14, 331–336. [Google Scholar] [CrossRef]
- Dudzik, M.; Jagiello, A.; Drapik, S.; Prusak, J. The selected real tramway substation overload analysis using the optimal structure of an artificial neural network. In Proceedings of the 2018 International Symposium on Power Electronics, Electrical Drives, Automation and Motion (Speedam), Amalfi, Italy, 20–22 June 2018. WOS:000445031300069. [Google Scholar]
- Dudzik, M.; Mielnik, R.; Wróbel, Z. Preliminary analysis of the effectiveness of the use of artificial neural networks for modelling time-voltage and time-current signals of the combination wave generator. In Proceedings of the 2018 International Symposium on Power Electronics, Electrical Drives, Automation and Motion (Speedam), Amalfi, Italy, 20–22 June 2018. WOS:000445031300179. [Google Scholar]
© 2020 by the authors. Licensee MDPI, Basel, Switzerland. This article is an open access article distributed under the terms and conditions of the Creative Commons Attribution (CC BY) license (http://creativecommons.org/licenses/by/4.0/).