Image-Based River Water Level Estimation for Redundancy Information Using Deep Neural Network

 , , , , and
Abstract

1. Introduction
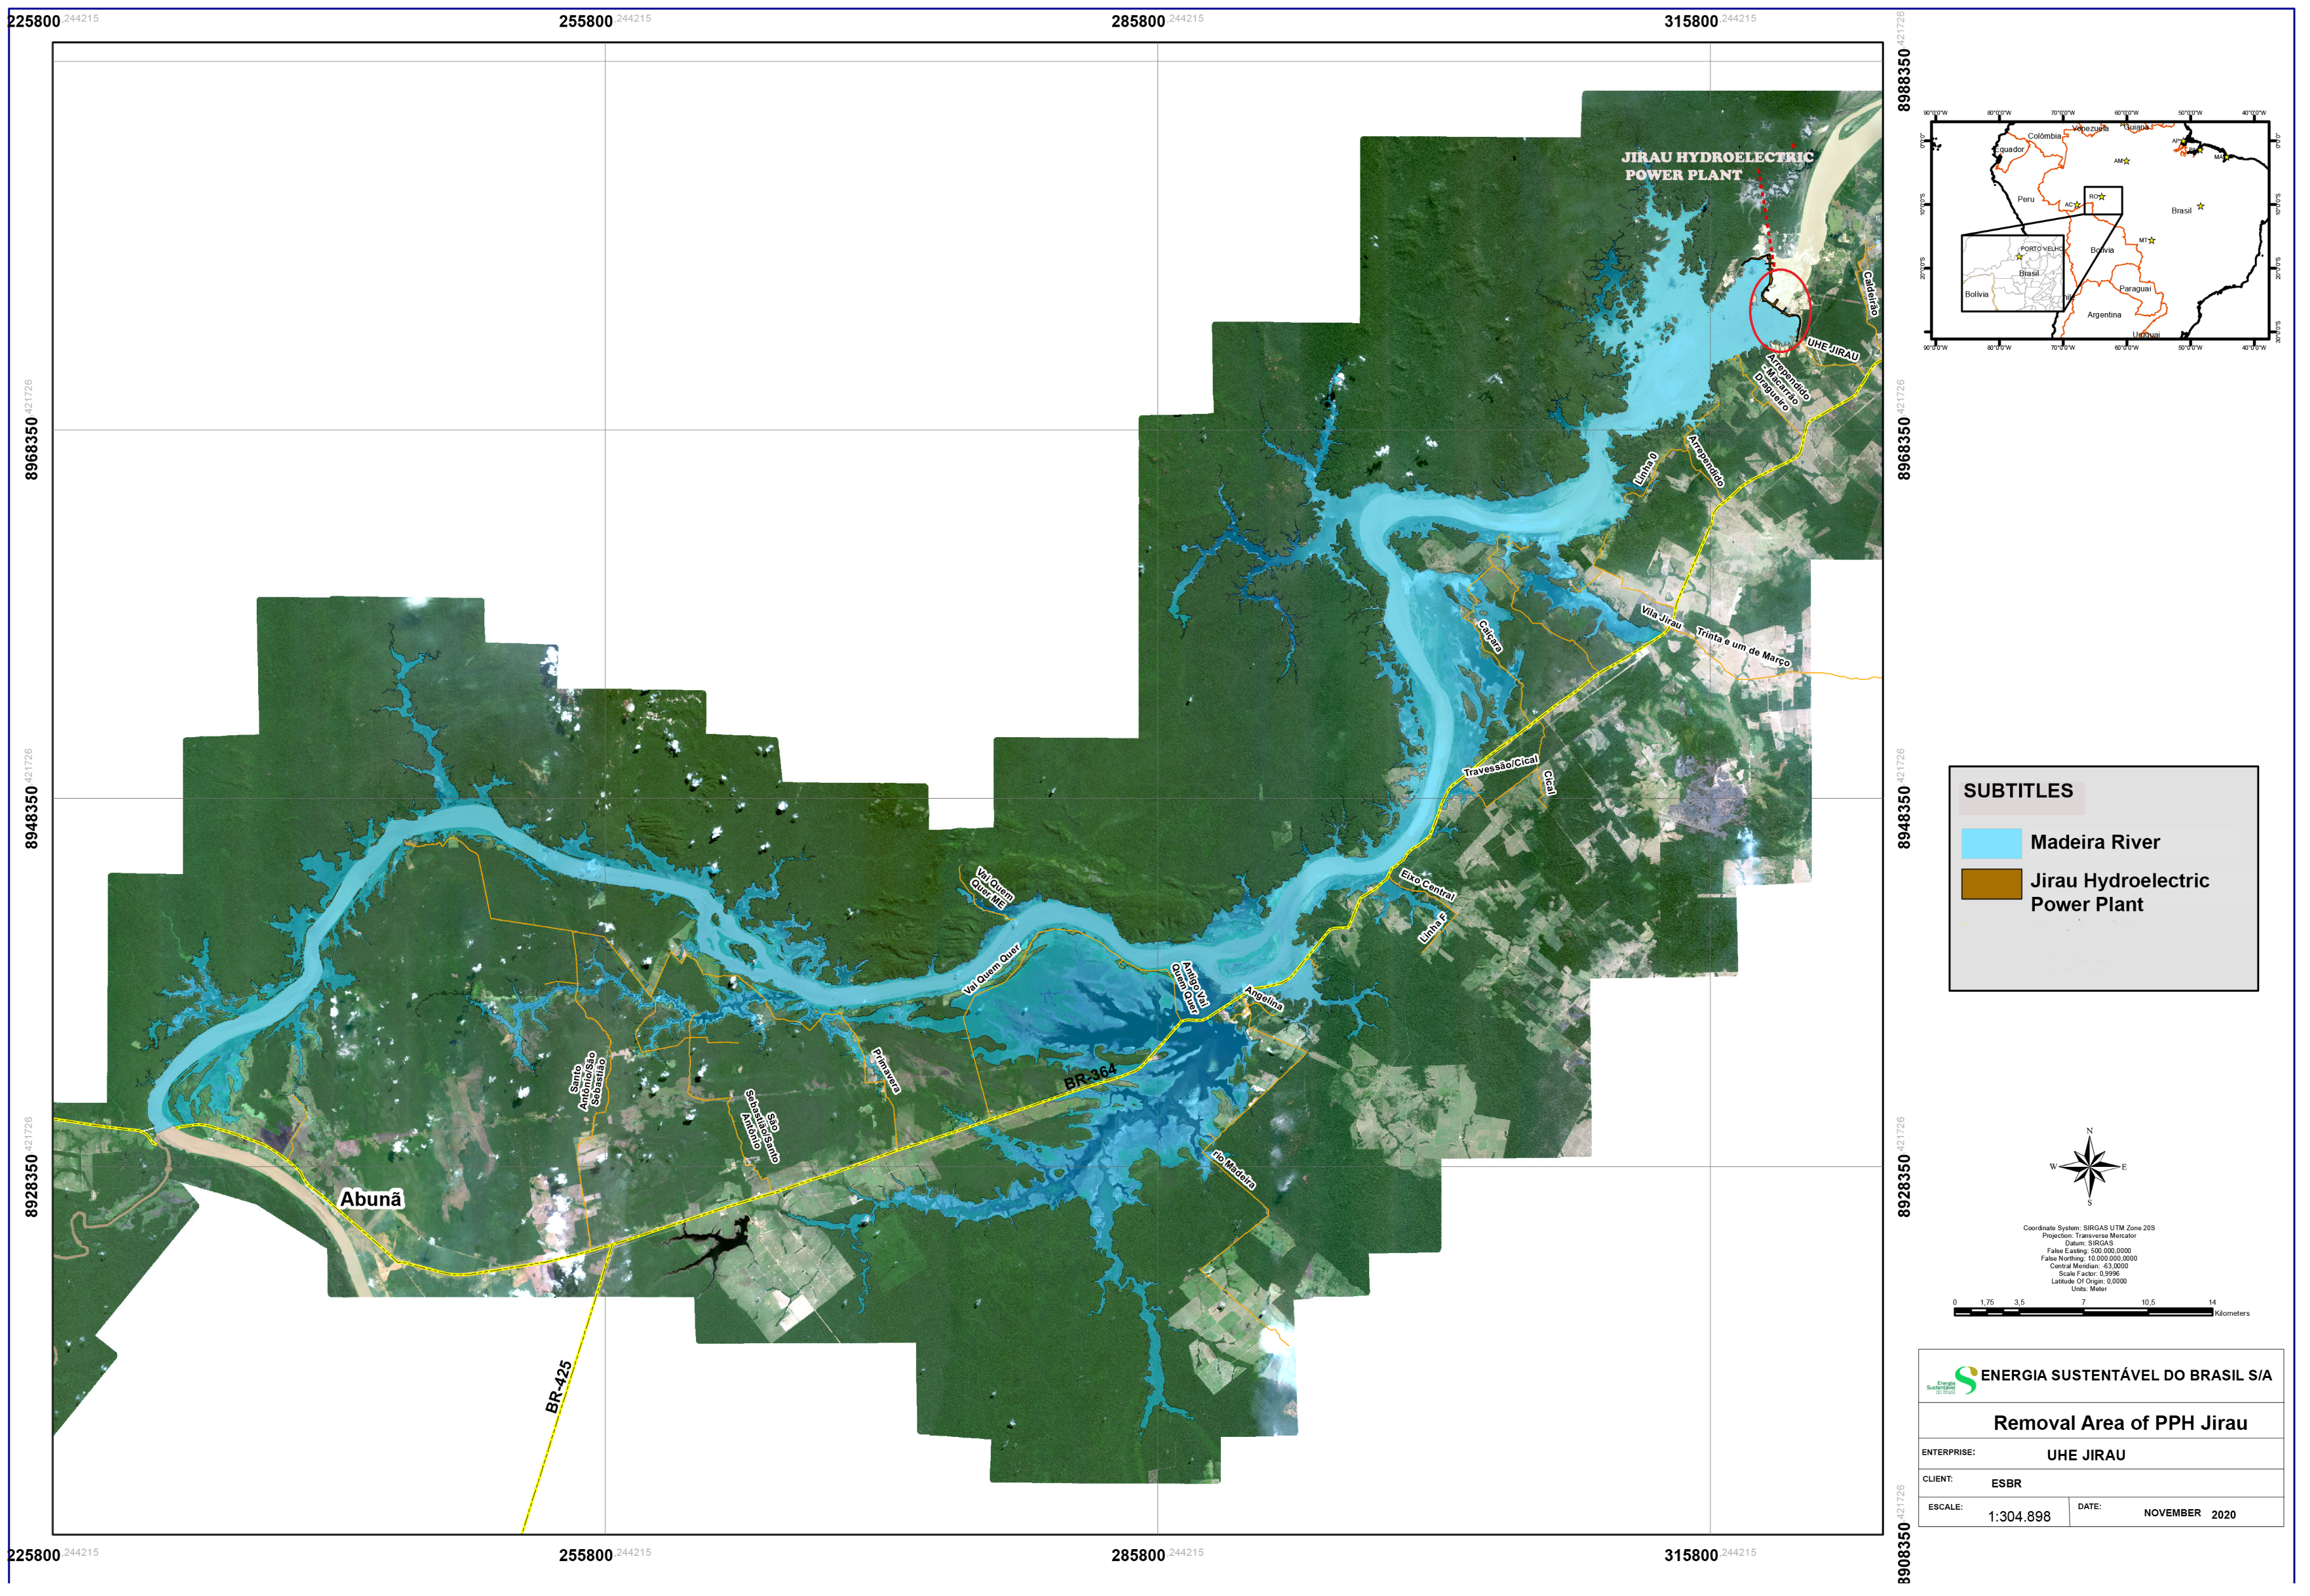
2. Case Study
3. Methodology
3.1. Image Processing
3.2. Water Level Management
3.3. Residual Neural Network Model
3.4. MobileNetV2 Model
3.5. Evaluation Criteria
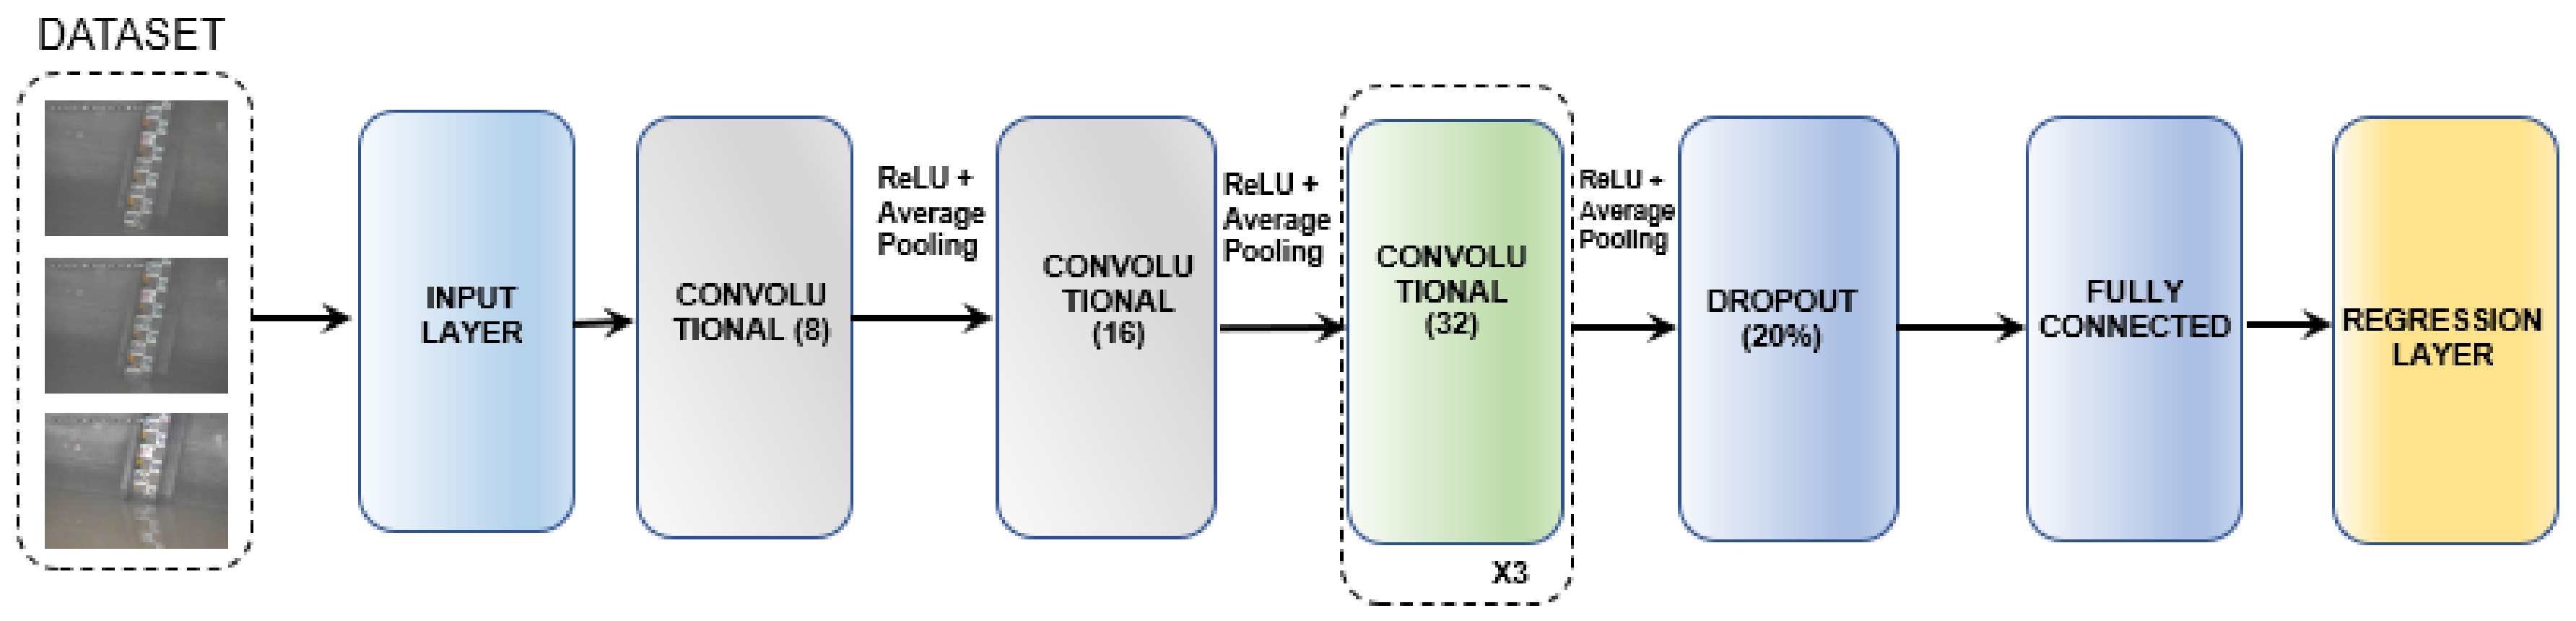
4. Convolutional Neural Networks: Proposed Method
5. Results
6. Conclusions and Discussion
Author Contributions
Funding
Acknowledgments
Conflicts of Interest
References
- Zhang, Z.; Zhou, Y.; Liu, H.; Zhang, L.; Wang, H. Visual Measurement of Water Level under Complex Illumination Conditions. Sensors 2019, 19, 4141. [Google Scholar] [CrossRef] [PubMed]
- Kishor, N.; Saini, R.P.; Singh, S.P. A review on hydropower plant models and control. Renew. Sustain. Energy Rev. 2007, 11, 776–796. [Google Scholar] [CrossRef]
- Katole, S.; Bhute Y., A. Real Time Water Quality Monitoring System based on IoT Plataform. Rev. Int. J. Recent Innov. Trends Comput. Commun. 2017, 5, 302–305. [Google Scholar]
- Zheng, G.; Zong, H.; Zhuan, X.; Wang, L. High-accuracy surface-perceiving water level gauge with self-calibration for hydrography. IEEE Sens. J. 2010, 10, 1893–1900. [Google Scholar] [CrossRef]
- Li, G.B.; Ha, Q.; Qiu, W.B.; Xu, J.C.; Hu, Y.Q. Application of guided-wave radar water level meter in tidallevel observation. J. Ocean Technol. 2018, 37, 19–23. [Google Scholar]
- Katole, S.; Bhute, Y.A. Discharge-Measurement System Using an Acoustic Doppler Current Profiler with Applications to Large Rivers and Estuaries; US Government Printing Office: Washington, DC, USA, 1993; p. 32.
- Shin, I.; Kim, J.; Lee, S.G. Development of an internet-based water-level monitoring and measuring systemusing CCD camera. In Proceedings of the ICMIT 2007: Mechatronics, MEMS, and Smart Materials, Gifu, Japan, 16–18 December 2007; Volume 6794. [Google Scholar] [CrossRef]
- Galvão Filho, A.R.; de Carvalho, R.V.; Ribeiro, F.S.L.; Coelho, C.J. Generation of Two Turbine Hill Chart Using Artificial Neural Networks. In Proceedings of the IEEE 10th International Conference on Intelligent Systems (IS), Varna, Bulgaria, 28–30 August 2020; pp. 457–462. [Google Scholar] [CrossRef]
- Rawat, W.; Wang, Z. Deep Convolutional Neural Networks for Image Classification: A Comprehensive Review. Neural Comput. 2017, 2352–2449. [Google Scholar] [CrossRef] [PubMed]
- Sultana, F.; Sufian, A.; Dutta, P. Evolution of Image Segmentation using Deep Convolutional Neural Network: A Survey. arXiv 2020, arXiv:2001.04074. [Google Scholar]
- Dhillon, A.; Verma, G.K. Convolutional neural network: A review of models, methodologies and applications to object detection. Prog. Artif. Intell. 2020, 9, 85–112. [Google Scholar] [CrossRef]
- Bressem, K.K.; Adams, L.C.; Erxleben, C.; Hamm, B.; Niehues, S.M.; Vahldiek, J.L. Comparing different deep learning architectures for classification of chest radiographs. Sci. Rep. 2020. [Google Scholar] [CrossRef] [PubMed]
- Khan, A.; Sohail, A.; Zahoora, U.; Qureshi, A.S. A survey of the recent architectures of deep convolutional neural networks. Artif. Intell. Rev. 2020, 53, 5455–5516. [Google Scholar] [CrossRef]
- Sindagi, V.A.; Patel, V.M. A survey of recent advances in CNN-based single image crowd counting and density estimation. Pattern Recognit. Lett. 2018, 107, 3–16. [Google Scholar] [CrossRef]
- Yang, W.; Zhang, X.; Tian, Y.; Wang, W.; Xue, J.-H.; Liao, Q. Deep Learning for Single Image Super-Resolution A Brief Review. arXiv 2019, arXiv:1808.03344. [Google Scholar]
- Alom, Z.; Taha, T.M.; Yakopcic, C.; Westberg, S.; Sidike, P.; Nasrin, S.; Essen, B.C.V.; Abdul, A.S.; Awwal, A.V.K. The History Began from AlexNet: A Comprehensive Survey on Deep Learning Approaches. arXiv 2018, arXiv:1803.01164. [Google Scholar]
- Guan, B.; Zhang, J.; Sethares, W.A.; Kijowski, R.; Liu, F. SpecNet: Spectral Domain Convolutional Neural Network. arXiv 2019, arXiv:1905.10915. [Google Scholar]
- Alom, M.Z.; Hasan, M.; Yakopcic, C.; Taha, T.M.; Asari, V.K. Improved inception-residual convolutional neural network for object recognition. Neural Comput. Appl. 2020, 32, 279–293. [Google Scholar] [CrossRef]
- Cao, X.; Li, C. Evolutionary Game Simulation of Knowledge Transfer in Industry-University-Research Cooperative Innovation Network under Different Network Scales. Sci. Rep. 2020, 4, 4027. [Google Scholar] [CrossRef] [PubMed]
- Luo, J.-H.; Wu, J. Neural Network Pruning with Residual-Connections and Limited-Data. arXiv 2020, arXiv:1911.08114. [Google Scholar]
- He, K.; Zhang, X.; Ren, X.; Sun, J. Deep Residual Learning for Image Recognition. arXiv 2015, arXiv:1512.03385. [Google Scholar]
- Targ, S.; Almeida, D.; Lyman, K. Resnet in Resnet: Generalizing Residual Archetectures. arXiv 2016, arXiv:1603.08029. [Google Scholar]
- Hinton, G.E.; Srivastava, N.; Krizhevsky, A.; Sutskever, I.; Salakhutdinov, R.R. Improving neural networks by preventing co-adaptation of feature detectors. arXiv 2012, arXiv:1207.0580. [Google Scholar]
- Zhang, L.; Schaeffer, H. Forward Stability of ResNet and Its Variants. J. Math. Imaging Vis. 2019, 62, 328–351. [Google Scholar] [CrossRef]
- He, F.; Liu, T.; Tao, D. Why resnet works? Residuals generalize. arXiv 2020, arXiv:1904.01367v1. [Google Scholar]
- Pashaei, M.; Kamangir, H.; Starek, M.J.; Tissot, P. Review and Evaluation of Deep Learning Architectures for Efficient Land Cover Mapping with UAS Hyper-Spatial Imagery: A Case Study Over a Wetland. Remote Sens. 2020, 12, 959. [Google Scholar] [CrossRef]
- Sinha, D.; El-Sharkawy, M. Thin MobileNet: An Enhanced MobileNet Architecture. In Proceedings of the IEEE 10th Annual Ubiquitous Computing, Electronics & Mobile Communication Conference (UEMCON), New York, NY, USA, 10–12 October 2019. [Google Scholar] [CrossRef]
- Sun, X.; Choi, J.; Chen, C.-Y.; Wang, N. Hybrid 8-bit Floating Point (HFP8) Training and Inference for Deep Neural Networks. In Proceedings of the 33rd Conference on Neural Information Processing Systems (NeurIPS), Vancouver, Canada, 8–14 December 2019; Volume 32. [Google Scholar]
- Mehta, S.; Rastegari, M.; Shapiro, L.; Hajishirzi, H. ESPNetv2: A Light-Weight, Power Efficient, and General Purpose Convolutional Neural Network. arXiv 2019, arXiv:1811.11431. [Google Scholar]
- Sandler, M.; Howard, A.; Zhu, M.; Zhmoginov, A.; Chen, L.-C. Comparing different deep learning architectures for classification of chest radiographs. arXiv 2019, arXiv:1801.04381. [Google Scholar]
- Wang, G.; Wu, M.; Wei, X.; Song, H. Water Identification from High-Resolution Remote Sensing Images Based on Multidimensional Densely Connected Convolutional Neural Networks. Remote. Sens. 2020, 12, 795. [Google Scholar] [CrossRef]
- Han, F.; Yao, J.; Zhu, H.; Wang, C. Underwater Image Processing and Object Detection Based on Deep CNN Method. Hindawi J. Sens. 2020. [Google Scholar] [CrossRef]
- Song, S.; Liu, J.; Liu, Y.; Feng, G.; Han, H.; Yao, Y.; Du, M. Intelligent Object Recognition of Urban Water Bodies Based on Deep Learning for Multi-Source and Multi-Temporal High Spatial Resolution Remote Sensing Imagery. Sensors 2020, 2, 397. [Google Scholar] [CrossRef] [PubMed]
- Gan, J.L.; Zailah, W. Water Level Classification for Flood Monitoring System Using Convolutional Neural Network. Lecture Notes in Electrical Engineering. In Proceedings of the 11th National Technical Seminar on Unmanned System Technology, Kuantan, Malaysia, 2–3 December 2019; Volume 666, pp. 299–318. [Google Scholar]
- Zhou, Q.; Ma, L.; Celenk, M.; Chelberg, D. Real-Time Video Object Recognition Using Convolutional Neural Network. Multimed. Tools Appl. 2015, 27, 251–281. [Google Scholar] [CrossRef]
- Schneider, A.; Hommel, G.; Blettner, M. Linear Regression Analyzes. Dtsch. Ärztebl. Int. 2010, 107, 776–782. [Google Scholar] [PubMed]
- Veit, A.; Wilber, M.; Belongie, S. Residual Networks Behave Like Ensembles of Relatively Shallow Networks. In Proceedings of the Advances in Neural Information Processing Systems 29 (NIPS), Barcelona, Spain, 5–10 December 2016; pp. 1–9. [Google Scholar]
- Behrmann, J.; Grathwohl, W.; Chen, R.T.Q.; Duvenaud, D.; Jacobsen, J.-H. Invertible Residual Networks. arXiv 2019, arXiv:1811.00995. [Google Scholar]
- Abdi, M.; Nahavandi, S. Multi-Residual Networks: Improving the Speed and Accuracy of Residual Networks. arXiv 2017, arXiv:1609.05672. [Google Scholar]
- Tung, F.; Mori, G. Similarity-Preserving Knowledge Distillation. arXiv 2019, arXiv:1907.09682. [Google Scholar]
- Veit, A.; Belongie, S. Convolutional Networks with Adaptive Inference Graphs. arXiv 2020, arXiv:1711.11503. [Google Scholar]
- Siu, C. Residual Networks Behave Like Boosting Algorithms. arXiv 2019, arXiv:1909.11790. [Google Scholar]
- Krizhevsky, A.; Sutskever, I.; Hinton, G.E. ImageNet Classification with Deep Convolutional Neural Networks. Commun. ACM 2017, 84–90. [Google Scholar] [CrossRef]
- Ahn, B. Real-Time Video Object Recognition Using Convolutional Neural Network. In Proceedings of the International Joint Conference on Neural Networks (IJCNN), Killarney, Ireland, 12–17 July 2015; pp. 1–7. [Google Scholar] [CrossRef]


| Model | Train | Test | ||||
|---|---|---|---|---|---|---|
| RMSE (m) | MAE (m) | RMSE (m) | MAE (m) | |||
| ResNet50 | 0.4211 | 0.3891 | 0.7808 | 0.4178 | 0.3841 | 0.7692 |
| MobileNetV2 | 0.3683 | 0.2709 | 0.7803 | 0.3734 | 0.2773 | 0.7612 |
| Proposed CNN | 0.2668 | 0.1991 | 0.9004 | 0.2928 | 0.2228 | 0.8868 |
Publisher’s Note: MDPI stays neutral with regard to jurisdictional claims in published maps and institutional affiliations. |
© 2020 by the authors. Licensee MDPI, Basel, Switzerland. This article is an open access article distributed under the terms and conditions of the Creative Commons Attribution (CC BY) license (http://creativecommons.org/licenses/by/4.0/).
Share and Cite
Fleury, G.R.d.O.; do Nascimento, D.V.; Galvão Filho, A.R.; Ribeiro, F.d.S.L.; de Carvalho, R.V.; Coelho, C.J. Image-Based River Water Level Estimation for Redundancy Information Using Deep Neural Network. Energies 2020, 13, 6706. https://doi.org/10.3390/en13246706
Fleury GRdO, do Nascimento DV, Galvão Filho AR, Ribeiro FdSL, de Carvalho RV, Coelho CJ. Image-Based River Water Level Estimation for Redundancy Information Using Deep Neural Network. Energies. 2020; 13(24):6706. https://doi.org/10.3390/en13246706
Chicago/Turabian StyleFleury, Gabriela Rocha de Oliveira, Douglas Vieira do Nascimento, Arlindo Rodrigues Galvão Filho, Filipe de Souza Lima Ribeiro, Rafael Viana de Carvalho, and Clarimar José Coelho. 2020. "Image-Based River Water Level Estimation for Redundancy Information Using Deep Neural Network" Energies 13, no. 24: 6706. https://doi.org/10.3390/en13246706
APA StyleFleury, G. R. d. O., do Nascimento, D. V., Galvão Filho, A. R., Ribeiro, F. d. S. L., de Carvalho, R. V., & Coelho, C. J. (2020). Image-Based River Water Level Estimation for Redundancy Information Using Deep Neural Network. Energies, 13(24), 6706. https://doi.org/10.3390/en13246706