Article

Algorithm for Customizing the Material Selection Process for Application in Power Engineering

1
Faculty of Organization and Informatics, University of Zagreb, 42000 Varaždin, Croatia
2
St Catharine’s College, University of Cambridge, Cambridge CB2 1RL, UK
3
Department of Electrical Engineering, University North, 42000 Varaždin, Croatia
*
Author to whom correspondence should be addressed.
Energies 2020, 13(23), 6458; https://doi.org/10.3390/en13236458
Submission received: 15 November 2020 / Revised: 29 November 2020 / Accepted: 4 December 2020 / Published: 7 December 2020

Abstract

:
Disruptions in the global market are influencing value and supply chains reminding businesses and industries that variability and diversity of supply chains may be essential for surviving and sustainability. Operations management of any business has to address these challenges in order to avoid any serious interruptions in supply of materials in production industries by seeking substitute inputs. At the same time, the technological development offers new materials with similar quality properties, making thereby the substitute material search more difficult in terms of selecting appropriate materials with a level of quality which is similar enough. Another aspect in shifting can be found in more social-related reasons addressing changes in the value chains like traceability, low carbonization, and a more customer-oriented approach, because of moving towards green digital business. In this sense the intention of this work was to propose an algorithm for customizing the process of identifying appropriate materials in production by relying on existing algorithms i.e., the Ashby mapping, big data, applying algorithms of data analysis based on exclusion criteria embracing transformation paradigms, for enabling customization of the material selection process. The proposed algorithm was applied on two case examples, demonstrating that diversity of materials plays an important role in addressing customization requests from customers. Consequently, understanding and implementing a customer-centric approach in various phases of the product life cycle contributes to a better response by businesses faced with issuing customized offerings.

1. Introduction

In modern energy transmission systems, the implementation of new materials and technologies significantly contributes to reducing losses and increasing efficiency, considering environmental awareness and green business. There are studies of different methods and algorithms that can facilitate the process of material selection to explore the possibilities of its application in the design of new products. In addition, the global availability of different materials and large amounts of research and data on their properties, advantages and disadvantages, creates the necessity of a systematic selection process. The authors in [1] investigate an algorithm that includes different ranking methods for material selection problem, suggesting the efficient use of any types of criteria and any number of alternatives. A model for material selection in the design process described in [2] uses group-generalized Pythagorean fuzzy weighted average (GGPFWA) operator to aggregate the value of each material. The technique proposed in [3] integrates different multi-criteria decision-making (MCDM) approaches for selection of the most appropriate material for bio-oil conversion during pyrolysis, while the multi-objective optimization of the performance indexes is used for selection of phase change material (PCMs) for combined thermochemical-latent heat storage systems in [4]. The proposed methodology with decision-making algorithm in [5] which includes a developed internet-of-things (IoT) interface and the analytical hierarchy process (AHP) is applied in the field of an electrical power distribution system. They are often based on the MCDM principle that is explained in detail in [6], while the parameters important specifically for the materials for conductors are discussed in [7,8] and for transmission grid poles in [9].
Recent events in the global environment have showed that continuous supply chain management is an important issue in operations management and sustainable production [10]. Disruptions and interruptions in supply of materials in production industries faced by a business challenge in which they need to seek substitute inputs. For modern and agile manufacturing, [11] presents the new model for supply chain optimization for production in the environment of contemporary e-business, considering uninterrupted material flows with the minimum environmental impact and sustainable economy. The authors in [12] describe the design of the supply chain network and create optimization models while minimizing costs and time and maximizing sustainability. The sustainability of the supply chain is also investigated in [13], especially in the energy sector, considering uncertain conditions and the material quality effect. Most of the research discusses multiple selection criteria, as in [14,15,16]. An analytic hierarchy process based multi-criteria model described in [14] and related to the renewable energy sector is based on the triple bottom line dimensions (social, economic and environmental). A three-phase methodology is proposed in [15], using MCDM to identify the criteria list for sustainable material assessment model, while a multi-objective optimization model is proposed in [16] given the many alternatives available today that allow materials to be transformed into valuable products.
Although the issue of material selection and design of related algorithms and methods is the subject of various research works, the algorithm proposed in this paper aims to include a customer-centric approach when selecting the most appropriate materials and parts from a large amount of available data for application in power engineering. The use of Ashby maps [17,18,19] as a selection tool forms the minimum technical requirement pool for materials, but in order to narrow the pool from which materials can be selected, additional exclusion criteria should be applied. The exclusion criteria reflect the soft or non-technical factors the organization is applying as their individual response to customization requests from customers.
The paper is organized as follows. First, the proposed algorithm is described, including input requirements for material selection, method of creating Ashby map as the selection tools, big data processing and exclusion criteria. The next section presents the algorithm testing results, while the discussion and conclusion are given at the end.

2. Materials and Methods

Research into the selection of materials with sustainable supply chains for modern and green production by an interdisciplinary group of authors resulted in the development of a new model/algorithm described below. First, the material selection process model is described, and then the individual technical aspects required for the implementation of the proposed algorithm are explained.

2.1. Customization as a Tool for Sustainability

Technology development and recent global health disruptions are causing serious changes in all industries. Affected by these issues, industries are coping with these challenges in different ways [20]. One of the most impacted business-related elements are value chains [21]. Based on the common understanding of value chains, basic relationships in the chain persist between suppliers, producers and customers whereby each level has its own main theme impacting the chain level. Figure 1 shows the assumptions of this research influencing the need for improving the material selection process.
Technology development is influencing all levels in a value chain but in the context of material selection it is important because it brings diversity and thereby raises the quantity in the pool of available materials and parts to choose from. Here, the leading idea is the following: the bigger the pool to select from, the more complex the procedure to select that must be applied. On the other hand, the diversity of supply gives an opportunity to select more wisely and more appropriately. At the upper end of the value chain, along with the technology development, customers are also becoming more aware of their impact strength. Analyzing customers’ needs and demands, understanding what drives customers to interact, forecasting the future and reacting to existing preferences are minimum activities in managing customer experience. A producer’s agility to respond to the previously mentioned changing business environment becomes essential for sustainable business models ensuring proper value creation.
According to Osterwalder’s Business Model Canvas [22], the material selection process is impacting the following elements:
  • Value proposition: materials and parts are influencing the value a producer delivers to the customer; this has to correspond to customer’s perception about the expected value like newness, performance, compliance with green-orientation risk reduction, and other perception factors.
  • Key customer segments: customers’ perception of value forms his expectations and experience. Although mass produced goods still have their audience, customization becomes a key differential approach to market challengers. Their agility starts in the design phase by designing products with a high level of variety in using different materials. At the same time, more variety implies more complexity in the production phase but this seems to be a challenge which customer orientated business must cope with in order to stay competitive.
  • Key resources and key partners: keeping in mind that materials and parts as resources in production processes must satisfy at least minimum technical requirements and appropriate substitutes can be identified using existing algorithms (e.g., Ashby maps). Relevant aspects considering recent disruptions put shorter time for delivery, supplier’s reliability, availability of materials, and traceable incoming distribution channels high in the requirements list. Together with customer orientation inputs, these aspects are becoming a part of exclusion criteria in terms of sustainability.
Other elements of the Business Model Canvas are affected as well but previously listed elements show most sensitivity in relation to the material selection process.
To summarize the issues discussed from the business aspect, the following steps are important when considering the proposal of this research for customizing the material selection process:
  • Draft minimum technical requirements for materials and variable requirements projected by a customer’s needs in relation to their perception and preferences in a diversity of options by dealing with a variety of materials and parts;
  • Forecast demand for materials needed to produce goods or deliver outputs;
  • Ensure customization by achieving agility in production processes;
  • Ensure continuity of production processes by diversifying the pool of suppliers at the lower end of the value chain;
  • Create a short-list of reliable suppliers of original and substitute materials meeting minimum technical requirements;
  • Apply exclusion criteria for creating a final list of appropriate suppliers.
In order to visualize the proposed algorithm and show the sequence of activities which need to be performed along with optionality in iterations, a process model in Figure 2 is given. The process model is designed in accordance to Business Process Model and Notation specifications BPMN 2.0. [23] in Bizagi Process Modeler [24]. The proposed algorithm relies on two flow charts explaining the importance of investigating technical requirements of materials [25] and a multi-criteria approach [1].
The process model in Figure 2 should be read from upper left corner of the figure (green circle), where the sequences of activities (blue rectangles) begin. The first two activities of drafting minimum technical and variable requirements can be started in parallel, but the forecasting of demand for materials and parts cannot start before both activities are completed. Next, the activity of running appropriate selection tools and the definition of exclusion criteria based on a producer’s customization agility can start after demand is forecasted. After additional exclusion criteria based on supplier analysis is executed and appropriate substitutes which meet minimal technical requirements have been found, exclusion criteria can be applied. If materials and parts meeting all criteria are found, the final selection can be performed. Otherwise, the refinement of the exclusion criteria should be conducted and the second iteration of applying exclusion criteria on a list of substitutes which meet minimum technical requirements can be initiated.

2.2. Input Requirements for Material Selection

Defining the minimum technical requirements for materials and parts required for the continuous industrial production of equipment used in the energy generation and transmission is a basic condition for the procurement process. They are primarily object-related, i.e., they depend on the final product (conductors, isolators, cables, switch gears, transformers, generators and motors, solar panels, converters...). Variable requirements imply additional criteria that indicate the possibility of use of alternative materials to be considered, although according to the minimal technical conditions they would not be the first choice. They often depend on the specific requirements of a particular customer at a given time, which will also affect the forecast of demand for materials and parts to be procured.

2.3. Proposed Method as the Selection Tool

The key distinction in choosing the best-fitting material is that between intensive and extensive properties of the material. Extensive ones are those dependent on the size of the sample of the given material (e.g., mass, volume), and intensive are those which are independent of its size (e.g., density, conductivity). One of the greatest accomplishments of the problem of material selection was undertaken last century by Dr. Michael Ashby (University of Cambridge, Cambridge, UK) who implemented the fact that in a specific problem, one or more extensive parameters in the extremization procedure can be exchanged with the combination of intensive parameters, which are known and are constant for each specific material. That method of simultaneously comparing several materials comes in the form of the “Ashby maps”. In any specific problem, a pair of intensive parameters A and B can be observed. They will occur as a combination AaBb, and to maximize or minimize that combination, the graph log (A) vs. log (B) can be plotted for many materials. Such a plot is called an Ashby map and the combination AaBb is called a merit index or performance index. On a plot of this kind, all materials lying on the line with a slope –b/a and a specific intercept will have the same value in the performance index. If a = 1 and b = −1, all materials on the line with a slope 1 and the same intercept will be equally good, regardless of the absolute values of A and B. Materials of the same family will usually have similar values of A and B and can be grouped into areas which they occupy and their usability visually interpreted. The largest advantages of using such maps are:
  • Instead of simply calculating thousands of numbers every time something is needed, the change of a and b in the performance index is reflected in the change of the slope of the existing map, so no further calculations are needed;
  • Exact units or powers of the values of the variables are not needed, as they do not affect the slope of the logarithmic graph, which makes it much easier to work with.
Searching and adding data one by one is a very laborious task which can be shortened by the big data methods and process automation. An example is given below, where the logarithm of Young’s modulus is plotted against the logarithm of the density, and 3 different lines were shown, where a = 1 and b takes values of −1, −2 and −3. On the map, families of materials like foam, natural materials, metals, ceramics etc. are shown. It is sufficient to have a ruler to be able to deduce the best materials for a given performance index.

2.4. Big Data Processing

With the implementation of modern information and communications technology (ICT), the data of appropriate materials and their properties can be stored in the data warehouse in near-real time for future use. By storing the historical data in the data warehouse, conditions for quality predictions and calculations of future corrective factors for different methods and algorithms of material selection are created because the entire system learns based on stored immutable data in the data warehouse.
The data stored in the data warehouse are not only those that have resulted from our methods and algorithms, but are collected from various sources periodically and in real or near real time [26].
Very soon, the data warehouse will store a large amount of structured, semi-structured and unstructured data, which will be used for data mining and other machine-learning methods to improve algorithms in the selection of materials for the construction of power smart grid networks. Although the amount of data collected in this way is not extremely large, still the term big data and the use of analytical methods suitable for large amounts of data are applicable.

2.4.1. The Term of Big Data

Big data were initially characterized by 3V (volume, velocity, variety), while today it is stated as much as 8V (volume, velocity, variety, veracity, vocabulary, vagueness, viability, value).
  • Volume: the amount of data,
  • Velocity: the speed of the data coming in or the speed of processed data,
  • Variety: the heterogeneous data sources,
  • Veracity: something true,
  • Vocabulary: the language used to describe the desired outcome of an analysis and/or semantic searching and operations within a semantic space,
  • Vagueness: interpretation issue with results being returned - more data doesn’t necessarily mean better or more accurate results,
  • Viability: model’s ability to represent reality,
  • Value: whatever is important to the client or user.
The most common problem that occurs in big data analysis is that an increase in the first 6V results in a decrease in viability and value, due to hardware limitations. Hardware deals with velocity and volume and software deals primarily with variety, veracity, vagueness and vocabulary.
From these eight V’s and their relationships to used hardware and developed software algorithms and methods, the opportunity to find the best (better) characteristics of the materials used is created.

2.4.2. Big Data Analytics

Structured and unstructured data that thus arrive at the data warehouse at different time intervals are very demanding and complicated for the classical analysis known in relational data processing technology [27].
To analyze such systems, big data analytics needs to be used.
Big data analytics is the complicated process of examining stored data to uncover hidden correlations, market trends or client preferences. Big data analytics is a set of algorithms for predictive modelling and statistical on-line analytical processing (OLAP) analysis with the purpose of assisting in business decision making. Big data analytics is a form of modern and advanced method that differs significantly from conventional business intelligence (BI) analysis.
Big data applications include data from a variety of sources. Structured data most often comes from transactional (relational) databases with Structured Query Language (SQL) query languages, unstructured data is collected from clusters and NoSQL (not only SQL) databases, and semi-structured from log files and various sensors.
The quality of big data analytics strongly depends on the quality and accuracy of the data loaded into the data warehouse. One of the most important processes that precedes is the extract–transform-load process (ETL), in which data is found, extracted, cleaned, transformed and periodically (or in real time) stored in a data warehouse.
Once the data are ready, they can be analyzed with the specialized software for data mining, predictive analytics, machine learning or deep learning. For those applications, queries can be written in various programming languages such C, C++, Java, Python, Scala and SQL.
Nowadays, big data analytics in the electrical energy industry has become increasingly beneficial. The collected insights facilitate better informed and more efficient decisions when choosing materials for building a smart power grid. The perceived lack of big data analytics initiatives involves the high cost of hiring experienced scientists, analysts, and data engineers to fill the gaps between available, analyzed, and data based on which decisions are ultimately made.
Advantage of using big data in conjecture with Ashby maps is exactly illustrated by the Figure 3 and Figure 4. Manually searching relevant data one by one can only progress a project so far, as illustrated on Figure 4. However, being able to take exponentially more data, criteria, and truly optimize the selection is something which can not only give results in form of maps similar to those in Figure 3, but much larger, fuller, and with more options.

2.5. Exclusion Criteria

Defining and refining exclusion criteria in the material selection process in the proposed algorithm severely impacts the final step of selecting appropriate materials and parts. For that reason, exclusion criteria are systemized into four groups, presented in Table 1. The left column shows the criteria group name, and in the right column examples of criteria are listed. These criteria arise from previous discussion about the technology development impact and professional experience of the authors in energy-related industries.
Criteria list from Table 1 is not finite, since its intention is just to demonstrate how the algorithm can be implemented. Also, criteria from more than one group can be applied simultaneously.

3. Results of Testing the Algorithm

In order to indicate possible applications of the proposed algorithm, two realistic examples of material selection in the field of power engineering are analyzed: selection of suitable materials for production of overhead transmission line conductors, i.e., material for overhead transmission grid poles.

3.1. Requirements for Materials for Conductors/Poles

The basic requirements that affect the choice of material for production of conductors are as follows:
  • good electrical conductivity,
  • light weight,
  • high mechanical strength,
  • good processing capability,
  • resistance to corrosion, damage and aging,
  • low price.
As the requirements are numerous, no material can completely meet all criteria. Today, aluminum and its alloys are mostly used for overhead conductors in the transmission grid. Moreover, in addition to homogeneous conductors (made of one material), heterogeneous and mostly combined conductors made of several materials are also used. Some of the new technologies in conductor-making today are known as conductors with a steel core (ACSR—aluminum conductor steel-reinforced and ACSS—aluminum conductor steel-supported) or conductors with composite core (ACCC—aluminum conductor composite core and ACCR—aluminum matrix conductor composite-reinforced).
In the process of selecting materials for the construction of overhead transmission network poles, it is important to consider their bending strength. Thereby, for a pole of a certain height (depending on the voltage level), different materials will need different mass (diameter of the pole) in order not to bend under the load of the conductor in different weather conditions, as snow and ice, wind.

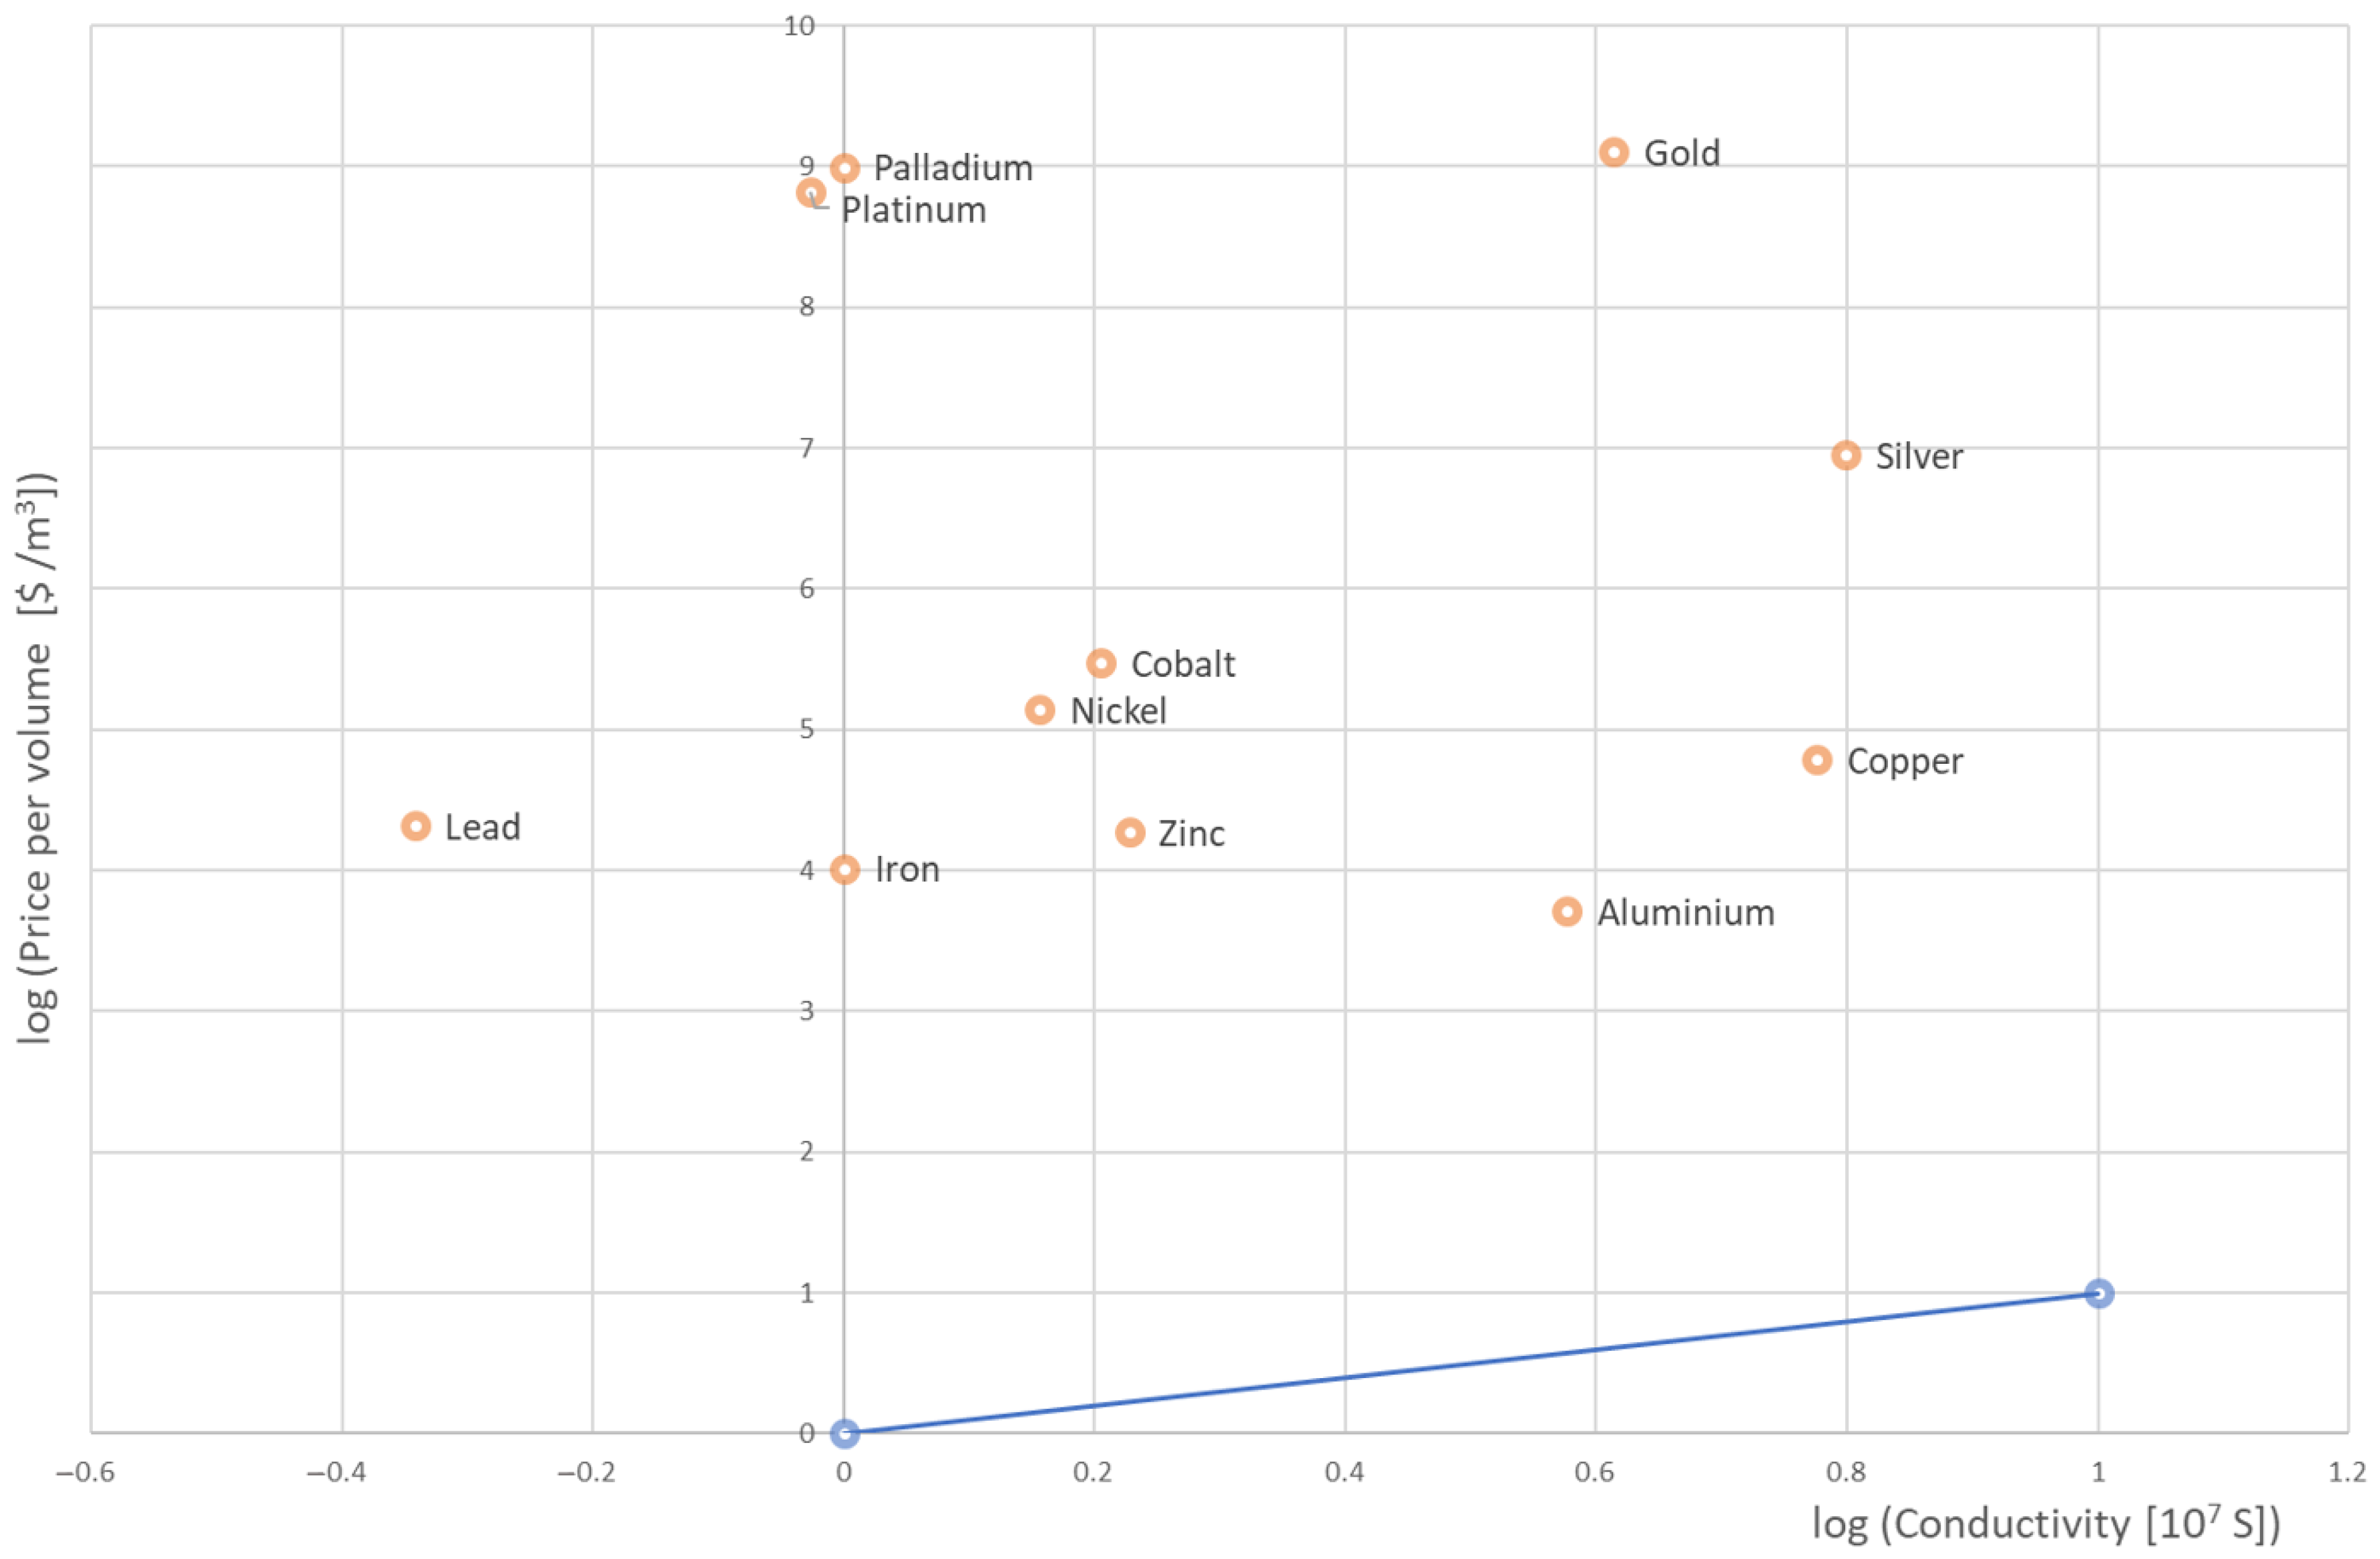
3.2. Example of Ashby Maps’ Application

There are many technical requirements that a material needs to satisfy, as was postulated earlier. With an example, it will be shown how the performance index works and how it can be widened from technical parameters to economical as well.
In a case of power line cables, as the example, two parameters can be chosen: 1. that the mass must be minimized to decrease the load on the structure, and 2. that the resistance must be minimized to decrease the power loss. For the construction of the appropriate map, the following relations are needed:
M = ρ S l
R = l σ S S = l σ R
M = l 2 ρ σ R
M R = l 2 ρ σ
where M is the mass, ρ is the density, S is the cross-sectional area, l is the length of the conductor, R is the resistance and the σ is the conductivity.
The cross-sectional area is not a parameter at all, because it is the extensive parameter that is exchanged for the intensive, and it will be calculated from the specific data for the chosen metals. i.e., the physical variables (M and R) which need to be minimized, are now dependent solely on the unchangeable properties determined by the system itself (length) and intensive properties of the materials (density, conductivity). Thus, the material can be chosen on the basis of its characteristics, without reference to any extensive parameter (e.g., it is not the case that one material is better at some cross-section, and another with a different cross-section). A product of two extensive properties is now an intensive property.
Including the economical parameters (e.g., cost) can be done in several ways:
  • Minimize the price of the material and its resistance at once, without plotting density explicitly by P = pM, total price is price per mass multiplied by a mass, and the expression for minimization of mass and resistance is already derived, so only another multiplicative intensive factor is needed;
  • Firstly determine the best materials purely on a technical basis, and then for those which are the best, consider the price etc.
The first method is faster, while the second eliminates more materials. Ideally, both should be undertaken to make sure all the candidates are considered. Using the first method to add the price to the above-derived expression for MR, it is possible to merge economical and technical requirements using a single expression by defining the price per volume, pV which is calculated as price per mass multiplied by density:
P R = p l 2 ρ σ = p V l 2 σ
Using Equation (5) a plot of log(pV) vs. log(σ) can be made. Figure 4 shows the graph created according the described procedure for 11 metals: aluminum, cobalt, copper, gold, iron, lead, nickel, palladium, platinum, silver and zinc.
In this example, powers of pV and σ in Equation (5) are 1 and −1 respectively. Thus, all materials lying on the line of slope 1, sharing the same intercept, will have the same value of MR, and the best materials will be found at the bottom right, as there the performance factor is minimized. On Figure 4 the line with slope 1 is shown in blue. If that line is translated upwards, the first materials which will be touched by that line will be aluminum and copper, then zinc and silver. Interestingly, iron is the cheapest metal, silver has the best conductivity, and aluminum is the lightest, thus it is hard to say without calculation which one will be the best; unlike in the case of gold, platinum and palladium it is clearly visible that they are so expensive that they will never be used for this purpose. It turns out that the aluminum has the best combination of the desired properties.
The purpose of the map is now clearer: a low-priced and light material with a lower conductivity can be equally good or better than the high-priced and heavy material which is a better conductor.
When there are more than two parameters, several forms of analysis are possible: one is by creating a 3D plot and observing planes instead of lines, which might be harder to visualize; another would be to construct many diagrams for the pairs of variables and correlate the best ones on each to find the perfect few, which from the final material(s) will be selected.
If different extremization of the price and the resistance is needed, instead, another expression with another set of variables will be constructed, and now some other materials will turn out to be optimal. There is no universally perfect material, and it is only necessary to know the correct expression of the variables which must be extremized, but the same map can be used, just with the different slope of the line, which makes the process faster. If there is an interest in the family of aluminum or copper alloys, they can be added to the map and the whole areas can be compared at once, instead of one at the time.
As another example, material selection for the transmission grid poles can be observed. Poles need to carry heavy load, not bend and break, and be cheap and light so the large number of them can be installed to supply the wide areas with electricity. For this purpose, they can be modelled as cylinders of radius r and length l. Length, i.e., height, is predetermined by the physical requirements of the transmission system and it is a fixed parameter which depends on the geographical positioning of the pole. Parameters which it is desired should be minimized are mass and the deflection (bending) at the top. To do this, the following relations are needed.
The deflection δ at the top (where the force F is assumed to be applied) is given by the next equations:
δ = F l 3 3 E I
I = r 4 π 4 = M 2 π 4 ρ 2 l 2
M 2 δ = 4 F l 5 3 π ρ 2 E
where δ is the deflection at the top, F is the force, l is the height of the pole, E is the Young’s modulus of the material, M is the mass of the pole, ρ is the density of the material and I is the second moment of the area. The equation obtained can be interpreted in two ways:
  • It gives a way to minimize the deflection for a given mass of the pole;
  • It gives a way to minimize the product M2. δ
The relevant performance index which would need to be minimized is ρ2/E, or equivalently, the index E1/2 should be maximized. As before, there is an extensive parameter which was swapped for an intensive, and that is the radius of the pole.
Using this performance index and the Figure 3 the best materials are found by taking the line E1/2 which is visible on the bottom right of the figure and moving it parallel until it touches the last materials on the top-left side. It is visible that the best materials to be chosen are: wood (parallel to the grains), carbon fiber-reinforced polymer (CFRP), technical ceramics such as B4C and rigid polymer foams.

3.3. Exclusion Criteria Application

There are many technical requirements that materials need to satisfy, as has been shown in the Section 3.2. The short list of possible substitutes outputted by the Ashby map should now undergo the exclusion criteria application. Defining and refining exclusion criteria should follow the strategy of managing the value proposition, i.e., be more oriented at reaching high quality, minimizing risk by selecting suppliers with short and reliable delivery channels or choosing suppliers with higher standards in environmental impacts. In the first example, cost-related aspects have already been partially addressed in the technical requirements check, but other cost characteristics like volatility of price or payment options could also be important, especially taking into account recent disruption in the global markets caused by the pandemic. The role of input data availability is at this point very important due its high impact on the output of the selection process.
In the second example, wooden poles are being used and are indeed favored for this task. CFRP are used in many places in architecture because of their lightness and immense strength, so it would be an option to use them here as well. Boron carbide (B4C) is the third hardest substance known, and it is very stiff. However, its use in this example would be the least promising option, because it is very expensive, and is usually used in very small amounts for cutting tools and control rods in nuclear reactors, bulletproof vests and tank armors. Lastly, foams have small density, so their deflection would be substantial and they would not be used, although such poles could be very light, but could not hold a mass several times greater than their own, i.e., the mass of the wires. These common cases of usage should be taken into consideration, but ultimately the exclusion criteria depend on the decision as to which options are feasible for the customer offerings.
As mentioned in previous section, availability of data about suppliers for each material which is chosen as optional by the Ashby protocol, also impacts the material selection in final variants of products for customers. Achieving agility in responding to customer requests, more diversity in materials that can be used raises the complexity of producing variants of products. Therefore it is possible that only a few variants would be feasible for the sales process in terms of offering diverse variants which can be produced in an efficient manner. For that reason, data from enterprise resource systems and other data sources should be collected and analyzed for reducing the pool of possible suppliers able to deliver in set conditions related to quality, price volatility, delivering routs, certification and standardization requirements, delivery time or other properties relevant for the selection process.

4. Discussion and Conclusions

Due to disruption in the global market as well as to technology development, customer orientation and customization of production goods are becoming essential for sustainability. Proper responsiveness to a changing environment and insurance of appropriate value proposition depend on the agility of businesses and their ability to adapt to new paradigms of diversification. In view of that, we propose a material selection process for customizing the materials and parts selection on a case of application in power engineering. The applicability of this algorithm could find its place in following phases of the product life cycle:
(A)
Design phase: during the development of new products or during the creation of product variants when technical blue-prints, bill of materials (BOM) and assembly instructions are developed, a diversity of materials and parts increases the complexity of the process but at the same time allows the customization to happen. In this case the exclusion criteria should be set to minimum in order to create a greater pool of product variants.
(B)
Procurement phase: while relying on satisfying the minimum technical requirements, purchase agents can explore most exclusion criteria in order to keep cost of the production in an expectable range.
(C)
Production preparation phase: attributes concerning delivery time and quality of the materials and parts play an important role since they affect the production material requirement planning and the scheduling process.
(D)
Sales phase: while creating sales quotes, the variability of BOMs impacts the diversity and terms offered to customers which affect the sales order management.
Other processes can benefit from the customization of the material selection process as well, but the greatest effects can be expected in A–D.
An important aspect of this research was to emphasize understanding and implementation of a customer-centricity based approach in offering more customization opportunities in various phases of the product life cycle. More customization for the customer on the one hand raises flexibility in the offering, but at the same time increases the complexity of internal operational processes. By introducing diversity through broadening of technical possibilities, additional exclusion criteria must be applied for focusing the selection options within the pool of feasible options in regard to other business or soft criteria and keeping the response-time in executing business processes within expected limits. A balance of diversity and complexity is, therefore, crucial.
On the other side a strong limitation of the proposed material selection process for customizing the materials and parts selection is obliviously the quality and volume of input data need to perform the selection. Appropriate big data and analysis tools influence the quality of output data from proposed processes, and in that sense collections of data for proper selection are crucial, which can be the focus of future work. Additionally, a more in depth analysis based on data analytics of multiple parameters is required and it should include a comprehensive overview of factors needed for raising internal operational efficiency related but not limited to volatility of prices, availability, delivering options and other factors of material procurement.

Author Contributions

Conceptualization, D.S. and K.T.-P.; methodology, K.T.-P., L.H. and I.S.; validation, D.S. and K.T.-P.; formal analysis, I.S.; investigation, L.H.; resources, I.S. and L.H.; data curation, I.S.; writing—original draft preparation, L.H. and D.S.; writing—review and editing, K.T.-P.; visualization, I.S. and D.S.; supervision, D.S. All authors have read and agreed to the published version of the manuscript.

Funding

This research received no external funding.

Conflicts of Interest

The authors declare no conflict of interest.

References

  1. Chatterjee, P.; Chakraborty, S. Material selection using preferential ranking methods. Mater. Des. 2012, 35, 384–393. [Google Scholar] [CrossRef]
  2. Zhang, Q.; Hu, J.; Feng, J.; Liu, A. A novel multiple criteria decision making method for material selection based on GGPFWA operator. Mater. Des. 2020, 195. [Google Scholar] [CrossRef]
  3. Madhu, P.; Dhanalakshmi, C.S.; Mathew, M. Multi-criteria decision-making in the selection of a suitable biomass material for maximum bio-oil yield during pyrolysis. Fuel 2020, 277, 118109. [Google Scholar] [CrossRef]
  4. Nyamsi, S.N.; Lototskyy, M.; Tolj, I. Optimal Design of Combined Two-Tank Latent and Metal Hydrides-Based Thermochemical Heat Storage Systems for High-Temperature Waste Heat Recovery. Energies 2020, 13, 4216. [Google Scholar] [CrossRef]
  5. Desai, S.; Dean, C.; Desai, Y. Cyber-enabled concurrent material and process selection in a flexible design for manufacture paradigm. Int. J. Adv. Manuf. Technol. 2018, 97, 1719–1731. [Google Scholar] [CrossRef]
  6. Jahan, A.; Edwards, K.L. Multi-Criteria Decision Analysis for Supporting the Selection of Engineering Materials in Product Design; Butterworth-Heinemann: Oxford, UK, 2013; ISBN 9780080993867. [Google Scholar]
  7. Karabay, S. ACSS/TW aerial high-temperature bare conductors as a remedy for increasing transmission line capacity and determination of processing parameters for manufacturing. Mater. Des. 2009, 30, 816–825. [Google Scholar] [CrossRef]
  8. Yongping, L.; Yi, Z.; Pan, S.; Zhiyi, H.; Yang, N. Study on Section Stiffness, Poisson Ratio and Mechanism Characteristics of Large Cross-sectional Aluminum-steel Stranded Conductor. Energy Procedia 2012, 17, 843–850. [Google Scholar] [CrossRef] [Green Version]
  9. Ma, Y.; Dai, Q.; Pang, W. Reliability Assessment of Electrical Grids Subjected to Wind Hazards and Ice Accretion with Concurrent Wind. J. Struct. Eng. 2020, 146. [Google Scholar] [CrossRef]
  10. Geldermann, J.; Treitz, M.; Rentz, O. Towards sustainable production networks. Int. J. Prod. Res. 2007, 45, 4207–4224. [Google Scholar] [CrossRef]
  11. Luo, Y.C.; Zhou, M.C.; Caudill, R.J. An integrated E-supply chain model for agile and environmentally conscious manufacturing. IEEE ASME Trans. Mechatron. 2001, 6, 377–386. [Google Scholar] [CrossRef]
  12. Rasi, R.E.; Sohanian, M. A multi-objective optimization model for sustainable supply chain network with using genetic algorithm. J. Model. Manag. 2020. [Google Scholar] [CrossRef]
  13. Medina-Gonzalez, S.; Graells, M.; Guillen-Gosalbez, G.; Espuna, A.; Puigjaner, L. Systematic approach for the design of sustainable supply chains under quality uncertainty. Energy Convers. Manag. 2017, 149, 722–737. [Google Scholar] [CrossRef] [Green Version]
  14. Mastrocinque, E.; Ramirez, F.J.; Honrubia-Escribano, A.; Pham, D.T. An AHP-based multi-criteria model for sustainable supply chain development in the renewable energy sector. Expert Syst. Appl. 2020, 150, 113321. [Google Scholar] [CrossRef]
  15. Mathiyazhagan, K.; Gnanavelbabu, A.; Prabhuraj, B.L. A sustainable assessment model for material selection in construction industries perspective using hybrid MCDM approaches. J. Adv. Manag. Res. 2019, 16, 234–259. [Google Scholar] [CrossRef]
  16. Vyhmeister, E.; Ruiz-Mercado, G.J.; Torres, A.I.; Posada, J.A. Optimization of multi-pathway production chains and multi-criteria decision-making through sustainability evaluation: A biojet fuel production case study. Clean Technol. Environ. Policy 2018, 20, 1697–1719. [Google Scholar] [CrossRef] [PubMed]
  17. Ashby, M.F.; Shercliff, H.; Cebon, D. Materials: Engineering, Science, Processing and Design, 2nd ed.; Butterworth Heinemann: Oxford, UK, 2010; ISBN 9781856178952. [Google Scholar]
  18. Ashby, M.F. Materials Selection in Mechanical Design, 3rd ed.; Butterworth Heinemann: Oxford, UK, 2005; ISBN 0750661682. [Google Scholar]
  19. Hosemann, P.; Frazer, D.; Fratoni, M.; Band, A.; Ashby, M.F. Materials selection for nuclear applications: Challenges and opportunities. Scr. Mater. 2018, 143, 181–187. [Google Scholar] [CrossRef] [Green Version]
  20. Pihir, I.; Tomičić-Pupek, K.; Tomičić Furjan, M. Digital Transformation Playground-Literature Review and Framework of Concepts. J. Inf. Organ. Sci. 2019, 43, 33–48. [Google Scholar] [CrossRef]
  21. Coursera MOOC: Digital Transformation. 2020. Available online: https://www.coursera.org/learn/bcg-uva-darden-digital-transformation/lecture/a7T8h/exponential-evolution-of-technology (accessed on 11 November 2020).
  22. Osterwalder, A.; Pigneur, Y. Business Model. Generation: A Handbook for Visionaries, Game Changers, and Challengers; John Wiley & Sons, Inc.: Hoboken, NJ, USA, 2010; ISBN 9780470876411. [Google Scholar]
  23. Business Process Model and Notation Specification Version 2.0. 2011. Available online: https://www.omg.org/spec/BPMN/2.0/About-BPMN/ (accessed on 12 October 2020).
  24. Bizagi-Digital Process Automation and BPM. 2019. Available online: https://www.bizagi.com/ (accessed on 14 November 2020).
  25. Pfeifer, M. (Ed.) Chapter 3—Selecting Materials. In Materials Enabled Designs; Butterworth-Heinemann: Oxford, UK, 2009; pp. 51–58. ISBN 9780750682879. [Google Scholar]
  26. Baesens, B. Analytics in a Big Data World: The Essential Guide to Data Science and Its Applications; John Wiley & Sons, Inc.: Hoboken, NI, USA, 2014; ISBN 9781118892749. [Google Scholar]
  27. Zhang, Y.; Huang, T. Big data analytics in smart grids: A review. Energy Inform. 2018, 1, 8. [Google Scholar] [CrossRef]
  28. Department of Materials Science and Metallurgy, University of Cambridge. Natural Sciences Tripos Part IA. In Course Material-Data Book; Granta Design: Cambridge, UK, 2018. [Google Scholar]
Figure 1. Changing relationships in value chains.
Energies 13 06458 g001
Figure 2. Material selection process.
Energies 13 06458 g002
Figure 3. Example of the Ashby map, log (Young’s modulus) vs. log (Density) [28].
Energies 13 06458 g003
Figure 4. Constructed Ashby map for the considered example, log(pV) vs. log(σ) with an indicated line.
Energies 13 06458 g004
Table 1. Exclusion criteria groups and examples.
Criteria groupExamples of Criteria
Quality-related criteria
  • Reliability of supplier (in terms of quality and delivery)
  • Maximum expected performance of materials and parts
  • Certificates of higher quality
  • Warranty conditions
Risk-related criteria
  • Safe, reliable and short delivery channels
  • Availability of demanded quantities
  • Standard expected performance of materials and parts
Environment-related criteria
  • Low-carbon impact in producing materials and parts
  • Traceability and responsibility in previous part of the supply chain
  • Standard expected performance of materials and parts
  • Eco-friendly delivery channels
Cost-related criteria
  • Minimum expected price and price volatility
  • Minimum expected performance of materials and parts
Publisher’s Note: MDPI stays neutral with regard to jurisdictional claims in published maps and institutional affiliations.

