Article

Investigation of the Effects of Reduced Sintering Temperature on Dielectric, Ferroelectric and Energy Storage Properties of Microwave-Sintered PLZT 8/60/40 Ceramics

1
School of Materials Science and Engineering, Yeungnam University, Gyeongsan 38541, Korea
2
Ceramics and Composites Group, Defence Metallurgical Research Laboratory, Hyderabad 500058, India
3
Advanced Centre of Research in High Energy Materials, School of Physics, University of Hyderabad, Hyderabad 500046, India
4
School of Physics, University of Hyderabad, Hyderabad 500046, India
*
Authors to whom correspondence should be addressed.
Energies 2020, 13(23), 6457; https://doi.org/10.3390/en13236457
Submission received: 6 August 2020 / Revised: 28 August 2020 / Accepted: 22 October 2020 / Published: 7 December 2020
(This article belongs to the Special Issue Advanced Materials for Supercapacitor Electrodes)

Abstract

:
In this study, (Pb0.92La0.08) (Zr0.60Ti0.40) O3 (PLZT 8/60/40) ceramics were synthesized using a high-energy ball-milling technique followed by microwave sintering at different temperatures from 900 °C to 1200 °C. The optimal microwave sintering temperature for the PLZT 8/60/40 ceramics was found to be 1150 °C, which is relatively low compared with conventional sintering temperature. The sintered ceramics show the pure perovskite phase, uniform grain microstructure (1.2 µm) and high density (~99.5%). The polarization vs. electric field (P-E) hysteresis curves were used to investigate the ferroelectric and energy storage properties. The switching characteristic in P-E loops and occurrence of domain switching current in current vs. electric field (I-E) loops confirms their ferroelectric nature. The PLZT ceramics, which were sintered at 1150 °C, show the highest remnant polarization (Pr) of ~32.18 μC/cm2 and domain switching current (Imax) of ~0.91 mA with a low coercive field (Ec) of ~10.17 kV/cm. The bipolar and unipolar strain vs. electric field (S-E) hysteresis loops were also measured and the highest unipolar strain was found to be ~0.26% for the PLZT ceramics sintered at 1150 °C. The unipolar S-E curves were used to derive the piezoelectric coefficient (d33~495 pm/V) and a strain hysteresis loss (~5.8%).

Graphical Abstract

1. Introduction

Lead lanthanum zirconium titanate (PLZT) is one of the most studied electroceramics due to its technological importance in various applications [1,2,3]. In PLZT ceramics, the ratio of La/Zr/Ti not only decides the morphotropic phase boundary (MPB) but also influence the microstructure and electrical characteristics. Moreover, the nature of the material such as ferroelectric (FE), paraelectric (PE), anti-ferroelectric (AFE) and relaxors ferroelectric (RFE) is also decided by the La/Zr/Ti ratio [4,5,6]. PLZT ceramics of different natures (FE, PE, AFE and RFE) or different compositions (ratio of La/Zr/Ti) possess a higher piezoelectric coefficient, electromechanical coupling coefficients with a wide range of dielectric constants. These properties are sufficiently large to exploit in different types of piezoelectric device such as sensors, actuators and energy harvesting devices. PZT/PLZT materials are used for energy-harvesting applications as a cantilever structure [7,8,9], use as a multilayer stack [10], thermal energy harvesting using pyroelectric effects [8,11,12] or use of ceramic discs in the shoe heel [13]. The PZT/Ni unimorph magnetoelectric energy harvester is reported for its high power density of 270 µW/cm3 for wireless sensing applications [7]. PLZT ceramics were also reported for their ability to harvest waste heat energy using their pyroelectric effects. Thermal energy harvesting using non-linear pyroelectric effects was investigated in PLZT ceramics with different Tc and BaTiO3-based ceramics. PLZT 9.1/65/35 ceramics exhibited the energy generation of 52 J/L/cycle [8]. Lee et al. reported the pyroelectric energy density of 1014 J L−1 per cycle for 190 μm thick 7/65/35 PLZT ceramics, which is the largest ever for ceramics, single crystals, and polymers [12]. In a working model, the PLZT ceramic disks were fitted in the heel of shoes which generate an electrical charge while walking. The generated energy is stored in a battery and can be used for powering electronic circuits and devices. The generated voltages depend on the weight of the person and vary with applied pressure. [13]. The PLZT system is not only used for energy storage applications but also show some advanced phenomena such as electrocaloric effect, pyroelectric effect, ferrophotovoltaic effect, photostriction as well as optical and other non-linear properties which further make them useful for practical devices [14,15,16,17,18,19].
Generally, the processing of electroceramics has two high-temperature steps (i) calcination (for phase formation) and (ii) sintering (for high density) which are extremely important to determine the electrical properties. If electroceramics contain volatile elements such as lead, bismuth, potassium, etc. (in this study, lead), some excess amount of volatile element is always added to compensate for the losses at higher temperatures. Lead is toxic in nature and has environmental issues, however, the non-availability of commercial lead-free materials and less stable electrical properties makes it difficult to replace lead-based ceramics. At present, more attention is given to minimize the lead that comes out into the ambient as much as possible. Due to the high processing temperature most of the lead-loss occurs at this stage, which is usually compensated by adding the extra amount of lead in the starting compositions [20,21]. This extra lead addition is not only detrimental to the environment but also can limit the material performance. The extra amount of lead also can affect the density of the ceramics and promotes abnormal grain growth. Since lead is harmful, efforts should be made to minimize the lead loss at the processing stage by reducing the calcination and sintering temperatures. If the processing temperature is reduced significantly, it will not only solve the above-mentioned problems but also help to decrease the amount of Pb toxicity in the environment. Out of several methods which are reported to reduce the processing temperature of lead-based ceramics, one of them is to use a high-energy mechanochemical (HEM) ball-milling technique [21]. In the HEM method, the particle size of the raw oxides of the ceramics is reduced down to the nanometer scale to increase the surface to volume ratio of the nanoparticles. This makes the milled nanopowders highly reactive and chemical reaction takes place. In this technique, ceramics were synthesized via the reactions of raw oxides by mechanical energy without using heat energy [21].
The use of microwave or millimetre wave radiation is also considered as an alternative approach to lowering down the processing temperature of lead-based ceramics since the materials absorb microwaves radiation and the interaction between microwaves and material generates the heat, which is also called self-heating. Microwave-induced material heating is volumetric (no temperature gradient), material dependent and faster than conventional sintering [22]. The use of microwave sintering not only reduces the processing temperature but also improves the density, microstructure and electrical properties [23,24]. Microwave sintering was used for both lead-based [25,26,27,28] and lead-free ceramics [29,30]. Several reports are available on microwave sintering of PZT ceramics [25,26,31,32], however, not many reports related to the microwave heating of PLZT 8/60/40 ceramics and the effect of on the electrical properties are available. The aim of this study was to reduce the overall processing temperature and time of the PLZT 8/60/40 ceramics by using microwave radiation since PLZT ceramics are usually conventionally sintered in the temperature range from 1200 °C to 1300 °C [1,20,33]. In this study, PLZT ceramics were sintered using microwave radiation in the temperature range of 900–1200 °C and the dielectric, ferroelectric, energy storage and piezoelectric properties were investigated. The PLZT ceramics sintered at 1150 °C for 20 min possess optimal electrical properties.

2. Experimental Procedure

Stoichiometric quantities of commercial raw powders of PbO, La2O3, ZrO2 and TiO2 (AR grade, purity > 99.9%, Sigma-Aldrich, St. Louis, MO, USA) were HEM ball milled using planetary ball milling system (Pulverisette p-5, Fritsch GmbH, Idar-Oberstein, Germany) to prepare PLZT 8/60/40 ceramic powders (No extra PbO). Raw oxides with 500 grams of yttrium stabilized tetragonal zirconium (YTZ) balls of ~3 mm diameter (Tosoh, Tokyo, Japan) and distilled water were placed in a 500 ml zirconia vial and milled for 5 h and the particle size reduced to nanometer scale [34]. Milled PLZT 8/60/40 powders were calcined at 800 °C (heating rate = 5 °C) for 4 h, uniaxially pressed (~35 kg/cm2) into the disc shape. These ceramic discs of ~1 mm thickness were sintered at different sintering temperatures (900–1200 °C for 20 min) using a microwave furnace (Microwave Sintering System, CPCD2114-SB, 1.45 kW 2450 MHz magnetron, ENERZI, Belgaum, India). The complete duration of the microwave sintering is lesser than conventional sintering (Figure 1). The sample temperature is measured by a radiation pyrometer. For electrical properties investigation, the sintered ceramic discs were coated with silver electrode (500 °C for 15 min) and poled at optimal poling conditions (poling field = 3 kV/mm, poling time = 15 min, poling temperature = 100 °C) using a direct current (DC) power supply (PS370, Stanford research systems, Sunnyvale, CA, USA). More detailed information about the PLZT 8/60/40 ceramic sample preparation, microwave sintering and poling procedure are given in previous publications [34,35,36,37]. An LCR meter was used for the measurement of temperature-dependent dielectric properties (E-4980A, Agilent, Santa Clara, CA, USA). A FE evaluation system (TF analyzer 2000, aixACCT Systems, GmbH, Berlin, Germany) was used to measure P-E, I-E and S-E hysteresis loops using a triangular waveform (1 Hz and 25 °C).

3. Results and Discussion

The detailed phase (X-ray diffraction patterns) and microstructural analysis (scanning electron microscopy images) of the microwave-sintered PLZT 8/60/40 ceramics are already published [35] and a short summary is given here for the completeness of the manuscript. The PLZT ceramics, microwave sintered at 900 °C and 1000 °C show the grain size in the submicron range. When the ceramic microwave sintering temperature was increased from 1050 °C to 1200 °C, the grain size of the ceramics was also increased from the submicron to the micron region. The PLZT ceramic sintered at 1150 °C shows the dense microstructure, uniform, clear and visible grain sizes ~1.2 µm and highest density, which affects the electrical properties. The density of the PLZT 8/60/40 ceramics was calculated by the Archimedes method and listed in Table 1 with other microstructural parameters.

3.1. Temperature-Dependent Dielectric Properties of PLZT 8/60/40 Ceramics

The effect of frequency on the dielectric properties of PLZT 8/60/40 ceramics microwave sintered at different temperatures was discussed previously [35]. In this study, the effect of temperature on the dielectric properties is discussed in detail. As we know, the dielectric properties of the PLZT materials are greatly affected by the density, grain size, pores, etc. The porosity-corrected dielectric constant is given by the following equation [38,39,40]
ε = ε m ( 1 3 p ε m 1 2 ε m + 1 )
where, ε′ is the measured dielectric constant and εm is the porosity-corrected dielectric constant. The fraction of porosity is given by p = 1 − ρ, where ρ is the experimentally measured density of ceramics. The measured dielectric constant and the porosity corrected dielectric constants for microwave sintered PLZT 8/60/40 ceramics is given in Table 1.
Temperature-dependent dielectric studies were also performed to learn more about FE phase transition. Figure 2a shows the change in dielectric constant (εr) and loss (tanδ) with temperature for microwave sintered (900 °C to 1200 °C) PLZT 8/60/40 ceramics measured at 1 kHz. In Figure 2a, the εr vs. T curves (1 kHz) are broadened curve rather than a sharp peak at a transition temperature (Tc) but in this study considered as dielectric maxima temperature (Tm). This shows the disordered perovskite structure with a diffuse-type phase transition. The εr vs. T curves show the change in Tm and increase in peak dielectric maxima value as a function of microwave sintering temperature except for the PLZT ceramics sintered at 1200 °C. The shift or decrease in the dielectric maxima temperature is due to the change in the grain sizes of the microwave-sintered PLZT ceramics. Not only are the density and the microstructure but also the tetragonality, polarization, dielectric constant, Tc and piezoelectric coefficients of the PLZT ceramics are affected by the variation in grain sizes [35]. The value of Tm decreases as a function of sintering temperature due to the increase in grain sizes. The dielectric loss for the PLZT ceramics was also measured as a function of temperature and found to be less (Figure 2a). Figure 2b shows the change in Tm and dielectric maxima measured at Tm as a function of microwave sintering temperature for PLZT ceramics.
The normal type phase transition is a sharp phase transition at which the dielectric constant of the electroceramics show an anomaly (sharp peak in εr vs. T curves) at Tc and the material undergoes FE to PE phase transition. The broadness in the dielectric peak indicates that the phase transition behaviour of the material is shifting from normal type (sharp dielectric peak at Tc) to diffuse or relaxor type (broad dielectric peak at Tm). From Figure 2a it is evident that the dielectric maxima peak is broadened and the phase transition has deviated from the normal type of phase transition. The degree of deviation from the Curie-Weiss law (ΔTm) and diffuseness of the phase transition (ΔTdiff) can be evaluated from the following Equations [5,41,42]
ΔTm = TcwTm
Δ T d i f f   =   T 0.9 ε m a x T ε m a x
where Tm is the dielectric maxima temperature and the temperature from which permittivity starts to deviate from the Curie-Weiss law is denoted by Tcw, which can be from the reciprocal of dielectric constant vs. temperature curves. εmax = maximum value of ε at Tm. T0.9εmax denotes the temperature at high-temperature side of 90% of the εmax. The calculated parameters of PLZT 8/60/40 ceramics are listed in Table 2.

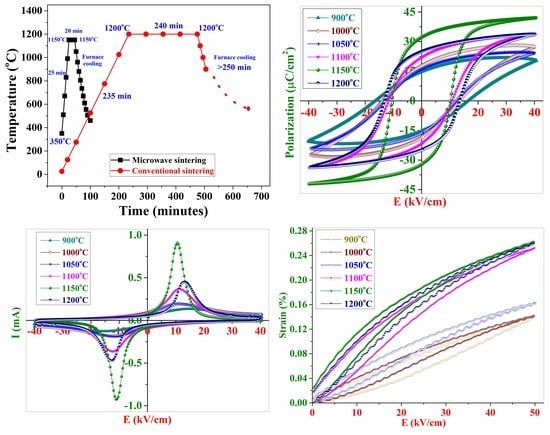
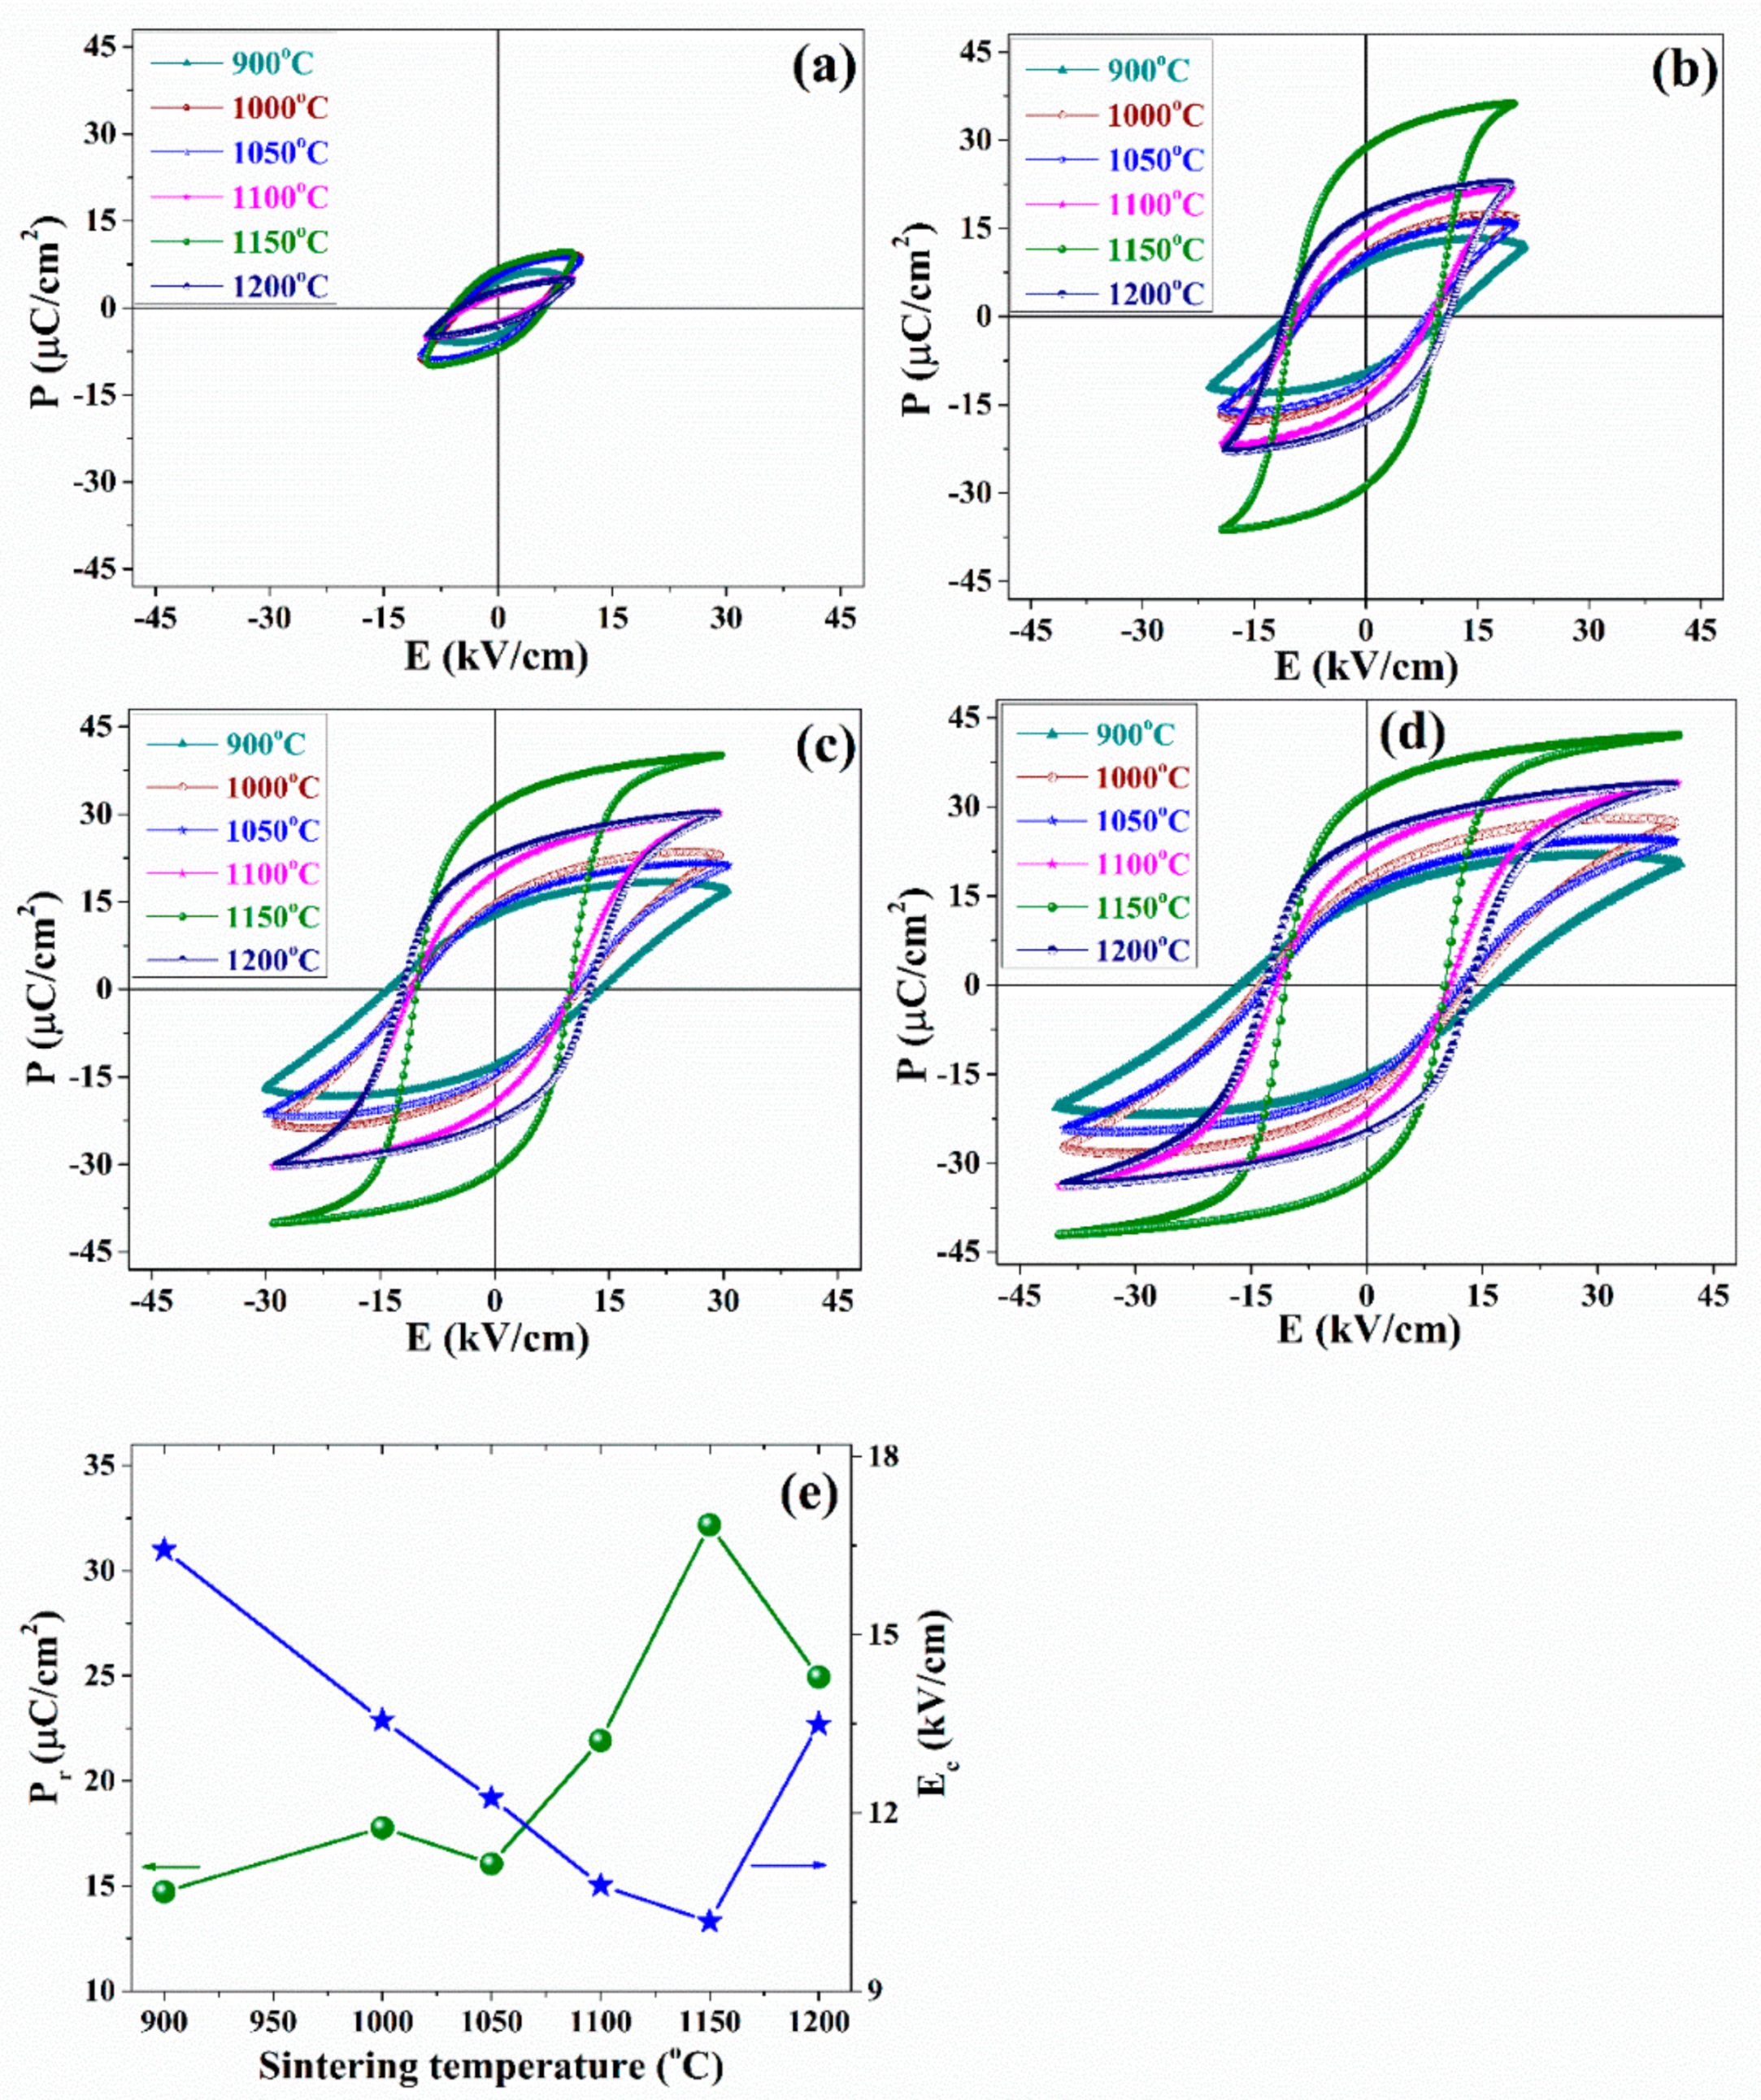
3.2. Polarization Versus Electric Field Ferroelectric Hysteresis Loops

The P-E hysteresis loops of a ferroelectric material are unique and used for the confirmation of the ferroelectric nature of the electroceramics. Figure 3a–d show the P-E loops for the PLZT 8/60/40 ceramics, microwave sintered at various temperatures and measured at an electric field of 10, 20, 30 and 40 kV/cm, respectively. The P-E loops for the PLZT ceramics sintered at 1150 °C show a square loop with sharp edges which indicates the homogeneously distributed uniform grain sizes [43,44]. Other P-E loops for the 900–1100 °C sintered ceramics are not saturated due to the low density of the ceramics. Ferroelectric hysteresis loops (P-E and I-E) are used to calculate the values of Pr and Ec. The actual polarization in the ferroelectric material is always lower than expected values because due to the internal stresses and internal bias electric fields, which affect the domains reorientation and domains back switching. Figure 3e shows the change in Pr (increases) and Ec (decreases) for PLZT 8/60/40 ceramics as a function of microwave sintering temperature. The PLZT ceramic sintered at 1150 °C shows the highest Pr of 32.18 µC/cm2 and lowest Ec of 10.17 kV/cm. Apart from Pr and Ec, the shape of P-E hysteresis loops is also considered as an important parameter to explore the material nature. The sharp edges of P-E loops show that the material is highly resistive. An ideal ferroelectric material shows the square shape ferroelectric P-E hysteresis loop. The positive and negative value of the coercive field and remnant polarization (Ec = −Ec and Pr = −Pr) should be equal. The difference between Ec and −Ec as well as Pr and −Pr values shows that shape of the P-E hysteresis loop is not a square (symmetrical). A high degree of loop squareness is also related to the homogeneous and uniform grains of the ceramics. The squareness (Rsq) of the P-E hysteresis loop can be calculated from Equation (4) [45]
R s q   =   P r P s a t   +   P 1.1 E c P r
where Pr = remnant polarization, Psat = saturation or maximum polarization, P1.1Ec is the polarization, which was measured at 1.1 Ec.
For an ideal P-E hysteresis loop, Rsq is equal to 2.0. The value of Rsq is calculated for the microwave sintered PLZT 8/60/40 ceramics and the highest value of ~1.06 was found for the ceramics sintered at 1150 °C. The normalized value of volume fraction of back switched domains (Vback ~ Psat − Pr), or considered as “switchable domains” (back switched when E = 0) is also calculated and found to be less for the 1150 °C sintered PLZT 8/60/40 ceramics.

3.3. Domain Switching in Current versus Electric Field Loops

Figure 4a–d show the I-E loops of microwave sintered PLZT 8/60/40 ceramics at 10 kV/cm to 40 kV/cm, respectively. When an electric field is applied to FE ceramics, typically the current response came from the linear dielectric response of the ceramics and due to the switching of the domains. At first, when the applied electric field is low, most of the current contribution comes from the dielectric response of the ceramics (Figure 4a). The appearance of a peak signal in the I-E curves, when the applied electric field is ~20 kV/cm, shows that the domain switching is happening inside the materials and also confirms the FE nature of PLZT ceramics (Figure 4b). Later, when the applied electric field is sufficiently high to switch the domains, the current response due to domain switching starts dominating the total current of the ceramics (Figure 4c). The magnitude of the current peak increases with the applied electric field and finally attains saturation. At last, at Emax, then most of the current response is due to switching of the domains with an almost negligible contribution from the dielectric response (Figure 4d). A peak in I-E curves before Emax indicates the switching of domains and the corresponding electric field is considered as Ec. The switching in ferroelectric material takes place by domain nucleation and domain wall movement. The maximum switching current can be described by the following Equation (5) [46,47,48,49,50,51,52]
i max = i e α E
where α is a constant called as the activation field which is considered as threshold field to initiate nucleation, i = (i) E = and E is an applied electric field that decides the domain switching current. With the application of a low electric field, the main contribution in the switching current comes from the nucleation of the domains due to the low domain nucleation rate. On the other hand, the velocity of the domain walls determined the switching of domains at the high applied electric field due to the large rate of nucleation. Both α and i parameters depend upon the temperature and reduce both switching current and time if the material temperature approaches the Curie temperature.
Figure 3d and Figure 4d show the saturated P-E and I-E loops due to the alignment of ferroelectric domains in the direction of the applied electric field. Once the domains start to switch (Figure 4b), the corresponding P-E curve (Figure 3b) shows an improvement in squareness and symmetry in the shape of p-E curves compared to the previous Figure 3a, which is further improved by the application of a higher electric field. Figure 4e shows the switching current (current value at peaks) and leakage current (current value at the maximum electric field) as a function of microwave sintering temperature for PLZT ceramics. It is clear that 1150 °C sintered ceramics show the highest value of domain switching and less leakage current.

3.4. Energy Storage Properties of Microwave-Sintered PLZT 8/60/40 Ceramics

P-E hysteresis loops are used not only to determine the ferroelectric properties but also to calculate the energy storage properties of a ferroelectric capacitor. The shape of the P-E loops which depend upon the switching of domains defines the nature of these materials and decides the use of materials in energy storage applications. The recoverable energy storage density (Wrec) is represented by the area between the y-axis and Pr to Pmax branch of the P-E curve. The energy-loss density (Wloss) of the material is represented by a closed area of the P-E loops and can be calculated by numerical integration. Another important parameter energy efficiency (η) of a FE capacitor is a ratio of Wrec and Wloss. The values of Wrec, Wloss and η of a FE capacitor are calculated from the Equations (6) and (7) [5,33]
W r e c = P r P m a x E   d P
η =   W r e c W r e c + W l o s s
where Pr = remnant polarization, Pmax = maximum polarization and E = applied electric field.
The energy storage density is highly influenced by the polarization (Pr, Pmax) and maximum applied electric field (Emax) or dielectric breakdown strength (DBS). The DBS of the ceramic capacitor depends upon the doping, sintering temperature, microstructure (density, porosity and grain sizes), conductivity and several extrinsic parameters (thickness and area). As per Equation (6), a ceramic capacitor with high DBS value shows high recoverable energy-storage density [53].
Due to the hysteresis losses in the ferroelectric ceramic capacitor, the microwave-sintered PLZT 8/60/40 ceramics show the moderate energy density values. Typical FE ceramics show the square P-E hysteresis loops with a large hysteresis due to the field-dependent reorientation of the ferroelectric domains, resulting in high energy loss and low recoverable energy efficiency. The energy efficiency of the microwave sintered PLZT ferroelectrics depends upon the Wrec and Wloss values. The high value of Wrec and low Wloss is required to achieve high energy-efficiency. Shapes of the P-E loops are seen changing with microwave sintering temperature and their squareness increases, which results in low Wrec. Bulk FE ceramic capacitors always show a lower energy-storage density (but higher than other FE ceramics) due to the relatively low DBS and square P-E loop, however, the high dielectric constant of the FE ceramics is always desirable for the energy-storage applications. The very low energy density of ~1.24 mJ/cm3 with energy efficiency ~45% is also reported for the lead-free BiFeO3 based ceramics [54]. The parameters related to the FE and energy storage properties are listed in Table 3. The energy storage properties of the microwave sintered PLZT 8/60/40 ceramics is compared with other PLZT compositions and shown in Table 4.

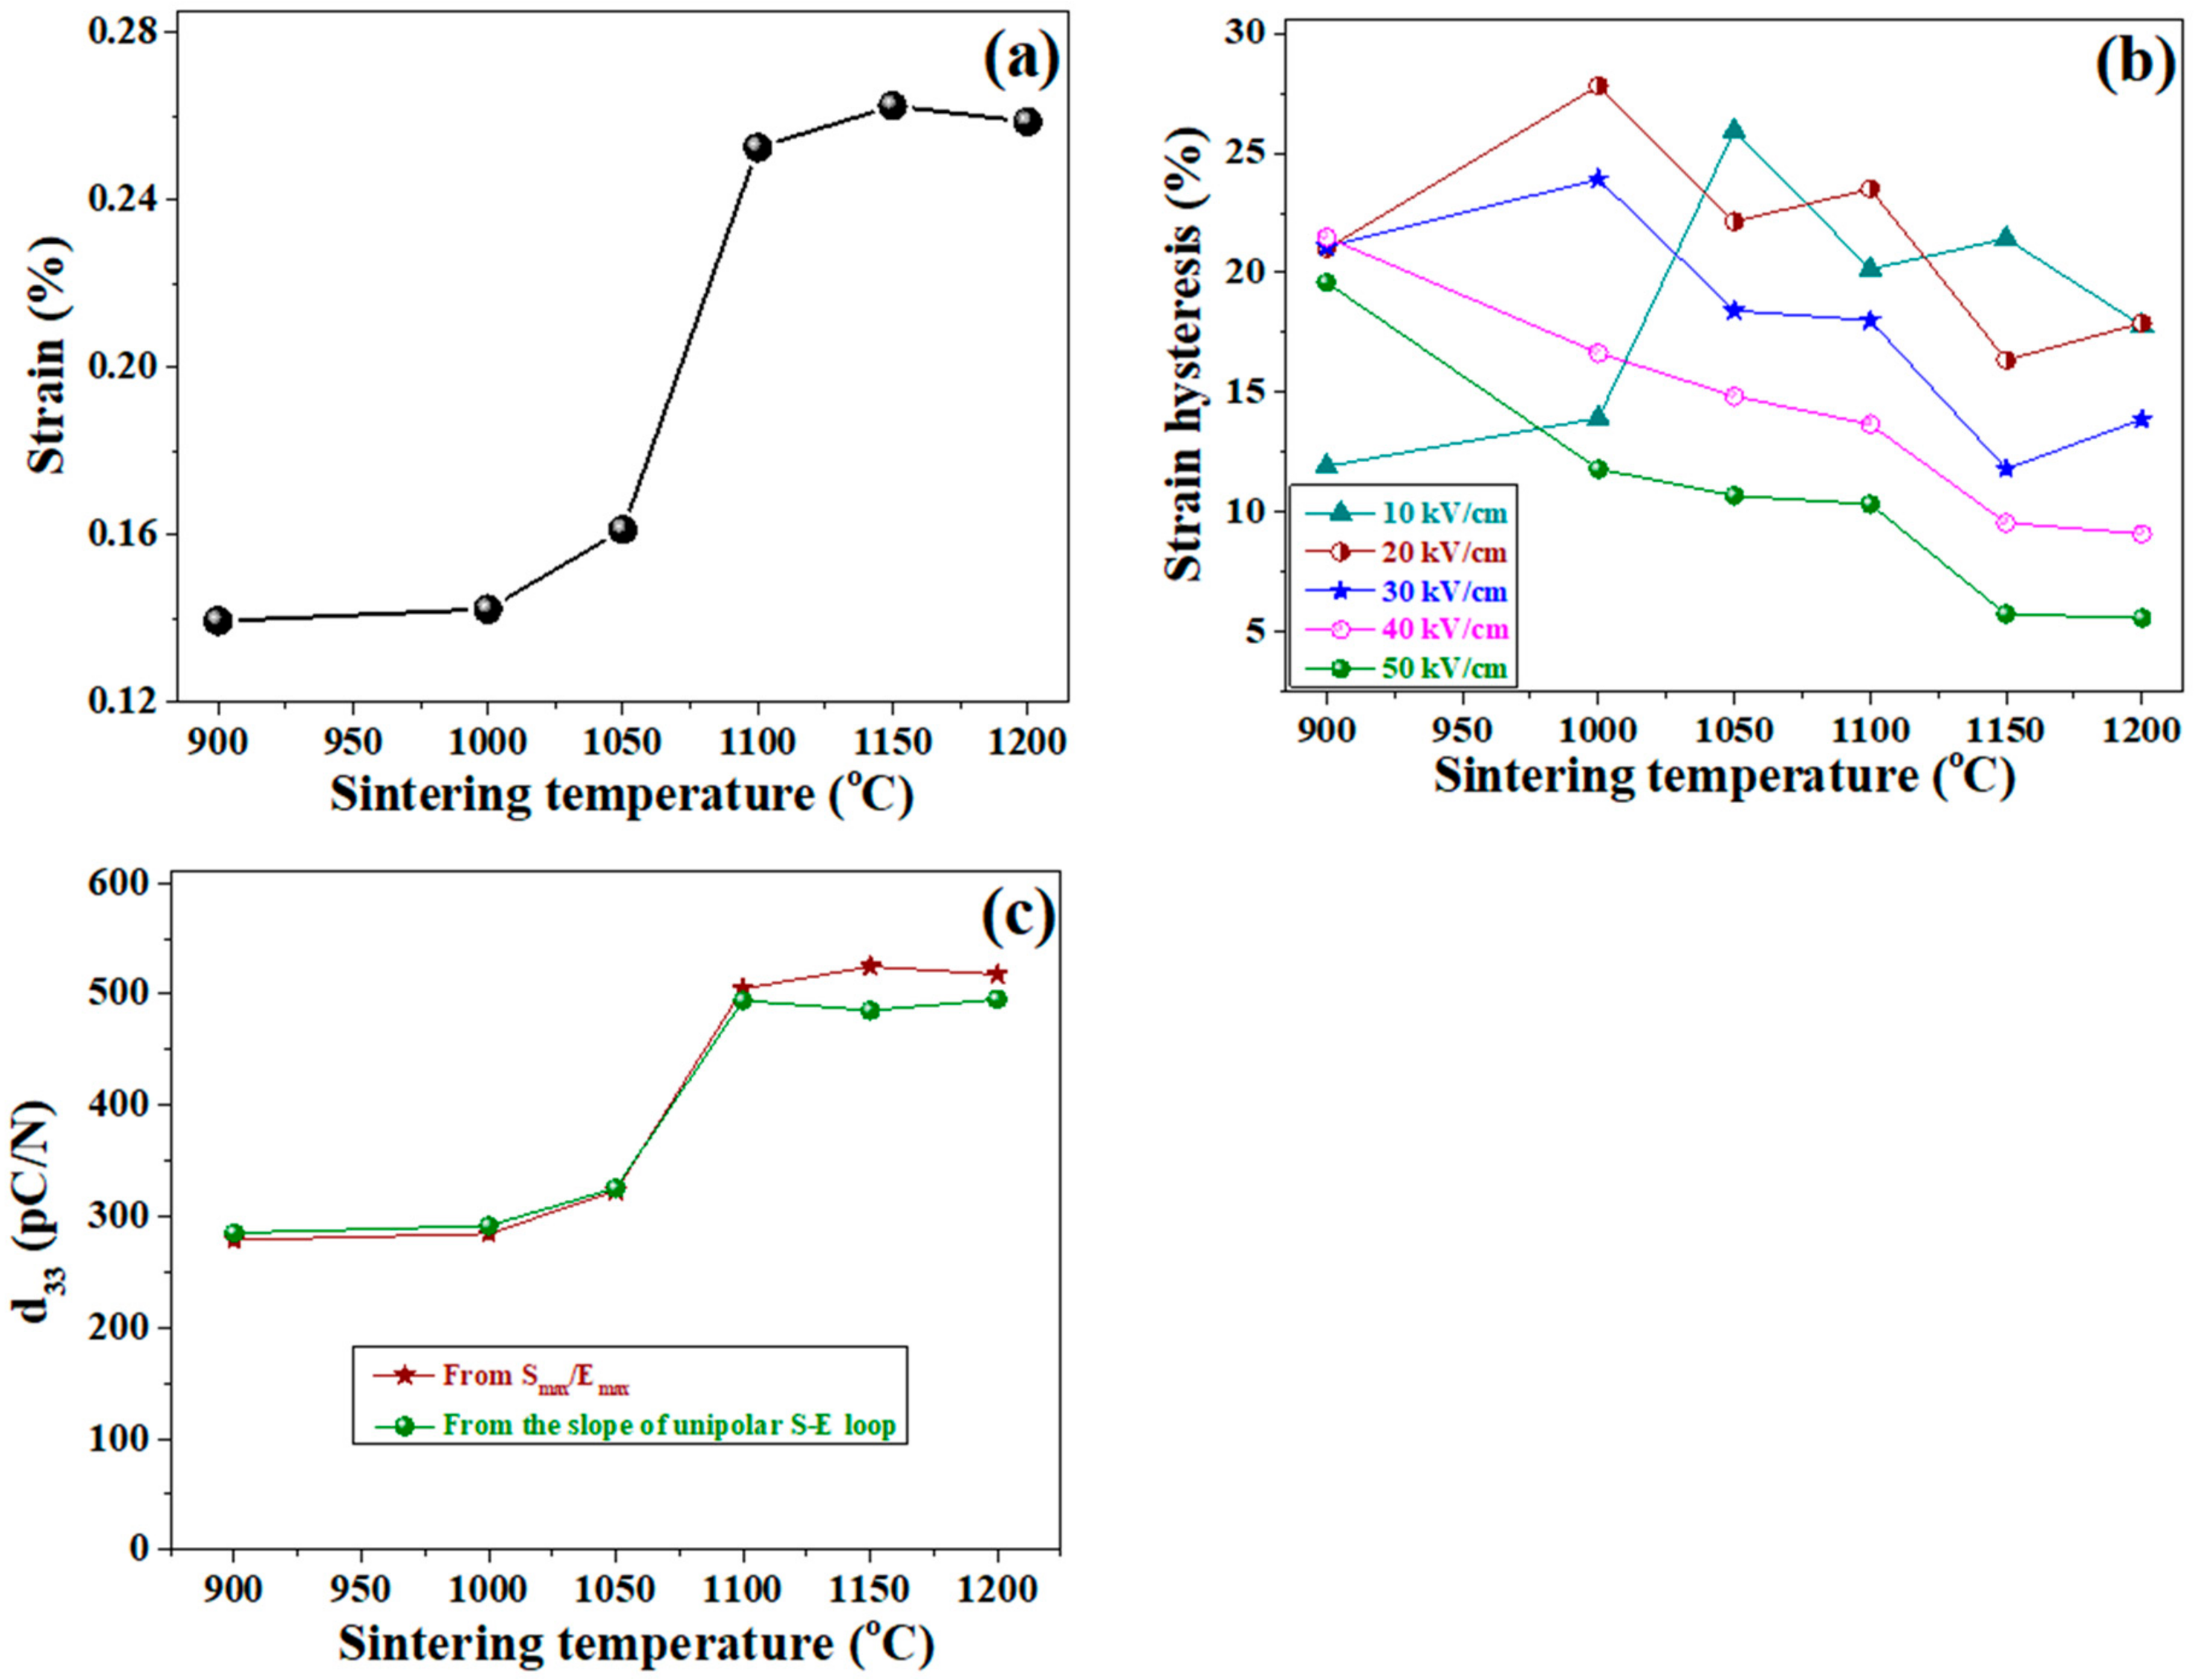
3.5. Strain versus Electric Field (S-E) Hysteresis Loops

In the presence of the applied electric field, piezoelectric materials not only show the polarization and P-E hysteresis loops but also show the strain and S-E hysteresis loops. Generally, two types of S-E loops are reported for piezoelectric ceramics (1) Bipolar S-E hysteresis loops (shape similar as butterfly) used for the domain-switching confirmation (Figure 5a–d) and (2) Unipolar S-E hysteresis loops which are used to calculate piezoelectric charge coefficients (Figure 6a–e). Three types of effects contributes in the butterfly shape of the bipolar S-E loops, converse piezoelectric effect of the lattice, and domain wall switching and movements [46]. Figure 5a–d show the formation of butterfly S-E loops for microwave-sintered PLZT 8/60/40 ceramics measured at the different applied electric fields. At first, the polarization direction and the applied electric field are in the same direction so it shows the electric field-induced strain but when applied electric field direction is reversed then the material shows negative strain. However, a sufficiently large electric field can switch the polarization direction in the same direction which leads to a butterfly shape of the S-E hysteresis loops.
Figure 6 shows the unipolar strain curve for microwave-sintered PLZT 8/60/40 ceramics measured at room temperature. From Figure 6a–e, it is observed that the value of strain increases with an applied electric field since an increasing number of domains align with the field. This alignment of domains saturates at high electric fields and, the strain hysteresis loss (area of the loop) decreases and becomes almost negligible. At first, when the electric field is not high enough to switch the domains, the developed strain is almost linear. Later, when the electric field increases, the domain contribution become more dominant and non-linear strain is also observed. The switching of non-180° domains was present in the FE materials involve a large change in dimensions of the ceramics. In the present case, a maximum unipolar strain of ~0.26% is achieved at a field 50 kV/cm for 1150 °C sintered PLZT 860/40 ceramics, which is higher than the other sintering temperatures which can be explained based on the grain sizes [59].
The grain sizes for the microwave-sintered PLZT ceramics was increased from a submicron to the micron range as the sintering temperature increases from 900 °C to 1200 °C. The effect of fine-grain sizes on the electrical properties is explained based on the internal stress of the electroceramics. The material with smaller grains has a greater number of grain boundaries, which results in the pinning of the domain walls and lower piezoelectric response. In the current work, the highest piezo-response was observed for the sample sintered at 1150 °C due to the uniform grain size and dense microstructure. On the other hand, the sample sintered at 1200 °C, in spite of having the biggest grain size, shows the lower electrical properties due to high lead loss at the higher temperatures. The lead loss results in the creation of oxygen vacancies and lower electrical properties. The width of the domains also depends on the grain size and it decreases with a decrease in the grain size. The relation between grain (g) and domain sizes (d) is given as d~g1/2 [60,61]. Arlt et al. [62] observed that the BaTiO3 ceramics with grain sizes below 0.7 µm, no longer exhibit 90° domains. In a study by Tuttle et al. multiple 90° domain walls were observed only for the grains larger than 1 µm for PZT material [63]. The electric field-induced strain in the ferroelectric material depends upon the 90° domains. The low strain value for the PLZT ceramics, which were microwave-sintered at 900–1050 °C is mostly due to the switching of the fewer number of 90° domains. As the sintering temperature increases the grain size also increases which results not only in an increase of domain size but also in the availability of a greater number of 90° domains and finally in increased strain.
The unipolar S-E curves as shown in Figure 6 were measured using a laser interferometry technique. The laser light was focused on the samples during the application of the applied electric field and the displacement in the sample thickness was measured. The strain of the piezoelectric material not only depends upon the 90° domain wall movements but is also very sensitive to the applied electric field. The ceramics show little change in strain value when the electric field continuously increasing since 90° domain behaviour is different at each point of the applied electric field. This will lead to wave-type patterns in the electric field induces strain curves.
Figure 7a shows the change in the maximum strain of PLZT measured at a field of 50 kV/cm as a function of microwave-sintering temperature. At first, the electric field-induced strain is less (900–1050 °C) due to the low density and small grain size. The temperature more than 1100 °C strain is significantly high and the highest strain was found for the 1150 °C sintered PLZT ceramics. Figure 7b shows the strain hysteresis as a function of microwave sintering temperature at the different applied electric fields for microwave-sintered PLZT ceramics. The strain hysteresis (%) value was calculated from Figure 6 using the following equation:
S t r a i n   h y s t e r e s i s % =   Δ x x m a x × 100
where xmax is a maximum strain in the specimen subjected to the maximum applied field, Δx is the difference between the strain values in both directions at ½Emax field. Both directions are related to (1) an increase in strain value with an applied electric field and then (2) after reaching the saturation point if the electric field is reduced, the strain will also reduce with a certain amount of hysteresis due to domain wall movement. The difference Δx is calculated at ½Emax = 25 kV/cm.
The strain hysteresis value for the PLZT ceramics (sintered at 1150 °C) was found to be ~5% at a maximum applied field. The strain values of ceramics show a good DBS. The piezoelectric charge coefficient (d33) for the poled PLZT ceramics, microwave sintered at 1150 °C, was measured using the d33 meter (direct method) and found to be ~575 pC/N. In a direct method, a variable force is applied to the material and the generated charge was measured. The unipolar S-E curves also can be used as an indirect method to calculate the low and high field piezoelectric charge coefficient denoted as d33 and d 33 (Smax/Emax), respectively (Figure 7c). In unipolar S-E curves, the slope of the S-E hysteresis loop in a lower electric field region represents an average d33. The low and high field d33 parameters which were calculated from the unipolar S-E loops has their unit in pm/V, since displacement (pm) is divided by the voltage (V). The parameters related with the S-E hysteresis loops are listed in Table 5. The properties of microwave-sintered PLZT ceramics are compared with the conventional sintered ceramics and shown in Table 6. The properties of the microwave-sintered PLZT 8/60/40 ceramics are comparable with the previously studied conventionally sintered ceramics [34].

4. Conclusions

PLZT 8/60/40 ceramics were fabricated using high-energy mechanical milling and microwave sintering for low lead loss and a cleaner environment. With the help of this study, not only was the processing temperature successfully reduced to 1150 °C (~100 °C less) but also sintering time was decreased to 20 min (~220 min less) without adding excess PbO. The detailed investigation of temperature-dependent dielectric properties, P-E hysteresis loops, and bipolar and unipolar S-E hysteresis loops shows that the PLZT 8/60/40 ceramics which were microwave-sintered at 1150 °C show optimized dielectric, ferroelectric and piezoelectric properties (Pr~32.18 μC/cm2, Imax~0.91 mA, low Ec~10.17 kV/cm, Smax~0.26%, maximum d33~495 pm/V, maximum Smax/Emax~517 pm/V and minimum strain hysteresis loss ~5.8%). The domain switching in P-E, I-E and bipolar S-E loops confirms the ferroelectric nature of the PLZT 8/60/40 ceramics. The investigation of energy-storage properties shows that the microwave-sintered PLZT 8/60/40 ferroelectric ceramic can be used as an energy-storage capacitor.

Author Contributions

Conceptualization, A.K., K.C.J.R. and A.R.J.; Data curation, A.K.; Formal analysis, A.K. and S.R.E.; Funding acquisition, A.R.J. and J.R.; Investigation, A.K. and S.R.E.; Methodology, A.K.; Resources, A.R.J.; Supervision, K.C.J.R., and A.R.J.; Validation, K.C.J.R. and A.R.J.; Writing—original draft, A.K.; Writing—review & editing, A.K., K.C.J.R., J.R. and A.R.J. All authors have read and agreed to the published version of the manuscript.

Funding

The authors would like to thank DRDO for the financial support to carry out this work. J. Ryu acknowledges this work was supported by the National Research Foundation of Korea (NRF-2019R1A2B5B01070100).

Acknowledgments

The authors would like to express their gratitude to the Director DMRL for his interest in this work. The authors thank Atul Thakre, Yeungnam University, South Korea for the technical inputs provided while writing this manuscript.

Conflicts of Interest

The authors declare no conflict of interest.

References

  1. Haertling, G.H. Ferroelectric ceramics: History and technology. J. Am. Ceram. Soc. 1999, 82, 797–818. [Google Scholar] [CrossRef]
  2. Uchino, K. Ferroelectric Devices; Marcel Dekker Inc.: New York, NY, USA, 2000. [Google Scholar]
  3. Uchino, K. Materials issues in design and performance of piezoelectric actuators: An overview. Acta Mater. 1998, 46, 3745–3753. [Google Scholar] [CrossRef]
  4. Hu, Z.; Ma, B.; Liu, S.; Narayanan, M.; Balachandran, U. Relaxor behavior and energy storage performance of ferroelectric PLZT thin films with different Zr/Ti ratios. Ceram. Int. 2014, 40, 557–562. [Google Scholar] [CrossRef]
  5. Kumar, A.; Kim, S.H.; Peddigari, M.; Jeong, D.-H.; Hwang, G.-T.; Ryu, J. High energy storage properties and electrical field stability of energy efficiency of (Pb0.89La0.11)(Zr0.70Ti0.30)0.9725O3 relaxor ferroelectric ceramics. Electron. Mater. Lett. 2019, 15, 323–330. [Google Scholar] [CrossRef]
  6. Thakre, A.; Kumar, A.; Jeong, D.Y.; Hwang, G.T.; Yoon, W.H.; Lee, H.Y.; Ryu, J. Enhanced mechanical quality factor of 32 mode Mn doped 71Pb(Mg1/3Nb2/3)O3–29PbZrTiO3 piezoelectric single crystals. Electron. Mater. Lett. 2020, 16, 156–163. [Google Scholar] [CrossRef]
  7. Lu, Y.; Chen, J.; Cheng, Z.; Zhang, S. The PZT/Ni unimorph magnetoelectric energy harvester for wireless sensing applications. Energy Convers. Manag. 2019, 200, 112084. [Google Scholar] [CrossRef]
  8. Maiwa, H.; Jia, T.; Kimura, H. Energy harvesting using PLZT and lead-free ceramics and their piezoelectric properties on the nano-scale. Ferroelectrics 2015, 475, 71–81. [Google Scholar] [CrossRef]
  9. Gupta, R.; Tomar, M.; Kumar, A.; Gupta, V. Performance of magnetoelectric PZT/Ni multiferroic system for energy harvesting application. Smart Mater. Struct. 2017, 26, 035002. [Google Scholar] [CrossRef]
  10. Xu, T.B.; Siochi, E.J.; Kang, J.H.; Zuo, L.; Zhou, W.; Tang, X.; Jiang, X. Energy harvesting using a PZT ceramic multilayer stack. Smart Mater. Struct. 2013, 22, 065015. [Google Scholar] [CrossRef] [Green Version]
  11. Maiwa, H. Thermal energy harvesting of PLZT and BaTiO3 ceramics using pyroelectric effects. In Nanoscale Ferroelectric-Multiferroic Materials for Energy Harvesting Applications; Elsevier: Amsterdam, The Netherlands, 2019; pp. 217–229. ISBN 9780128145005. [Google Scholar]
  12. Lee, F.Y.; Jo, H.R.; Lynch, C.S.; Pilon, L. Pyroelectric energy conversion using PLZT ceramics and the ferroelectric-ergodic relaxor phase transition. Smart Mater. Struct. 2013, 22, 025038. [Google Scholar] [CrossRef]
  13. James, A.R.; Kumar, A. Development of PLZT electroceramics with ultrahigh piezoelectric properties by a novel material engineering approach. In Handbook of Advanced Ceramics and Composites; Mahajan, Y.R., Johnson, R., Eds.; Springer International Publishing: Cham, Switzerland, 2019; pp. 215–250. [Google Scholar]
  14. Kumar, A.; Thakre, A.; Jeong, D.-Y.; Ryu, J. Prospects and challenges of the electrocaloric phenomenon in ferroelectric ceramics. J. Mater. Chem. C 2019, 7, 6836–6859. [Google Scholar] [CrossRef]
  15. Liu, K.; Wang, W.; Liu, Q.; Song, L.; Guo, Y.W.; Ye, F. Photostriction properties of PLZT (4/52/48) ceramics sintered by SPS. Ceram. Int. 2019, 45, 2097–2102. [Google Scholar] [CrossRef]
  16. Xu, Z.; Zeng, X.; Cao, Z.; Ling, L.; Qiu, P.; He, X. Effects of barium substitution on the optical and electrical properties of PLZT transparent electro-optical ceramics. Ceram. Int. 2019, 45, 17890–17897. [Google Scholar] [CrossRef]
  17. Pérez-Tomás, A.; Mingorance, A.; Tanenbaum, D.; Lira-Cantú, M. Metal Oxides in photovoltaics: All-oxide, ferroic, and perovskite solar cells. Futur. Semicond. Oxides Next Gener. Sol. Cells 2018, 267–356. [Google Scholar]
  18. Ichiki, M.; Morikawa, Y.; Nakada, T.; Maeda, R. Photovoltaic properties of lead lanthanum zirconate titanate ceramics in a layered film structure design. Ceram. Int. 2004, 30, 1831–1834. [Google Scholar] [CrossRef]
  19. Thakre, A.; Kumar, A.; Song, H.-C.; Jeong, D.-Y.; Ryu, J. Pyroelectric energy conversion and its applications—Flexible energy harvesters and sensors. Sensors 2019, 19, 2170. [Google Scholar] [CrossRef] [Green Version]
  20. Kong, L.; Zhu, W.; Tan, O. Preparation and characterization of Pb(Zr0.52Ti0.48)O3 ceramics from high-energy ball milling powders. Mater. Lett. 2000, 42, 232–239. [Google Scholar] [CrossRef]
  21. Kong, L.; Ma, J.; Zhu, W.; Tan, O. Preparation and characterization of PLZT ceramics using high-energy ball milling. J. Alloys Compd. 2001, 322, 290–297. [Google Scholar] [CrossRef]
  22. Singhal, C.; Murtaza, Q. Parvej microwave sintering of advanced composites materials: A review. Mater. Today Proc. 2018, 5, 24287–24298. [Google Scholar] [CrossRef]
  23. Janney, M.A.; Kimrey, H.D. Diffusion-controlled processes in microwave-fired oxide ceramics. Mrs. Proc. 1990, 189, 215. [Google Scholar] [CrossRef] [Green Version]
  24. Zuo, F.; Saunier, S.; Marinel, S.; Chanin-Lambert, P.; Peillon, N.; Goeuriot, D. Investigation of the mechanism(s) controlling microwave sintering of α-alumina: Influence of the powder parameters on the grain growth, thermodynamics and densification kinetics. J. Eur. Ceram. Soc. 2015, 35, 959–970. [Google Scholar] [CrossRef]
  25. Gonçalves, M.D.; Souza, F.L.; Longo, E.; Leite, E.R.; Camargo, E.R. Dielectric characterization of microwave sintered lead zirconate titanate ceramics. Ceram. Int. 2016, 42, 14423–14430. [Google Scholar] [CrossRef] [Green Version]
  26. Gonçalves, M.D.; Camargo, E.R. Lanthanum-doped PZT synthesized by the oxidant peroxide method and sintered by conventional and microwave routes. Ceram. Int. 2017, 43, 3004–3009. [Google Scholar] [CrossRef]
  27. Fernandez Perdomo, C.P.; Kiminami, R.H.G.A.; Garcia, D. Microwave assisted sintering of nanocristalline PMN-PT/CoFe2O4 prepared by rapid one pot pechini synthesis: Dielectric and magnetoelectric characteristics. Ceram. Int. 2019, 45, 7906–7915. [Google Scholar] [CrossRef]
  28. Fernández, C.P.; Zabotto, F.L.; Garcia, D.; Kiminami, R.H.G.A. In situ sol–gel co-synthesis under controlled pH and microwave sintering of PZT/CoFe2O4 magnetoelectric composite ceramics. Ceram. Int. 2016, 42, 3239–3249. [Google Scholar] [CrossRef]
  29. Cai, E.; Liu, Q.; Zeng, F.; Wang, Y.; Xue, A. A comparative study of lead-free (Ba0.85Ca0.15)(Ti0.9Zr0.08Sn0.02)O3 ceramics prepared by conventional sintering and microwave sintering techniques. Ceram. Int. 2018, 44, 788–798. [Google Scholar] [CrossRef]
  30. Chandrasekhar, M.; Kumar, P. Microwave sintered sol–gel derived BaTiO3 and Ba0.95La0.05TiO3 ceramic samples for capacitor applications. Ceram. Int. 2016, 42, 10587–10592. [Google Scholar]
  31. Rani, R.; Kumar, P.; Singh, S.; Juneja, J.K.; Raina, K.K.; Prakash, C. Ferroelectric properties of microwave processed PZT-NiZn ferrite composites. Integr. Ferroelectr. 2010, 122, 45–51. [Google Scholar] [CrossRef]
  32. Vaidhyanathan, B.; Singh, A.P.; Agrawal, D.K.; Shrout, T.R.; Roy, R.; Ganguly, S. Microwave effects in lead zirconium titanate synthesis: Enhanced kinetics and changed mechanisms. J. Am. Ceram. Soc. 2004, 84, 1197–1202. [Google Scholar] [CrossRef]
  33. Kumar, A.; Yoon, J.Y.; Thakre, A.; Peddigari, M.; Jeong, D.-Y.; Kong, Y.-M.; Ryu, J. Dielectric, ferroelectric, energy storage, and pyroelectric properties of Mn-doped (Pb0.93La0.07)(Zr0.82Ti0.18)O3 anti-ferroelectric ceramics. J. Korean Ceram. Soc. 2019, 56, 412–420. [Google Scholar] [CrossRef] [Green Version]
  34. Kumar, A.; Bhanu Prasad, V.V.; James Raju, K.C.; James, A.R. Ultra high strain properties of lanthanum substituted PZT electro-ceramics prepared via mechanical activation. J. Alloys Compd. 2014, 599, 53–59. [Google Scholar] [CrossRef]
  35. Kumar, A.; Reddy Emani, S.; Bhanu Prasad, V.V.; James Raju, K.C.; James, A.R. Microwave sintering of fine grained PLZT 8/60/40 ceramics prepared via high energy mechanical milling. J. Eur. Ceram. Soc. 2016, 36, 2505–2511. [Google Scholar] [CrossRef]
  36. Kumar, A.; Bhanu Prasad, V.V.; James Raju, K.C.; James, A.R. Optimization of poling parameters of mechanically processed PLZT 8/60/40 ceramics based on dielectric and piezoelectric studies. Eur. Phys. J. B 2015, 88, 287. [Google Scholar] [CrossRef]
  37. Kumar, A.; Bhanu Prasad, V.V.; James Raju, K.C.; James, A.R. Poling electric field dependent domain switching and piezoelectric properties of mechanically activated (Pb0.92La0.08)(Zr0.60Ti0.40)O3ceramics. J. Mater. Sci. Mater. Electron. 2015, 26, 3757–3765. [Google Scholar] [CrossRef]
  38. Rajesh, S.; Murali, K.P.; Rajani, K.V.; Ratheesh, R. SrTiO3-filled PTFE composite laminates for microwave substrate applications. Int. J. Appl. Ceram. Technol. 2009, 6, 553–561. [Google Scholar] [CrossRef]
  39. Penn, S.J.; Alford, N.M.; Templeton, A.; Wang, X.; Xu, M.; Reece, M.; Schrapel, K. Effect of porosity and grain size on the microwave dielectric properties of sintered alumina. J. Am. Ceram. Soc. 2005, 80, 1885–1888. [Google Scholar] [CrossRef]
  40. Sindam, B.; James Raju, K.C. Influence of sintering temperature on microwave dielectric properties, structure and lattice modes of Ba(Zn1/3Ta2/3)O3 resonators. J. Mater. Sci. Mater. Electron. 2015, 26, 3997–4004. [Google Scholar] [CrossRef]
  41. Uchino, K.; Nomura, S. Critical exponents of the dielectric constants in diffused-phase-transition crystals. Ferroelectrics 1982, 44, 55–61. [Google Scholar] [CrossRef]
  42. Kumar, A.; James Raju, K.C.; James, A.R. Diffuse phase transition in mechanically activated (Pb1−xLax)(Zr0.60Ti0.40)O3 electro-ceramics. J. Mater. Sci. Mater. Electron. 2017, 28, 13928–13936. [Google Scholar] [CrossRef]
  43. Jin, L.W.; Su, Y. Effect of thermomechanical coupling on the scaling behavior of low-frequency hysteresis of PbZr0.52Ti0.48O3 ceramics. Electron. Mater. Lett. 2016, 12, 371–375. [Google Scholar] [CrossRef]
  44. Namsar, O.; Pojprapai, S.; Watcharapasorn, A.; Jiansirisomboon, S. Polarization fatigue in ferroelectric Pb(Zr0.52Ti0.48)O3-SrBi2Nb2O9 ceramics. Electron. Mater. Lett. 2015, 11, 881–889. [Google Scholar] [CrossRef]
  45. Tian, Y.; Chao, X.; Wei, L.; Liang, P.; Yang, Z. Phase transition behavior and electrical properties of lead-free (Ba1−xCax)(Zr0.1Ti0.9)O3 piezoelectric ceramics. J. Appl. Phys. 2013, 113, 184107. [Google Scholar] [CrossRef]
  46. Damjanovic, D. Ferroelectric, dielectric and piezoelectric properties of ferroelectric thin films and ceramics. Rep. Prog. Phys. 1998, 61, 1267–1324. [Google Scholar] [CrossRef] [Green Version]
  47. Scott, J.F.; Kammerdiner, L.; Parris, M.; Traynor, S.; Ottenbacher, V.; Shawabkeh, A.; Oliver, W.F. Switching kinetics of lead zirconate titanate submicron thin-film memories. J. Appl. Phys. 1988, 64, 787–792. [Google Scholar] [CrossRef]
  48. Jiang, A.Q.; Lee, H.J.; Hwang, C.S.; Scott, J.F. Sub-picosecond processes of ferroelectric domain switching from field and temperature experiments. Adv. Funct. Mater. 2012, 22, 192–199. [Google Scholar] [CrossRef]
  49. Merz, W.J. Domain formation and domain wall motions in ferroelectric BaTiO3, single crystals. Phys. Rev. 1954, 95, 690–698. [Google Scholar] [CrossRef]
  50. Kamel, T.M.; Kools, F.X.N.M.; de With, G. Poling of soft piezoceramic PZT. J. Eur. Ceram. Soc. 2007, 27, 2471–2479. [Google Scholar] [CrossRef]
  51. Fatuzzo, E.; Merz, W.J. Switching mechanism in triglycine sulfate and other ferroelectrics. Phys. Rev. 1959, 116, 61–68. [Google Scholar] [CrossRef]
  52. Pulvari, C.F.; Kuebler, W. Phenomenological theory of polarization reversal in BaTiO3 single crystals. J. Appl. Phys. 1958, 29, 1315–1321. [Google Scholar] [CrossRef]
  53. Li, F.; Zhai, J.; Shen, B.; Liu, X.; Zeng, H. Simultaneously high-energy storage density and responsivity in quasi-hysteresis-free Mn-doped Bi0.5Na0.5TiO3-BaTiO3-(Sr0.7Bi0.20.1)TiO3 ergodic relaxor ceramics. Mater. Res. Lett. 2018, 6, 345–352. [Google Scholar] [CrossRef] [Green Version]
  54. Arif, S.; Saba, S.; Mustafa, G.M.; Akhtar, M.; Saleem, M.; Riaz, S.; Atiq, S. Analysis of recoverable and energy loss density mediated by Ni/Cr co-doping in BiFeO3. J. Mater. Sci. Mater. Electron. 2020, 31, 14775–14783. [Google Scholar] [CrossRef]
  55. Samanta, S.; Sankaranarayanan, V.; Sethupathi, K. Effect of Nb and Fe co-doping on microstructure, dielectric response, ferroelectricity and energy storage density of PLZT. J. Mater. Sci. Mater. Electron. 2018, 29, 20383–20394. [Google Scholar] [CrossRef]
  56. Samanta, S.; Sankaranarayanan, V.; Sethupathi, K. Temperature dependence of energy storage density and differential permittivity and bandgap study of relaxor (Pb,La)Zr0.65Ti0.35O3. Integr. Ferroelectr. 2019, 202, 153–162. [Google Scholar] [CrossRef]
  57. Ciuchi, I.V.; Mitoseriu, L.; Galassi, C. Antiferroelectric to ferroelectric crossover and energy storage properties of (Pb1− xLax)(Zr0.90Ti0.10)1−x/4O3 (0.02 ≤ x ≤ 0.04) ceramics. J. Am. Ceram. Soc. 2016, 99, 2382–2387. [Google Scholar] [CrossRef]
  58. Kumar, A.; James Raju, K.C.; Ryu, J.; James, A.R. Composition dependent ferro-piezo hysteresis loops and energy density properties of mechanically activated (Pb1−xLax)(Zr0.60Ti0.40)O3 ceramics. Appl. Phys. A Mater. Sci. Process. 2020, 126, 1–10. [Google Scholar] [CrossRef]
  59. Eriksson, M.; Yan, H.; Viola, G.; Ning, H.; Gruner, D.; Nygren, M.; Reece, M.J.; Shen, Z. Ferroelectric domain structures and electrical properties of fine-grained lead-free sodium potassium niobate ceramics. J. Am. Ceram. Soc. 2011, 94, 3391–3396. [Google Scholar] [CrossRef]
  60. Hoffmann, M.J.; Hammer, M.; Endriss, A.; Lupascu, D.C. Correlation between microstructure, strain behavior, and acoustic emission of soft PZT ceramics. Acta Mater. 2001, 49, 1301–1310. [Google Scholar] [CrossRef]
  61. Cao, W.; Randall, C.A. Grain size and domain size relations in bulk ceramic ferroelectric materials. J. Phys. Chem. Solids 1996, 57, 1499–1505. [Google Scholar] [CrossRef]
  62. Arlt, G.; Hennings, D.; De With, G. Dielectric properties of fine-grained barium titanate ceramics. J. Appl. Phys. 1985, 58, 1619–1625. [Google Scholar] [CrossRef] [Green Version]
  63. Tuttle, B.A.; Garino, T.J.; Voigt, J.A.; Headley, T.J.; Dimos, D.; Eatough, M.O. Relationships between ferroelectric 90° domain formation and electrical properties of chemically prepared Pb(Zr,Ti)O3 thin films. In Proceedings of the NATO Advanced Research Workshop on Science and Technology of Electroceramic Thin Films, Villa Del Mare, Italy, 20–24 June 1994. [Google Scholar]
  64. Jung, S.-C.; Park, H.-B.; Kim, J.; Kim, K.; Kim, S.-J. Structure and electric properties of PZT ceramics substituted by La and Nd. J. Korean Ceram. Soc. 1994, 31, 155–160. [Google Scholar]
  65. Dutta, S.; Choudhary, R.N.; Sinha, P. Structural, dielectric and electrical properties of Al+3-modified PLZT ceramics. Mater. Lett. 2004, 58, 2735–2740. [Google Scholar] [CrossRef]
  66. Dutta, S.; Choudhary, R.N.P.; Sinha, P.K. Structural, dielectric and piezoelectric properties of aluminium doped PLZT ceramics prepared by sol–gel route. J. Alloys Compd. 2007, 430, 344–349. [Google Scholar] [CrossRef]
  67. Shannigrahi, S.R.; Tay, F.E.H.; Yao, K.; Choudhary, R.N.P. Effect of rare earth (La, Nd, Sm, Eu, Gd, Dy, Er and Yb) ion substitutions on the microstructural and electrical properties of sol-gel grown PZT ceramics. J. Eur. Ceram. Soc. 2004, 24, 163–170. [Google Scholar] [CrossRef]
  68. Thakur, O.P.; Prakash, C. Structural, dielectric and piezoelectric properties of PLZT (x/60/40) ceramics. Integr. Ferroelectr. 2010, 122, 100–107. [Google Scholar] [CrossRef]
  69. García-Zaldívar, O.; Peláiz-Barranco, A.; Guerra, J.D.S.; Mendoza, M.E.; Calderón-Piñar, F.; Hall, D.A. Influence of the A and B vacancies on the dielectric and structural properties of the PLZT 8/60/40 ferroelectric ceramic system. Phys. B Condens. Matter 2011, 406, 1622–1626. [Google Scholar] [CrossRef]
  70. Shannigrahi, S.R.; Choudhary, R.N.P. Structural and dielectric properties of Sol-Gel derived PLZT (x/60/40). J. Electroceramics 2000, 5, 201–209. [Google Scholar] [CrossRef]
  71. Somwan, S.; Funsueb, N.; Limpichaipanit, A.; Ngamjarurojana, A. Influence of low external magnetic field on electric field induced strain behavior of 9/70/30, 9/65/35 and 9/60/40 PLZT ceramics. Ceram. Int. 2016, 42, 13223–13231. [Google Scholar] [CrossRef]
Figure 1. Schematic representation of microwave and conventional sintering of PLZT 8/60/40 ceramics at 1150 °C and 1200 °C, respectively [34,35].
Energies 13 06457 g001
Figure 2. (a) Dielectric constant and loss vs. temperature curves for PLZT 8/60/40 ceramics sintered at different temperatures. (b) Change in Tm and the value of dielectric maxima as a function of microwave sintering temperature. The parameters are measured at 1 kHz.
Energies 13 06457 g002
Figure 3. Evolution of polarization vs. electric field (P-E) hysteresis curves at an applied electric field of (a) 10 kV/cm, (b) 20 kV/cm, (c) 30 kV/cm and (d) 40 kV/cm respectively for the microwave sintered PLZT 8/60/40 unpoled ceramic sample at 1 Hz and 25 °C. (e) Change in Pr and Ec as a function of microwave sintering temperature, measured at 40 kV/cm.
Energies 13 06457 g003
Figure 4. Current vs. electric field (I-E) curves for the microwave sintered PLZT 8/60/40 ceramics measured at different electric fields (a) 10 kV/cm, (b) 20 kV/cm, (c) 30 kV/cm and (d) 40 kV/cm, 1 Hz and 25 °C. (e) Switching current (corresponding to current peaks) and leakage current (current at Emax) vs. sintering temperature graphs for microwave sintered PLZT ceramics, measured at 40 kV/cm. The inset of Figure (a) shows the zoomed-in image of the I-E curves.
Energies 13 06457 g004
Figure 5. Bipolar strain vs. electric field (S-E) hysteresis curves measured at (a) 10 kV/cm, (b) 20 kV/cm, (c) 30 kV/cm and (d) 40 kV/cm, respectively, for the microwave-sintered PLZT 8/60/40 ceramics, 1 Hz and 25 °C. The inset of Figure (a) shows the zoomed-in image of the bipolar S-E hysteresis loops.
Energies 13 06457 g005
Figure 6. Unipolar S-E hysteresis curves measured at (a) 10 kV/cm, (b) 20 kV/cm, (c) 30 kV/cm, (d) 40 kV/cm and (e) 50 kV/cm, respectively, for the microwave-sintered PLZT 8/60/40 ceramics, 1 Hz and 25 °C.
Energies 13 06457 g006
Figure 7. (a) Maximum strain and (b) strain hysteresis vs. sintering temperature curve for microwave-sintered PLZT 8/60/40 ceramics measured at 50 kV/cm. (c) Change in d33 calculated from the slope of the S-E curve and by dividing maximum displacement and maximum field vs. temperature curve at 50 kV/cm.
Energies 13 06457 g007
Table 1. Microstructural and dielectric properties of microwave sintered PLZT 8/60/40 ceramics, measured at 1 kHz, room temperature [35].
Sintering Temperature (°C)Grain Size (nm)ρ (gm/cm3)ρ (%)εr at RTεm at RT
9004856.7584.3912591644
10005496.8485.4516182070
10506067.0187.5616822068
11007267.6195.1719222072
115012107.9699.4621002117
120015407.5093.7616971872
Table 2. Temperature-dependent dielectric properties of microwave sintered PLZT 8/60/40 ceramics measured and calculated at 1 kHz.
900 °C1000 °C1050 °C1100 °C1150 °C1200 °C
Tm(°C)272261264235235217
εr at Tm275321003950641082607880
ΔTdiff (°C)834336273028
Tcw (°C)355338357344370366
ΔTm (°C)837793109135149
Table 3. Ferroelectric and energy storage properties of microwave-sintered PLZT 8/60/40 ceramics measured at 40 kV/cm.
Sintering Temperature (°C)Pr (μC/cm2)Ec (kV/cm)Imax (mA)I at Emax (μA)Wrec (mJ/cm3)η (%)
90014.7316.430.132770.686010.60
100017.7813.560.187971.4310715.47
105016.0612.250.198150.349015.76
110021.9110.780.367722.8315324.50
115032.1810.170.907413.6312319.67
120024.9413.490.451231.8011716.84
Table 4. Comparison of energy storage properties of microwave-sintered PLZT 8/60/40 ceramics and other lead-based ferroelectric PLZT compositions.
S. No.CeramicsSintering Temperature (°C)/timeWrec (mJ/cm3)η (%)Ref.
1(Pb0.92La0.08) (Zr0.60Ti0.40) O31100/20 min15324.50This study
2(Pb0.92La0.08) (Zr0.60Ti0.40) O31150/20 min12319.67This study
3Pb0.97La0.02(Zr0.52Ti0.48) O31200/45 min5924.00[55]
4Pb0.92La0.08(Zr0.60Ti0.40)3.96 (Nb0.5Fe0.5)0.04 O31200/45 min13428.00[55]
5Pb0.92La0.08(Zr0.60Ti0.40)3.84 (Nb0.5Fe0.5)0.16O31200/45 min380.14[55]
6(Pb0.895La0.07) (Zr0.65Ti0.35) O31200/45 min4121.71[56]
7(Pb0.865La0.09) (Zr0.60Ti0.40) O31200/45 min5531.28[56]
8(Pb0.98La0.02) (Zr0.90Ti0.10) O31250/240 min76077.00[57]
9(Pb0.92La0.08) (Zr0.60Ti0.40) O31200/240 min12022.11[58]
Table 5. Piezoelectric properties of microwave sintered PLZT 8/60/40 ceramics measured at 50 kV/cm.
Sintering Temperature (°C)Strain (%)Strain Hysteresis (%)d33 (pm/V)Smax/Emax (pm/V)
9000.14019.60285279
10000.14211.80292285
10500.16110.70326323
11000.25210.34494505
11500.2625.74485525
12000.2595.58495518
Table 6. Comparison between conventional and microwave-sintered PLZT 8/60/40 ceramics. The value of εr and tanδ is reported at 1 kHz. The data reported in S. No. 8 and 9 are for the PLZT 9/60/40 composition. * Microwave-sintered data reported earlier [35].
S. No.Sintering Temperature (°C)/Timeρ (%)Grain Size (µm)εrtanδd33 (pC/N)kp (%)Pr (µC/cm2)Ec (kV/cm)Strain (%)Strain Hysteresis (%)Ref.
11150/20 min99.5 *1.2 *2100 *0.03 *575 *67 *32.1810.170.265.74This study
21200/4 h981.522900.025606733.3010.570.275[34]
31200/4 h-~105000.03543-----[64]
41250/24 h-210000.0252029----[65,66]
51300/2 h982.834130.07569-21.906.65--[67]
61250/4 h93232830.0338752426.67--[68]
71200/2 h--2785---20.59.98--[69]
81200/60 h974.66000.06--6.205.29--[70]
91275/2 h------860.006-[71]
Publisher’s Note: MDPI stays neutral with regard to jurisdictional claims in published maps and institutional affiliations.

