1. Introduction
The classic Duval triangle [
1], shown in
Figure 1, uses concentrations (absolute or incremental) of methane, ethylene, and acetylene dissolved in the insulating oil of a transformer to locate a point in the interior of an equilateral triangle that has been subdivided into fault zones corresponding to the six basic International Electrotechnical Commission (IEC) fault types (see
Table 1) plus a mixture DT of electrical discharge and thermal. The fault zone in which the point lies indicates the generic fault type that is most likely to produce those three fault gases in the proportions given. The triangle was considered more effective than the major gas ratio diagnostic methods of Rogers and Doernenburg (described in [
2,
3]), as the methods comparison in
Section 9 below confirms.
Although the original Duval triangle (now called Triangle 1) is very effective, it has been supplemented with two more Duval triangles–one (Triangle 4) based on hydrogen, methane, and ethane, and the other (Triangle 5) based on methane, ethane, and ethylene–to produce more refined fault type identification using hydrogen and all four of the low molecular weight hydrocarbon gases, generated from transformer oil by high temperatures and electrical discharges, that are commonly used for dissolved-gas analysis (DGA) [
4].
All Duval triangles require that the relevant three gas concentrations be reduced to three gas proportions (each gas concentration represented as a fraction of the total). Those gas proportions are then used as barycentric coordinates to locate a point inside the triangle or on an edge. The details of that are explained in the Triangle Coordinates section, and it is also explained why each point represents exactly one set of gas proportions.
Recently Duval published two diagnostic pentagons [
5] based on hydrogen, methane, ethane, ethylene and acetylene. Duval pentagon 1, covering the six basic IEC fault types plus sub-type S, is illustrated in
Figure 2a. Duval pentagon 2 is similar to pentagon 1 but covers several fault sub-types not in pentagon 1. Duval’s diagnostic triangles and pentagons are variously included in recent and past editions of the IEC 60599 DGA guide [
3] and also in the IEEE C57.104-2019 DGA guide [
2]. Recently Cheim et al. published a single diagnostic pentagon combining the original two Duval pentagons [
6]. There are also a diagnostic pentagon by Mansour [
7] (see
Figure 2b) and a heptagon by Gouda et al. [
8].
Although it has apparently gone unnoticed until now, there is a problem with using pentagons and other polygons with more than three sides as diagnostic figures analogous to the Duval triangle. The mappings used to locate a point in the figure based on a combination of gas proportions are many-to-one; that is, very different gas proportion combinations are identified with the same point inside the polygon. In the Pentagon Coordinates section, the mappings for the Mansour pentagon and the Duval pentagons are explained, showing why they are many-to-one. Examples discussed in
Section 3 show how both barycentric and "centroid" pentagon mappings map very different gas combinations onto the same point, resulting in fault type mis-classifications.
The Duval triangle barycentric mapping of three-gas combinations to unique points works equally well for higher-dimensional generalized triangles called simplexes [
9], introduced briefly in
Section 4. Following that introduction,
Section 5 presents the idea of a DGA 4-simplex, i.e., a four-dimensional simplex configured for five-gas fault type classification to do what the DGA pentagons were intended to do, but without the many-to-one mapping problem. Although the DGA 4-simplex is a direct generalization of the Duval triangle, it differs from the triangle in interesting respects such as how four-dimensional fault zones are defined and how the geometric fault type classification can be visualized. Those issues are discussed in detail in
Section 6, and a diagnostic example is shown in
Section 7.
Alternative approaches that were tried and rejected for training the DGA 4-simplex are briefly discussed in
Section 8. Finally, three gas ratio methods, Duval triangle 1, Duval pentagon 1, the Mansour pentagon, and the DGA 4-simplex are compared in
Section 9 by applying them to 629 cases of transformer faults confirmed by inspection. The DGA 4-simplex outperformed all the other methods with respect to percent correct classifications. Possible reasons for that result are considered.
All diagnostic methods discussed in this paper are for mineral-oil-filled transformers. Variant gas ratio, triangle, and pentagon methods for DGA in alternative insulating liquids and for some other kinds of liquid-insulated apparatus, such as tap changers, have been developed. The simplex method described below can be trained using suitable data and applied to such cases. This paper, however, relates only to diagnostics for mineral-oil-filled transformers.
2. Triangle Coordinates
Barycentric and Cartesian Coordinates in the Triangle
A Duval triangle is an equilateral triangular figure subdivided into fault zones. The method of converting three gas concentrations into gas proportions, then using those as coordinates to locate a point inside a Duval triangle is easily explained in terms of affine plane geometry, in which the Euclidean plane
is regarded as an affine space [
10] over itself, allowing intuitively reasonable operations such as getting a point by adding a displacement vector to a point
and also getting a displacement vector from point
P to point
Q by subtracting the two points:
The three vertexes
of a triangle are affinely independent and form an affine coordinate frame in
because they are not collinear, i.e., the vectors
and
are linearly independent. Because of that, every point
P inside or on the triangle is a unique affine combination of the triangle vertexes, i.e., there is exactly one triplet of non-negative coefficients
such that
and
In that case,
are called the barycentric coordinates of the point
P. Every triplet of non-negative numbers satisfying condition (
3) determines a unique point inside or on the triangle. Furthermore, the barycentric coordinates of a point do not depend on the
Cartesian coordinate system used to specify the locations of the triangle vertexes and the dimensions of the triangle. The vertexes of the triangle have barycentric coordinates
,
, and
. The barycentric coordinates
correspond to the centroid of the triangle.
A convenient way to relate barycentric coordinates to Cartesian
coordinates is to consider an equilateral triangle having all its vertexes on the standard unit circle with center at the origin
of a two-dimensional Cartesian coordinate system, as shown in
Figure 1. The Cartesian coordinates of any point
Q on the standard unit circle are
, where
is the angle measured counterclockwise from the positive
X-axis to the radius
. Vertex
is at the top with Cartesian coordinates (0, 1). Vertex
is at bottom left, with coordinates
, and
is at bottom right, with coordinates
.
In Duval triangle 1 (
Figure 1), vertex
is associated with 100% methane,
with 100% acetylene, and
with 100% ethylene. To locate a point
P representing 10
L/L of methane, 5
L/L of acetylene, and 35
L/L of ethylene, divide each gas concentration by the total
which gives barycentric coordinates
Then by (
4) the Cartesian coordinates of
P are
This point P is in the T3 fault zone.
3. Pentagon Coordinates
3.1. Mansour Pentagon
The Mansour diagnostic pentagon [
7] has vertexes labeled
A to
E going clockwise from the top, corresponding to the 100% proportion level for each of the gases hydrogen, methane, ethylene, ethane, acetylene in that order as shown in
Figure 2b. The prescribed method for locating a point inside the Mansour pentagon corresponding to a set of gas concentrations starts with constructing normalized coordinates
(in
order) by dividing each gas concentration by the of all the concentrations. The subsequent steps described in [
7] are equivalent to using the normalized coordinates to calculate an affine combination of vertexes analogous to (
4) and (
5) to locate a point
P representing the gas data.
The analogy with the Duval triangle fails badly, however. The vertexes of a pentagon do not form an affine coordinate frame in the plane . That is because the four vectors cannot be linearly independent in two dimensions. Consequently there is not a one-to-one correspondence between pentagon points P and normalized coordinates . The following example demonstrates this problem.
Ten triangles can be defined in any pentagon, corresponding to the ten possible choices of three out of five pentagon vertexes. Five of those triangles are defined by a vertex and its two immediate neighbours (example:
). The other five triangles are defined by a vertex and the side opposite (example:
). Those ten triangles overlap so that every interior point of the pentagon is located in at least three and up to five of those triangles. Now consider Case 1 of [
7], shown as the leftmost numerical column in
Table 2. The sum of the gas concentrations in Case 1 is 414
L/L, so the normalized coordinates for Case 1 in
order are
. The corresponding point, shown in
Figure 3b, has Cartesian coordinates
and lies within triangles
,
,
, and
.
Consider triangle
for example. We would like to know the barycentric coordinates of
P in
. Call those
. Since we know the Cartesian coordinates of vertexes
A,
B,
C, and point
P, we can write down and solve the equations
using the fact that
, i.e.,
. There are really two equations–one for the
X coordinates and one for the
Y coordinates–and two unknowns
. The solution is
, the barycentric coordinates of point
P in triangle
ABC.
Now here is the crucial point. Since
, and
we also have
which means that
are also normalized pentagon coordinates of
P. They are different from the ones found for Case 1, but they map to the same point
P in the Mansour pentagon. Multiplying
by the gas sum 414 for Case 1 gives the example gas concentrations H2 = 154, CH4 = 101.2, and C2H4 = 158.8 shown in the
column of
Table 2.
In Duval triangle 1, Case 1 corresponds to a point in T2, and the
example corresponds to a point in T3 (see
Figure 3a). Likewise,
P has barycentric coordinates
in triangle
that become normalized pentagon coordinates
in the pentagon; and so on for all the examples shown in
Table 2. Plotting in triangle 1 all the various examples that map to
P in the Mansour pentagon illustrates that data corresponding to widely different fault types are not distinguished from Case 1 by the Mansour pentagon.
3.2. Duval Pentagon
Duval’s pentagons [
5,
6] do not use the affine combination of vertexes method to locate a point with given normalized coordinates. Instead, using the counterclockwise order
of vertexes corresponding to hydrogen, ethane, methane, ethylene, and acetylene in that order, normalized coordinates
are mapped to the centroid of a pentagon with vertexes at
,
, ...,
. That pentagon in general has unequal sides and may not be convex, i.e., it may contain one or more interior angles greater than 180 degrees. Cartesian coordinates
for each point
,
, are calculated as
using the Cartesian coordinates for the vertexes given, for example, in
Table 3, which are based on inscribing the pentagon in a standard unit circle, as discussed above for the Duval triangle.
The Cartesian coordinates
of the centroid
C of pentagon
are given by these formulas in [
6] and the other papers on the Duval pentagon:
where
and
is identified with
.
Formulas (
10) and (
11) can be understood simply. The origin
of the
coordinates is at the center of the regular pentagon
. Since the normalized gas concentrations
mentioned above are all non-negative and represent distances along
,
O is inside or on the pentagon
. That pentagon can be divided into "pie slice" triangles, the
i-th one of which is
. Formula (
11) says that the area of the pentagon is the sum of the areas of the pie slice triangles:
Bearing in mind that the barycentric coordinates of the centroid of a triangle are
, the
coordinates of the centroid
of triangle
are given by
Consequently, the formulas of (
10) translate to this:
That is, the centroid C of the pentagon is the affine sum of the centroids of the pie slice triangles, with the respective proportional areas of those triangles as normalized coefficients. Although the effective normalized coordinates are obtained indirectly from the original normalized coordinates derived from the gas data, the coordinates of the point C plotted in the pentagon are, as for the Mansour pentagon, calculated as an affine sum of five points . The same geometric problem arises—five points in the plane cannot be affinely independent, so the mapping from to to C is many-to-one. The Duval pentagon 2 and the Cheim et al. pentagon, referenced in the Introduction, employ the centroid mapping method and have the same problem.
All five-gas points that are plotted by the centroid method are located within a small regular pentagon concentric with the standard one
but having its vertexes on a circle with radius 1/3. According to [
5], the Duval pentagon with fault zones plotted in it, as in
Figure 2a, corresponds to a pentagon inscribed in a circle with radius 2/5, large enough to contain all the mapped points. That is why the radius of the circle circumscribed around the Duval pentagon 1 in
Figure 2a is 0.40 instead of 1.00.
Table 4 provides an example of the "centroid" mapping of two gas patterns to the same point in a Duval pentagon. Case 1 from [
7] and
Table 2 is compared with another example, which unlike Case 1 contains a significant amount of acetylene. Although Case 1 maps into the T2 zone of Duval triangle 1 and the "Other" case maps into D2, both cases correspond to the same centroid point with Cartesian coordinates
in the T3 zone of Duval pentagon 1, as shown in
Figure 4.
The reason that this geometric flaw in DGA pentagons has not been noticed up to now is that the pentagons appear to perform well on average, so evidently the many-to-one mapping problem is not as fatal as it might seem from the examples in
Table 2 and
Table 4, although those examples may cast doubt on the accuracy of pentagon diagnoses in individual cases. One may suspect that occasional geometrically caused mis-classifications might cause the pentagons to perform less well on average than a hypothetical geometric figure for which (as for the triangle) affine barycentric coordinates can be mapped one-to-one to interior points. That is, perhaps a better-performing five-gas diagnostic figure could be a four-dimensional generalized triangle, i.e., a 4-simplex.
4. Simplexes
A simplex is a generalized triangle, except that a simplex contains both its boundary and its interior points, whereas strictly speaking a triangle contains only its edges. For example, a two-dimensional (flat) simplex is a triangle with its interior points. A three-dimensional simplex is a tetrahedron with its interior points. Higher-dimensional simplexes are hard to imagine, but the two-dimensional faces of all of them are triangular.
The equilateral triangular figure discussed in the Triangle Coordinates section is otherwise known as the standard two-dimensional simplex
. The standard
n-dimensional simplex
is defined mathematically as the set of all
-tuples
of non-negative real numbers such that:
Those -tuples are called "points." The individual numbers in the tuple are called the barycentric coordinates of the point. Barycentric coordinates are unique for simplexes of all dimensions, i.e., different sets of barycentric coordinates represent different points. This fact is crucial for the use of a 4-simplex as a four-dimensional 5-gas DGA classifier that does not have the pentagon’s many-to-one mapping problem. The application of the 4-simplex to DGA will be discussed in the next section.
The five vertexes of the standard 4-simplex
have barycentric coordinates
,
, ...,
. Cartesian coordinates of those vertexes are given in
Table 5, where the origin
is at the center of the 4-sphere
, and all of the vertexes of
lie on that 4-sphere. The sum of the squares of the Cartesian coordinates of each vertex is one. The dot product of the Cartesian coordinates of any two vertexes
of
is
, the cosine of the angle
.
Since barycentric coordinates in a simplex are easily converted to Cartesian coordinates, Euclidean distance can be calculated between points. To convert barycentric coordinates
to Cartesian coordinates
, use the Cartesian coordinates for each vertex as given, for example, in
Table 5 to calculate the affine combination
With the Cartesian coordinates
of points
P and
of
Q, the distance between
P and
Q in
is defined as:
The material above provides the mathematical framework for using a 4-simplex as a “5-gas Duval triangle”.
5. Simplexes for DGA Fault Type Classification
A four-dimensional simplex can be used as a fault type classifier for 5-gas patterns. A 4-simplex has ten triangular faces. If the interior of the DGA 4-simplex is projected onto those faces, they can be thought of as all possible Duval triangles based on combinations of three of the five key fault gases.
A pentagon, which as noted above is covered by ten overlapping triangles formed by combinations of three vertexes, can be seen as a "road kill" object obtained by flattening a 4-simplex, collapsing its faces and parts of its interior on top of one other. This observation provides additional insight into why many multi-gas combinations map to a single point in a Duval or Mansour pentagon.
Although the DGA 4-simplex is difficult to visualize, it is computationally easy to work with. The method of defining fault zones by plotting linear boundaries does not generalize nicely to four dimensions, however, so the fault type classifications have to be handled differently.
A good solution is to estimate a multivariate nonparametric probability density function for each fault type on the points of , based upon a training set of pre-classified five-gas patterns. This method can be adapted to work with different insulating liquids, different apparatus types, and different possible diagnostic classifications. For example, pre-classified transformer DGA data from oil-filled transformers can be used to train the DGA 4-simplex to recognize standard transformer fault types. Alternatively, DGA data for a particular model or type of on-load tap changer can be used to distinguish between normal operation and abnormal conditions such as contact coking, excessive arcing, and so on for that LTC model. In any case, because the fault type classification is based on what amounts to overlapping four-dimensional contour maps of probability density for different fault types, the DGA 4-simplex allows the possibility of producing a mixed diagnosis.
6. Four-Simplex Probability Density Training
The Duval triangle fault zones are defined by linear boundaries plotted within the triangle. The analogous fault zone boundaries for a five-gas DGA 4-simplex would be hyperplanes, which would be difficult to define and visualize. Instead, multivariate kernel density estimation (KDE) [
11] can be applied to a training set of several thousand pre-classified cases of five-gas data to estimate a multivariate probability density function for each fault type. That function provides a probability density value for each fault type at every point of the DGA 4-simplex.
Eventually it will be desirable to train the DGA 4-simplex using a large database of training cases based directly on diagnoses confirmed by transformer inspection, employing any assortment of fault types that is considered appropriate. Not having a large database of inspection cases, however, we decided to use Duval triangles 1, 4, and 5 to assign fault types in a large database of electric utility DGA data that is available to us, creating a large training set for initial experimentation and evaluation of the DGA 4-simplex.
Fault types trained for this initial study were PD, T1, T2, T3, D1, and D2, as well as DT, D, (all D1 and D2 cases) and T (all T1, T2, and T3 cases). See
Table 1 for fault type definitions. Fault types S and O were treated as T1, since they overlap with the T1 temperature range and are shown as T1 by triangle 1. Fault type C (thermal with paper carbonization), of which there were about 100 examples, was omitted from the training set since it can represent either T2 or T3. The fault types DT, D, and T are used internally as described below but not reported as final classification results.
The training set was derived from a large database containing multiple years of DGA data contributed to us for research by three major North American electric utilities. Software was used to identify gassing events, defined as temporal sequences of consecutive oil samples from an individual transformer where hydrogen and hydrocarbon gas concentrations are increasing. Such gassing events generally represent time intervals during which the transformer oil is being stressed or decomposed by high temperature or electrical discharges. The duration of a gassing event was not considered–only the incremental changes in fault gas concentrations between the beginning and the end of the event were recorded and then evaluated according to Duval triangles 1, 4, and 5 according to the recommendations of [
4] to obtain a fault type. The five "pentagon gas" increments for a gassing event, along with the fault type derived as noted above, constituted one training example. In all, 7133 training examples were derived from the database.
Gas increments over gassing events were used for the training examples instead of gas concentrations reported for each oil sample because a gassing event and its gas increments represent gas that is generated in response to a problem or combination of problems, excluding residual gas that may have accumulated for various reasons over years or decades preceding that gassing event.
7. DGA 4-Simplex Classification Reporting
To see how fault type classification by the DGA 4-simplex works, consider Case 1 from [
7] and
Table 2 and
Table 4. In the natural order hydrogen, methane, ethane, ethylene, acetylene the gas concentrations (
L/L) are 130, 140, 24, 120, 0. The software divides each gas concentration by the total concentration 414 (
L/L) to get barycentric coordinates
. Those coordinates are used to calculate an affine sum like (
15) to obtain the four-dimensional Cartesian coordinates of a point inside the simplex. Those coordinates are
.
The training process produced an estimated probability density function for each fault type. Applying those functions to 4D coordinates
P provides the probability density values shown in
Table 6. Those densities are all divided by the maximum density, which is 0.00880 for T2, to obtain a relative likelihood that is used for creating
Figure 5. In cases where the sample point falls well within a particular fault zone, typically all the other fault types have a relative likelihood of less than 60%, and the dominant fault type is reported as the diagnosis. From the densities or relative likelihoods for Case 1, it is evident that T2 and T3 are both dominant over the other fault types, with a T2:T3 ratio of about 53:47, expressing each of the two as a percent of their total for the ratio. In other words, according to the DGA 4-simplex, Case 1 appears to be a T2 fault that is almost hot enough to be T3.
If the relative likelihoods are the same for fault types of the same group (thermal or discharge), the "hottest" type is preferred. For example, D2 would be preferred over D1, and T3 would be preferred over T2.
If non-reported fault type DT has a higher probability density than all the IEC fault types, the most likely thermal fault type and the most likely discharge fault type are reported as joint diagnostic results, along with a likelihood ratio computed from the density values of non-reported fault type T and non-reported fault type D.
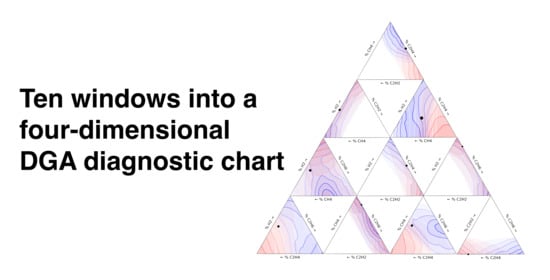
To visualize the classification results, project the interior of the DGA 4-simplex onto each of the ten triangular faces, making each face a window into the probability densities inside. The projection of the fault type densities onto the methane-ethylene-acetylene face is shown in
Figure 6, where a solid color corresponds to a fault type whose density is dominant in that region. The arrangement of fault type regions corresponds well, unsurprisingly, to the fault type zones of triangle 1 (
Figure 1).
All ten of the triangular faces of the DGA 4-simplex are shown in
Figure 7, where Case 1 of
Table 2 and
Table 4 has been classified, as explained above, as a 53:47 mixture of T2 and T3, i.e., a "hot" T2 fault. The sample point
P inside the simplex is projected onto each face as a dot, the size of which indicates how far the point is from the given face.
Color-coded density contour lines are projected onto each face for the fault types having the highest likelihood. Since it is possible for a not-likely fault type to appear to have high density along the line of sight between the point and a particular face, it is necessary to plot density contours for only the most likely fault types to avoid confusion. The darkness of a contour’s color shows how close that contour is to the maximum density of the fault type. In darkest-to-lightest order, the contour values are about 87.5%, 75%, 67.5%, 50%, 37.5%, 25%, 12.5% of the fault type’s maximum density.
8. Other Training Methods Considered
Other training methods were tried for creating a fault type classifier with the DGA 4-simplex. Nearest neighbor analysis was tried and found unsuitable because the diagnosis was strongly dependent upon the number of training examples for each fault type. In the three-utility set of training cases, the number of T1 cases greatly outnumbered PD cases, and consequently a PD diagnosis would rarely be reached by simple nearest neighbor analysis. The nearest neighbor approach would perform better if the training set had a roughly equal number of training examples for each fault type. It would have been possible to add synthetic PD examples (based on the Duval triangles) to the training set, but that path was not chosen.
A decision tree classifier was found to be the most successful at matching the validation set, but the effect of that classifier was simply to rediscover the Duval triangle fault zones and reproduce the Duval triangle results, in effect using three gases at a time to determine the fault type classification.
9. DGA 4-Simplex Effectiveness
The best test of the effectiveness of a DGA diagnostic method is to apply it to examples not in the training set where the diagnosis has been confirmed by inspection of the transformer. Good performance with inspected cases provides confidence that the method will perform well in cases where a visual inspection is not possible. A database of such examples was compiled for [
12]. Several additional cases were added since that publication resulting in a total of 629 examples. Those test cases are subdivided into three categories with 346 cases of thermal damage, 216 cases of high-energy discharge, and 67 cases of partial discharge. Each case is a real example from a transformer where five gas values were measured and some kind of verification or inspection occurred to verify the fault type inside the transformer. The percent match between the diagnosis and the inspected fault damage for several DGA diagnostic methods is determined with this database to evaluate the effectiveness of each method. The results can be seen in
Table 7.
Effectiveness is defined in this paper as how well a given method can diagnose a particular fault category. In other words, given 67 cases of PD, how often does the diagnosis from each method actually result in PD. Since each of the subcategories of faults can be more or less common within a transformer, effectiveness does not measure how often a particular method is right or wrong when applied to an unknown gassing event. That would require weighting the effectiveness of diagnosing each subcategory of fault by its known relative prevalence within a fleet of transformers. The overall effectiveness presented in
Table 7 is simply a weighted average by the number of inspected cases. Sub-category fault types not typically shared between the methods (S, O, & C) were ignored.
In general, the ratio methods (Rogers, Doernenburg, and IEC) perform relatively poorly compared to the geometric methods (Duval, Mansour, and the DGA 4-simplex). The ratio methods only have 61–73% overall effectiveness at diagnosing the three main categories of transformer faults. It should be noted that the gas concentration limits typically applied in the Doernenburg ratio method were ignored in this study; otherwise the effectiveness for high-energy discharge would be extremely poor. Duval triangle 1 is very effective at diagnosing a thermal or discharge event, however it is poor at diagnosing partial discharge. This can be improved by using supplementary Duval triangles 4 and 5. The Duval and Mansour pentagon methods likely improve the effectiveness of diagnosing PD by comparing the other gases against hydrogen, a key fault gas generated from partial discharge. While the pentagon methods are more effective than Triangle 1 at diagnosing PD, they are roughly equivalent to the triangle for thermal and discharge events. The DGA 4-simplex achieves the highest overall effectiveness score of 93% while simultaneously achieving the highest effectiveness within each of the 3 subcategories. The highest effectiveness in all three categories implies that regardless of the prevalence of each type of fault within transformers, the accuracy of the DGA 4-simplex at distinguishing between these subcategories will also be the greatest compared to the other methods presented here.
The success of the DGA 4-simplex compared to Duval triangle 1 and the pentagons can likely be attributed to the following:
Points in the DGA 4-simplex have unique barycentric coordinates, avoiding the possibility of mis-classifying some cases as in the pentagon examples of
Table 2 and
Table 4.
The initial training set used for the DGA 4-simplex used classifications provided by the Duval triangle 1 with additional logic to use supplementary Duval triangles 4 and 5.
The DGA 4-simplex is slightly more effective than Duval triangle 1 for thermal and discharge cases, perhaps because it formulates a more complex fault boundary with probability densities in 4-space instead of using zones delineated by straight lines in the plane.
Ideally, the DGA 4-simplex should be independently trained on data of strictly inspected cases in order to maximize the effectiveness of the methodology. The data used here to test the effectiveness of each method would be a good starting point for that. However, for the purposes of this paper we reserved the inspection data as an independent validation set for fair comparison of the various methods.
10. Conclusions
We discussed the problems that arise with using a pentagon method to do DGA diagnostic interpretation. The problem stems from having a plane affine coordinate system in which the coordinates are not affinely independent. The triangle plots take advantage of affine independence to guarantee that all points within the triangle have unique barycentric coordinates, allowing three variables to define a two dimensional space. Because the pentagon vertexes can never be affinely independent in a plane, the Mansour and Duval mappings of normalized 5-gas coordinates to points in the pentagon are many-to-one. Examples are presented to show how some gas combinations are mapped to inappropriate fault zones.
The purpose of the pentagon methods is to use all five of the key fault gases typically considered in transformer DGA, especially using hydrogen to classify partial discharge. To fulfill that propose, we propose an alternative solution employing a higher-dimensional version of the triangle, i.e., a four-dimensional simplex, which can be visualized by projecting its interior onto its ten triangular faces. Points in the simplex represent combinations of the five key gases. We also propose using kernel density estimation to determine the likelihood of each fault type at each point within the DGA 4-simplex. We verify the effectiveness of this method and show that it out-performs other DGA interpretation methods in accuracy of classifying an independently collected set of DGA examples where inspections verified the diagnosis.


