Article

The Potential Role of Power-to-Gas Technology Connected to Photovoltaic Power Plants in the Visegrad Countries—A Case Study

Renewable Energy Research Group, Soós Ernő Research and Development Center, Nagykanizsa Campus, Faculty of Engineering, University of Pannonia, 8800 Nagykanizsa, Hungary
Energies 2020, 13(23), 6408; https://doi.org/10.3390/en13236408
Submission received: 12 November 2020 / Revised: 1 December 2020 / Accepted: 2 December 2020 / Published: 4 December 2020
(This article belongs to the Special Issue Seasonal Energy Storage with Power-to-Methane Technology)

Abstract

:
With the spread of the use of renewable sources of energy, weather-dependent solar energy is also coming more and more to the fore. The quantity of generated electric power changes proportionally to the intensity of solar radiation. Thus, a cloudy day, for example, greatly reduces the amount of electricity produced from this energy source. In the countries of the European Union solar power plants are obligated to prepare power generation forecasts broken down to 15- or 60-min intervals. The interest of the regionally responsible transmission system operators is to be provided with forecasts with the least possible deviation from the actual figures. This paper examines the Visegrad countries’ intraday photovoltaic forecasts and their deviations from real power generation based on the photovoltaic power capacity monitored by the transmission system operators in each country. The novelty of this study lies in the fact that, in the context of monitored PV capacities in the Visegrad countries, it examines the regulation capacities needed for keeping the forecasts. After comparing the needs for positive and negative regulation, the author made deductions regarding storage possibilities complementing electrochemical regulation, based on the balance. The paper sought answers concerning the technologies required for the balancing of PV power plants in the examined countries. It was established that, as a result of photovoltaic power capacity regulation, among the four Visegrad countries, only the Hungarian transmission system operator has negative required power regulation, which could be utilized in power-to-gas plants. This power could be used to produce approximately 2.1 million Nm3 biomethane with a 98% methane content, which could be used to improve approximately 4 million Nm3 biogas of poor quality by enriching it (minimum 60% methane content), so that it can be utilized. The above process could enhance the viability of 4–6 low-methane agricultural biogas plants in Hungary.

1. Introduction

1.1. The Use of Renewable Energy Worldwide

As the world’s hunger for energy does not cease to grow, the exploitation of renewable sources of energy is becoming more and more important. For the sustainability of the electric power system (EPS), the efficient integration of variable renewable energy (VRE) is an urgent matter. In the year 2018, VRE-based technologies accounted for 33% of the global electric power generation capacity and more than 26% of total electric power generation [1,2].
The European Union (EU), which is a leading figure in climate policy as well as in the use of renewable energy and the efforts for a new energy economy, has set the target to significantly reduce the emission of greenhouse gases in the next few decades. According to some forecasts, by 2040 about 40–60% of the electric power generated in the EU will come from photovoltaic (PV) and wind power systems. Such a great proportion of VRE requires the electric power system to be flexible enough to cope with weather-dependent energy production. Consequently, it is necessary to possess enough reserve capacity for the periods when the weather conditions do not allow stable VRE generation. It is also predicted that the dynamic spread of these technologies will cause technical problems in the macro-energy systems (e.g., loop flows in the local grid) more and more frequently. For example, this may also mean the optimization of the electric parameters of an entire area served by a transformer station [3,4,5,6,7,8,9,10,11,12].
These issues could be solved by the intensive development of energy storage technologies in the European Union. This is especially important, since the establishment of flexible local energy storage capacities has already become a key factor of energy security for the EU member countries due to the spread of VRE [4,11,13,14,15,16,17,18,19,20].
At the beginning of the year 2017, the global capacity of permanent energy storage systems amounted to 159 GW, 153 GW of which belonged to pumped hydro storage (PHS). The rest of the energy storage technologies represented a total of 5.9 GW, of which the share of battery-based devices was 2.3 GW [21,22,23,24]. The European PHS capacity reached 50.5 GW in 2017 (approx. 1.9 TWh energy capacity according to [25,26,27,28,29], with more than 59% of this capacity belonging to 5 countries (Italy, France, Germany, Austria, and Spain) [25,26,27,30,31].
Based on the current trends, it is expected that the European Union’s estimated nominal storage power capacity will grow to 72–95 GW, while its energy storage capacity will reach 3.6–4.1 TWh by 2040 [24,26,32,33]. Although, at present, the regulations of energy storage are not unified in the nations of the European Union, the increase in VRE capacities will call for a new regulatory and economic environment for the security of the electricity supply and the spread of energy storage technologies [9,32,34].
As the utilization of variable renewable energy (VRE) had gained more significance in transforming the energy systems of the world, solar energy and solar energy schemes started to play an increasingly prominent role in supporting sustainable development and the protection of the environment. The most apparent reason for turning to solar energy is that—besides the fact that the energy of the Sun is the basis of most processes in nature—it is a readily available, clean, plentiful and sustainable resource [35,36,37,38,39,40,41,42,43,44]. To illustrate how abundant this energy source is, it suffices to mention that the potential of the energy from the Sun reaching the Earth annually exceeds humankind’s current need for energy several thousand times. Regarding the different ways of making use of this energy, photovoltaic (PV) technology is a common solution, in which PV cells convert the radiation of the Sun into DC energy [45,46,47]. Nevertheless, it must also be stated here that the diverse solar energy sources that could be available to humanity have not been fully explored and utilized yet [48].
The PV technologies that are most used around the world at present are the amorphous silicon (a-Si), the monocrystalline (m-Si) and the polycrystalline (p-Si) technologies. Probably because of their outstanding reliability, crystalline solar modules are the most common ones, boasting a market share of approximately 90%. The best efficiency that can be reached with p-Si modules is about 26.7%, while m-Si PV ones are capable of approximately 22.3% [49,50,51,52,53,54,55,56,57,58]. Nevertheless, the efficiency of the m-Si and p-Si modules that are mostly used today lags behind to a great degree, and remain between 10–18% in the area of the EU [59]. Concerning the a-Si photovoltaic technology, which is a thin-film-based PV technology, the highest value of efficiency to be reached currently is only 10.5%, which is still about twice as high as the 4 to 6% of the a-Si modules mainly used today. As there is no data currently available about the market share of a-Si technology, one can only make assumptions on the basis of the fact that the total share of all thin-film solar modules constitutes about 10% [49,52,53,57,58,59,60,61].
In the past ten years, the PV sector has been witness to an unprecedented growth, which can be explained, on the one hand, by great technological advancements and developments and a plethora of different measures, for example novel financial support schemes, the Feed-in-Tariff and the decreasing expenses related to the investments, on the other hand [39,49,62]. Moreover, hybrid renewable energy microgrids (HREM), one of the central elements of which are PV systems, represent an affordable, reliable and sustainable alternative for providing households with a modern energy supply [63].
Thanks to the dynamic development, three years ago, in 2017, 26.5% of the total amount of electric power produced in the world was generated from renewable sources. The proportion of electricity from PV technologies was 1.9%, which was generated by a worldwide photovoltaic capacity of 402 GW. The first four top PV power producers were China (131.1 GW) in the first place, followed by the European Union (108 GW), the United States of America (51 GW) and Japan (49 GW). In connection with China, it deserves to be noted that as a result of the changes in the roles of the various technologies, PV technology became its most significant new power capacity [39,64].
The amount of energy that can be generated by PV technology depends on many factors, the most important of which is solar radiation followed by the given technology used, the natural conditions of the environment, the temperature, the composition of the particular module and the joint effects of the configuration of the system itself and its efficiency. The map presenting the PV power potentials of Europe clearly shows that the yearly quantity of PV energy that can be generated ranges between 700–1900 kWh/kWp on average, depending on the actual location (Figure 1). Among the four countries of the Visegrad Group, Hungary has the highest figures: 1050–1300 kWh/kWp, followed by Slovakia with 1050–1250 kWh/kWp, while the lowest values belong to Poland and the Czech Republic: 950–1200 kWh/kWp (Figure 1) [58,65,66,67,68].

1.2. Utilizing Biogas and the Potentials of Power-to-Gas Technology

The utilization of biogas dates back to ancient times. It is produced in agriculture as a byproduct, and the last two decades have seen a great rise in its production as well as use in numerous countries, increasing its significance as a renewable source of energy. In the European Union biogas production grew by nearly 100 TWh between 2008 and 2016, when the production reached 187 TWh [69].
Kampman et al. [70] predicted a substantial increase till 2030. The realization of this potential, however, will necessitate joint efforts by a great number of various actors, including those involved in policymaking. They will be the ones who are responsible for creating incentives and initiatives, on the one hand, and eliminating the obstacles in the way of increasing the production and more widespread use of biogas, on the other hand. The institutional conditions for biogas solutions are very complex. Regarding agricultural biogas plants, it has to be mentioned here that they mainly serve an ancillary function rather than being the actual purpose of farming [71]. The wrong composition of raw materials can have an adverse effect on the efficiency of the production of the biogas plant, i.e., the methane content of the gas produced may be too low [72]. Power-to-gas technology may be able to provide a solution to this problem.
In the power-to-gas process, the power-to-hydrogen phase is followed by the power-to-methane stage, which utilizes the hydrogen produced in the first phase with the help of methanation. The biomethane formed by the methanation process can be fed into the natural gas grid in unlimited quantities since its characteristics are the same as those of natural gas.
The two key elements of the power-to-gas process are electrolysis and methanation:
  • Technology uses alkaline, PEME (proton exchange membrane electrolysis) and solid oxide electrolysis methods. Of the three techniques, the alkaline one has been in use for the longest time. The PEME method is more favorable to be used with weather-dependent sources of renewable energy, such as solar energy, because it can support a more flexible system, for example by starting up more quickly. In addition, it is capable of an approximately 5% higher operational efficiency [11,73]. Solid oxide electrolysis requires even less electric power compared to PEME, but its system stability is lower, while its heat requirement is higher [73].
  • Biological and catalytic methanation are typically used in power-to-gas technology. The catalytic (also known as chemical or Sabatier) method has been used since as early as the 1970s. Nevertheless, biological methanation is more preferable because it allows an approximately 20% higher carbon dioxide conversion rate than in the case of the catalytic procedure [74]. The biological method is more flexible (i.e., it can be started more quickly, for example), and its pressure and heat requirements are also lower than those of the catalytic process. For use with VRE sources, biological methanation is recommended due to its greater operational flexibility [75,76].
Both industrial and scientific actors agree that power-to-gas technology has a significant potential for the future [73,74]. Currently, however, there are only a few industrial-size power-to-gas plants around the world, so this technology is still in a phase of initial growth [77,78].
An earlier study of mine was based on five years’ data of the Belgian Elia Group, and it monitored the balancing capacities necessary for the regulation of photovoltaic power plants at quarter hourly intervals. The goal of the examination was to establish what the effects of the day-ahead and intraday schedules were on the required regulation [78]. The present study takes a step further from the previous results and only concentrates on the required regulation needed for keeping the intraday schedules in the Visegrad countries, pointing out the possibilities of balancing solar power plants with the help of power-to-gas technology.

2. Methods and Details of the Study

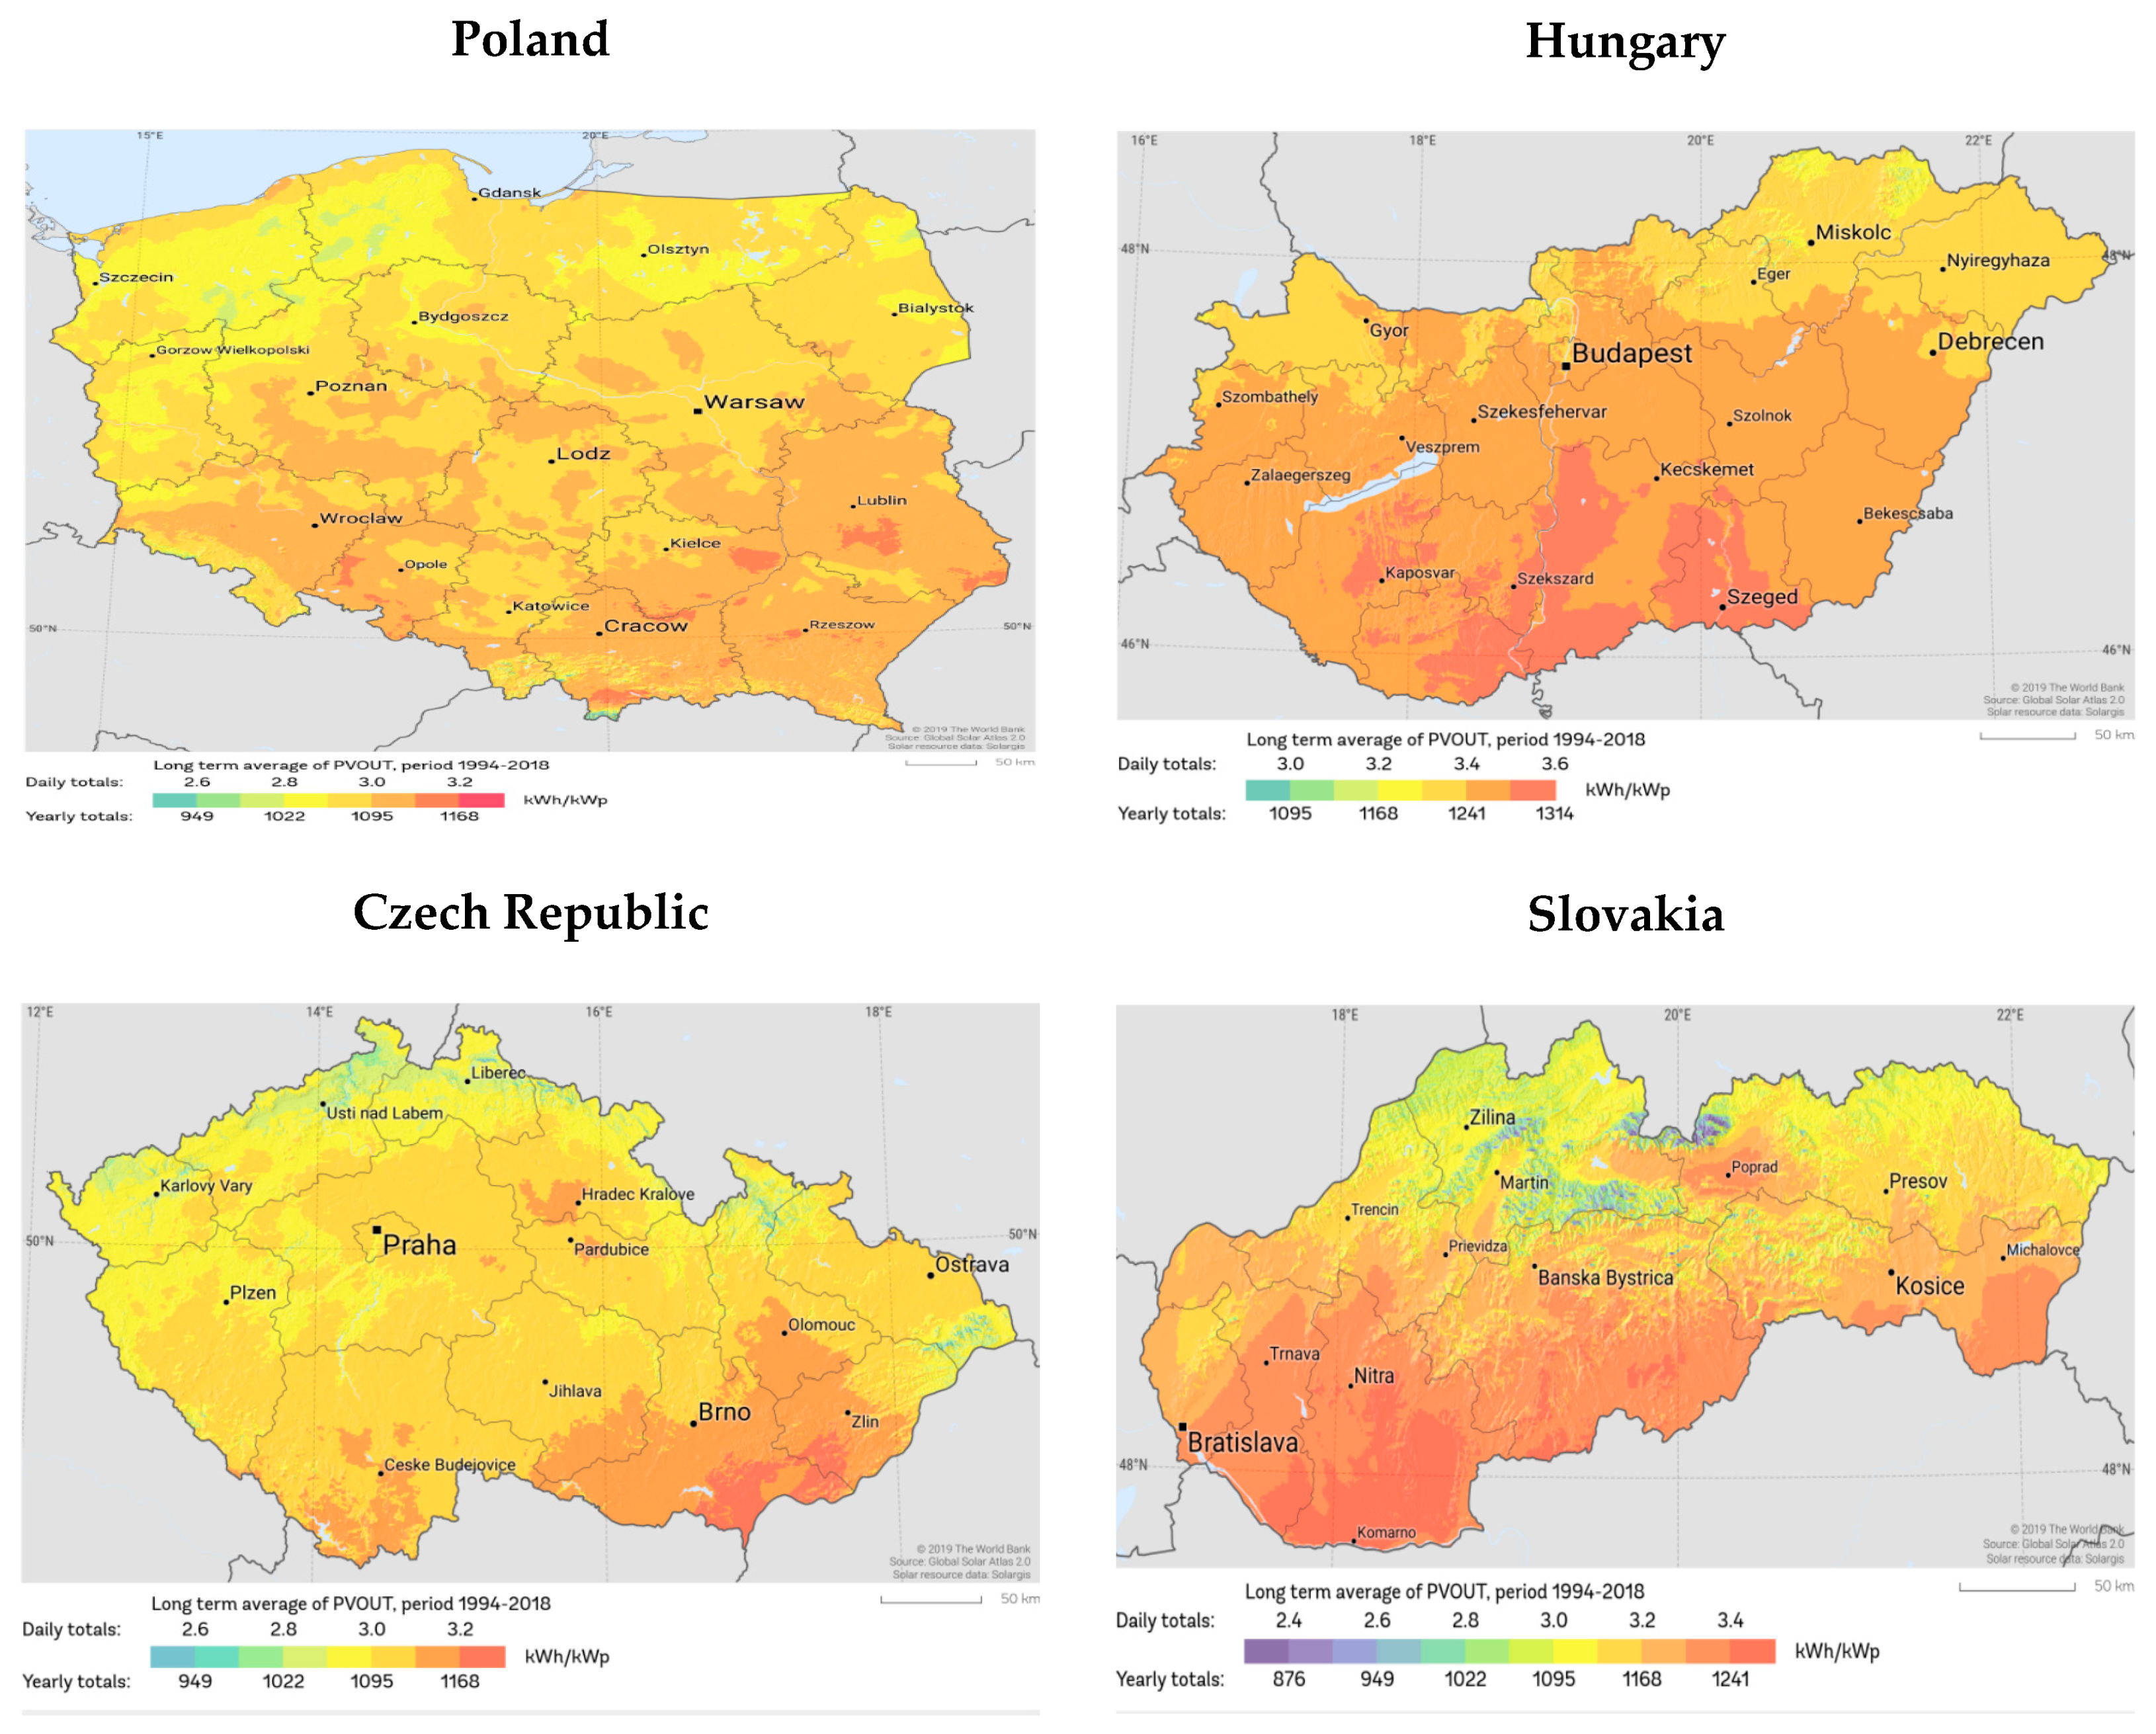
2.1. The Scope of the Investigation

This study deals with the Visegrad countries (Poland, the Czech Republic, the Slovak Republic and Hungary), all of which are members of the European Network of Transmission System Operators for Electricity (ENTSO-E). In order to be as up-to-date as possible, a very recent period, 1 September 2019–31 August 2020, was selected for the purposes of the investigation, which involved the comparison of the real electricity production data with the intraday forecasts of the PV power generation in each Visegrad country. The database used was that of the ENTSO-E, which includes 35 European countries. It was the European Union’s Third Legislative Package for the Internal Energy Market that created the ENTSO-E and gave it legal mandates in 2009 with a view to further liberalizing the electricity and gas markets in the Union. As a result of the Third Energy Package, the transmission system operators’ roles changed remarkably. Because of the unbundling and liberalization measures in the energy market, TSOs became something like a location in the market for the different players to meet and interact. It is the common goal of the members of the ENTSO-E to establish an internal energy market and guarantee its best possible operation as well as to further the energy and climate goals of the Union. A truly significant challenge the TSOs are faced with currently is the integration of an increased proportion of renewable energy sources in the energy systems of the EU, which involves the enhancement of flexibility as well as a lot more customer-focused approach than ever before.
The first goal in the investigation was to determine the balancing requirements for each country by comparing the positive and negative regulation needs considering the time series. The corresponding positive and negative regulation requirements were analyzed in each forecasting interval. The deviation of real data was calculated relative to the forecasts related to a 100 MWp PV system for the Visegrad countries. The characteristics of the energy consumption of the individual countries were not taken into account; the PV power generation forecasts were compared to the actual PV generation figures.
For the implementation of any PV integration, it is necessary to make country-specific surveys of the amounts of regulation resulting from the deviations from the power plants’ forecasts, using the available data. In turn, these data can help with the selection of the suitable energy storage technology and strategy for the electric energy system of a given country.
In the present study, only the intraday forecast data were examined, since it was assumed that these provided more accurate predictions about the expected production compared to the day-ahead forecasts. By mapping the discrepancies between the intraday forecasts and the actual production, the goal was to spot the niches for various energy storage devices, especially power-to-gas ones, to complement the PV capacities of the examined countries for a better compliance with the generation forecasts.
As among the studied countries, only Hungary was found to have negative required power regulation, and since—similarly to Holland—this country also possesses a natural gas infrastructure, which is considered highly developed for European standards [79], it is an obvious solution to utilize the existing network. Conversely, the hydrogen market is still very underdeveloped with hardly any infrastructure. Hungary’s National Energy Strategy 2030 [80] supports the same view, as it primarily considers technologies based on the use of the existing natural gas infrastructure besides electrochemical energy storage till 2030.

2.2. The Data Used in the Calculations

The calculations were primarily based on data from the databases of the ENTSO-E and the Hungarian Independent Transmission Operator Company Ltd. (MAVIR ZRT., Budapest, Hungary). The PV power data (most recent forecast and measured data) in the ENTSO-E database are given at intervals of either 15 or 60 min, according to the provision of data in the particular countries [81,82,83]. Correspondingly, 15-min data were used where available (Hungary and Poland), while in the cases where only hourly data were obtainable, those had to be applied (Slovakia and the Czech Republic) (Table 1). The longer intervals (60-min) give the individual actors in the market more freedom in creating and managing their forecasts than the 15-min ones, since the latter can only be planned on the basis of much more precise meteorological forecasts. Throughout the calculations, the countries with the 15-min and the 60-min intervals were treated separately.
The monitored capacities of the Visegrad countries are shown in Table 2. As it can be seen, the highest figure belongs to the Czech Republic, while the lowest one to Slovakia. For Poland no data were available on 1 September 2019 yet, only starting from May 2020. For the sake of comparability, the data were homogenized, so they were recalculated for 100 MWp PV systems for the individual countries.
It is worthy of note that according to Article 5 (Balance responsibility) of Regulation (EU) 2019/943 of the European Parliament and of the Council of 5 June 2019 on the internal market for electricity: “All market participants shall be responsible for the imbalances they cause in the system (“balance responsibility”)” [85], i.e., the creation of accurate forecasts and consequently the minimization of deviation from it affects every PV power producer in the European Union. Thus, the complete balancing in both a negative and a positive direction needs to be dealt with for every country specifically because of the obligation to comply with PV generation forecasts.

2.3. The Calculations

Obviously, adherence to the PV forecasts is of paramount importance at all times. However, if the actual power generated by a particular PV system during a 15-min or 60-min time period is less than the corresponding value in the intraday forecast, the TSO is obligated to regulate the situation in a positive direction [86]. Thus, from the point of view of the operator of the given PV system, positive TSO regulation means a negative deviation from the forecast. Based on this, the totals of the negative and positive divergences compared to the actual power generation were calculated from the 60-min or 15-min data for one year for each country. The need for positive regulation by the TSO was marked with a negative sign, since it means a power deficit in the given system, while negative regulation by the TSO was marked with a positive sign, because it refers to an energy surplus in the system. The method of calculation as well as the deviation between the forecast and the actual power generation were illustrated with a Hungarian example (Figure 2). Here the actual production and intraday forecast of a 1196 MWp PV system can be seen.
In the course of the research, the particular 15-min and 60-min data series (intraday forecast, actual production, positive regulation requirement and negative regulation requirement) were analyzed, and within each forecast interval (for Hungary and Poland 15-min, for Slovakia and the Czech Republic 60-min) the difference between the intraday forecast and the actual power generation determined the regulation requirement and the direction of the deviation signaled the direction of regulation. If the difference of the actual electricity production and forecast was a positive one, a negative regulatory requirement emerged, while in the case of a negative difference, a need for positive regulation occurred. Positive and negative regulatory requirements of equaling quantities within a given interval could be balanced by the use of battery-based energy storage systems [87]. Thus, the investigation was searching for solutions for meeting the remaining required power regulation. Its value was obtained after comparing the positive and negative regulatory needs, and summarizing these produced the aggregate regulation requirement.
The summarized remaining amounts of the needs for negative and positive regulation by the TSO relative to the intraday forecasts were established for all four examined countries. The results show whether the monitored PV systems cause negative or positive required power regulation for the given country. As this paper investigated the application potentials of the power-to-gas technology, the focus was on the countries where the examined PV systems caused negative required power regulation for the TSO.
Since in the case of Poland no data were available in the database of the ENTSO-E prior to May 2020, daily averages were first calculated from the actual production and forecast data of the four available months; then, the annual values were obtained by proportioning these.

3. Results

3.1. Necessary Regulation in the Monitored PV Capacities in the Visegrad Countries

First, those countries were examined where only 60-min data were available, i.e., the Czech Republic and Slovakia. Figure 3 clearly shows that Slovakia has a considerably larger need for regulation per PV unit than the Czech Republic. In the case of the Slovak Republic, this means +4.9 GWh and −6.6 GWh for a PV capacity of 100 MWp, while these figures for the Czech Republic are +0.9 GWh and −1.7 GWh (Figure 3). It needs to be mentioned here, based on Table 2 above, that the PV capacity monitored by the TSO is significantly smaller in Slovakia than in the Czech Republic.
After the countries with the 60-min forecasts, those with the 15-min ones, i.e., Hungary and Poland, were examined. In the case of Hungary, the TSO requires +11 GWh and −7.4 GWh for the regulation of a PV capacity of 100 MWp, while in Poland the amounts needed are only +1.8 GWh and −4.4 GWh (Figure 3). It can be concluded that Hungary needs a lot more regulation for a PV capacity of 100 MWp. It is also to be noted that, according to the figures in Table 2, Poland has a much greater PV capacity monitored by the TSO.
Having considered the regulation balances of the countries with the 60-min forecasts, on the basis of the capacity monitored in the examined period, it was concluded that, concerning PV power, both the Czech Republic and Slovakia require positive regulation, i.e., their TSOs need extra energy to keep the forecasts. The necessary extra power for such positive regulation is typically provided by natural gas power plants. It is assumed that the rest of the positive and negative regulation needs that are equal in their absolute values is satisfied by using electrochemical storage in the two countries (disregarding any storage losses). The positive required energy regulation for a PV capacity of 100 MWp in the Czech Republic is altogether 0.8 MWh, while in the case of the Slovak Republic it is 1.6 MWh (Figure 4).
While examining the countries that prepare 15-min forecasts, it was found that, concerning their required energy regulation, Hungary requires negative and Poland positive regulation. For a PV capacity of 100 MWp Hungary had 3.6 GWh negative required energy regulation, while Poland had 2.7 GWh positive required energy regulation (Figure 4). It follows from all this that, in the case of the monitored Polish PV capacities, keeping the forecasts requires, apart from electrochemical storage (which is capable of feeding the stored energy into the grid with minor losses, if needed), also natural gas power plants. Conversely, what is needed in Hungary is temporary consumers capable of negative regulation, such as power-to-gas plants.
In the case when a country’s positive regulation need equals its negative regulation need, it could manage its regulation by using electrochemical storage. If it wishes to use the stored energy within six hours, the application of Li-ion batteries is recommended, but if the time frame is 6–12 h, NaS or flow batteries (e.g., vanadium redox flow battery) can be the right solution.
As a conclusion, it was found that among the four researched countries, it was only Hungary where negative required energy regulation occurred, i.e., regarding the monitored PV systems only this country had surplus power compared to the forecasts. It is, of course, reasonable to utilize this negative required energy regulation, and power-to-gas technology offers a great solution for this, as it converts surplus electricity into gas. Hungary possesses a well-developed natural gas network, so the transportation of the gas thusly produced could be easily done too.

3.2. A Power-to-Gas Case Study of Hungary

According to the findings above, in Hungary approximately 3.6 GWh negative required energy regulation remains as a result of the regulation of a PV capacity of 100 MWp, if the negative and positive regulation is done by electrochemical technologies where possible. The quantity of the biomethane that could be produced with the help of 3.6 GWh negative required energy regulation in Hungary is shown in Table 3, in the case of PEME and biological methanation, assuming the use of the technology of the Power to Gas Hungary Ltd (Budapest, Hungary).
As it is seen in Table 3, 2,085,679 Nm3 of biomethane could be produced with the help of 40.6 GWh negative required energy regulation in Hungary. (The calculations were based on the performance data of Hungary’s only existing power-to-gas plant, which can produce 97.5 GJ biomethane using 0.1 MW of electrical power by biological methanation and PEME [88]). Based on the Hungarian PV capacities monitored in the ENTSO-E, the above amount of electric energy would have been necessary for the monitored PV systems to follow the forecasts efficiently already in 2020.
Under the Hungarian regulations, there is no such thing as biomethane that is transported by pipeline. Thus, in the calculations the net 0.34 EUR/Nm3 retail price of natural gas was used, which is paid by a metered customer with consumption below 20 m3/h at an exchange rate of 350 HUF/EUR. As a result, it was found that natural gas used for keeping the forecasts in Hungary in a value of EUR 709,131 could be replaced regarding the monitored PV capacities.
However, Hungarian agriculture also produces a considerable amount of byproduct, which is not utilized entirely. Some of this is used for making biogas but not with the necessary efficiency, so the methane content of the gas is low, typically only around 40%. For combustion in a gas engine, a methane content of approximately 60% is normally needed. Because of its high methane concentration (approx. 98%), the biomethane produced using the power-to-gas technology is suitable for improving (and thusly preparing for use) the biogas from agriculture, which is usually of poor quality, i.e., with a low methane content.
The approximately 2.1 million Nm3 biomethane (Table 3) that could be produced potentially in Hungary could be used to enrich about 4 million Nm3 biomethane that only has a 40% methane content to a 60% methane content. Thus, the 4 million Nm3 agricultural or landfill gas, so far unused or commonly flared, could be converted from waste into a byproduct, since the utilization of this amount of biogas would be also possible in the future. This means the enrichment and improvement of the end product of approximately 4–6 average-size biogas plants producing low-quality gas to a useful or marketable quality.

4. Conclusions

This paper examined the actual PV power generation and the corresponding intraday forecasts in the four Visegrad countries recorded in the ENTSO-E database and monitored by the regionally responsible TSOs. In the case of the Czech Republic and Slovakia, 60-min, while in the case of Hungary and Poland, 15-min forecast data were available. For better comparability, the need for regulation was calculated for a PV system of a capacity of 100 MWp. After examining the PV capacities monitored by the individual countries’ TSOs, it was found that besides the positive and negative regulations of equal absolute values (which are best balanced by the use of electrochemical energy storage), there is negative required energy regulation for the PV systems only in the case of Hungary with an energy amount of 3.6 GWh. In the case of the other three nations (Poland, Slovakia and the Czech Republic) keeping the forecasts of the monitored PV capacities required positive power regulation, which can be done by using natural gas power plants primarily. All this means that, in Hungary, the inclusion of a flexible consumer in the required power regulation process is necessary for keeping the forecasts. In the authors’ opinion, this consumer could be a power-to-gas plant in an optimal case, and it could even produce up to 2.1 million Nm3 biomethane by using the negative required energy regulation.
Considering that Hungary is rich in low-efficiency (typically around 40%) biogas plants, this 2.1 million Nm3 biomethane could improve and make fit for utilization the end product of 4–6 average-size biogas plants by enriching it to nearly 60%.
The investigation clearly pointed out that, among the countries of the Visegrad Four, it is Hungary where it is worthwhile and necessary to link the existing PV capacities to power-to-gas plants. The results, of course, do not mean that in the other three Visegrad countries (Slovakia, Poland and the Czech Republic) it is impossible to establish power-to-gas plants; they simply indicate that for the Hungarian PV capacities recorded in the ENTSO-E system and monitored by the local TSOs there is more need for power-to-gas plants than in the other countries.

Author Contributions

G.P. conceived, designed and performed the main experiments. The author has read and agreed to the published version of the manuscript.

Funding

This research was funded by Szechenyi 2020 under the EFOP-3.6.1-16-2016-00015.

Conflicts of Interest

The author declares no conflict of interest.

Abbreviations

The following abbreviations are used in this manuscript:
a-SiAmorphous silicon
EUEuropean Union
ENTSO-EEuropean Network of Transmission System Operators for Electricity
EPSElectric Power System
HREMHybrid Renewable Energy Microgrid
m-SiMonocrystalline silicon
NaSNatrium-Sulfur
PVPhotovoltaic
PEMEPolymer Electrolyte Membrane Electrolysis
p-SiPolycrystalline silicon
PVGISJRC Photovoltaic Geographical Information System
TSOTransmission System Operator
VREVariable renewable energy

References

  1. SolarPower Europe. Global Market Outlook for Solar Power; SolarPower Europe: Brussels, Belgium, 2019. [Google Scholar]
  2. REN21. Renewable Energy Policy Network for the 21st Century. In Renewables 2019 Global Status Report—REN21; REN21: Paris, France, 2019. [Google Scholar]
  3. Rodríguez, R.A.; Becker, S.; Andresen, G.B.; Heide, D.; Greiner, M. Transmission needs across a fully renewable European power system. Renew. Energy 2014, 63, 467–476. [Google Scholar] [CrossRef] [Green Version]
  4. Bertsch, J.; Growitsch, C.; Lorenczik, S.; Nagl, S. Flexibility in Europe’s power sector—An additional requirement or an automatic complement? Energy Econ. 2016, 53, 118–131. [Google Scholar] [CrossRef] [Green Version]
  5. Cho, A. Energy’s tricky tradeoffs. Science 2010, 329, 786–787. [Google Scholar] [CrossRef] [PubMed]
  6. Jacobson, M.Z.; Delucchi, M.A. Providing all global energy with wind, water, and solar power, Part I: Technologies, energy resources, quantities and areas of infrastructure, and materials. Energy Policy 2011, 39, 1154–1169. [Google Scholar] [CrossRef]
  7. Szabó, D. Solar Technologies: Energy Storage Is Installed by the Utility (Napelemek: Energiatárolókat Telepít a Közműszolgáltató). Available online: https://www.napi.hu/magyar_vallalatok/napelemek_energiatarolokat_telepit_a_kozmuszolgaltato.674558.html (accessed on 28 October 2020).
  8. Fülöp, M. The First Domestic Public Energy Storage Unit Is Operating (Működik az első hazai közcélú energiatároló egység). Available online: https://www.villanylap.hu/hirek/4904-mukodik-az-elso-hazai-kozcelu-energiatarolo-egyseg (accessed on 28 October 2020).
  9. Cochran, J.; Bird, L.; Heeter, J.; Arent, D.J. Integrating Variable Renewable Energy in Electric Power Markets: Best Practices from International Experience; National Renewable Energy Lab.(NREL): Golden, CO, USA, 2012. [Google Scholar]
  10. ENTSO-E. TYNDP 2018—Scenario Report. Available online: https://tyndp.entsoe.eu/tyndp2018/scenario-report (accessed on 28 October 2020).
  11. Blanco, H.; Faaij, A. A review at the role of storage in energy systems with a focus on Power to Gas and long-term storage. Renew. Sustain. Energy Rev. 2018, 81, 1049–1086. [Google Scholar] [CrossRef]
  12. European Commission. Clean Energy for All Europeans; European Commission. Available online: https://ec.europa.eu/energy/topics/energy-strategy/clean-energy-all-europeans_en (accessed on 28 October 2020).
  13. National Renewable Energy Laboratory (NREL). Exploration of High-Penetration Renewable Electricity Futures; National Renewable Energy Laboratory (NREL): Golden, CO, USA, 2012; Volume 1. [Google Scholar]
  14. National Renewable Energy Laboratory (NREL). Renewable Electricity Generation and Storage Technologies; National Renewable Energy Laboratory (NREL): Golden, CO, USA, 2012. [Google Scholar]
  15. Hesse, H.; Schimpe, M.; Kucevic, D.; Jossen, A. Lithium-Ion Battery Storage for the Grid—A Review of Stationary Battery Storage System Design Tailored for Applications in Modern Power Grids. Energies 2017, 10, 2107. [Google Scholar] [CrossRef] [Green Version]
  16. Schimpe, M.; Piesch, C.; Hesse, H.; Paß, J.; Ritter, S.; Jossen, A. Power Flow Distribution Strategy for Improved Power Electronics Energy Efficiency in Battery Storage Systems: Development and Implementation in a Utility-Scale System. Energies 2018, 11, 533. [Google Scholar] [CrossRef] [Green Version]
  17. Aneke, M.; Wang, M. Energy storage technologies and real life applications—A state of the art review. Appl. Energy 2016, 179, 350–377. [Google Scholar] [CrossRef] [Green Version]
  18. Han, X.; Liao, S.; Ai, X.; Yao, W.; Wen, J. Determining the Minimal Power Capacity of Energy Storage to Accommodate Renewable Generation. Energies 2017, 10, 468. [Google Scholar] [CrossRef] [Green Version]
  19. Zsiborács, H.; Hegedűsné Baranyai, N.; Vincze, A.; Háber, I.; Pintér, G. Economic and Technical Aspects of Flexible Storage Photovoltaic Systems in Europe. Energies 2018, 11, 1445. [Google Scholar] [CrossRef] [Green Version]
  20. Strbac, G.; Aunedi, M.; Pudjianto, D.; Djapic, P.; Teng, F.; Sturt, A.; Jackravut, D.; Sansom, R.; Yufit, V.; Brandon, N. Strategic Assessment of the Role and Value of Energy Storage Systems in the UK Low Carbon Energy Future; Imperial College London: London, UK, 2012. [Google Scholar]
  21. European Commission. EU Reference Scenario 2016; European Commission: Brussels, Belgium, 2016. [Google Scholar]
  22. International Hydropower Association. 2017 Key Trends in Hydropower; International Hydropower Association: London, UK, 2017. [Google Scholar]
  23. International Renewable Energy Agency IRENA. Renewable Energy Capacity Statistics 2017; International Renewable Energy Agency IRENA: Abu Dhabi, UAE, 2017. [Google Scholar]
  24. Sandia National Laboratories. DOE Global Energy Storage Database. Office of Electricity Delivery & Energy Reliability. Available online: https://www.energystorageexchange.org/ (accessed on 28 October 2019).
  25. Union of the Electricity Industry–EURELECTRIC. Hydro in Europe: Powering Renewables Full Report; Union of the Electricity Industry: Brussels, Belgium, 2011. [Google Scholar]
  26. Gimeno-Gutiérrez, M.; Lacal-Arántegui, R. Assessment of the European potential for pumped hydropower energy storage based on two existing reservoirs. Renew. Energy 2015, 75, 856–868. [Google Scholar] [CrossRef]
  27. Mantzos, L.; Matei, N.A.; Mulholland, E.; Rózsai, M.; Tamba, M.; Wiesenthal, T. Joint Research Centre Data Catalogue. JRC-IDEES 2015. Available online: https://data.jrc.ec.europa.eu/dataset/jrc-10110-10001 (accessed on 28 October 2020).
  28. PANNON Pro Innovations Ltd. Practical Experiences of PV and Storage Systems n.d. Available online: https://ppis.hu/hu (accessed on 28 October 2019).
  29. International Hydropower Association. Pumped Storage Tracking Tool n.d. Available online: https://www.hydropower.org/hydropower-pumped-storage-tool (accessed on 28 October 2019).
  30. International Hydropower Association. Hydropower Status Report 2016; International Hydropower Association: London, UK, 2016. [Google Scholar]
  31. Gyalai-Korpos, M.; Zentkó, L.; Hegyfalvi, C.; Detzky, G.; Tildy, P.; Hegedűsné Baranyai, N.; Pintér, G.; Zsiborács, H. The Role of Electricity Balancing and Storage: Developing Input Parameters for the European Calculator for Concept Modeling. Sustainability 2020, 12, 811. [Google Scholar] [CrossRef] [Green Version]
  32. International Renewable Energy Agency. Electricity Storage and Renewables: Costs and Markets to 2030; International Renewable Energy Agency: Abu Dhabi, UAE, 2017. [Google Scholar]
  33. Zsiborács, H.; Baranyai, N.H.; Vincze, A.; Zentkó, L.; Birkner, Z.; Máté, K.; Pintér, G. Intermittent Renewable Energy Sources: The Role of Energy Storage in the European Power System of 2040. Electronics 2019, 8, 729. [Google Scholar] [CrossRef] [Green Version]
  34. Igazságügyi Minisztérium. Magyar Közlöny, 2019; évi 222. Szám; Igazságügyi Minisztérium: Budapest, Hungary, 2019. [Google Scholar]
  35. Kordmahaleh, A.A.; Naghashzadegan, M.; Javaherdeh, K.; Khoshgoftar, M. Design of a 25 MWe Solar Thermal Power Plant in Iran with Using Parabolic Trough Collectors and a Two-Tank Molten Salt Storage System. Int. J. Photoenergy 2017, 2017, 1–11. [Google Scholar] [CrossRef] [Green Version]
  36. Noman, A.M.; Addoweesh, K.E.; Alolah, A.I. Simulation and Practical Implementation of ANFIS-Based MPPT Method for PV Applications Using Isolated Ćuk Converter. Int. J. Photoenergy 2017, 2017, 3106734. [Google Scholar] [CrossRef] [Green Version]
  37. Daliento, S.; Chouder, A.; Guerriero, P.; Pavan, A.M.; Mellit, A.; Moeini, R.; Tricoli, P. Monitoring, Diagnosis, and Power Forecasting for Photovoltaic Fields: A Review. Int. J. Photoenergy 2017, 2017, 1356851. [Google Scholar] [CrossRef]
  38. Sefa, İ.; Demirtas, M.; Çolak, İ. Application of one-axis sun tracking system. Energy Convers. Manag. 2009, 50, 2709–2718. [Google Scholar] [CrossRef]
  39. REN21. Renewables 2018 Global Status Report—REN21; REN21: Paris, France, 2018. [Google Scholar]
  40. Nengroo, S.; Kamran, M.; Ali, M.; Kim, D.-H.; Kim, M.-S.; Hussain, A.; Kim, H.; Nengroo, S.H.; Kamran, M.A.; Ali, M.U.; et al. Dual Battery Storage System: An Optimized Strategy for the Utilization of Renewable Photovoltaic Energy in the United Kingdom. Electronics 2018, 7, 177. [Google Scholar] [CrossRef] [Green Version]
  41. Turner, J.A. A realizable renewable energy future. Science 1999, 285, 687–689. [Google Scholar] [CrossRef] [PubMed] [Green Version]
  42. Lin, A.; Lu, M.; Sun, P.; Lin, A.; Lu, M.; Sun, P. The Influence of Local Environmental, Economic and Social Variables on the Spatial Distribution of Photovoltaic Applications across China’s Urban Areas. Energies 2018, 11, 1986. [Google Scholar] [CrossRef] [Green Version]
  43. Liu, Z.; Wu, D.; Yu, H.; Ma, W.; Jin, G. Field measurement and numerical simulation of combined solar heating operation modes for domestic buildings based on the Qinghai–Tibetan plateau case. Energy Build. 2018, 167, 312–321. [Google Scholar] [CrossRef]
  44. Alsafasfeh, M.; Abdel-Qader, I.; Bazuin, B.; Alsafasfeh, Q.; Su, W.; Alsafasfeh, M.; Abdel-Qader, I.; Bazuin, B.; Alsafasfeh, Q.; Su, W. Unsupervised Fault Detection and Analysis for Large Photovoltaic Systems Using Drones and Machine Vision. Energies 2018, 11, 2252. [Google Scholar] [CrossRef] [Green Version]
  45. Hosenuzzaman, M.; Rahim, N.A.; Selvaraj, J.; Hasanuzzaman, M.; Malek, A.B.M.A.; Nahar, A. Global prospects, progress, policies, and environmental impact of solar photovoltaic power generation. Renew. Sustain. Energy Rev. 2015, 41, 284–297. [Google Scholar] [CrossRef]
  46. Roth, W. General Concepts of Photovoltaic Power Supply Systems; Fraunhofer Institute for Solar Energy Systems ISE: Freiburg, Germany, 2005; pp. 1–23. [Google Scholar]
  47. Kumar Sahu, B. A study on global solar PV energy developments and policies with special focus on the top ten solar PV power producing countries. Renew. Sustain. Energy Rev. 2015, 43, 621–634. [Google Scholar] [CrossRef]
  48. Elavarasan, R.M. The Motivation for Renewable Energy and its Comparison with Other Energy Sources: A Review. Eur. J. Sustain. Dev. Res. 2018, 3, em0076. [Google Scholar] [CrossRef]
  49. Zsiborács, H.; Pályi, B.; Pintér, G.; Popp, J.; Balogh, P.; Gabnai, Z.; Pető, K.; Farkas, I.; Baranyai, N.H.; Bai, A. Technical-economic study of cooled crystalline solar modules. Sol. Energy 2016, 140. [Google Scholar] [CrossRef] [Green Version]
  50. Benick, J.; Richter, A.; Muller, R.; Hauser, H.; Feldmann, F.; Krenckel, P.; Riepe, S.; Schindler, F.; Schubert, M.C.; Hermle, M.; et al. High-Efficiency n-Type HP mc Silicon Solar Cells. IEEE J. Photovolt. 2017, 7, 1171–1175. [Google Scholar] [CrossRef]
  51. Cosme, I.; Cariou, R.; Chen, W.; Foldyna, M.; Boukhicha, R.; i Cabarrocas, P.R.; Lee, K.D.; Trompoukis, C.; Depauw, V. Lifetime assessment in crystalline silicon: From nanopatterned wafer to ultra-thin crystalline films for solar cells. Sol. Energy Mater. Sol. Cells 2015, 135, 93–98. [Google Scholar] [CrossRef]
  52. Green, M.A.; Emery, K.; Hishikawa, Y.; Warta, W.; Dunlop, E.D. Solar cell efficiency tables (version 48). Prog. Photovolt. Res. Appl. 2016, 24, 905–913. [Google Scholar] [CrossRef] [Green Version]
  53. International Energy Agency Technology Roadmap Solar Photovoltaic Energy, 2014th ed.; International Energy Agency: Paris, France, 2014; pp. 1–60.
  54. Krempasky, J. Semiconductors, Questions & Answers; Technical Publishing House: Budapest, Romania, 1977. [Google Scholar]
  55. Panasonic Corporation. Solar Cell Achieves World’s Highest Energy Conversion Efficiency of 25.6% at Research Level; Panasonic Corporation: Kadoma City, Japan, 2014. [Google Scholar]
  56. Verlinden, P.; Deng, W.; Zhang, X.; Yang, Y.; Xu, J.; Shu, Y.; Quan, P.; Sheng, J.; Zhang, S.; Bao, J. Strategy, development and mass production of high-efficiency crystalline Si PV modules. In Proceedings of the 6th World Conference on Photovoltaic Energy Conversion, Kyoto, Japan, 23–27 November 2014. [Google Scholar]
  57. Zsiborács, H.; Pályi, B.; Baranyai, H.N.; Veszelka, M.; Farkas, I.; Pintér, G. Energy performance of the cooled amorphous silicon photovoltaic (PV) technology. Idojaras 2016, 120, 415–430. [Google Scholar]
  58. Green, M.A.; Dunlop, E.D.; Levi, D.H.; Hohl-Ebinger, J.; Yoshita, M.; Ho-Baillie, A.W.Y. Solar cell efficiency tables (version 54). Prog. Photovolt. 2019, 1–11. [Google Scholar] [CrossRef]
  59. SecondSol Inc. New and Used PV Module Prices. Available online: https://www.secondsol.com/de/index.htm (accessed on 28 October 2020).
  60. Kondo, M.; Yoshida, I.; Saito, K.; Matsumoto, M.; Suezaki, T.; Sai, H.; Matsui, T. Development of Highly Stable and Efficient Amorphous Silicon Based Solar Cells. In Proceedings of the 28th European Photovoltaic Solar Energy Conference and Exhibition, Paris, France, 30 September–4 October 2013; WIP: Villepinte, France, 2013; pp. 2213–2217. [Google Scholar]
  61. ÖKO-HAUS GmbH. Information on the Prices of a-Si Solar Modules, Price Quotation. Available online: https://www.oeko-haus.com/ (accessed on 28 October 2020).
  62. Enjavi-Arsanjani, M.; Hirbodi, K.; Yaghoubi, M. Solar Energy Potential and Performance Assessment of CSP Plants in Different Areas of Iran. Energy Procedia 2015, 69, 2039–2048. [Google Scholar] [CrossRef] [Green Version]
  63. Manoj Kumar, N.; Chopra, S.S.; Chand, A.A.; Elavarasan, R.M.; Shafiullah, G.M. Hybrid renewable energy microgrid for a residential community: A techno-economic and environmental perspective in the context of the SDG7. Sustainability 2020, 12, 3944. [Google Scholar] [CrossRef]
  64. Statista, I. Cumulative Solar Photovoltaic Capacity Globally as of 2017, by Select Country (in Gigawatts). 2018. Available online: https://www.statista.com/statistics/264629/existing-solar-pv-capacity-worldwide/ (accessed on 28 October 2019).
  65. Vokas, G.A.; Zoridis, G.C.; Lagogiannis, K.V. Single and Dual Axis PV Energy Production over Greece: Comparison Between Measured and Predicted Data. Energy Procedia 2015, 74, 1490–1498. [Google Scholar] [CrossRef] [Green Version]
  66. Eke, R.; Senturk, A. Performance comparison of a double-axis sun tracking versus fixed PV system. Sol. Energy 2012, 86, 2665–2672. [Google Scholar] [CrossRef]
  67. Solargis.com. Solar Resource Maps and GIS Data for 200+ Countries. 2017. Available online: https://solargis.com/maps-and-gis-data/overview (accessed on 28 October 2020).
  68. Bai, A.; Popp, J.; Balogh, P.; Gabnai, Z.; Pályi, B.; Farkas, I.; Pintér, G.; Zsiborács, H. Technical and economic effects of cooling of monocrystalline photovoltaic modules under Hungarian conditions. Renew. Sustain. Energy Rev. 2016, 60, 1086–1099. [Google Scholar] [CrossRef] [Green Version]
  69. Scarlat, N.; Dallemand, J.F.; Fahl, F. Biogas: Developments and perspectives in Europe. Renew. Energy 2018, 129, 457–472. [Google Scholar] [CrossRef]
  70. Kampman, B.; Leguijt, C.; Scholten, T.; Tallat-Kelpsaite, J. Optimal Use of Biogas from Waste Streams: An Assessment of the Potential of Biogas from Digestion in the EU Beyond 2020; European Commission: Brussels, Belgium, 2017. [Google Scholar]
  71. Siddiqui, S.; Zerhusen, B.; Zehetmeier, M.; Effenberger, M. Distribution of specific greenhouse gas emissions from combined heat-and-power production in agricultural biogas plants. Biomass Bioenergy 2020, 133, 105443. [Google Scholar] [CrossRef]
  72. Garcia, N.H.; Mattioli, A.; Gil, A.; Frison, N.; Battista, F.; Bolzonella, D. Evaluation of the methane potential of different agricultural and food processing substrates for improved biogas production in rural areas. Renew. Sustain. Energy Rev. 2019, 112, 1–10. [Google Scholar] [CrossRef]
  73. Götz, M.; Lefebvre, J.; Mörs, F.; McDaniel Koch, A.; Graf, F.; Bajohr, S.; Reimert, R.; Kolb, T. Renewable Power-to-Gas: A technological and economic review. Renew. Energy 2016, 85, 1371–1390. [Google Scholar] [CrossRef] [Green Version]
  74. Bailera, M.; Lisbona, P.; Romeo, L.M.; Espatolero, S. Power to Gas projects review: Lab, pilot and demo plants for storing renewable energy and CO2. Renew. Sustain. Energy Rev. 2017, 69, 292–312. [Google Scholar] [CrossRef]
  75. Martin, M.R.; Fornero, J.J.; Stark, R.; Mets, L.; Angenent, L.T. A single-culture bioprocess of methanothermobacter thermautotrophicus to upgrade digester biogas by CO2-to-CH4 conversion with H2. Archaea 2013, 2013. [Google Scholar] [CrossRef] [PubMed] [Green Version]
  76. Simonis, B.; Newborough, M. Sizing and operating power-to-gas systems to absorb excess renewable electricity. Int. J. Hydrogen Energy 2017, 42, 21635–21647. [Google Scholar] [CrossRef]
  77. Ghaib, K.; Ben-Fares, F.Z. Power-to-Methane: A state-of-the-art review. Renew. Sustain. Energy Rev. 2018, 81, 433–446. [Google Scholar] [CrossRef]
  78. Csedő, Z.; Zavarkó, M. The role of inter-organizational innovation networks as change drivers in commercialization of disruptive technologies: The case of power-to-gas. Int. J. Sustain. Energy Plan. Manag. 2020, 28, 53–70. [Google Scholar] [CrossRef]
  79. Natural Gas Transmission—Our Businesses—MOLGroup. Available online: https://molgroup.info/en/our-business/natural-gas-transmission/natural-gas-transmission-1 (accessed on 23 October 2020).
  80. Hungarian Government. National Energy Strategy 2030; Hungarian Government: Budapest, Hungary, 2012.
  81. Elia Group Solar-PV Power Generation Data. 2020. Available online: https://www.elia.be/en/grid-data/power-generation/solar-pv-power-generation-data (accessed on 11 September 2020).
  82. Hungarian Transmission System Operator—MAVIR ZRt. PV Power Generation, Estimation and Fact Data. 2020. Available online: http://mavir.hu/web/mavir/naptermeles-becsles-es-teny-adatok (accessed on 11 September 2020).
  83. European Network of Transmission System Operators for Electricity (ENTSO-E). ENTSO-E Transparency Platform. Available online: https://transparency.entsoe.eu/dashboard/show (accessed on 11 September 2020).
  84. Hungarian Transmission System Operator—MAVIR ZRt. Transparency. Available online: https://www.mavir.hu/web/mavir/eromuvi-termeles-forrasok-megoszlasa-szerint-netto-elszamolasi-meresek-alapjan1 (accessed on 11 September 2020).
  85. EUR-Lex—32019R0943-EN-EUR-Lex. Available online: https://eur-lex.europa.eu/legal-content/EN/TXT/?uri=CELEX%3A32019R0943 (accessed on 23 October 2020).
  86. National Legislation Database, H. 389/2007; (XII. 23.) Government Regulation. Available online: http://njt.hu/cgi_bin/njt_doc.cgi?docid=112846.354226 (accessed on 18 October 2019).
  87. Zsiborács, H.; Hegedűsné Baranyai, N.; Zentkó, L.; Mórocz, A.; Pócs, I.; Máté, K. Electricity Market Challenges of Photovoltaic and Energy Storage Technologies in the European Union: Regulatory Challenges and Responses. Appl. Sci. 2020, 10, 1472. [Google Scholar] [CrossRef] [Green Version]
  88. Csedő, Z.; Sinóros-Szabó, B.; Zavarkó, M. Seasonal Energy Storage Potential Assessment of WWTPs with Power-to-Methane Technology. Energies 2020, 13, 4973. [Google Scholar] [CrossRef]
Figure 1. The photovoltaic power potentials of the V4 countries [67].
Energies 13 06408 g001
Figure 2. A Hungarian example to illustrate the deviation of real PV power generation and intraday forecast data in the case of a monitored 1196 MWp PV system, 8 September 2020 [81].
Energies 13 06408 g002
Figure 3. The total regulation amounts in the Visegrad countries necessary for 100 MWp PV systems in the period of 1 September 2019 to 31 August 2020.
Energies 13 06408 g003
Figure 4. The balance of the negative and positive required energy regulation in the Visegrad countries in the period of 1 September 2019 to 31 August 2020.
Energies 13 06408 g004
Table 1. Intraday photovoltaic (PV) forecast data in the Visegrad countries [83,84].
CountryAvailability of PV ForecastData Resolution (min)
Czech RepublicIntraday PV forecast data are available60
Hungary15
Poland15
Slovakia60
Table 2. The monitored PV capacities of the Visegrad countries [83,84].
CountrySize of the Monitored PV Capacity (MWp)
1 September 201931 August 2020
Czech Republic20542061
Hungary10131129
PolandNDA1928
Slovakia409450
Table 3. Characteristics of the gas produced by the power-to-gas procedure.
CharacteristicsDimensionValue
Monitored PV in HungaryMWp1129
Surplus energy (rest from the regulation)MWh/100 MWp3600
Total surplus energy in Hungary for 1129 MWp monitored PV systemMWh40,644
Produced biomethaneMJ79,256
Produced biomethaneNm32,085,679
Publisher’s Note: MDPI stays neutral with regard to jurisdictional claims in published maps and institutional affiliations.

