1. Introduction
A development of renewable energy sources has become a crucial sector of power industry in modern Europe. Rising awareness about environmental consequences caused by excessive usage of fossil fuels has provoked EU authorities to introduce restrictions in CO
2 generation and emission. At the same time grid solutions which include distributed power generation systems have become a widely considered alternative to centralized power production. Small wind turbines (SWTs) have gradually gained popularity as a solution for individual customers, just next to photovoltaic and solar installations. It has been proven that SWT installations can be sufficient for household requirements without exerting any significant impact on weather or environmental conditions [
1].
The wind turbines which are officially referred to as “small” can widely vary in their size and output power. It can be assumed that all the devices producing from a few watts up to tens of kilowatts of electrical energy match the definition. In terms of rotor dimensions, the diameter of 10 m used to be considered the upper end of the small wind turbine range [
2]. Nowadays, the limit of turbines which are considered small, as described in standard IEC 61400-2, is determined by less than 200 m
2 of the rotor swept area and approximately 50 kW of the power generated at a voltage below 1000 VAC or 1500 VDC [
3].
Various methods can be used to assess performance of SWT devices, including experimental and numerical analysis. Wind tunnel tests open a possibility to investigate operation of turbines under controlled conditions. However, to test properly the aerodynamic properties of an investigated object, it is necessary to provide wind tunnel conditions similar to the operating flow parameters [
4]. Moreover, when elementary principles of aerodynamic testing are considered, a flow section of the tunnel should be large enough to prevent excessive blockage effects [
5]. As a result, examination of the majority of rotors would require a facility of considerable space, due to their diameter. Thus, significant costs emerge, often making the early-stage experimental approach unprofitable despite its undisputed research value.
Depending on the wind turbine rotor size, aerodynamic properties of a full-scale, or scaled model can be tested. Experiments in scale are used not only for empirical investigations of single turbines [
6,
7,
8,
9], but also to evaluate performance of whole wind farms [
10,
11,
12]. Diminution of the model under testing requires implementation of flow similitude laws in order to obtain reliable data. A real object and its scaled model meet similitude criterion if they share geometric, kinematic, and dynamic similarity. In practice, the dynamic similarity is assessed by comparing specific dimensionless numbers, associated with a particular physical phenomenon. Depending on the ratio between inertia forces and viscous forces in a fluid (represented by a dimensionless Reynolds number), a character of the flow varies between laminar, transitional, and turbulent. All three types determine different physical phenomena that can be expected to occur during the fluid flow. The preservation of the Reynolds number value is therefore the primary criterion of similitude in low-speed (Ma < 0.3) wind tunnel testing [
4]. However, in particular research, it is impossible to provide sufficiently high ranges of Re numbers. Then, procedures such as airfoil modification can be implemented to simulate a steady-state behavior of large-scale rotors [
13]. In spite of hindrances that appear, wind tunnel tests performed on scaled models make the experimental approach widely affordable and less risky compared to field studies [
10]. Moreover, current growth of 3D printing technologies allows one to prepare and modify prototypes rapidly, with no delay for planned tests [
14,
15].
Wind tunnel experiments are often combined with computational analysis of the wind turbine. Among numerical tools, one can list basic solutions based on the blade element momentum (BEM) theory and complex 3D flow simulations employing CFD (computational fluid dynamics) software. BEM calculations are oftentimes considered to be the standard approach for the daily-basis applications. Even though full CFD simulations cannot be denied their accuracy, the BEM-based assessment requires significantly less time, resources and financing, still granting reliable sets of data. Numerical analysis implementing CFD Reynolds-averaged Navier–Stokes (RANS) equations is often recommended as an expletive step, to gain more detailed data on rotor aerodynamics, such as regions of the flow separation around the blade [
16]. BEM-based simulations are widely used as the only numerical solution when combined with an experimental approach to examine global performance of the wind turbine [
6]. Moreover, particular investigations have shown a very high correlation between the results obtained throughout CFD and BEM simulations [
17,
18], thus proving that full 3D-flow computations are not necessary for an initial analysis of the rotor aerodynamic performance.
BEM scripts are helpful not only during aerodynamic analysis, but also in the blade design process. In the case of small wind turbines, a properly built blade geometry is especially crucial for an effective operation of the device. Depending on expected tip speed ratio ranges, BEM-based optimization equations can be employed to determine the overall chord distribution along the mid and tip span [
19], whereas the blade twist is often calculated on the basis of velocity triangles and airfoil properties [
20]. Besides, much more complex design methods can be found, for instance a semi-empirical approach of P. Fuglsang and H.A. Madsen, with the defined objective of energy cost minimization [
21].
Small wind turbines are often required to operate in Reynolds number ranges below 200,000. Such conditions cause significant issues with lift force generation, regardless of selected airfoil. Available measurements depict how the performance of low Reynolds airfoils deteriorates when affected by Re = 150,000 or Re = 100,000 [
22], making such conditions inconvenient and difficult to predict on an early stage of rotor design. Thus, an iterative approach is often required to obtain satisfactory prototype. The paper presents how an aerodynamic performance of the SWT can be considerably increased solely by blade geometry redesign. The procedure of aerodynamic analysis was conducted with low resource-demanding methods, proposing a path which is easily applicable in the wind turbine industry. The selected methods are a practical implementation of previously developed “Fast Track” procedure [
14], where a prototype rotor is designed, manufactured, and analyzed within 24 h, opening opportunity for an iterative approach to SWT development.
The current article attempts to respond to the pursuit of a fast and robust methodology for SWT design and analysis. The authors summarize the outcomes of this process on a case study reference object—generative urban small turbine (GUST) horizontal-axis SWT prototype. The research was performed in order to assess the robustness of the BEM method in a case of a very small wind turbine, operating at accordingly low Reynolds number. While similar studies concentrate mostly on the plain optimization outcomes, the present research tries to explore the underlying flow phenomena, pertinent to the low-Re conditions, and provides the observations and conclusions as a system of good practices in the SWT design. To the knowledge of the authors, this kind of analysis is rarely performed for SWTs in general, and for this low a Re (below 100,000 in the small scale analysis) in particular.
2. Blade Geometry Calculations
The enhanced blade geometry was prepared for an existing SWT prototype (
Figure 1), initially built by GUST team from Lodz University of Technology. The 1.6 m rotor was designed to operate with the constant TSR = 5 and with its rated wind speed set at 8.4 m/s. The prototype was suitable especially for suburban areas surrounding city agglomerations.
The design procedure started with assessment of the selected airfoil ability to generate a lift force. The mid and tip span of the blade were built upon the Wortmann FX 63-137 airfoil. The developed blade was predicted to operate in the range of Reynolds numbers between Re = 80,000 and Re = 140,000. Those values were included in the initial airfoil analysis. Polar charts visible in
Figure 2 were assessed with the XFOIL code [
23]. The left chart depicts a correlation between the lift coefficient
Cl and the airfoil angle of attack
α. The values plotted in the right chart represent changes in the lift-to-drag ratio
Cl/Cd depending on the angle of attack as well. The main objective of the analysis was to determine the
α value with the possibly highest
Cl/Cd ratio for the whole Reynolds number range. Additionally, the
Cl value should be maintained low enough not to reach a stall region [
24] for the whole Re range. In the linear region (before stall) the drag is kept at a relatively low level. Nearing to the stall, the drag becomes more significant; thus, even though after the stall conditions the lift remains at rather high and constant level, the sudden increase in drag values contribute to decay in
Cl/Cd. Eventually,
Cl = 1.45 for
α = 6.5° was chosen as the rated point.
The number of design cross-sections and their radial placement were initially retained analogically to the geometry details of the reference blade. A new blade conceptual shape was divided into equally spaced sections, due to which BEM-based calculation methods could be introduced.
Values of the design wind speed
V = 8.4 m/s (in this case equal to the rated wind speed) and the desired global tip speed ratio TSR = 5 were a result of the blade adjustment to the existing wind turbine prototype. Even though a certain wind speed is set as the nominal value, the device could operate under different conditions. The tip speed ratio was therefore a crucial parameter that needed to be maintained consistent to ensure the maximal power output regardless of the current wind speed [
25]. Design calculations were, however, performed for a specific point of the turbine working range, which was considered the most characteristic of the assumed environmental conditions prevailing in suburban areas.
For both the values (
V and TSR) maintained constant, a certain rotational speed
ω of the blades, equal to 52.36 rad/s (equivalent to 500 rpm), is implied as a result of Equation (1) calculated for the design wind speed and radial position of the blade’s tip. On the basis of those parameters, local tip speed ratios could be determined for each cross-section suspended on particular radial positions
ri with the following equation:
Due to the fact that the revolving movement of the rotor entails local changes in the air inflow speed and direction, a relative wind speed
Vri for every blade section under consideration [
19] should be determined with the formula:
The chord distribution along the blade was calculated with the Betz optimization equation (see Equation (3)), which presumes that drag forces could be negligible [
19]. As Wortmann FX 63-137 is a high-lift airfoil [
26], that assumption was acceptable.
On the basis of the calculations provided by Biadgo et al. [
20], it was possible to find a correlation between the optimal relative wind inflow angle
φopt and the local tip speed ratio. The presented form of the dependence results directly from the BEM equations (see Equation (4)). As stated by the authors, there are no limitations concerning airfoil types to which the reduced formula could be applied [
20].
The twist
θi distribution along the blade was determined from the velocity triangle scheme of the rotating airfoil section with Equation (5). The method once again was based on solutions proposed in [
20]. The angle described in the equation as
αdesign is the angle of attack which was determined basing on XFOIL polars.
All the conducted calculations yielded the chord length and twist values determined for each separate blade cross-section. As the implemented methods were not suitable for the blade root region [
19], three sections placed closest to the hub were neglected in the described calculations. A different airfoil, NACA 0024, was used for the blade root to increase thickness of the outline and improve mechanical strength of the whole blade [
27]. A 3D CAD model of the designed geometry is depicted in
Figure 3.
3. Overview of Research Methods
The prototype SWT was originally equipped with a set of blades which are later referred to as the “REF geometry”. The adjusted geometry, whose step-by-step design procedure was described in
Section 2, is referred to as the “FX”.
Both of the examined geometries were studied numerically, with application of the BEM-based tool and experimentally, with implementation of the wind tunnel test in scale, 3D printing, and rapid prototyping. The wind tunnel experiment was treated as a numerical model validation.
The computational analysis utilized XFOIL generated airfoil characteristics as an input data for the BEM calculations. Such an approach requires increased prudence in result interpretation, especially during calculations of low Re ranges. Research provided by Morgado et al. shows satisfactory accuracy of XFOIL predictions comparing to experiments conducted for Re = 200,000 [
28]. On the other hand, examinations conducted by Mack et al. resulted in visible discrepancies in experimental and XFOIL results for Reynolds numbers of 64,200 and 137,000 [
29]. Inaccuracy of XFOIL calculations for airfoils operating at very low Re conditions, if treated as an only mean of assessment, may cause significant mistakes in blade design process. If considered as the unaccompanied method of aerodynamic analysis, it is recommended to provide high-quality experimental characteristics of airfoil lift and drag coefficients as an input for BEM simulations to provide accuracy of numerical method [
30].
However, an alternative approach to XFOIL low Reynolds analysis was implemented in this paper. Scheme of the procedure was extensively based on “Fast Track” method [
14], enforcing iterative low-resource numerical estimations, rapid prototyping, and experimental examination of scaled 3D-printed rotor. The mentioned approach combines preparation of numerical model of a rotor, manufacturing of its geometry by means of a 3D printing method, and testing it in an in-house wind tunnel. The entire procedure can be performed in 24 h (with the manufacturing stage during the night). The proposed process allows one to determine the most promising sets of rotor blades within a short time. Owing to this, it significantly reduces the amount of individual subsequent examinations [
14]. In such an attitude BEM simulation is treated as an approximation and indication, where XFOIL calculations are sufficient to proceed to further steps. Immediate experimental validation of overall rotor performance allows to identify potential numerical inaccuracies. The main advantage of this approach is that it enables one to adapt and modify the designed geometries quickly, as experimental results arrive, without the need to generate detailed, resource-demanding flow simulations. The presented methodology can be considered as the integration of numerical and experimental methods, with two approaches effectively overlapping in time, with constant data exchange. Eventually, the numerical–experimental integration could be expanded for further works, such as optimization for particular wind conditions or size/power criteria [
14].
The procedure is graphically described in
Figure 4. After the enhanced blade design prepared, both REF and FX geometries were initially analyzed with the same BEM-based software in 1:1 scale. Having obtained the results, the evaluation was made if the newly prepared blade geometry was likely to improve turbine performance or if the second iteration of the design process should be conducted with modifications in blade geometry (twist angles, chord lengths, etc.). If the design was auspicious (depending on assumed criterion; in the presented study potential gain in
Cp value), the procedure was followed in wind tunnel tests in scale 1:4. Due to such an approach, it was possible to avoid an excessive usage of the wind tunnel facility, thus minimizing the process costs. Simultaneously to the wind tunnel tests, the numerical representations of the compared geometries were scaled to the experimental model size and recalculated to obtain validation data.
Validation of the computational method was performed under much more demanding aerodynamic conditions (low Reynolds flow regime, on average between 20,000 and 80,000) than the expected operational range of the full-scale prototype, where Re values exceed 100,000. In the latter case, an increased Reynolds number tends to provide airfoil stabilization compared to the case of diminished models. Thus, it was concluded that if the small-scale analysis proves high accuracy of the numerical predictions corresponding to the experiment, it can be presumed that the results computed for a full-scale prototype are also reliable.
3.1. BEM and XFOIL Numerical Calculations
The classical Blade Element Momentum Theory allies results of the actuator disc assumptions [
31], which describe physical parameters around the rotor in general, with a discretized system of equations. Main calculations are executed for a rotor model with an infinite number of blades. Real parameters, such as an actual blade number and their geometrical characteristics, are employed as mathematical corrections in the formulas [
16]. All numerical calculations were performed with the QBlade software [
32], which combines multiple wind turbine assessment tools, including BEM and XFOIL. The blade geometry, divided into particular cross-sections and prepared for BEM simulations, can be seen in
Figure 5.
For an appropriate BEM implementation, the blade geometry was automatically divided into a defined number of cross sections, each of them built upon a certain airfoil with a specified chord length and a twist angle. For every blade section, two main parameters, axial
a and tangential
a’ induction factors (see Equations (6) and (7)), were calculated iteratively [
32].
In the given formulas, the symbols
Ct and
Cn represent the tangential and normal force coefficients, respectively. These two values depend mainly on aerodynamic forces affecting the airfoil, the chord length and the relative wind speed. Therefore, the data describing lift and drag values under certain flow conditions are required for every particular blade cross-section. In the mentioned case, the information on lift and drag coefficients was implemented from XFOIL datasets which had been prepared for airfoils appearing in the blade design. The value of the inflow angle
Φ results from velocity triangles, where the relative wind direction and the angle of attack need to be known. An estimation of the induction factors starts with the values initially assumed by the solver software, usually equal to 0. Values of the inflow angle
Φ and the angle of attack
α are disclosed firstly. Lift and drag forces are then calculated on the basis of the XFOIL characteristics. The obtained values are then used to evaluate new induction factors, which are compared to the initial ones. Iterative calculations of the particular section finalize on the basis of the user-defined convergence criterion [
14,
32].
Due to very low Reynolds number range, it was necessary to consider boundary layer transition in the course of XFOIL simulations. Occurrence of laminar-to-turbulent transition in the airfoil boundary layer flow was controlled with the value of NCrit number, where NCrit = 9 is recommended for standard simulations of wind tunnel operation. Concept of NCrit parameter results from e
n-method, where early boundary layer transition is predicted throughout occurrence of Tollmien–Schlichting waves [
33].
3.2. Experiment in Scale
The analyzed blade sets were investigated experimentally in 1:4 scale (0.4 m of diameter), utilizing flow similitude principles. Reynolds number values are the main criterion of flow similarity in wind tunnel tests [
4]. Due to limitations in scaled rotor size, it was possible to reach Re values up to about 80,000, which is the lower limit of the prototype operational range. The measurements were carried out for the wind velocities of 14 and 16 m/s. The highest wind speed provided in the measurements (16 m/s) corresponded to the full-scale wind turbine working at the wind speed of 4 m/s. Scale of the test rotor model was limited by blockage effects in an open section wind tunnel.
Each set of the tested blades was prepared as 3D-printed elements in ABS material, manufactured in the FDM technology (see
Figure 6a). The selected method of production significantly shortened the time required to prepare the experiment. Moreover, the technology was in accordance with full-scale blades. The prototype rotor parts were 3D-printed as well, with the SLA method. An original connection between the blade and the hub was redesigned (
Figure 6b) due to diminished dimensions of the whole rotor.
The tests were conducted in an open-jet wind tunnel facility at the Institute of Turbomachinery, Lodz University of Technology (depicted in
Figure 7). Air flow is generated with a centrifugal fan, which was powered with a 55 kW asynchronous motor. The circular outlet of the wind tunnel (diameter equal to
D = 0.8 m) leads air to the test section. The maximal obtainable wind speed is approximately equal to 18 m/s, indicating a low speed operation of the objects under testing (below Mach number 0.3).
The test stand (see
Figure 8) consisted of a rotor with exchangeable blade sets, which was mounted on the shaft and connected through the bearing unit with a torquemeter and a motor/generator device. The rotor plane of rotation was in the distance of 1 m downstream of the outlet section. The whole setup was additionally placed on a force plate, which allowed one to gain additional information on the forces affecting the rotor.
The current rotational speed was measured with the torquemeter. The electrical circuit of the stand was connected to a group of batteries, with current and voltage gauges attached, so that the power generated during the experiment was controlled and accumulated. The wind tunnel test section was equipped with atmospheric pressure, temperature, and relative humidity sensors. A Prandtl-type Pitot tube was placed at the tunnel outlet to assess wind speed on the basis of measurements of the dynamic pressure. The measurements were conducted at constant wind speeds, whereas the rotational speed of the blades was increased with a certain step. Movement of the rotor was enforced by a motor/generator device, which was powered with circuit batteries. All the data were collected by a digital acquisition system.
The wind speed in the test section was assessed via differential pressure measurements from a Prandtl-type Pitot probe. Air density, which was required to calculate the wind speed, was determined separately for each of the measured points on the characteristics. Such a solution was necessary to compensate for changes in thermodynamic parameters during the measurement session [
34], which would indirectly affect the wind speed values. The mechanical power output of the wind turbine was calculated with the measured rotor torque and rotational speed.
In each measurement, the data were collected as 32,768 samples, with the acquisition rate equal to 1000 Hz. An introductory part of the data analysis consisted of the calculation of mean values and uncertainty for measurements of the power coefficient and the tip speed ratio. As both parameters were measured indirectly, a law of error propagation was implemented [
35]. Two types of uncertainty were included in the evaluation. Type A was used to assess statistical events in the data set for each measurement, whereas type B allowed one to depict effects of chosen data collection devices [
34].
4. Results and Discussion
4.1. Full-Scale Geometry Assessment
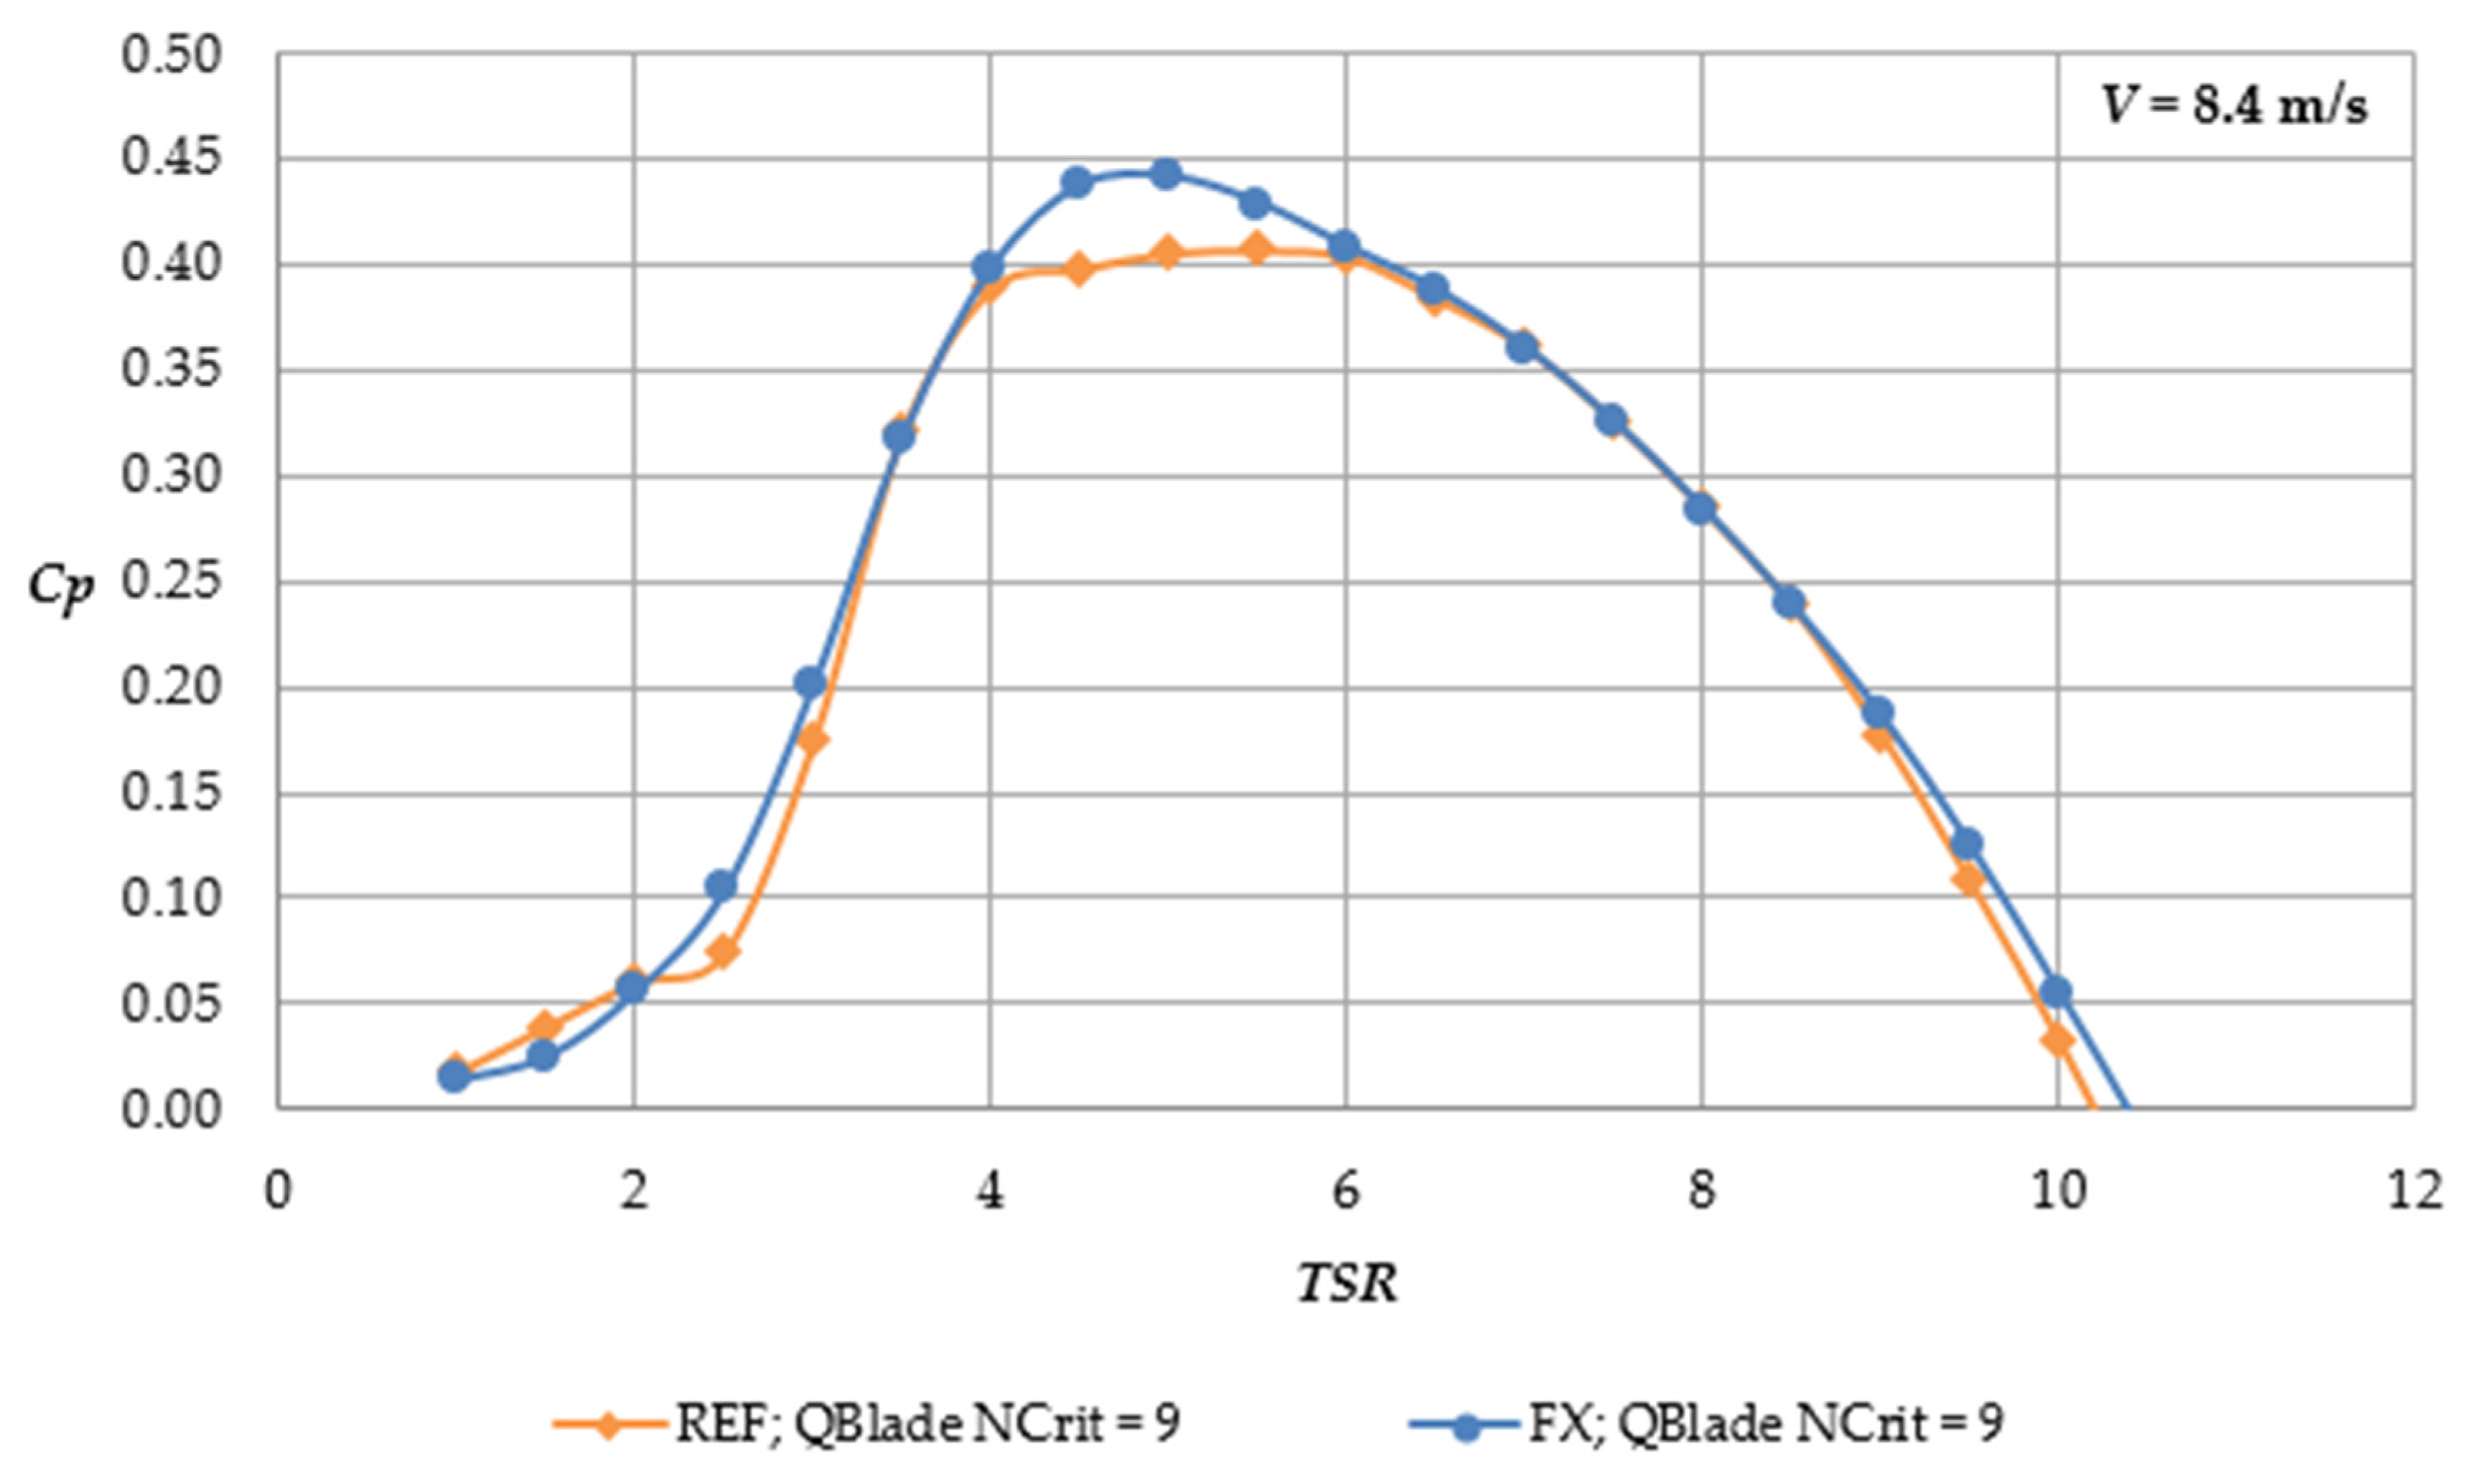
The results analysis and discussion section cover only the final iteration of “Fast Track” procedure. Two of the compared geometry examinations were conducted with the same simulation setup, including corrections for tip and root losses. In both cases, the wind speed was set as a constant value of 8.4 m/s, whereas the TSR was increased from 0 to 11, as an outcome of the varying rotational speed of the rotor. An agreement in settings of two models allows one to assume that discrepancies in the obtained results are entirely a consequence of differences in the computed aerodynamic performances of distinct blade geometries.
According to the simulations, the recently designed FX blade geometry provided the rotor with a higher maximal power coefficient (see
Figure 9). The power coefficient value increased by 7.3% compared to the maximum for the reference geometry, granting
Cp equal to 0.44 for the rated point (TSR = 5). The maximal value of
Cp for the reference blades appeared for the tip speed ratio equal to 6, which is a higher value than the claimed design maximum at TSR = 5. The curve shape, however, seems to be visibly flattened around the operational point of the turbine. Thus, the newly designed geometry seems to be a solution which is more specialized for particular conditions and can significantly increase the turbine performance if the operation requirements are maintained.
4.2. Numerical and Experimental Analysis of Scaled Models
The results of examinations in 1:4 scale were grouped with respect to the wind speed. Numerical analysis of the scaled blades was initially carried out for the XFOIL polars generated at NCrit = 9, just like in the case of full-scale simulations. Later on, the BEM simulations were repeated with the input XFOIL polars recomputed for NCrit = 5, to simulate airfoil operation with enhanced boundary layer transition. Both sets of numerical results are visible in collective plots (
Figure 10 and
Figure 11), along with the experimental data.
It can be seen that the values of the NCrit parameter selected during the XFOIL airfoil analysis have a crucial impact on final results in the case where scaled rotors are simulated. At the Reynolds number values exceeding Re = 100,000, the probability that the flow in the airfoil boundary layer is turbulent rises. The described condition takes place in the full-scale numerical analysis of both rotor blades, making the default NCrit = 9 appropriate for the rotor curve to develop an expected shape. Values of Re numbers as low as those reached by fourfold smaller geometries can be followed by less predictable flow in boundary layer due to the possible transition. It is most likely that such an airfoil would be exposed to the boundary flow in between laminar and turbulent, encountering difficulties with lift force generation. A planned operation of the airfoil at very low Reynolds numbers can be provided by enforcing a proper boundary layer transition such as in the larger-scale solutions [
36]. In the case of numerical calculations, it is recommended to lower the NCrit to simulate the behavior of the enforced boundary layer transition [
37].
The overall behavior of both rotors changed significantly compared to the data computed in full-scale simulations. Both curves do not reach as high maximal Cp values as before, settling between 0.39 and 0.41 for the FX geometry and between 0.36 and 0.38 for the reference blades, depending on the wind speed. However, the percentile gain in the power coefficient value was equal to 7.9%, which is a very similar difference to the full-scale simulation outcome (7.3% in the Cp increase). One can, therefore, state that a relative Cp gain remained similar regardless of the numerical model scale.
Shapes of the Cp (TSR) curves obtained for the default NCrit did not follow an expected and typical trace (steep increase in Cp until the maximum at the optimum TSR, followed by gradual decline). This could mean that scaled geometries might face transitional flow phenomena, impairing the standard analysis. Nevertheless, even under such conditions, the simulation results indicate that the FX geometry blades are more likely to withstand changes in transition of the boundary layer in terms of preserving efficiency, since the Cp curve has a clear TSR region of optimal working regime.
The presented values of test results include corrections eliminating influences of the test stand on the torque measurement. In the case of both wind velocities, the test data reached values comparable to the simulations conducted with NCrit = 9. A decreased NCrit = 5 value allowed one to improve shapes of the power coefficient curves and conform them to full scale model results. On the other hand, NCrit = 9 represents the wind tunnel experiments, making data validation possible. The compared results suggest a good correlation between the experiment and the simulations. Some differences can be clearly noticed, however, the numerical predictions pinpointed the maximal Cp values and the corresponding tip speed ratios with satisfactory accuracy.
The TSR range for the reference geometry seems to be the major variance in the data. It is visibly overestimated by the BEM simulations, compared to the results of the wind tunnel experiment. A good correlation between values is visible for TSRs up to 5.6, with even an excellent agreement in the case of the wind speed
V = 14 m/s. The simulation was able to predict such details as a breakdown of the curve, present before TSR = 6 and the power coefficient maximum. The fact that the agreement is not good only for REF geometry indicates that this dissimilitude source is particularly connected with REF blade shape (and not the FX one). The reason might be a combination of two issues. The influence of flow velocity on
Cp (comparing
V = 14 m/s and
V = 16 m/s) suggests that the model subjected to low Reynolds experiences transitional flow resulting in non-physical
Cp curve behavior. It is expected that for higher flow velocities, this effect would be diminished. The disagreement might be also related to underperformance of an experimental model. The REF geometry operational range is significantly smaller than that of the FX blade. As the quality of model representation directly depends on the printing resolution, it could be crucial in regions with geometrical features such as the blade trailing edge or tip. Here, the rigidity of the blade is decreased (as there is relatively small amount of material). For increased TSR (>5) it results in a significant drop of performance, due to a blade deformation [
14].
For the conditions of the wind speed equal to 16 m/s, the breakdown of the experimental curve was not observed. However, the numerical analysis repeated its predictions about the operational range much wider than the experimental data indicated. In this case, an exact correlation of the lower tip speed ratio data was not observed, however both sets of results reached similar levels of values there.
The TSR overestimating effect did not happen for the FX geometry. The computational results for NCrit = 9 provided the curves which were comparable to both the diagram expected from the BEM theory and the obtained experimental points. No sudden decrease in Cp was observed in the simulation results. What is more, the experimental data seem to reach their maximal range very closely to the numerical predictions. Measurements and simulations of the FX geometry at the wind speed of 16 m/s resulted with nearly identical Cpmax values (0.295 for the tests and 0.300 for the simulations). Outlines of the 16 m/s characteristic curve were nearly identical, with only a slight shift of the experimental curve towards lower TSRs.
5. Conclusions
The proposed approach is a successful low resource method of SWT aerodynamic design and assessment. The connection of BEM numerical tools and small scale experiment allowed to perform an effective iterative path of prototype development. The performed rapid prototyping approach resulted in a final design which met the initial assumptions. Redesign of the blade geometry performed with “Fast Track” methods provided compelling gain of turbine power coefficient. Results of analysis were consistent in terms of rotor geometries performance comparison, giving an explicit indication of the design which should be considered for a full scale prototype. Thanks to rational and planned aerodynamic analysis performed in the initial stage of rotor development, it is possible to significantly reduce number of full scale geometries manufactured for final product tests.
Experimental validation of BEM model in scale showed that the selected numerical tool was sufficient to estimate maximum power coefficient and its corresponding TSR, regardless of blade geometry. Additionally, mutual dependences between compared designs, like percentile maximum Cp increase, were possible to be predicted. Such a range of information is adequate to make decisions concerning selection of blade geometry for particular conditions and for further, more thorough study. However, the described method of rapid analysis is not adequate to be considered self-contained and applied as a closing evaluation.
In an early stage of small wind turbine development, the combination of low resource numerical and experimental methods comprises a promising development tool. A carefully planned parallel numerical–experimental path enhances the SWT design and analysis process, comparing to each of the methods separately. Both approaches complement each other and, due to two way data collection, allow to minimize possible hindrances of low resource assessment methods. The combined process is cost efficient and enables rapid aerodynamic analysis, opening up a possibility for further development, like integration with automated iterative blade geometry optimization procedures. Examinations presented in the paper as a part of the case study showed that a singular iteration of the redesign process provided noticeable increase of the rotor’s power coefficient (10%). The analysis adequately utilizes aerodynamic data obtained in very low Re. Aerodynamic analysis of STWs operating with Reynolds numbers below 100,000 can be very demanding, mostly due to possible occurrence of boundary layer transition. Experimental validation implemented as a path parallel to the numerical simulations improves the study, whereas a low resource analysis criterion is still retained.
Obtained results suggested possible direction of authors’ supplementary research in the field of SWT aerodynamics. Observations made based on numerical computations with different NCrit values indicate that utilization of additional turbulization (here corresponding to NCrit = 5) could enhance the procedure of wind tunnel testing in small scale.


