Abstract
The most promising Polish region in terms of its geothermal resource potential is the Podhale Trough in the Inner West Carpathians, where the thermal water occurs in the Eocene-Mesozoic strata. The origin and conditions of formation of the chemical composition of the thermal water are different in a regional scale due to the impact of infiltrating water on the chemical compounds present in nearby thermal intakes, chemical processes responsible for the concentration of major elements and residence time. The article presents the regional conceptual model in regard to the factors controlling the chemistry of thermal water from Podhale Trough and the conditions of its exchange. It was allowed by performing the hydrogeochemical characteristics of studied water and analyzing its changes according to flow direction from HCO3-Ca-Mg type to SO4-Cl-Na-Ca and SO4-Ca-Mg types. The hydrogeochemical modelling was also made allowing identification of the impact of reservoir rocks on the formation of the chemical composition. For confirmation of the theories formulated and for more accurate interpretation of the results obtained from hydrogeochemical modelling, hydrochemical indices were calculated, i.e., rHCO3−/rCl−, rNa+/rCl−, rCa2+/rMg2+, rCa2+/(rCa2+ + rSO42−) and rNa+/(rNa+ + rCl−). The results revealed the most important processes evolving the chemistry of thermal water are progressive freshening of the thermal water reservoir, which in the past was filled with salty water, dissolution of gypsum, and ongoing dolomitization. Conducted research presents the important factors that in the case of increased exploitation of thermal water in the Podhale Trough, may influence the quality of thermal water in terms of its physical and chemical parameters.
1. Introduction
Thermal water as clean geothermal energy has become the object of great attention over the last few decades [1]. Its unique properties have been particularly appreciated by the energy, medical, balneological, and recreational sectors. Sustainable management of geothermal resources guarantees a long-term operation of the used system, and it depends on the water’s physicochemical properties. This requires good recognition of geological conditions and occurring processes [2,3,4,5,6,7,8].
Due to the geological setting conditions and geological history, the Carpathians remain an excellent place to look for thermal water. A search for hot raw material within this mountain-chain was conducted inter alia in Romania [9,10], Slovakia [11], and Hungary [12]. The results of the investigations ended with the finding out of thermal water with temperature in the range 40–90 °C at the outflow. The most promising Polish region in terms of its geothermal resource potential is the Podhale Trough in the Inner West Carpathians, where the thermal water occurs in the Eocene-Mesozoic strata [13]. The region has a well-developed infrastructure for heating, recreation and balneotherapy, which provides favorable conditions for the use of geothermal energy [14,15]. Until 2003, twelve geothermal wells were drilled, in which the thermal water were outflowing. Currently, nine wells are continuously used.
Hydrogeological conditions, especially porosity and permeability of the aquifer rocks, localization of the alimentation area, aquifuges, and water circulation conditions within the geothermal aquifer have the greatest impact on the occurrence, resources, renewability, and physicochemical properties of the thermal water. The formation of the chemical composition of thermal water is controlled by its circulation conditions in the aquifer. This process refers to concentration and composition of dissolved materials, depth and lithology of the aquifer, occurrence and migration of water, residence time and water/rock interactions including mixing with meteoric ones, ion exchange process, oxidation-reduction conditions, pressure, and temperature, as well as the possibility of microorganisms controlling geochemical processes [5,16,17]. Numerical modelling and analysis of the physicochemical composition of thermal water are helpful in predicting corrosion processes and scaling in geothermal systems [7,14,18,19].
For interpretation of the genesis of the chemical composition of mineral and thermal water multiple hydrogeochemical approaches can be used. For example, analysis of isotopes [20,21,22,23], analysis of chemical indicators [24,25,26], use of geothermometers [22,27,28], and modelling of water/rock interaction [7,29,30]. Development and application of numerous methods allow expanding the current knowledge about the ongoing processes in the deep interior of the Earth’s crust.
Hydrogeochemical characteristics of thermal water in the Podhale region have been the subject of many studies on their chemical composition, its stability [31,32,33,34,35,36], and circulation conditions [3,37,38,39]. Although the conducted research allowed for the determination of the conditions of water circulation or the hydrogeochemical characteristics of water from the individual wells, there are no regional studies that describe the genesis of this water in the current exploitation conditions. Witczak [40] indicates that the chemical composition of the thermal water of the Podhale reservoir reveals typical features of the process of freshening geothermal aquifer that was filled with sea water in the past. He describes that the last such period took place in the Paleogene and the seawater was associated with a sedimentation reservoir from the period of deposition of the Eocene carbonate series, and the Carpathian flysch. However, it should be noted that 20 years ago the exploitation and use of thermal water took place on a much smaller scale. The analysis carried out by Witczak [40] included seven geothermal wells, of which only three are currently in exploitation. The remaining ones are injection boreholes, or their work have been discontinued.
This article presents the regional conceptual model concerning factors controlling the chemistry of thermal water from Podhale Trough and the conditions of its exchange. Hydrogeochemical characteristics of studied water and hydrogeochemical modelling were performed to identify the role of reservoir rocks on the formation of the chemical composition. Moreover, selected hydrochemical indices (rHCO3−/rCl−, rCa2+/(rCa2+ + rSO42−), rNa+/(rNa+ + rCl−), rNa+/rCl− and rCa2+/rMg2+) were used to confirm the hypothesis about processes controlling the chemical composition of investigated thermal water. Statistical techniques such as bivariate correlation, linear regression, and principal component analyses were also used to illustrate the relationship between the major ions, as well as to secrete the processes affecting the diversity of the chemical composition of thermal water along their path flow.
2. Materials and Methods
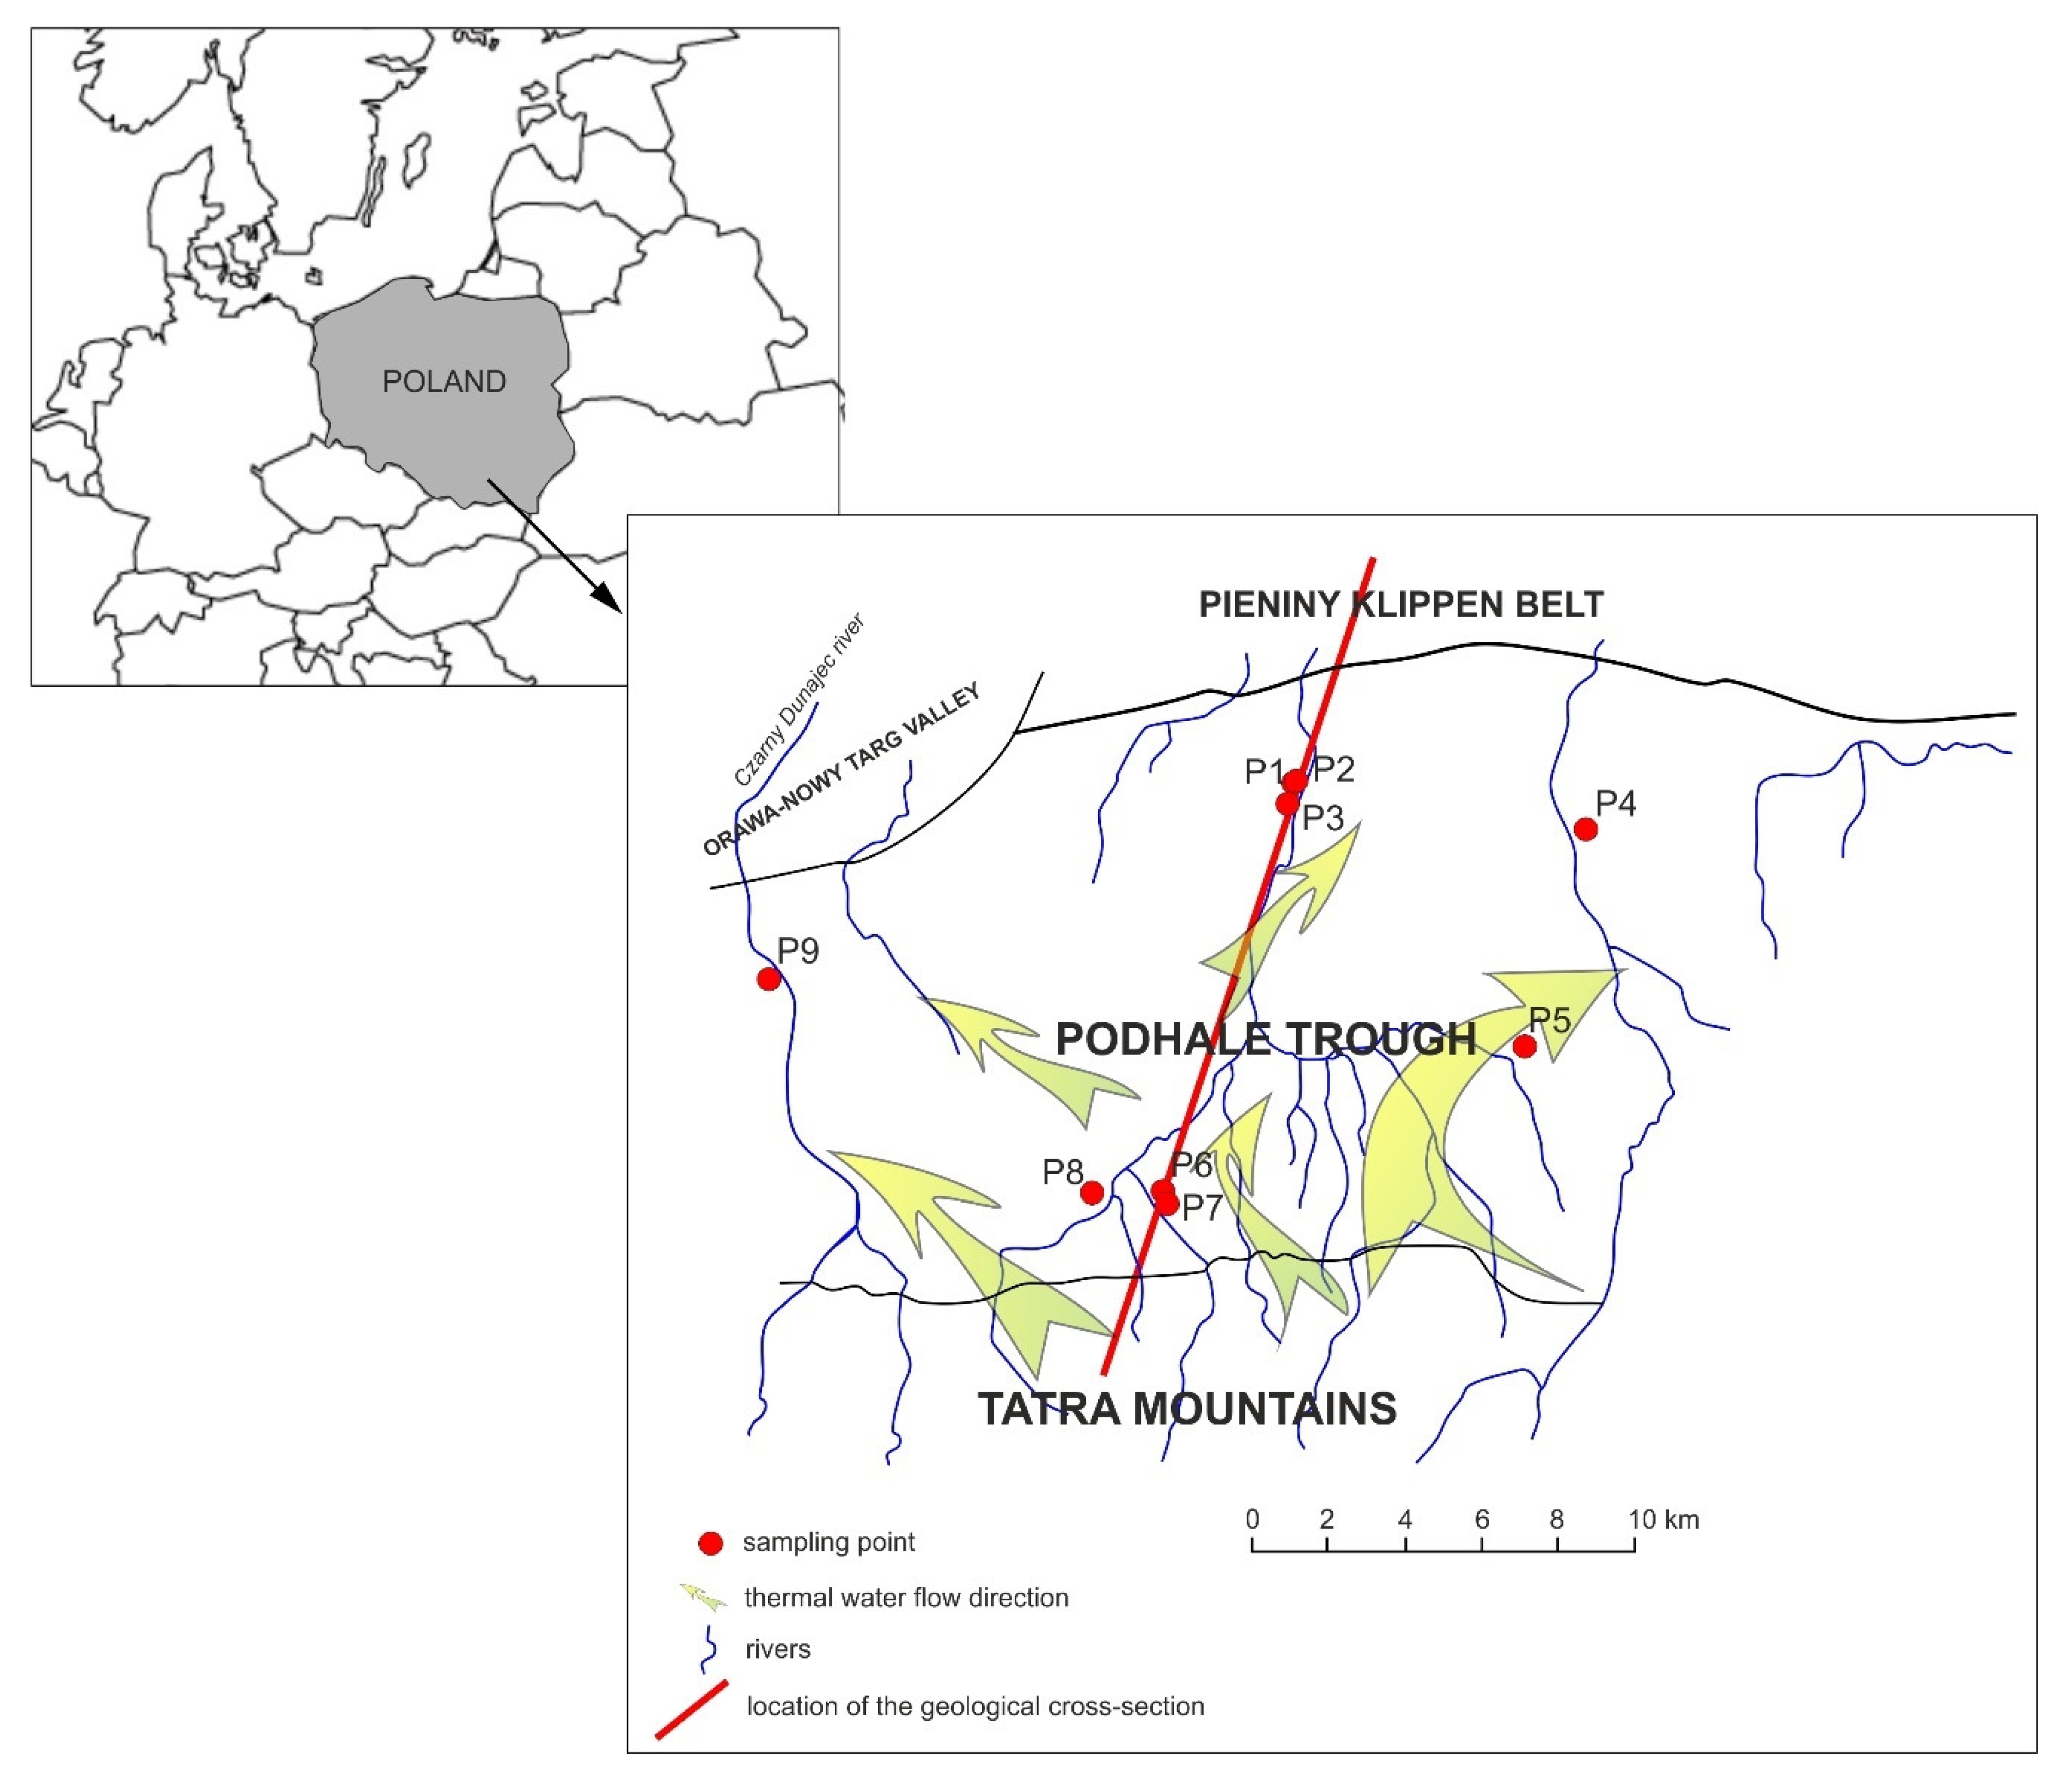
The research area is located in the Podhale Trough, between the Tatra Mountains and Pieniny Klippen Belt, southern Poland (Figure 1). It is the region of the most intensive use of thermal water in Poland. It is used for both heating and recreational purposes [15]. In Poland, for the groundwater to be considered as thermal water, it must meet the requirements of the Geological and Mining Law [41], where thermal water is defined as a mineral and is classified as groundwater which at outflow is characterized by the temperature, that has at least 20 °C.
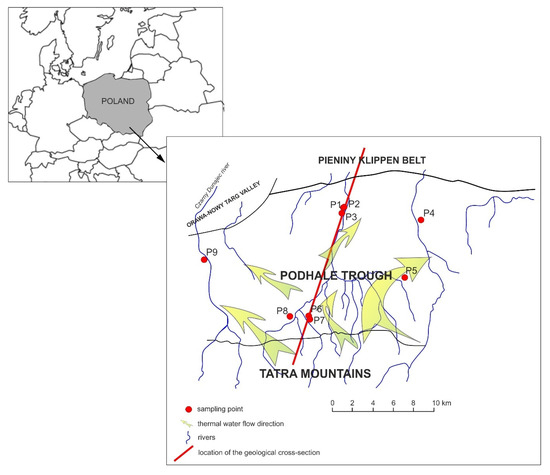
Figure 1.
Location of sampling points ([32] modified).
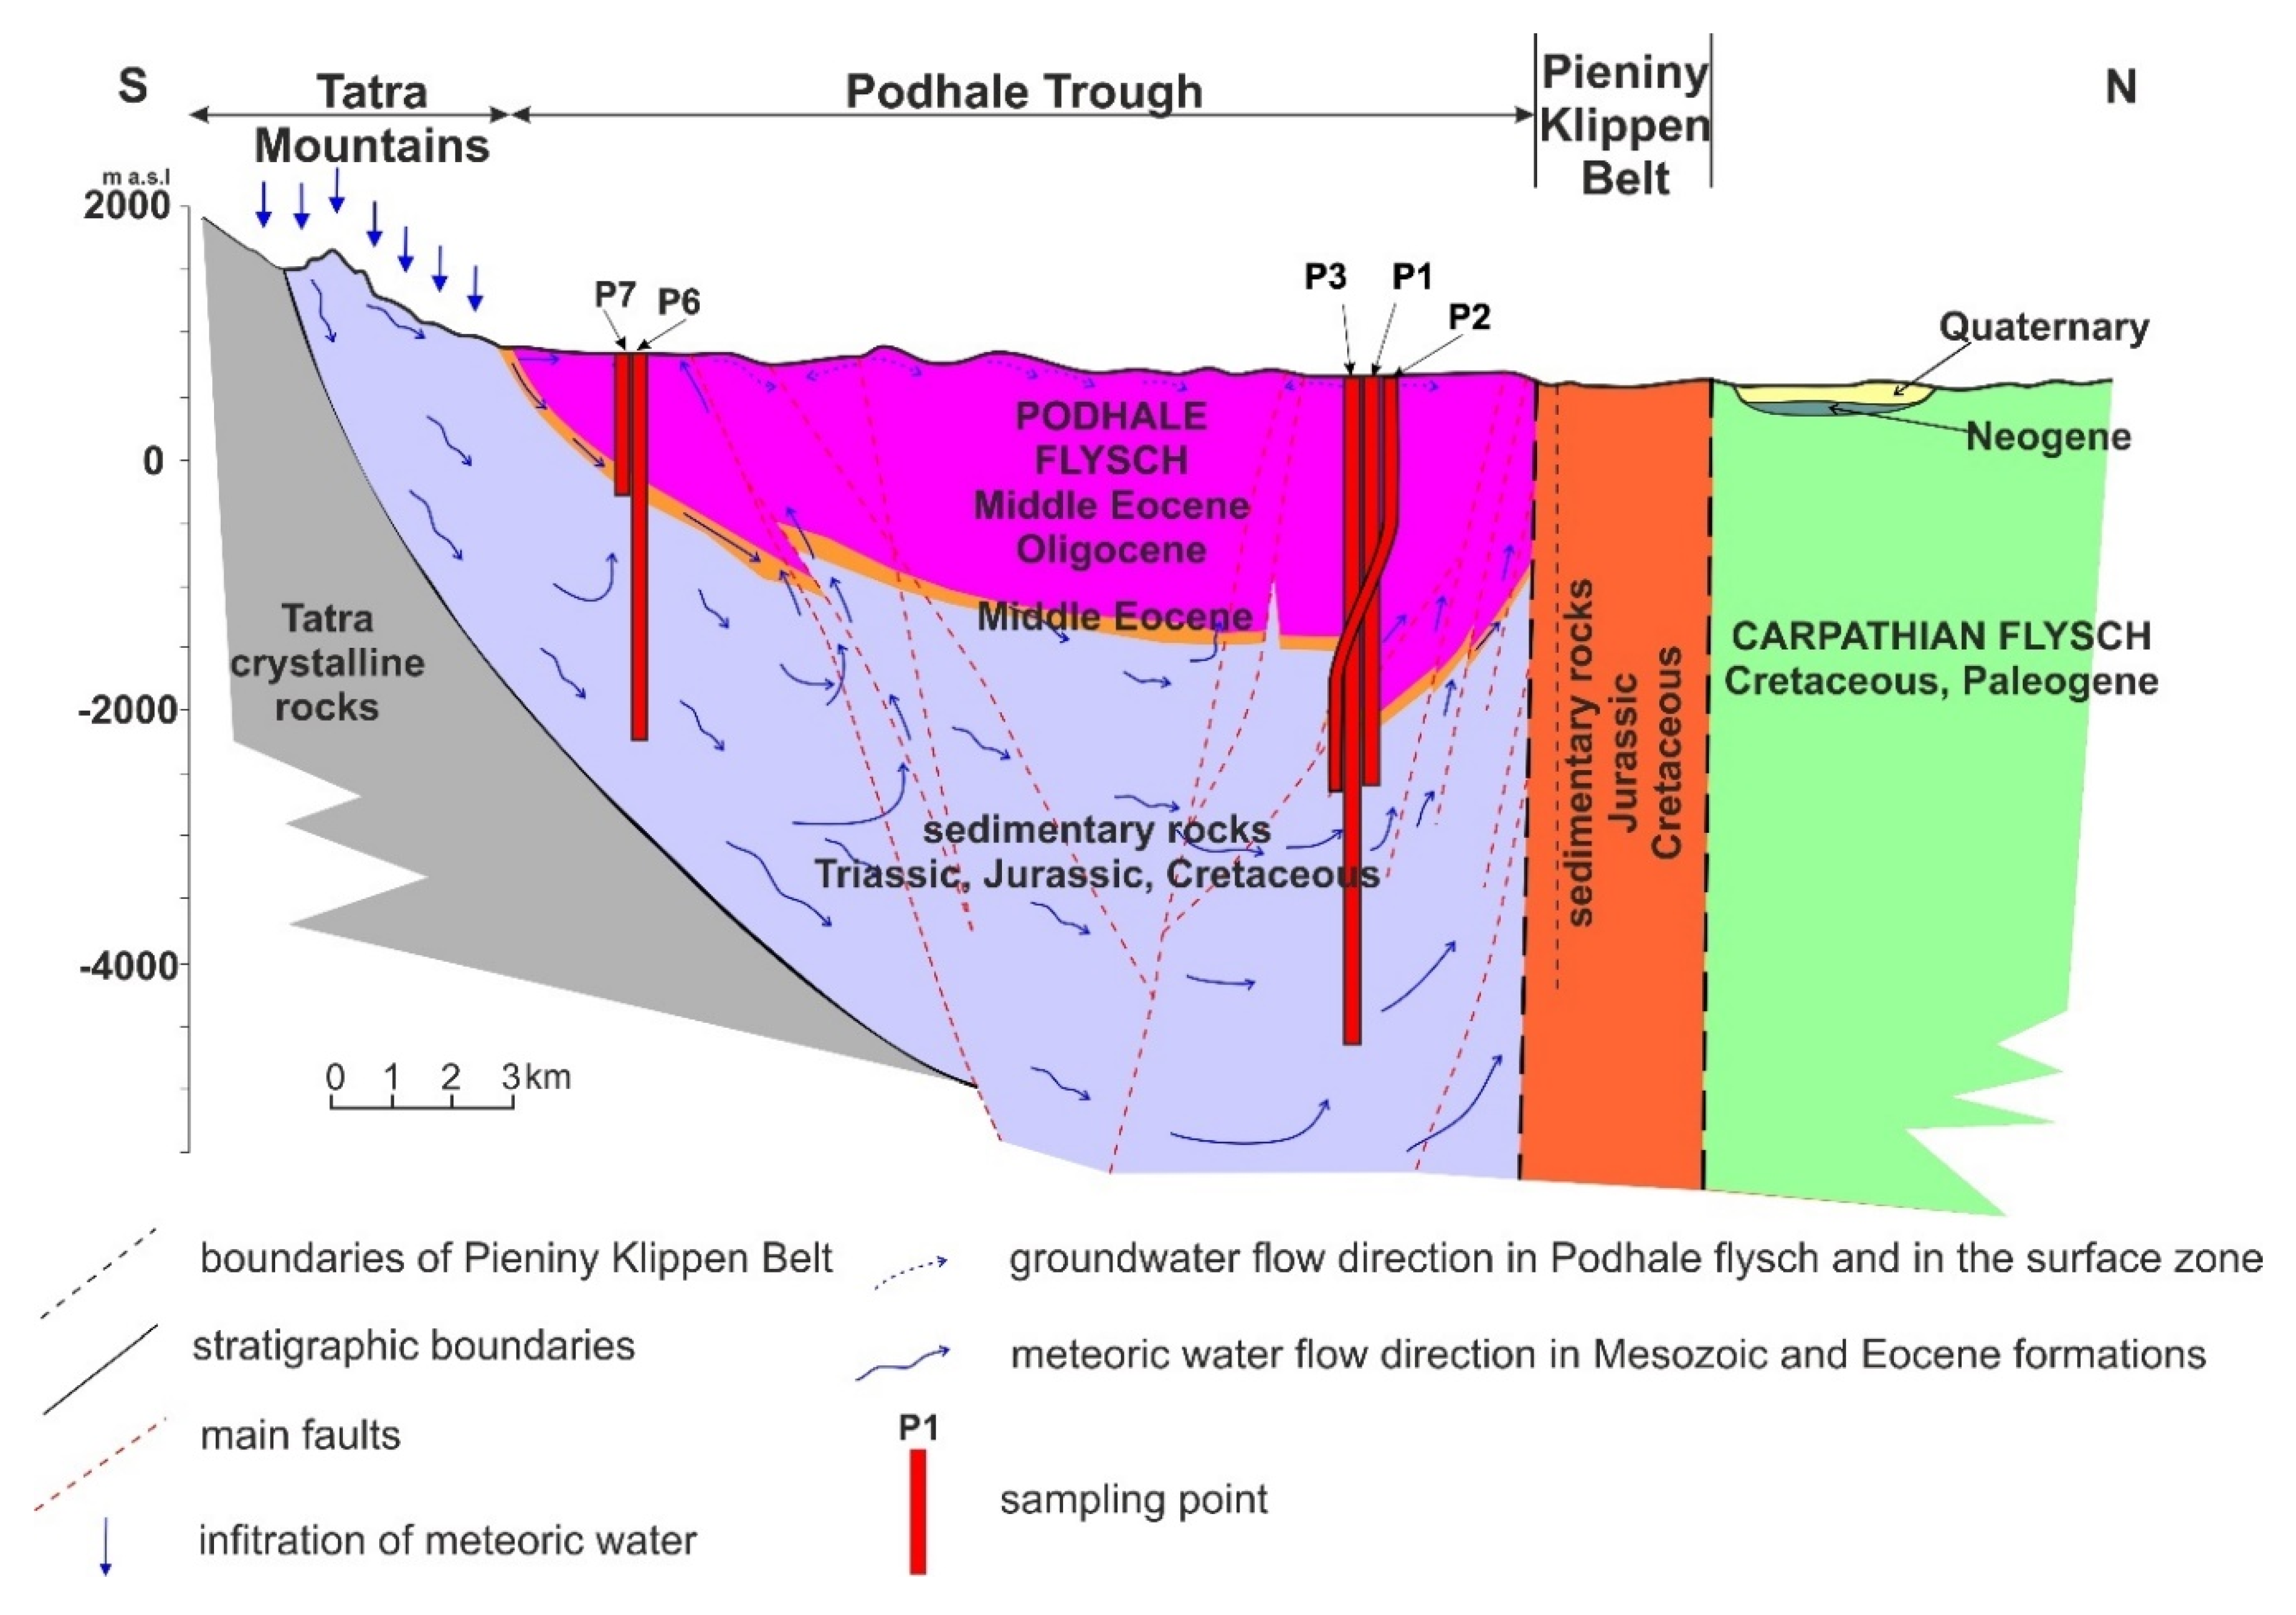
The Podhale thermal water reservoir is related to the carbonate series of the Middle Eocene. At its base are the Mesozoic formations—Middle Triassic limestones and dolomites as well as Jura sandstones and carbonate rocks [3,33,42,43]. The basin is closed to the North by the impenetrable Pieniny Klippen Belt (PKB) built of the flysch sediments and carbonate rocks of the Jurassic-Cretaceous-Paleogene-Neogene age (Figure 2). PKB is separated from the Podhale Trough by the dislocation zone (faults) and from the geological point of view it consists of several distinct tectonic-structural units [31,44]. The depth of boreholes exploiting thermal water is in the range of 1 km in the south part of Podhale Trough to 3.5 km in its northern part [45]. The recharge areas for the thermal water of the Podhale are the Mesozoic Tatra outcrops and Eocene carbonate formations located in the Tatra Mountains. About 10% of groundwater infiltrating in the recharge area flows farther north in the sub-flysch formations, fanning west and east. As a result, the groundwater flow rate decreases in the direction from south to the north of the Podhale Trough [37,40].
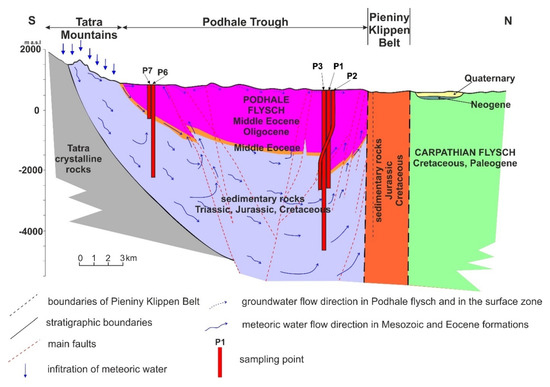
Figure 2.
Hydrogeological cross-section through the Podhale Trough ([32,37,45] modified).
The sampling and measurements were carried out in nine wells (Figure 1). Most of them exploit thermal water continuously. The exception is at the point P3 and P8, which exploit thermal water seasonally. The archival data conducted and collected during long-term monitoring (236 analyses from 2010 to 2019) was used for confirmation that the chemical composition of thermal water in the Podhale Trough is stable over time. The box-and-whisker plots were used to present the changes in the chemical composition of major ions during water monitoring. It was stated that the results obtained by the authors are in the range of the natural chemical composition variability (Figure S1—Supplementary Materials). Therefore, the presented research is based on the newest results.
Samples of thermal water were collected according to ISO 5667-11 standards [46] in July 2019. Before sampling, the geothermal wells were rinsed about 15 min to stabilize the chemical composition of thermal water and to avoid samples contamination with particles that could come from the geothermal installation system [47]. During fieldwork, the unstable parameters were also measured: pH, redox potential (Eh), electrical conductivity (EC), and temperature (T) in pursuance of actual standards [48,49,50]. All measurements were made with WTW Multi 3430 with electrodes specifically dedicated for thermal waters. The chemical composition (major ions and trace elements) has been determined by use of inductively coupled plasma mass spectrometry (ICP-MS, Elan 6100, Perkin Elmer) and inductively coupled plasma optical emission spectrometry (ICP-OES, OPTIMA 7200DV, Perkin Elmer) following the ISO 17294-2 and ISO 11885 standards [51,52]. Titration methods were applied for the determination of chlorides, bicarbonates and sulphides concentration [53,54,55]. The nitrogen forms were measured with the use of the spectrophotometric method following the manufacturer’s procedures (HACH). Chemical analyses have been checked by calculating the ionic charge balance error. The results that were obtained from laboratory investigations were further used to elaborate on the hydrogeochemical characteristic of thermal water and for hydrogeochemical modelling, as well as for calculation of the hydrochemical indices that are helpful in the interpretation of water chemical composition origin and formation. In addition, the fM index was calculated on the basis of the archival and the newest data. This index can be approximately measure of the total dissolved solids in the water while the electrical conductivity value is known.
The statistical analyses including calculation of r Pearson correlation coefficient, analysis of linear regression and principal component analysis were carried out using PS IMAGO PRO© software provided by Predictive Solutions with IBM® SPSS Statistics® as the analytical engine. The details can be found elsewhere [56,57,58].
3. Results and Discussion
3.1. Hydrogeochemical Characteristic
The research carried out by the authors of the article comprehensively covered all the geothermal boreholes located in Podhale, where exploitation of thermal water is ongoing for heating and recreational purposes. The results of physicochemical analyses are presented in Table 1. The water from analyzed wells differs in terms of physical parameters—pH, EC, Eh, and especially temperature as well as in chemical composition. It is reflected in the various hydrochemical types of this water.

Table 1.
Physicochemical parameters of the thermal water samples of the Podhale Trough.
Thermal water in Podhale is characterized by variable chemical composition. TDS (total dissolved solids) of water in sampling points from the south part of the studied region is from 297.6 mg/dm3 to 359 mg/dm3 (P6–P8). Along with the direction of flow to the north, the TDS increases, achieving value of 2352 mg/dm3 to 2404 mg/dm3 in wells P1–P3. There is also a noticeably large variation in oxidation-reduction conditions and a clear increase in temperature along with their flow direction from 23.3 °C to 76.9 °C.
The chemical analyses presented in Table 1 include one series of tests planned and carried out in accordance with the designed and implemented QA/QC program [59,60]. In order to assess the representativeness of the tests, they were compared with the compiled results of archival analyses for the tested wells and fell in the range of the natural variability of thermal water chemical composition which is presented in Table 2. Archival research carried out in the years 2010–2019 allowed the assessment of chemical composition stability in selected wells [33,59,61] and determination of regional relationships (fM) (Table 3). The number of archival analyses (n) collected differs depending on the well and is presented in Table 2 and Figure S1—Supplementary Materials.

Table 2.
Basic physicochemical parameter of thermal water in Podhale Trough (archival data 2010–2019).

Table 3.
Values of fM empirical factor.
fM factor can be used to determine the local characteristics of the chemical composition of groundwater. This factor may vary from 0.55 to 1.0, depending on the soluble components of the water and the temperature of measurement [50,62]. fM is calculated from the formula (after [63]):
fM = TDS/EC
The values of the fM factor (Table 3) show a decrease along the direction of water flow, with similar values for sampling points located close to each other i.e., P1–P3—northern part of the Podhale Trough, and P6–P8—southern part of the Podhale Trough. The values of the fM factor calculated and based on the current measurement series were compared with the values obtained for archival results. For each of the points, the calculated value is within the range defined on the basis of archival research.
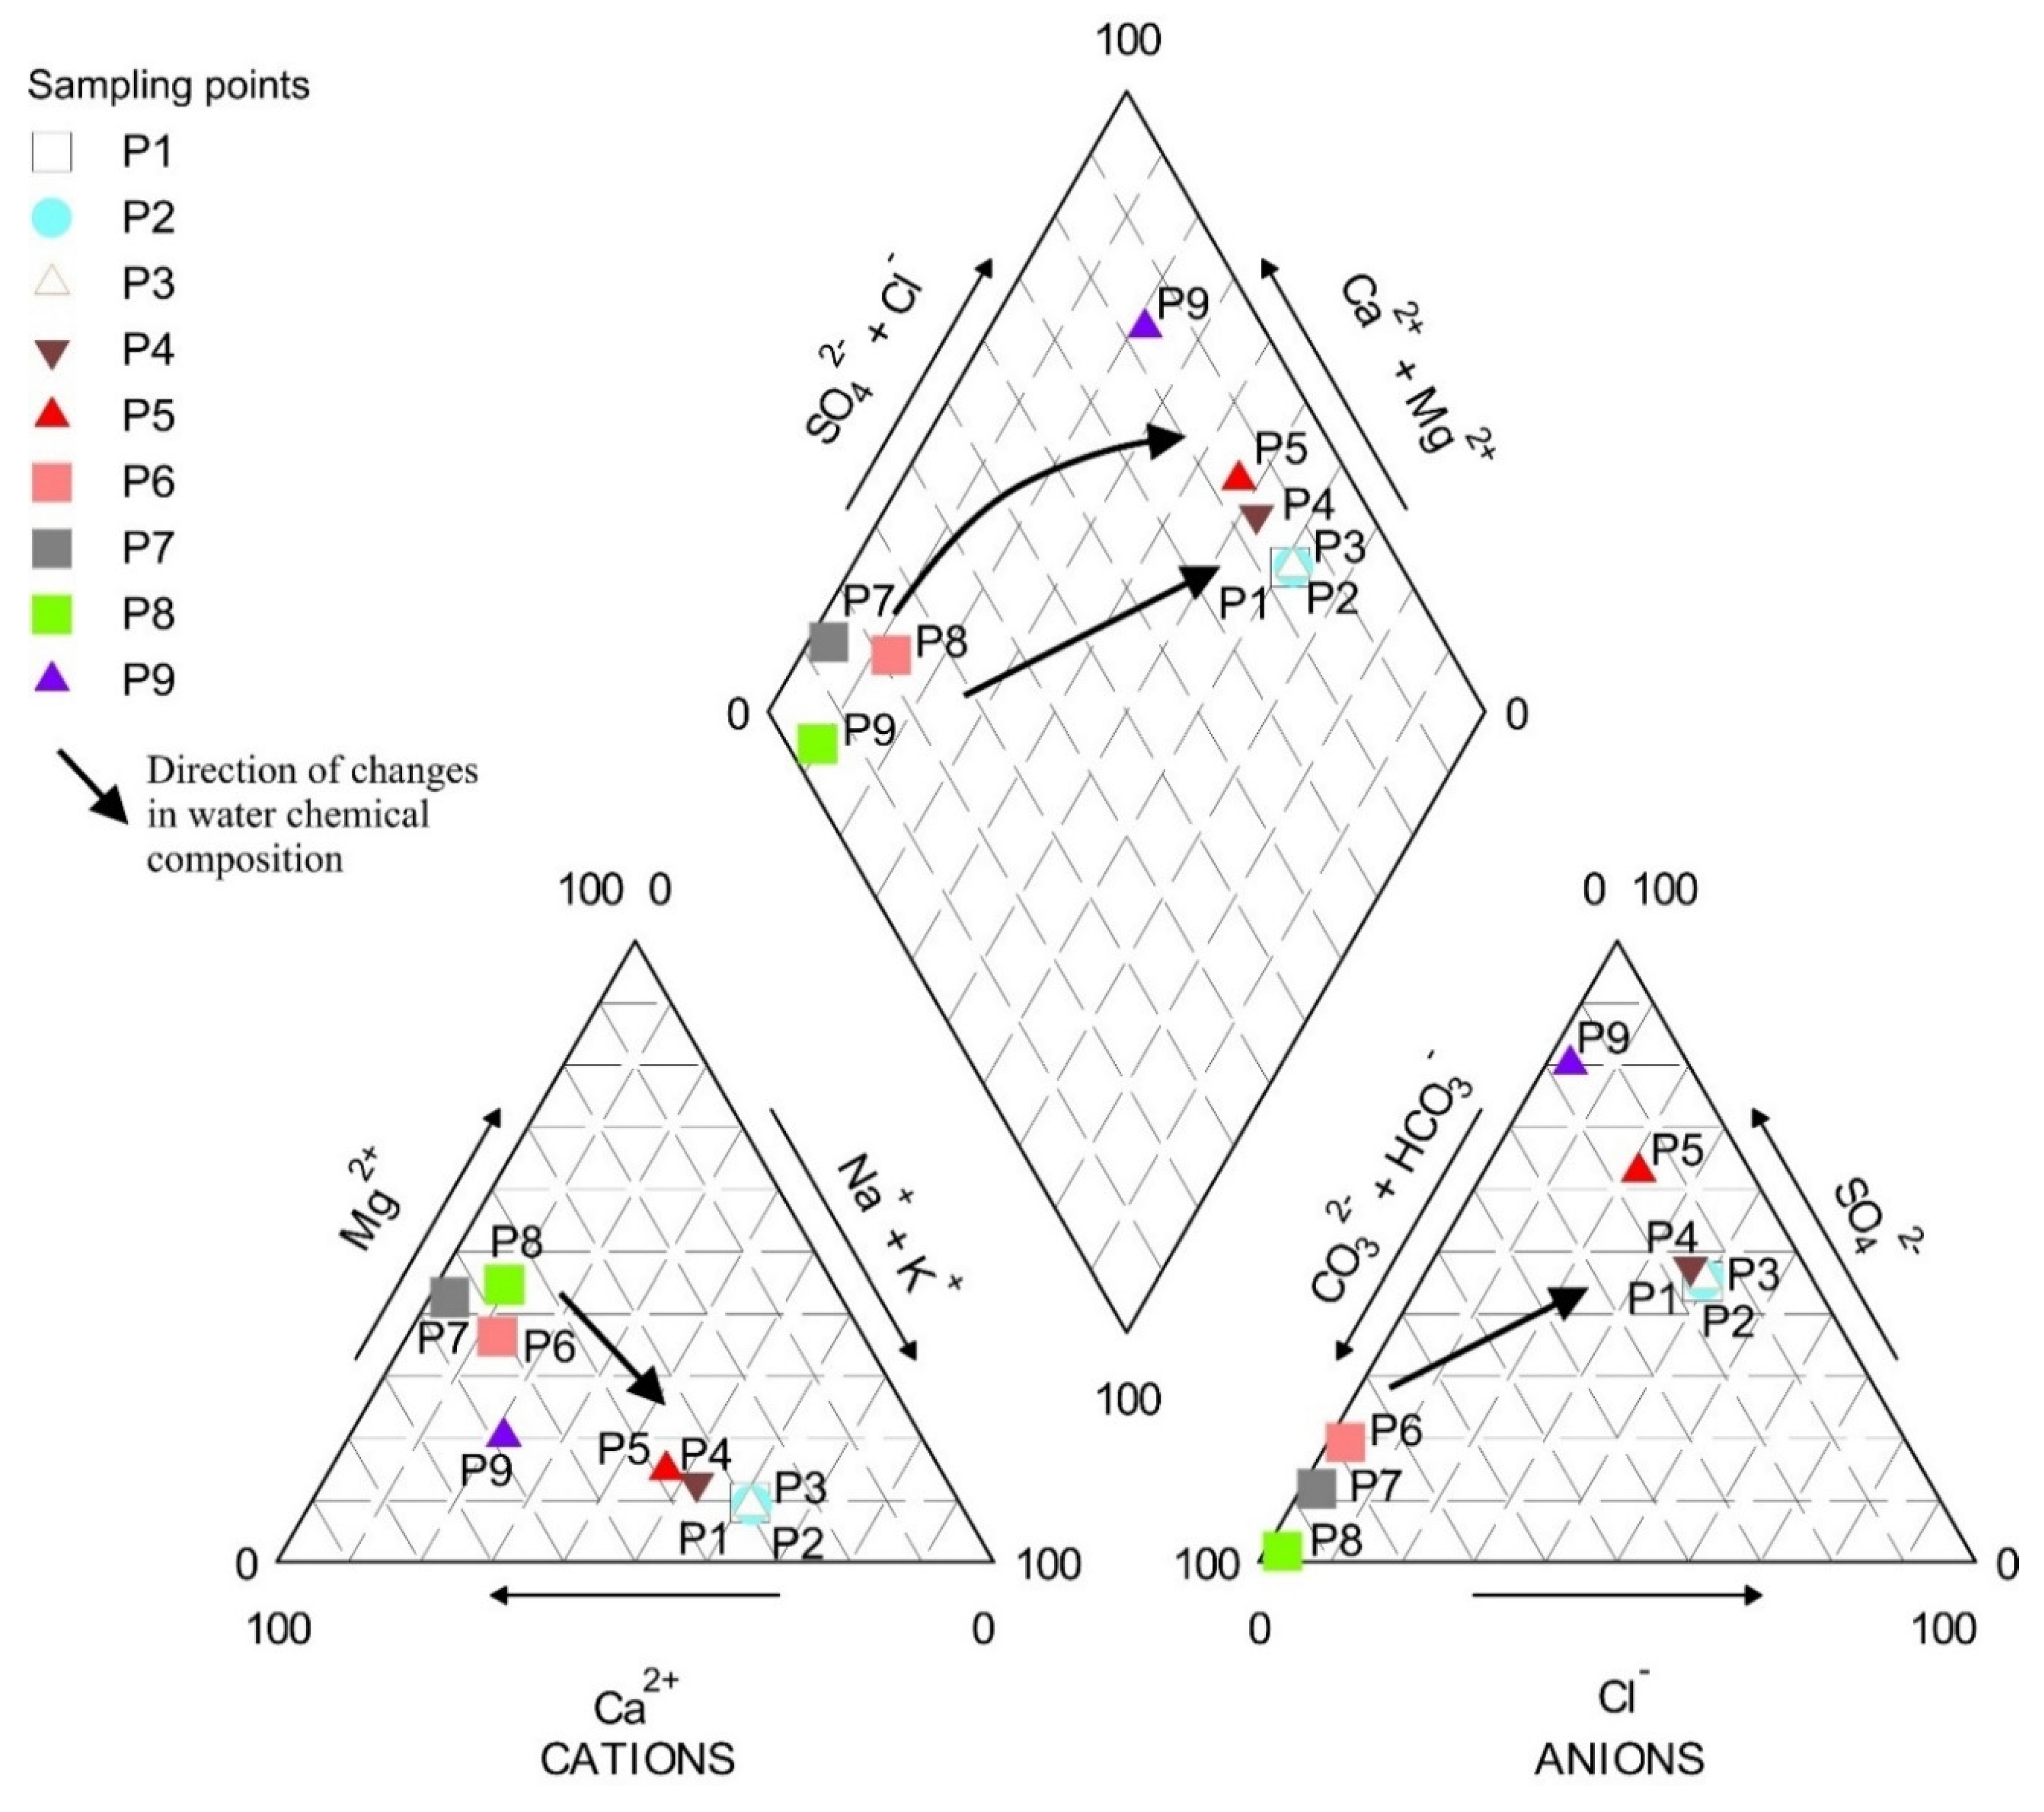
The Piper diagram (Figure 3) shows the direction in thermal water chemical composition changes from well-washed zones (P6–P8 sampling points) to less-washed zones (P1–P5 and P9 sampling points). Washing of the thermal water reservoir with fresh water circulating in this geothermal system takes place from its southern recharge area (Tatra Mountains) to its northern part. Along with the direction of the thermal water flows their hydrogeochemical types change from bicarbonate-calcium-magnesium (HCO3-Ca-Mg) to sulphate-chloride-sodium-calcium (SO4-Cl-Na-Ca) and sulphate-calcium-magnesium (SO4-Ca-Mg).
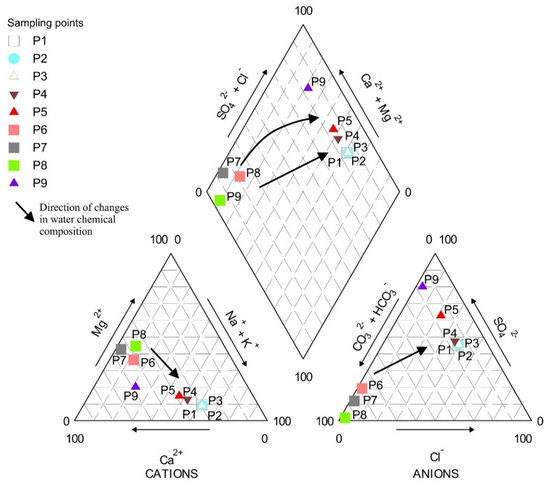
Figure 3.
Hydrogeochemical characteristics of thermal water using the Piper Diagram.
This causes the water currently circulating in the system to have a chloride content increasing towards less washed zones and, what is more typical, the amount of sodium significantly exceeds the chloride concentration equivalent. The thermal water in sampling points located closer to the recharge area remains in shorter contact with the reservoir rocks due to the greater inflow of fresh water and the higher flow velocity. In the sampling points from the north part of the studied area, the time of water-rock interaction increases due to a significant decrease in flow velocity and a lack of fresh water inflow.
Directions of transformation are further complicated by the process of sulphates reduction and the appearance of hydrogen sulphide in water [22,64,65]. Two directions of the transformation result from this, shown in Figure 3 for water with lower (P5 and P9) and higher sulphates content (P1–P4 sampling points).
3.2. Calculation of the Mineral Saturation Indices
Hydrogeochemical calculations allows more complete explanation of the ion exchange processes [66] occurring in the geothermal aquifer of the Podhale Trough. In this study, hydrogeochemical modelling was carried out using the PHREEQC 3.5 software [67].
Input data for the initial solutions was pH, temperature, redox conditions (pe based on Eh value), and concentrations of analyzed chemical components whose amounts were above the detection limits (Table 1). The saturation index SI was calculated based on the formula.
where IAP is the ion activity products and KT is the equilibrium constants of reaction at the given temperature. The equilibrium state of the solution relative to the mineral phase is the interval 0 ± 5% log KT. The llnl.dat database was used for calculations.
SI = IAP/KT
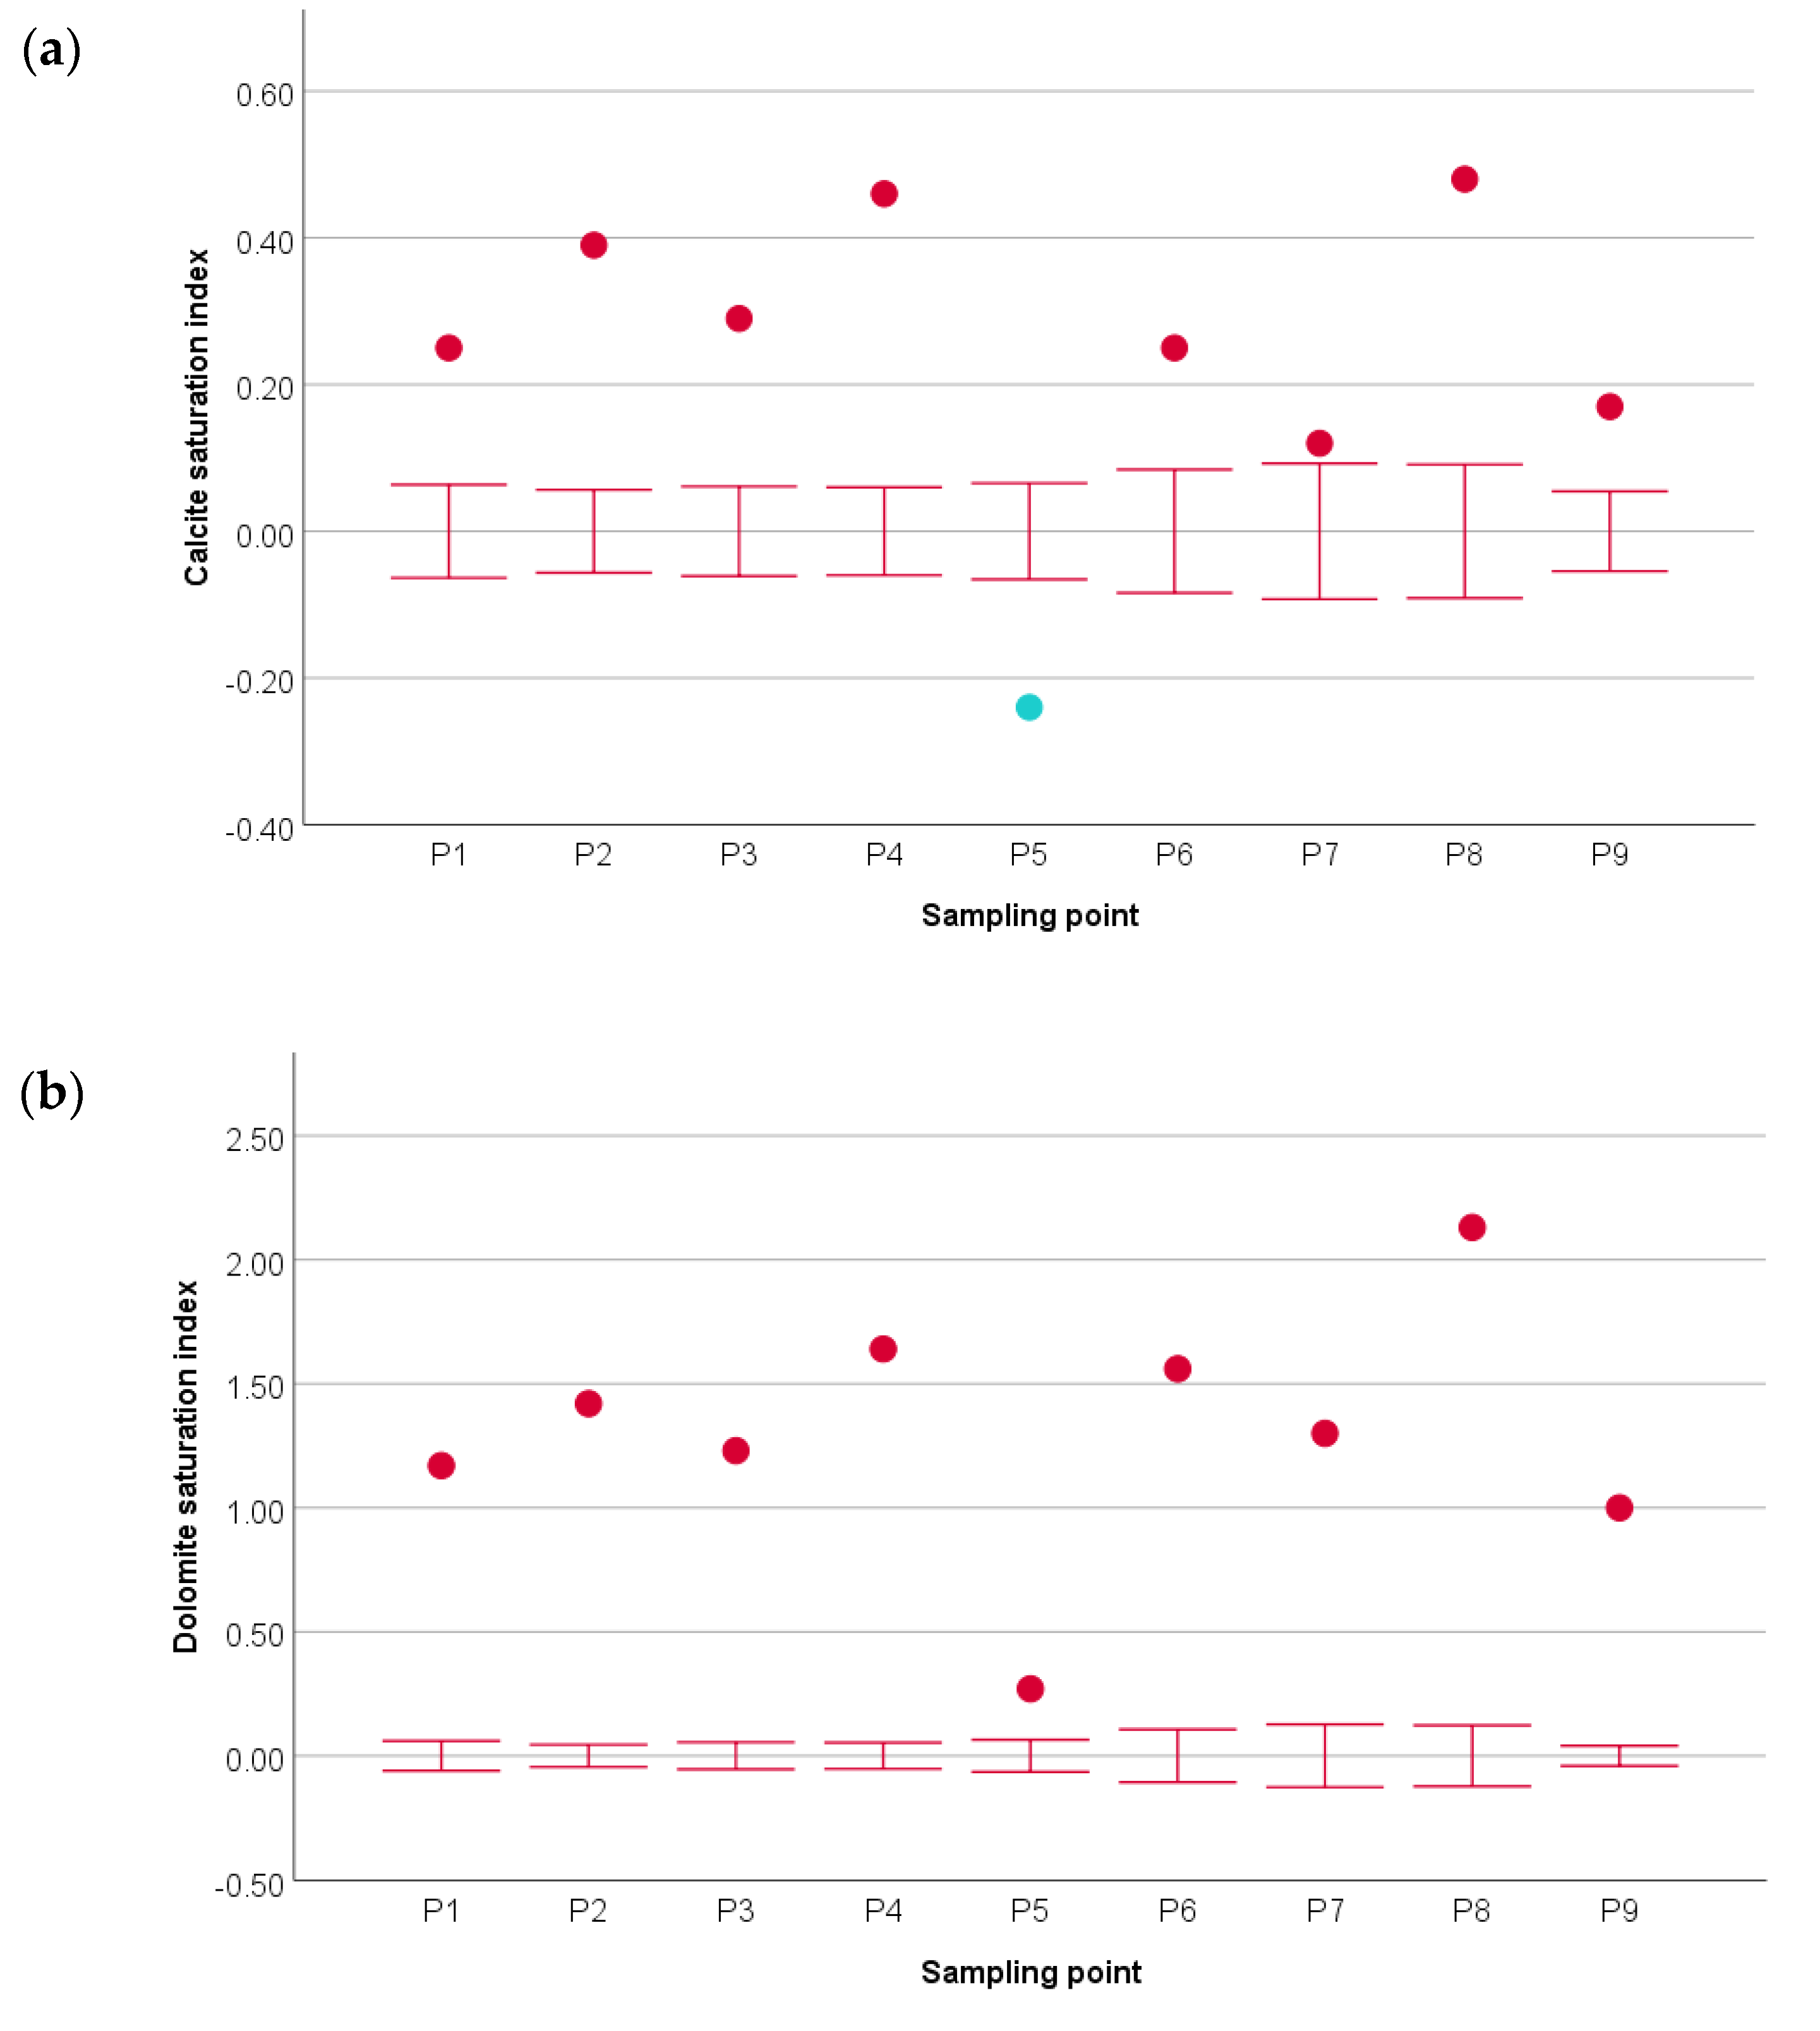
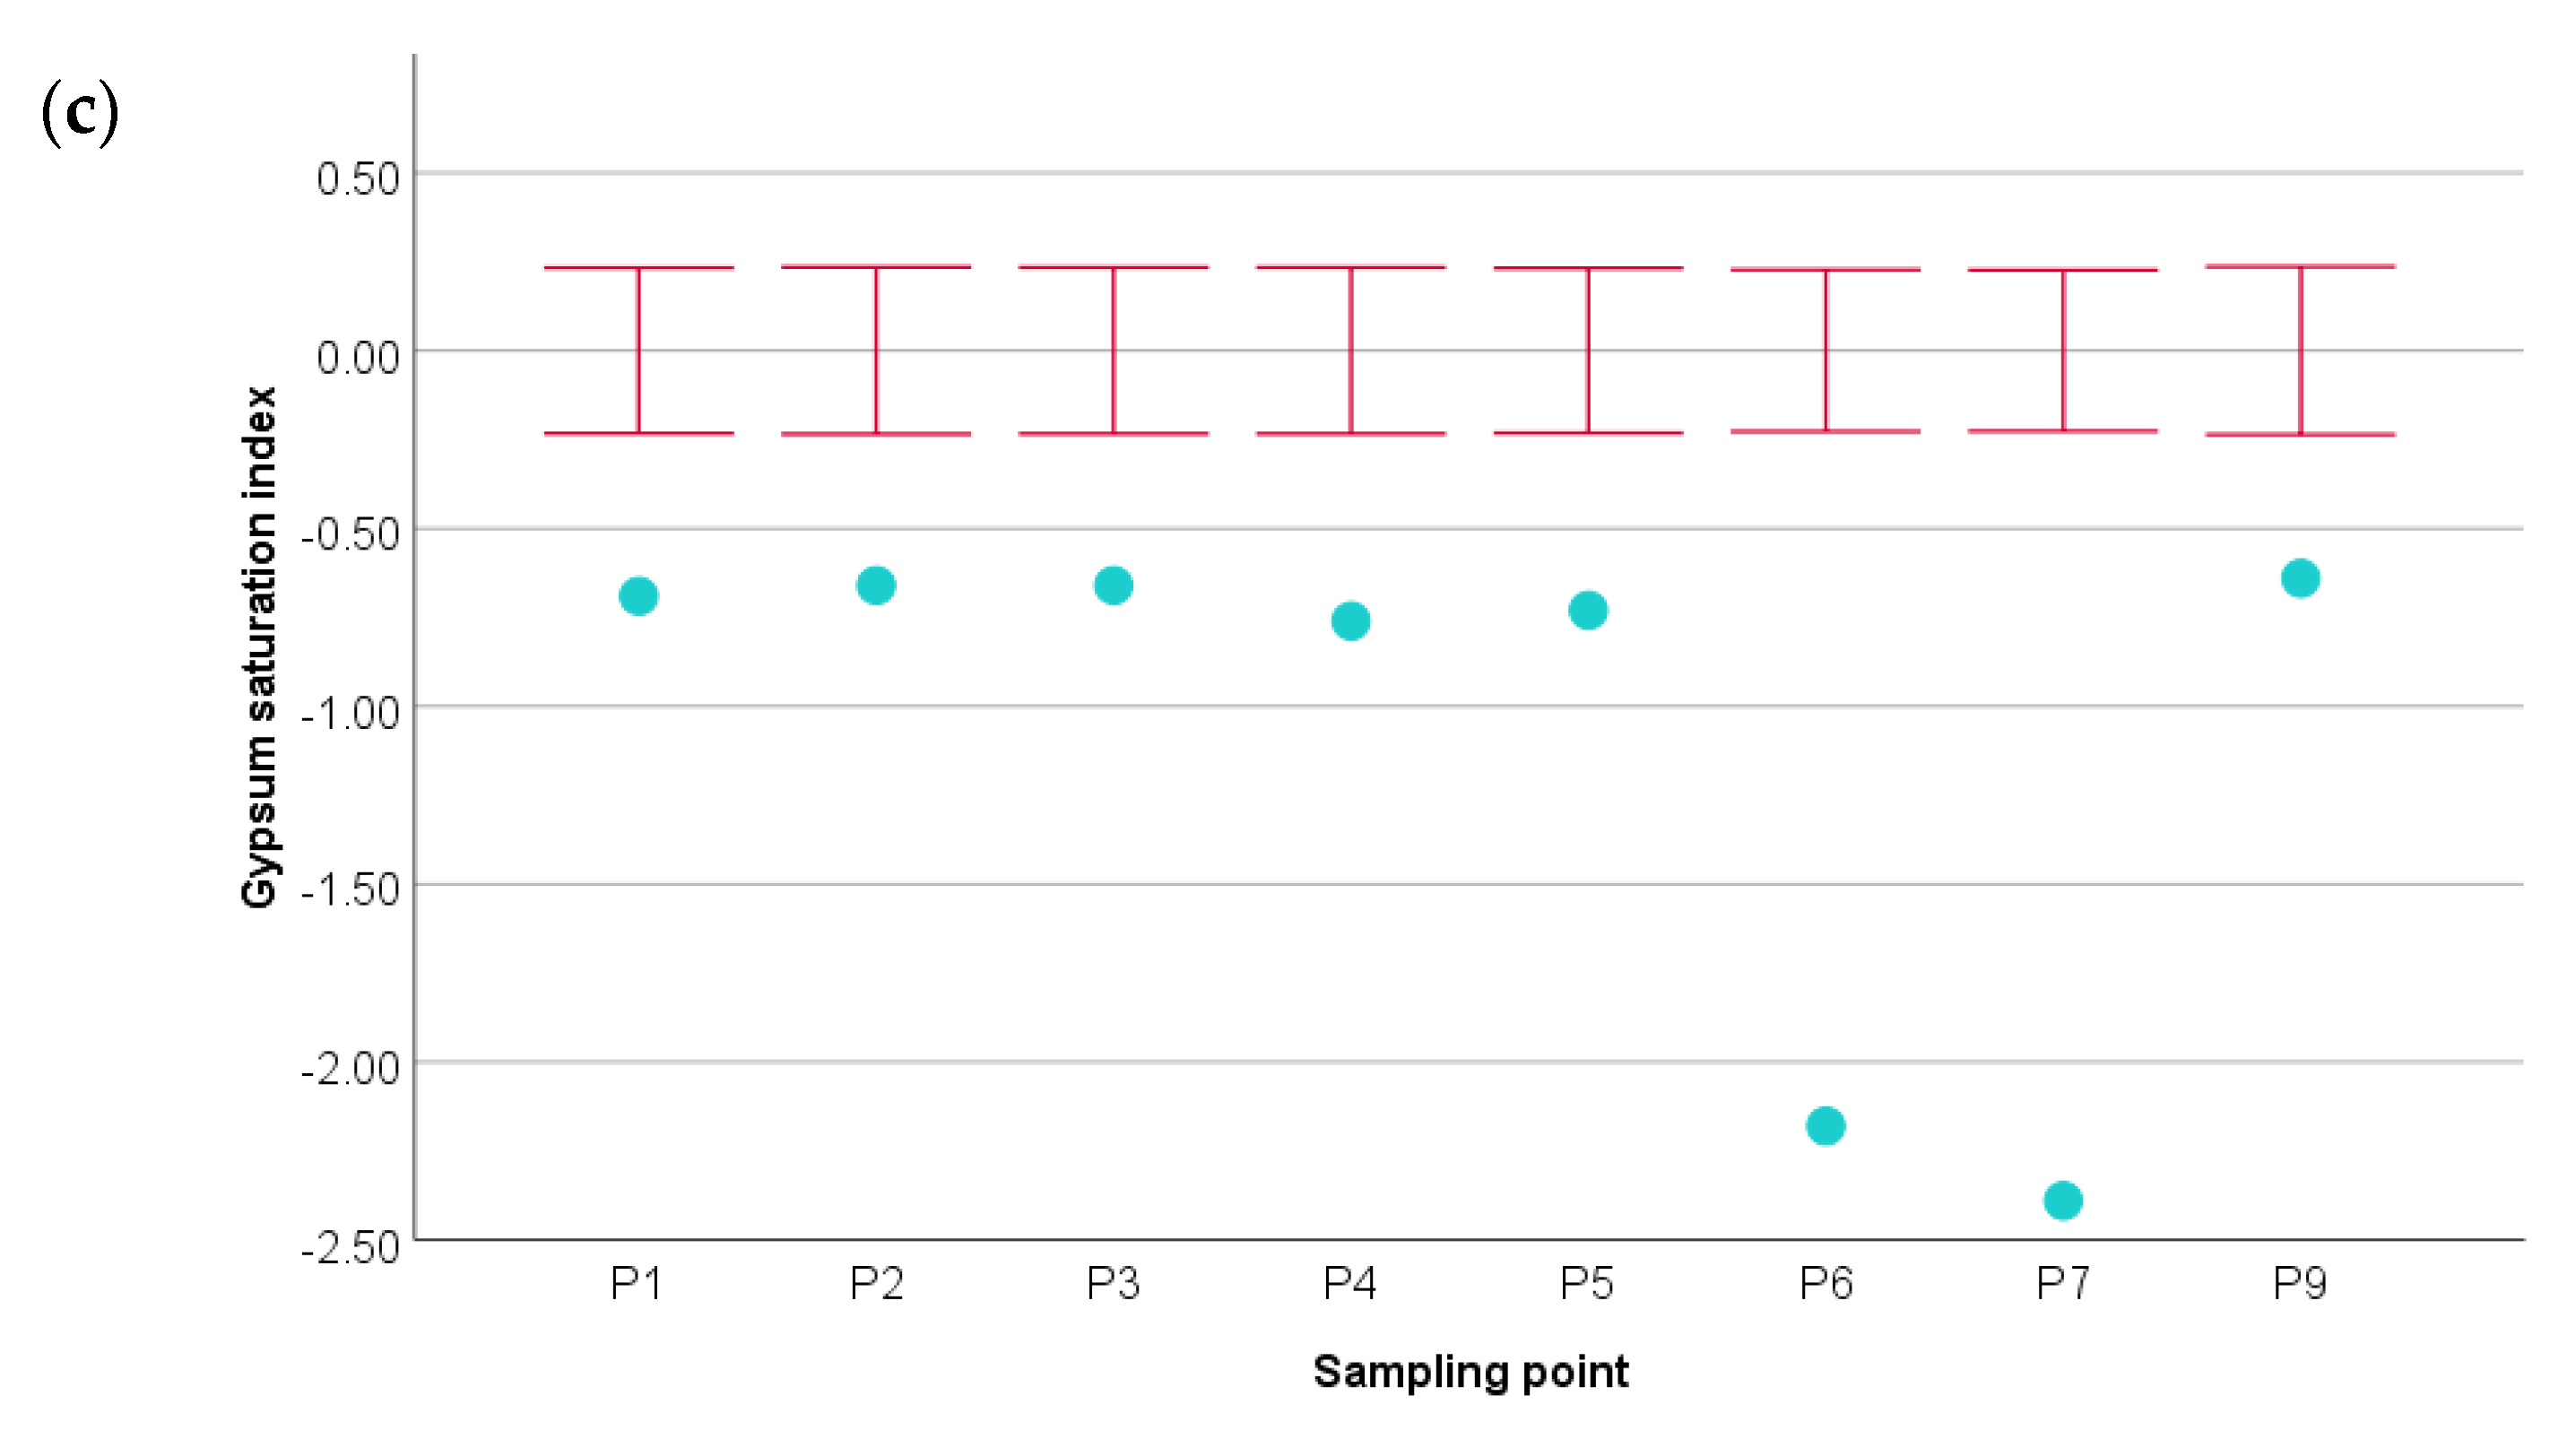
The saturation indexes were analyzed in relation to selected minerals that build reservoir rocks [14,32,40,44,68,69]: albite (NaAlSi3O8), anhydrite (CaSO4), anorthite (CaAl2(SiO4)2), aragonite (CaCO3), barite (BaSO4) calcite (CaCO3), celestite (SrSO4), chalcedony (SiO2), chalcopyrite (CuFeS2), dolomite (CaMg(CO3)2), gibbsite (Al(OH)3), gypsum (CaSO4:2H2O), illite (K0.6Mg0.25Al1.8Al0.5Si3.5O10(OH)2), Ca-Montmorillonite (Ca0.165Mg0.33Al1.67Si4O10(OH)2), pyrite (FeS2), quartz (SiO2), and amorphous silica (SiO2). Hydrogeochemical modelling results for the mineral phases that are dominating in the geological setting like calcite, dolomite, and gypsum are shown in Figure 4. Other results are included in the Supplementary Materials (Figure S2—Supplementary Materials).
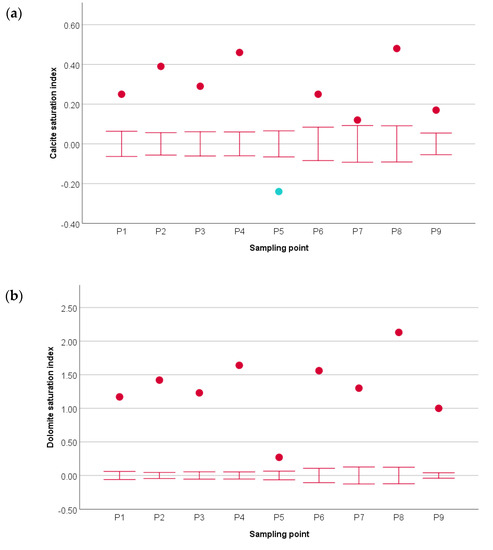
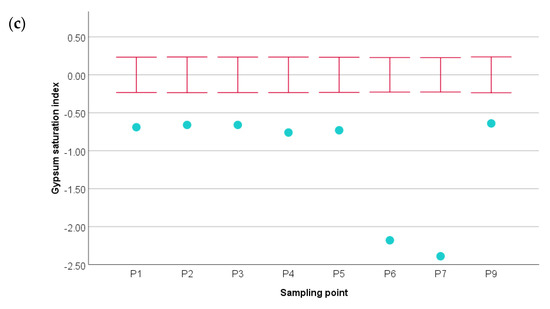
Figure 4.
Saturation index for chosen mineral-phase: (a) calcite, (b) dolomite, (c) gypsum. Explanation: blue points—undersaturated solution, red points—supersaturated solution, red whiskers—equilibrium state.
Thermal water in Podhale is undersaturated in relation to albite (except P1 sampling point), amorphous silica, anhydrite (except P5 sampling point), anorthite, celestite and gypsum. They are supersaturated in relation to aragonite (except P5, P7 and P9 sampling points), calcite (except P5 sampling point), Ca-Montmorillonite, chalcopyrite, dolomite, illite (except P6 sampling point), pyrite, and quartz (except P7 and P8 sampling points). Meanwhile, tested samples are in the equilibrium state with barite and chalcedony (except P7 and P8 sampling point). In relation to gibbsite, all tested sample show different saturation index (Figure S2).
3.3. Hydrochemical Indices
The chemistry of thermal water in Podhale shows changes in the hydrochemical type of water from HCO3-Ca-Mg type in the south part of Podhale Trough to SO4-Cl-Na-Ca and SO4-Ca-Mg in its northern part. The higher concentration of bicarbonates in thermal water in the south part of the studied area is associated with meteoric water infiltrating the geothermal reservoir, where HCO3− ions are formed at the margins of alimentation zones where CO2 is converted to bicarbonates [16,28]. It is very well visible in rHCO3−/rCl− ratios (Table 4) whose values can be used as the measure of water flow path from the recharge zones [25]. Its results are significantly higher for the points located near to the alimentation zone (or when the velocity of fresh water flow in the aquifer is higher because of i.e., fault zones, and quicker reaching the sampling point), than for the points where the residence time is longer, resulting in growth of chlorides concentrations with a slight increase or a constant concentration of bicarbonates. According to the direction of water flow, the change in temperature and total dissolved solids amount is also visible. Both temperature and TDS are higher in wells located in the north part of Podhale Trough. Along with the flow direction of geothermal water, the percentage equivalent content of sulphate, chloride, and sodium ions increases, and the equivalent percentage content of bicarbonate, calcium and magnesium ions decreases.

Table 4.
The hydrochemical ratios values for individual sampling points ordered by location from North to South.
The increase in the amounts of chloride and sodium ions is associated with freshening of aquifer filled with sea water in the past. This may indicate that the Na ions previously adsorbed on exchanger surfaces are released to the thermal water during dilution of ancient seawater by freshwater [40].
Issues of ion exchange in the process of saltwater penetration into aquifers containing fresh water and during the reverse process—slowly becoming less salty of sea water aquifers are the subject of research of many hydrogeochemists [70,71,72,73,74].
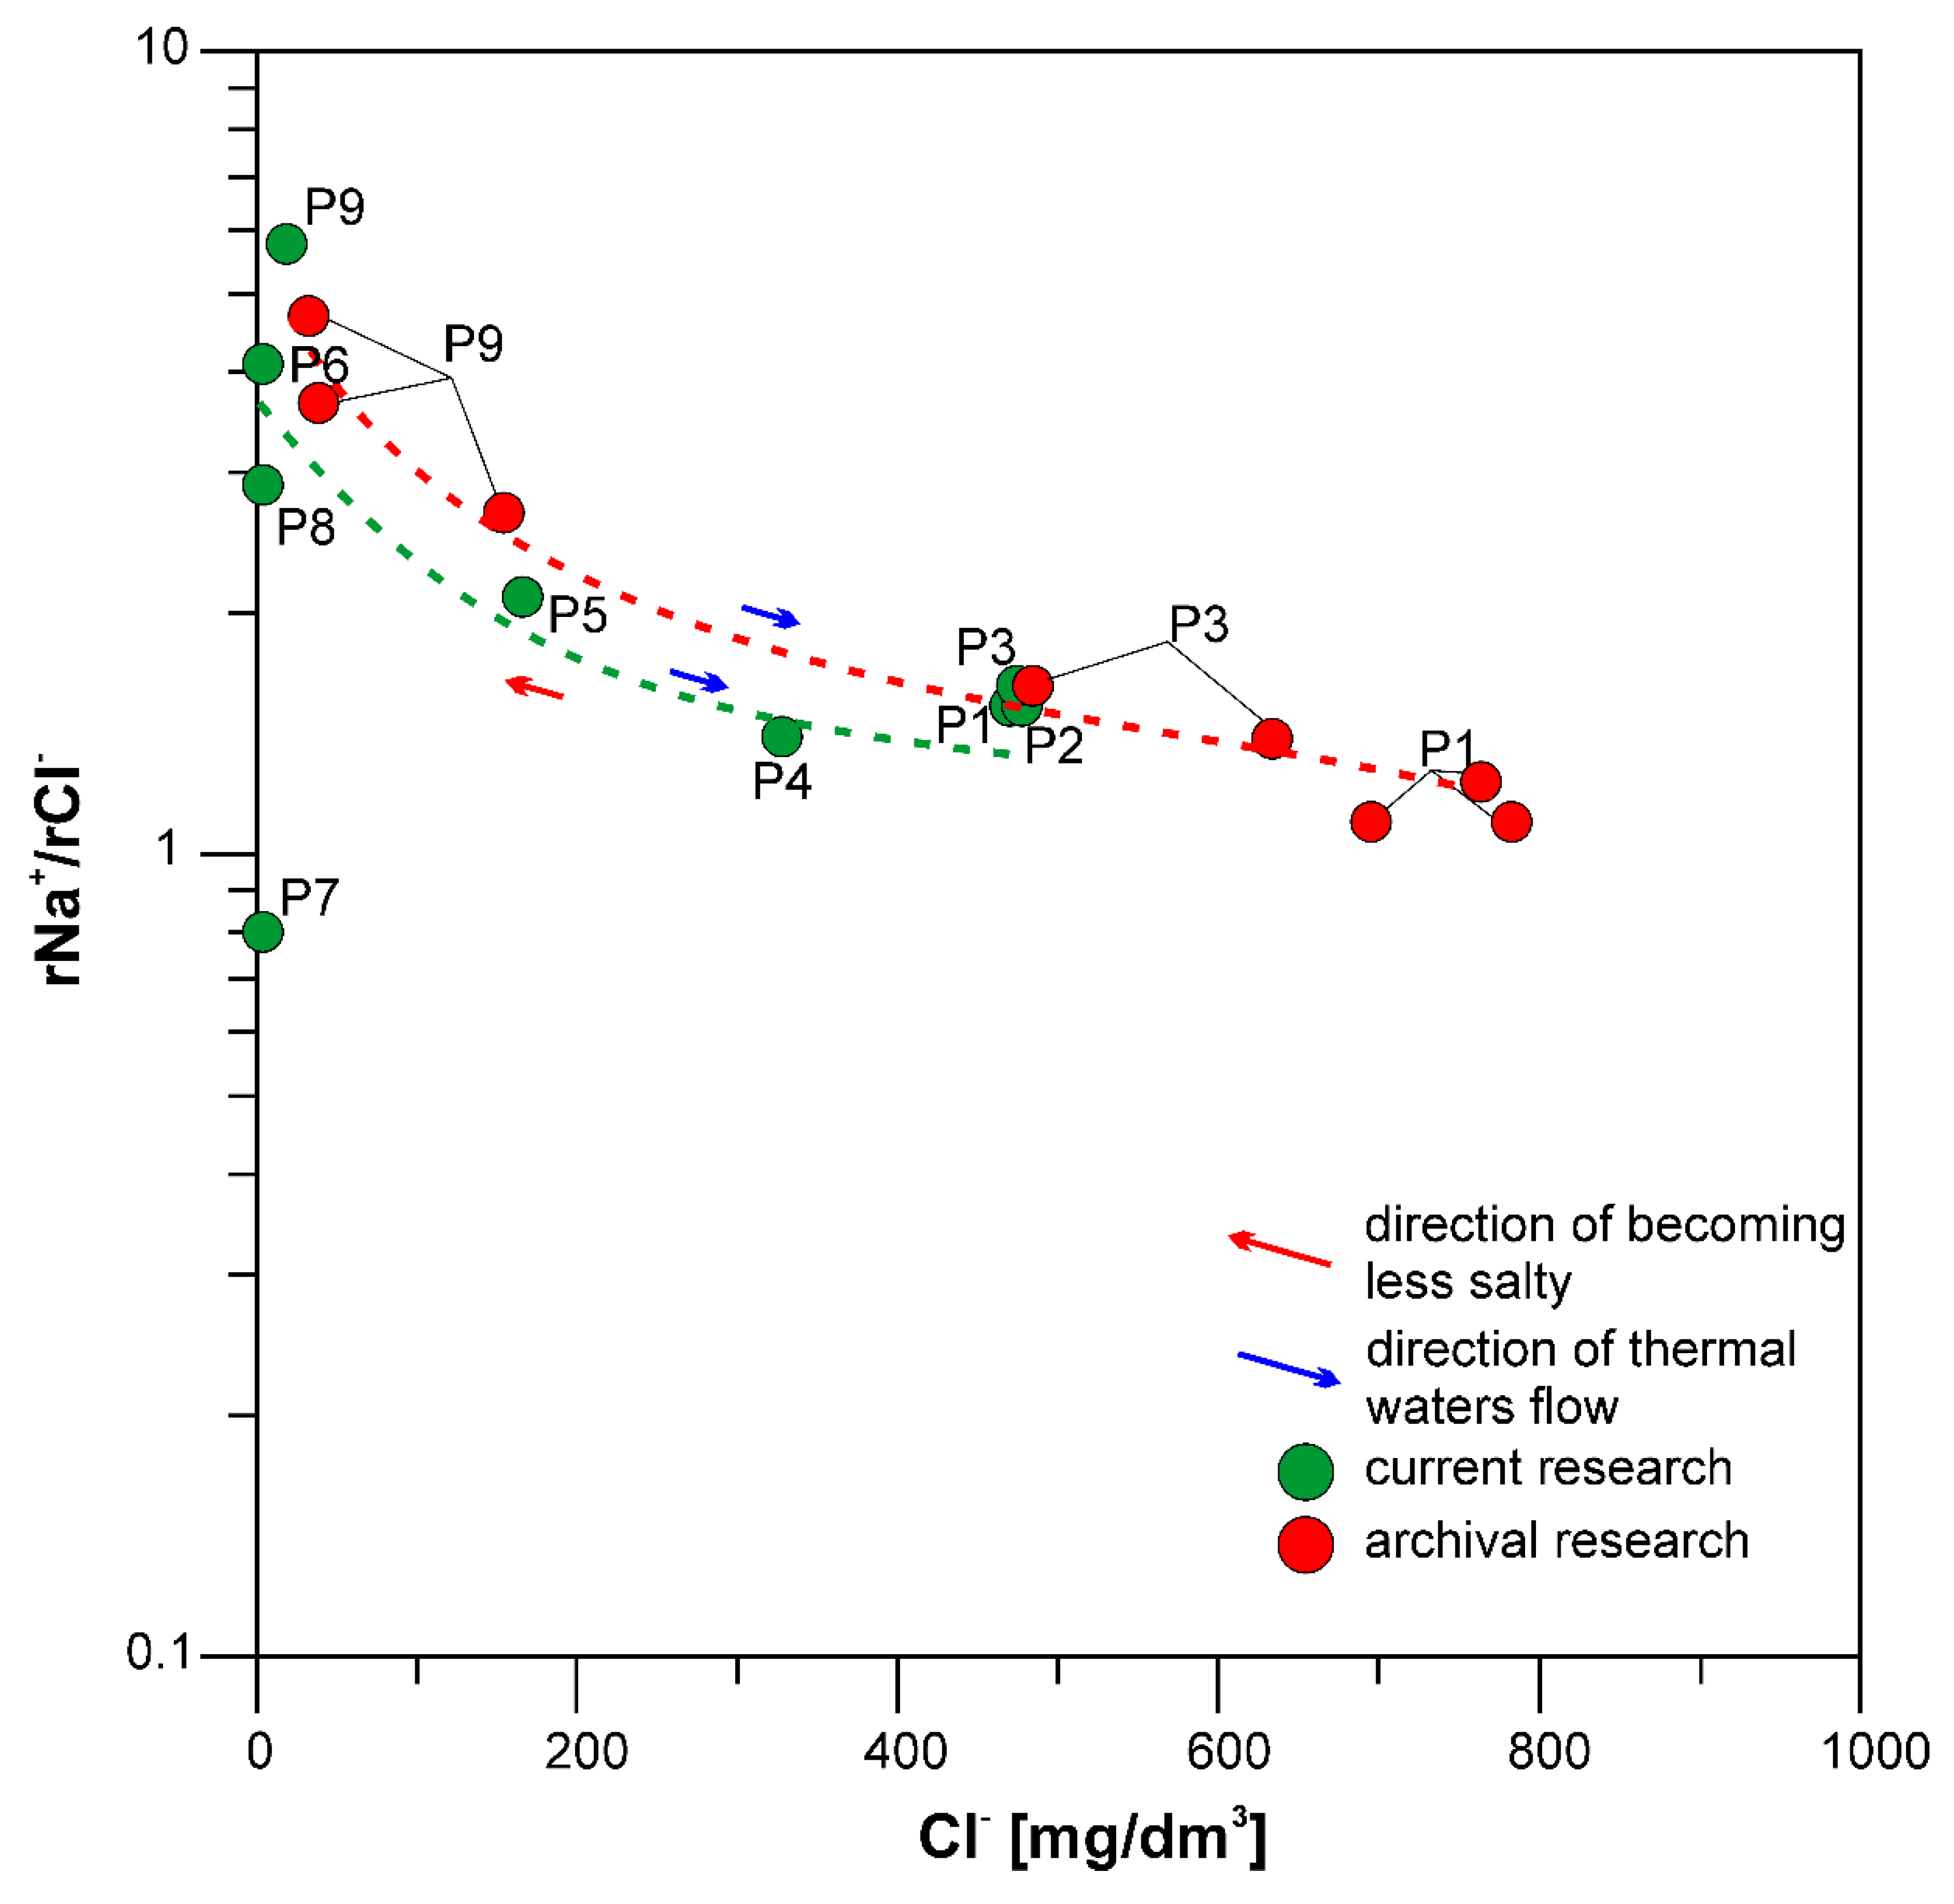
In this regard, the authors used the rNa+/rCl− index change chart (Figure 5), which presents the data for current operations in the comparison with the archival data published by Witczak [40]. A decrease in the rNa+/rCl− (Table 4) index along with the direction of water flow indicates an increase in its salinity. The rNa+/rCl− values presented for archival and current research present that this factor decreases for the thermal water located in the northern part of the Podhale Trough. It indicates that water contains more chloride ions (rNa+/rCl− is closer to the value established for ocean water 0.87 [25]) than water located in southern part of the Podhale region where the alimentation zone occurs. However, the values of the rNa+/rCl− ratio (>>1) suggest the occurrence of cation exchange with Na desorption as well as Ca and Mg adsorption. Notwithstanding, a combination of anorthite partial dissolution and calcite/dolomite precipitation can give the same results.
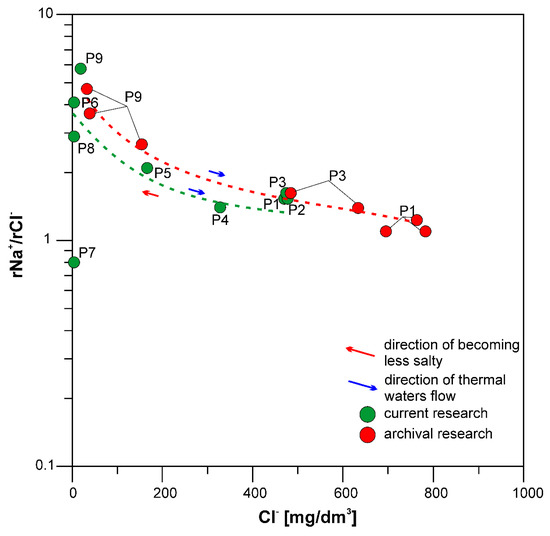
Figure 5.
Change of the rNa+/rCl− index as the presumed effect of the process of reducing the thermal water salinity by meteoric water—comparison of current data and archival data [40].
In thermal water, a process of dolomitization may also take place, i.e., the replacement of calcium in calcite by magnesium. Sapińska-Śliwa et al. [75] used the rCa2+/rMg2+ index as an indicator whose value changes in the dolomitization process. Values above 2.0 can be the result of dissolving calcite or/and gypsum. Its increase with the direction of thermal water flow is noticeable (Table 4).
Furthermore, the r Pearson’s correlation coefficients were calculated for crucial physicochemical parameters that control the process of chemical composition i.e., temperature and calcium, sulphates, and magnesium concentrations (formed during dissolution of gypsum and dolomitization process), as well as the total dissolved solids amounts. TDS and concentrations of SO42−, Ca2+, Mg2+ are positively correlated with temperature (Pearson’s correlation coefficient, respectively, 0.83, 0.93, 0.96, and 0.94, at the significance level p < 0.05), which indicates that the temperature-related water–rock interaction is responsible for the groundwater geochemistry of the carbonate aquifer.
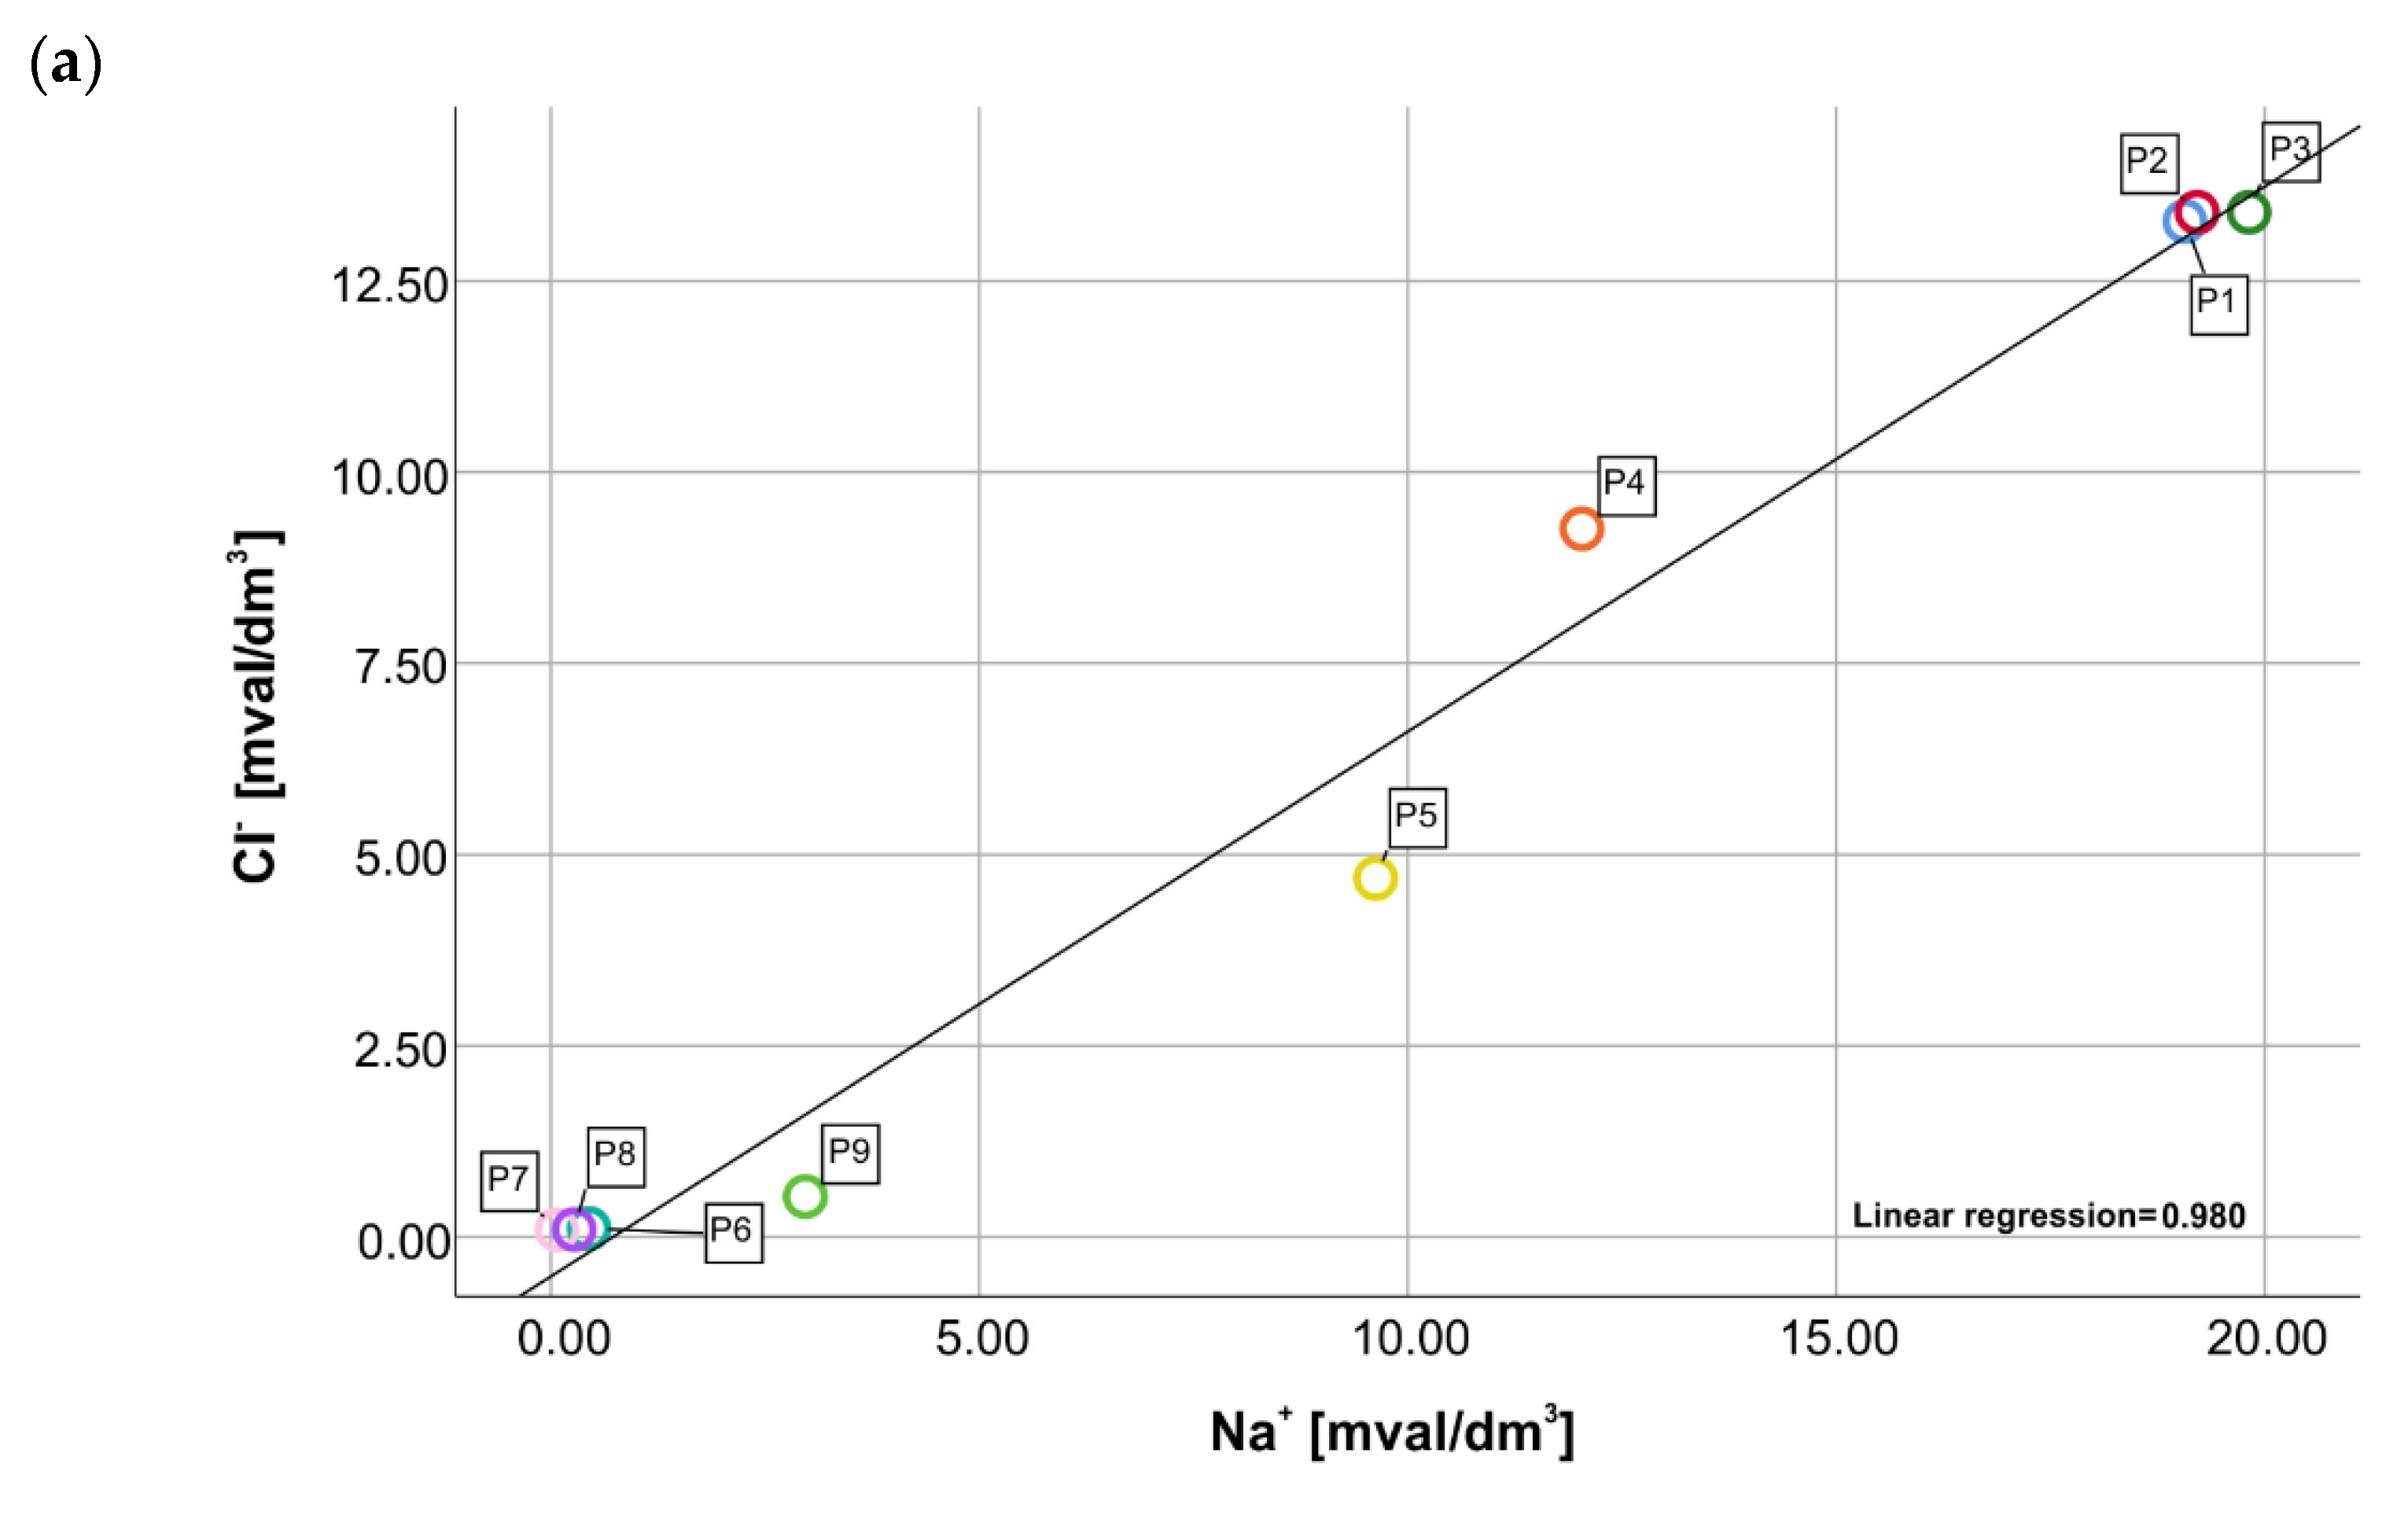
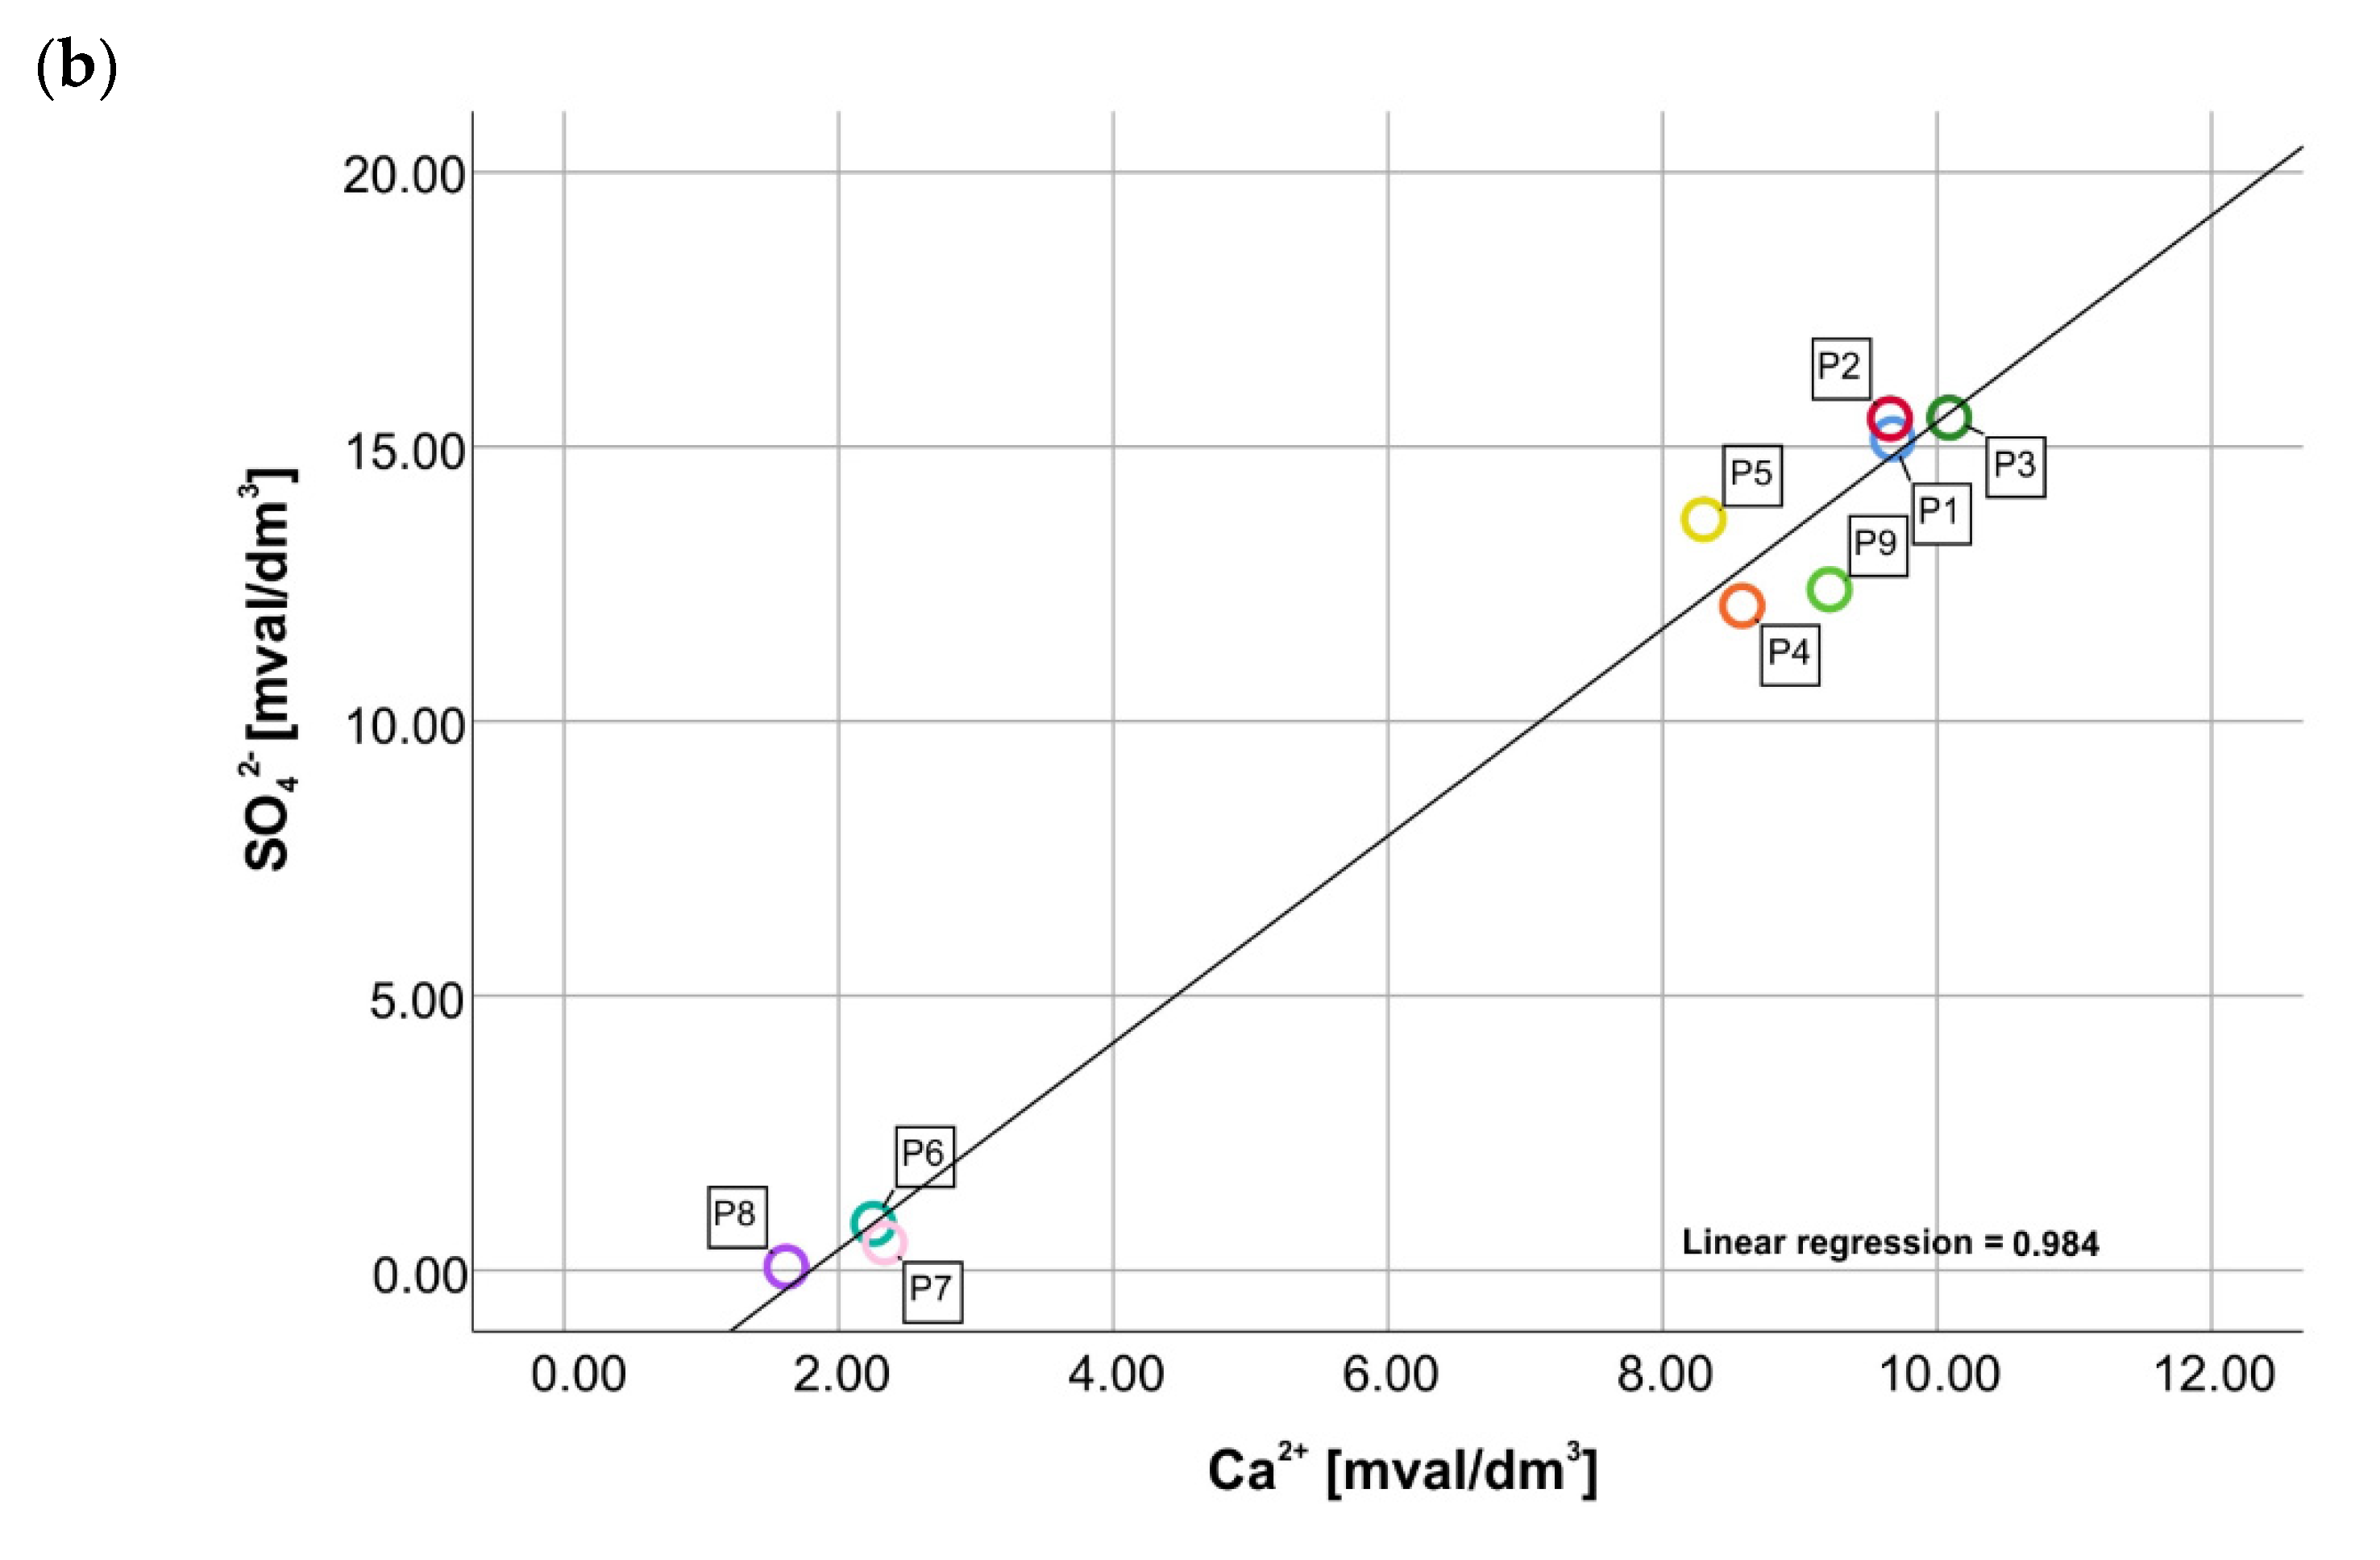
Correlation between Na+ and Cl− (0.990) (Figure 6a) confirms possibility of provenance involving salt (NaCl). However, the calculated rNa+/(rNa++rCl−) index slightly exceeds 0.50 value (Table 4) and suggest that the sodium ions mostly do not originate in halite dissolution but in ion exchange processes between clay minerals and water [76]. Due to the positive correlation between SO42− and Ca2+ (0.992) (Figure 6b) and undersaturation of thermal water in relation to gypsum, the occurrence of its dissolution process has been considered.
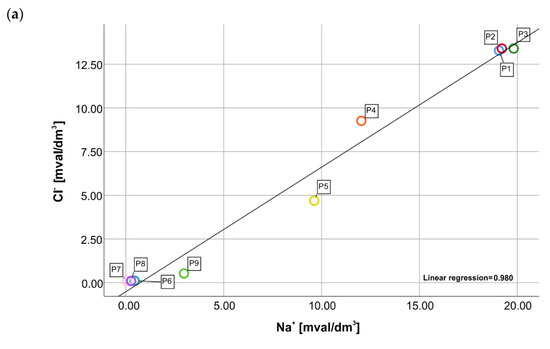
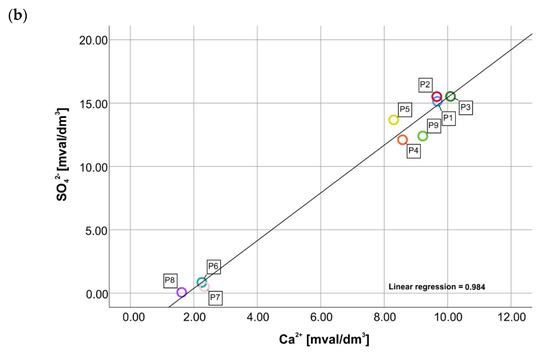
Figure 6.
Correlation between concentrations of: (a) Na+ and Cl− (b) SO42− and Ca2+.
3.4. Formation of Water Chemical Composition
Infiltrating water interacts with mineral phases in the aquifer, mainly calcite and gypsum. Dissolving carbonate minerals and/or gypsum leads to an increase in concentration of Ca2+ ions [77,78]. Due to the supersaturation of the examined water relative to calcite, gypsum dissolution was first taken into account. To recognize the effect of gypsum dissolution on the Podhale reservoir hydrochemistry the dissolution reaction of gypsum is considered by the equation:
CaSO4∙2H2O → Ca2+ + SO42− + 2H2O
Shvartsev et al. [37] show that the source of sulphate ions in thermal water may also be oxidation of pyrite. However, due to the reduction conditions (low Eh value), this hypothesis may be considered unlikely.
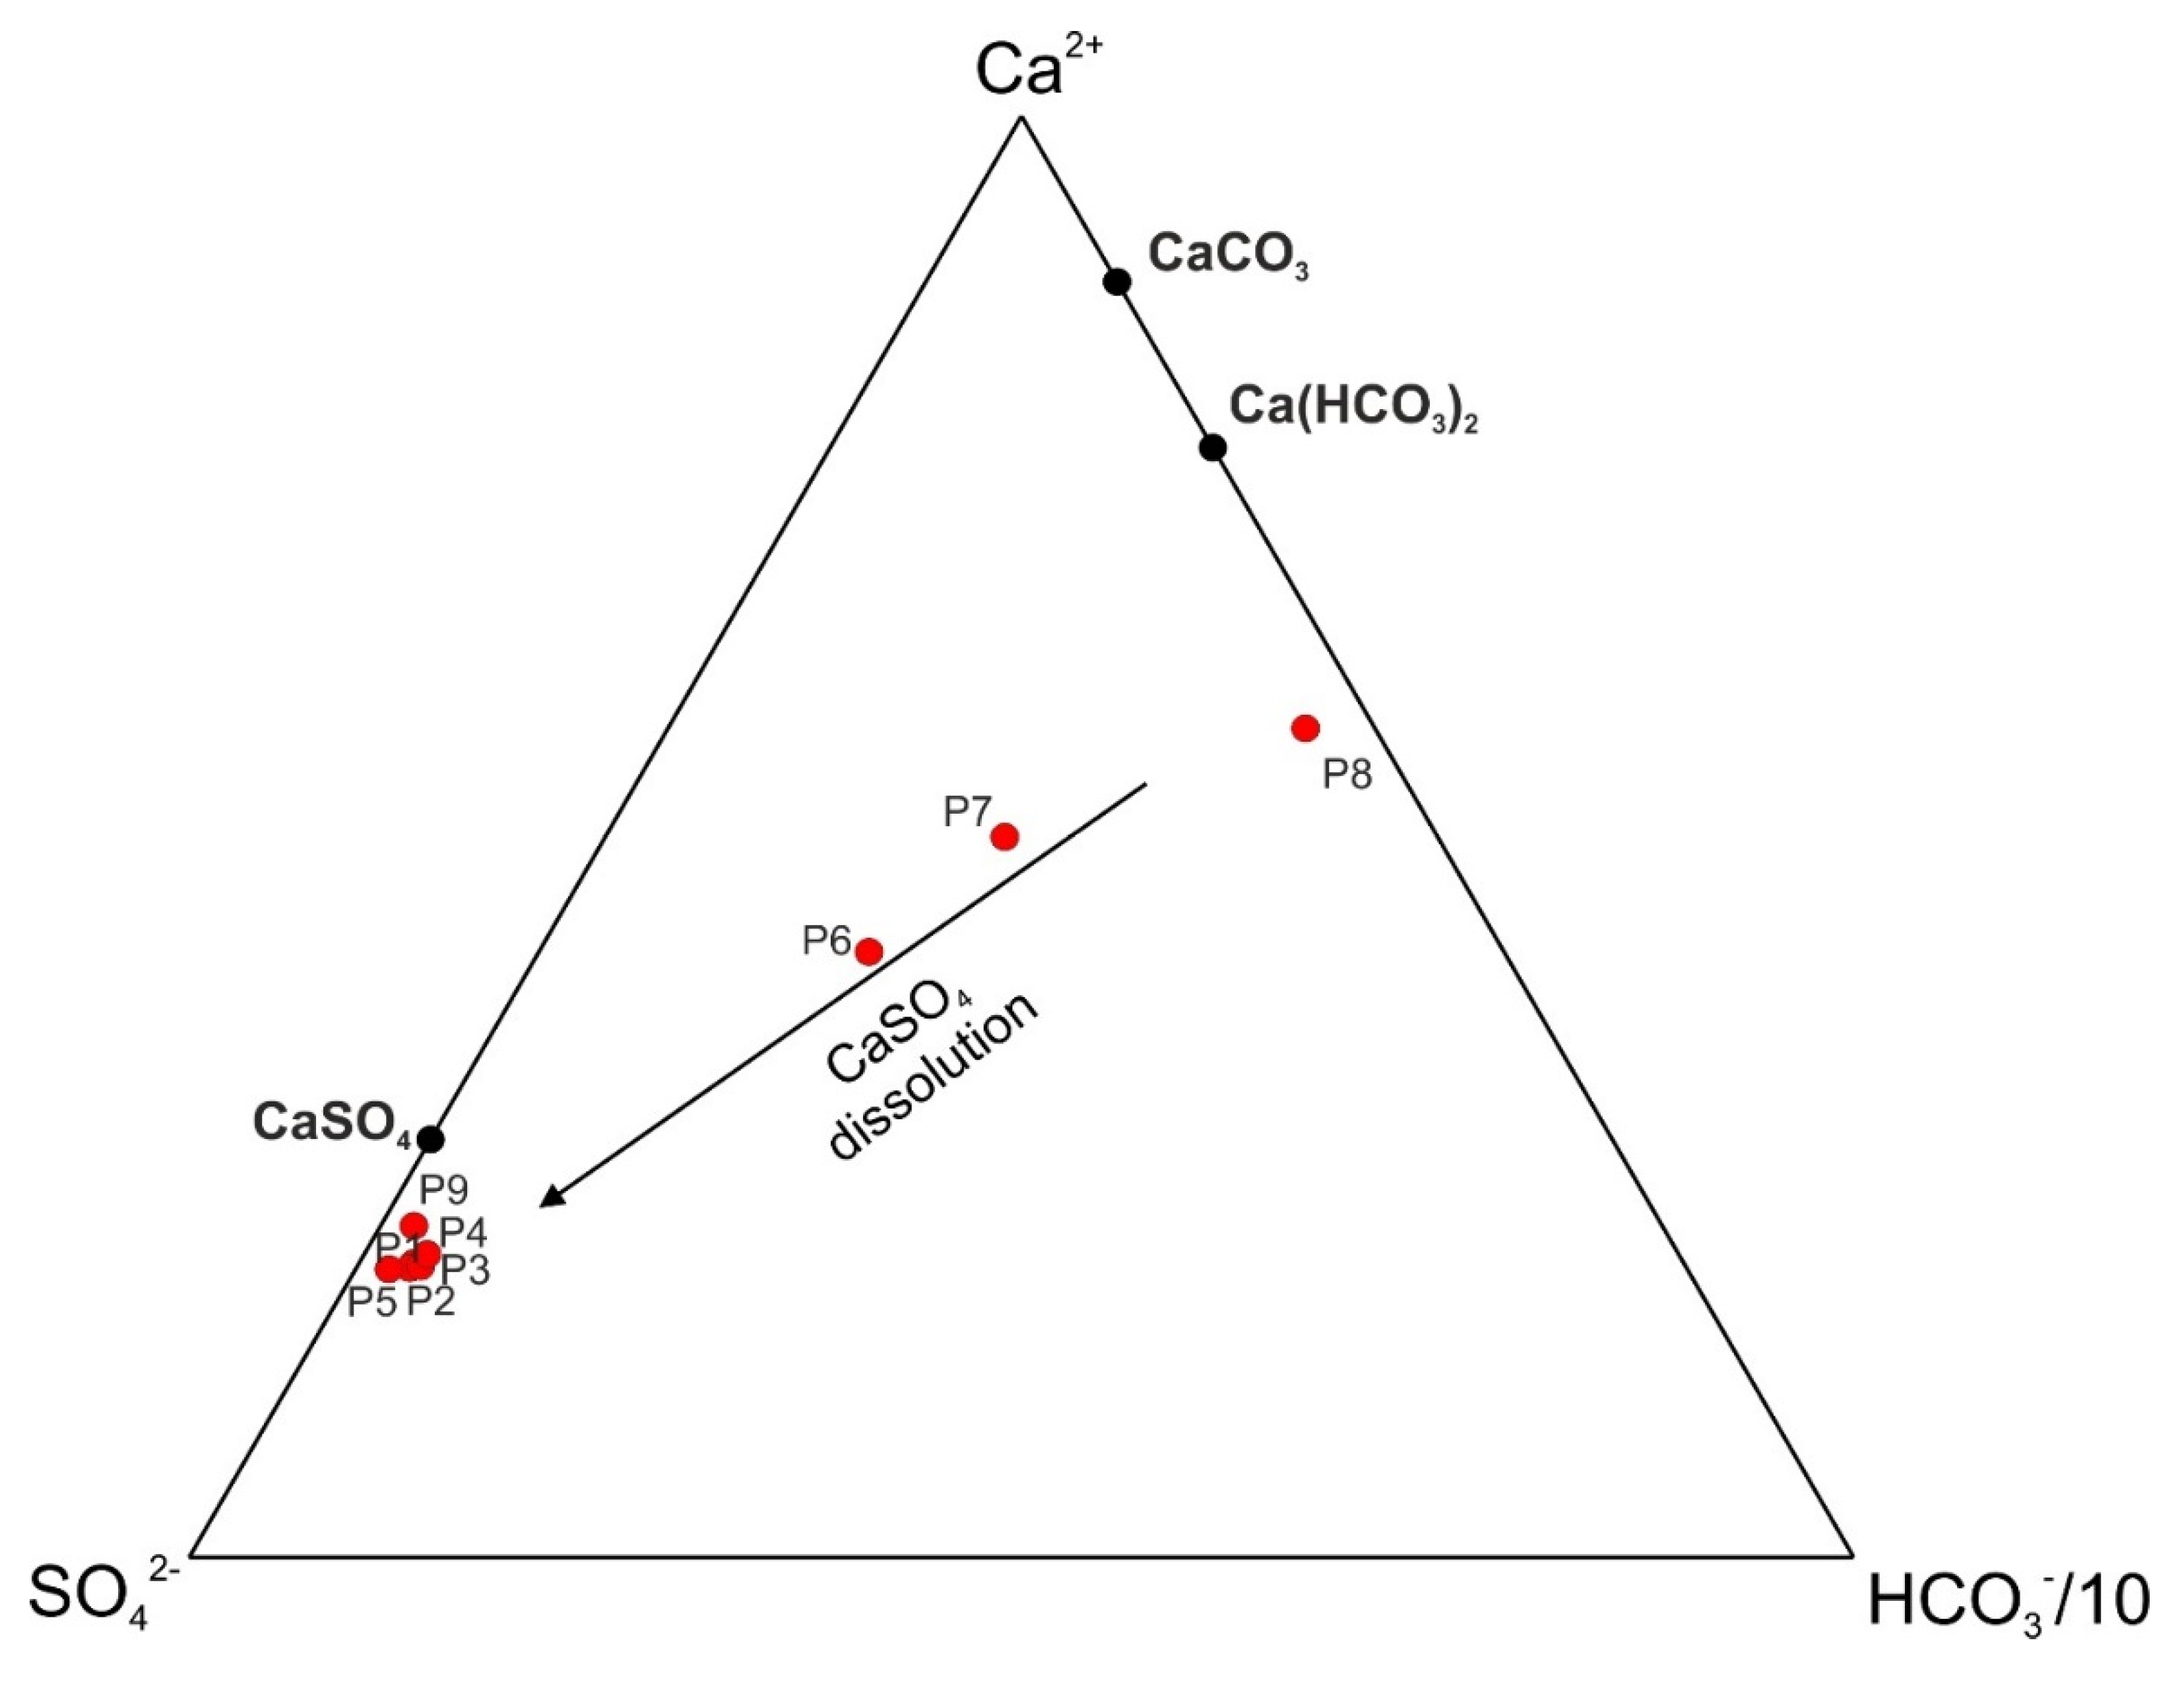
Relative concentrations of Ca2+, SO42− and HCO3− ions are shown in Figure 7 (after [79,80,81]). This kind of graph shows the dissolution of calcite and gypsum. Water from all sampling points shows a trend suggesting that the dissolution of CaSO4 is an significant process in interaction between water and rocks. Along with the trend line the Ca2+/SO42− index decreases according to the direction of thermal water flow, due to the increasing CaSO4 dissolution. The dissolution of CaSO4 leads to an increase in the value of SO42−/HCO3−, which changes the water from the dominant HCO3− to the dominant SO42−.
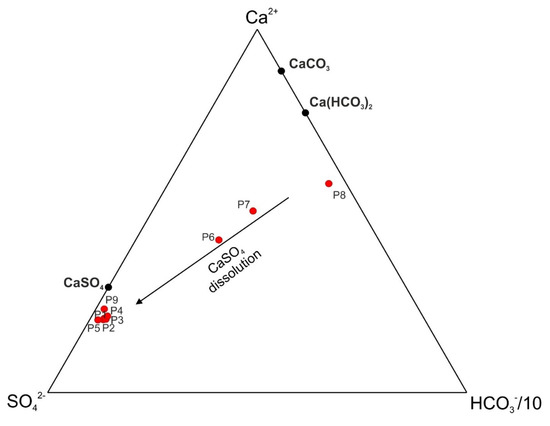
Figure 7.
The relative concentration of Ca2+, HCO3− and SO42− (mg/dm3) in thermal water from the study area (after [79,80,81]).
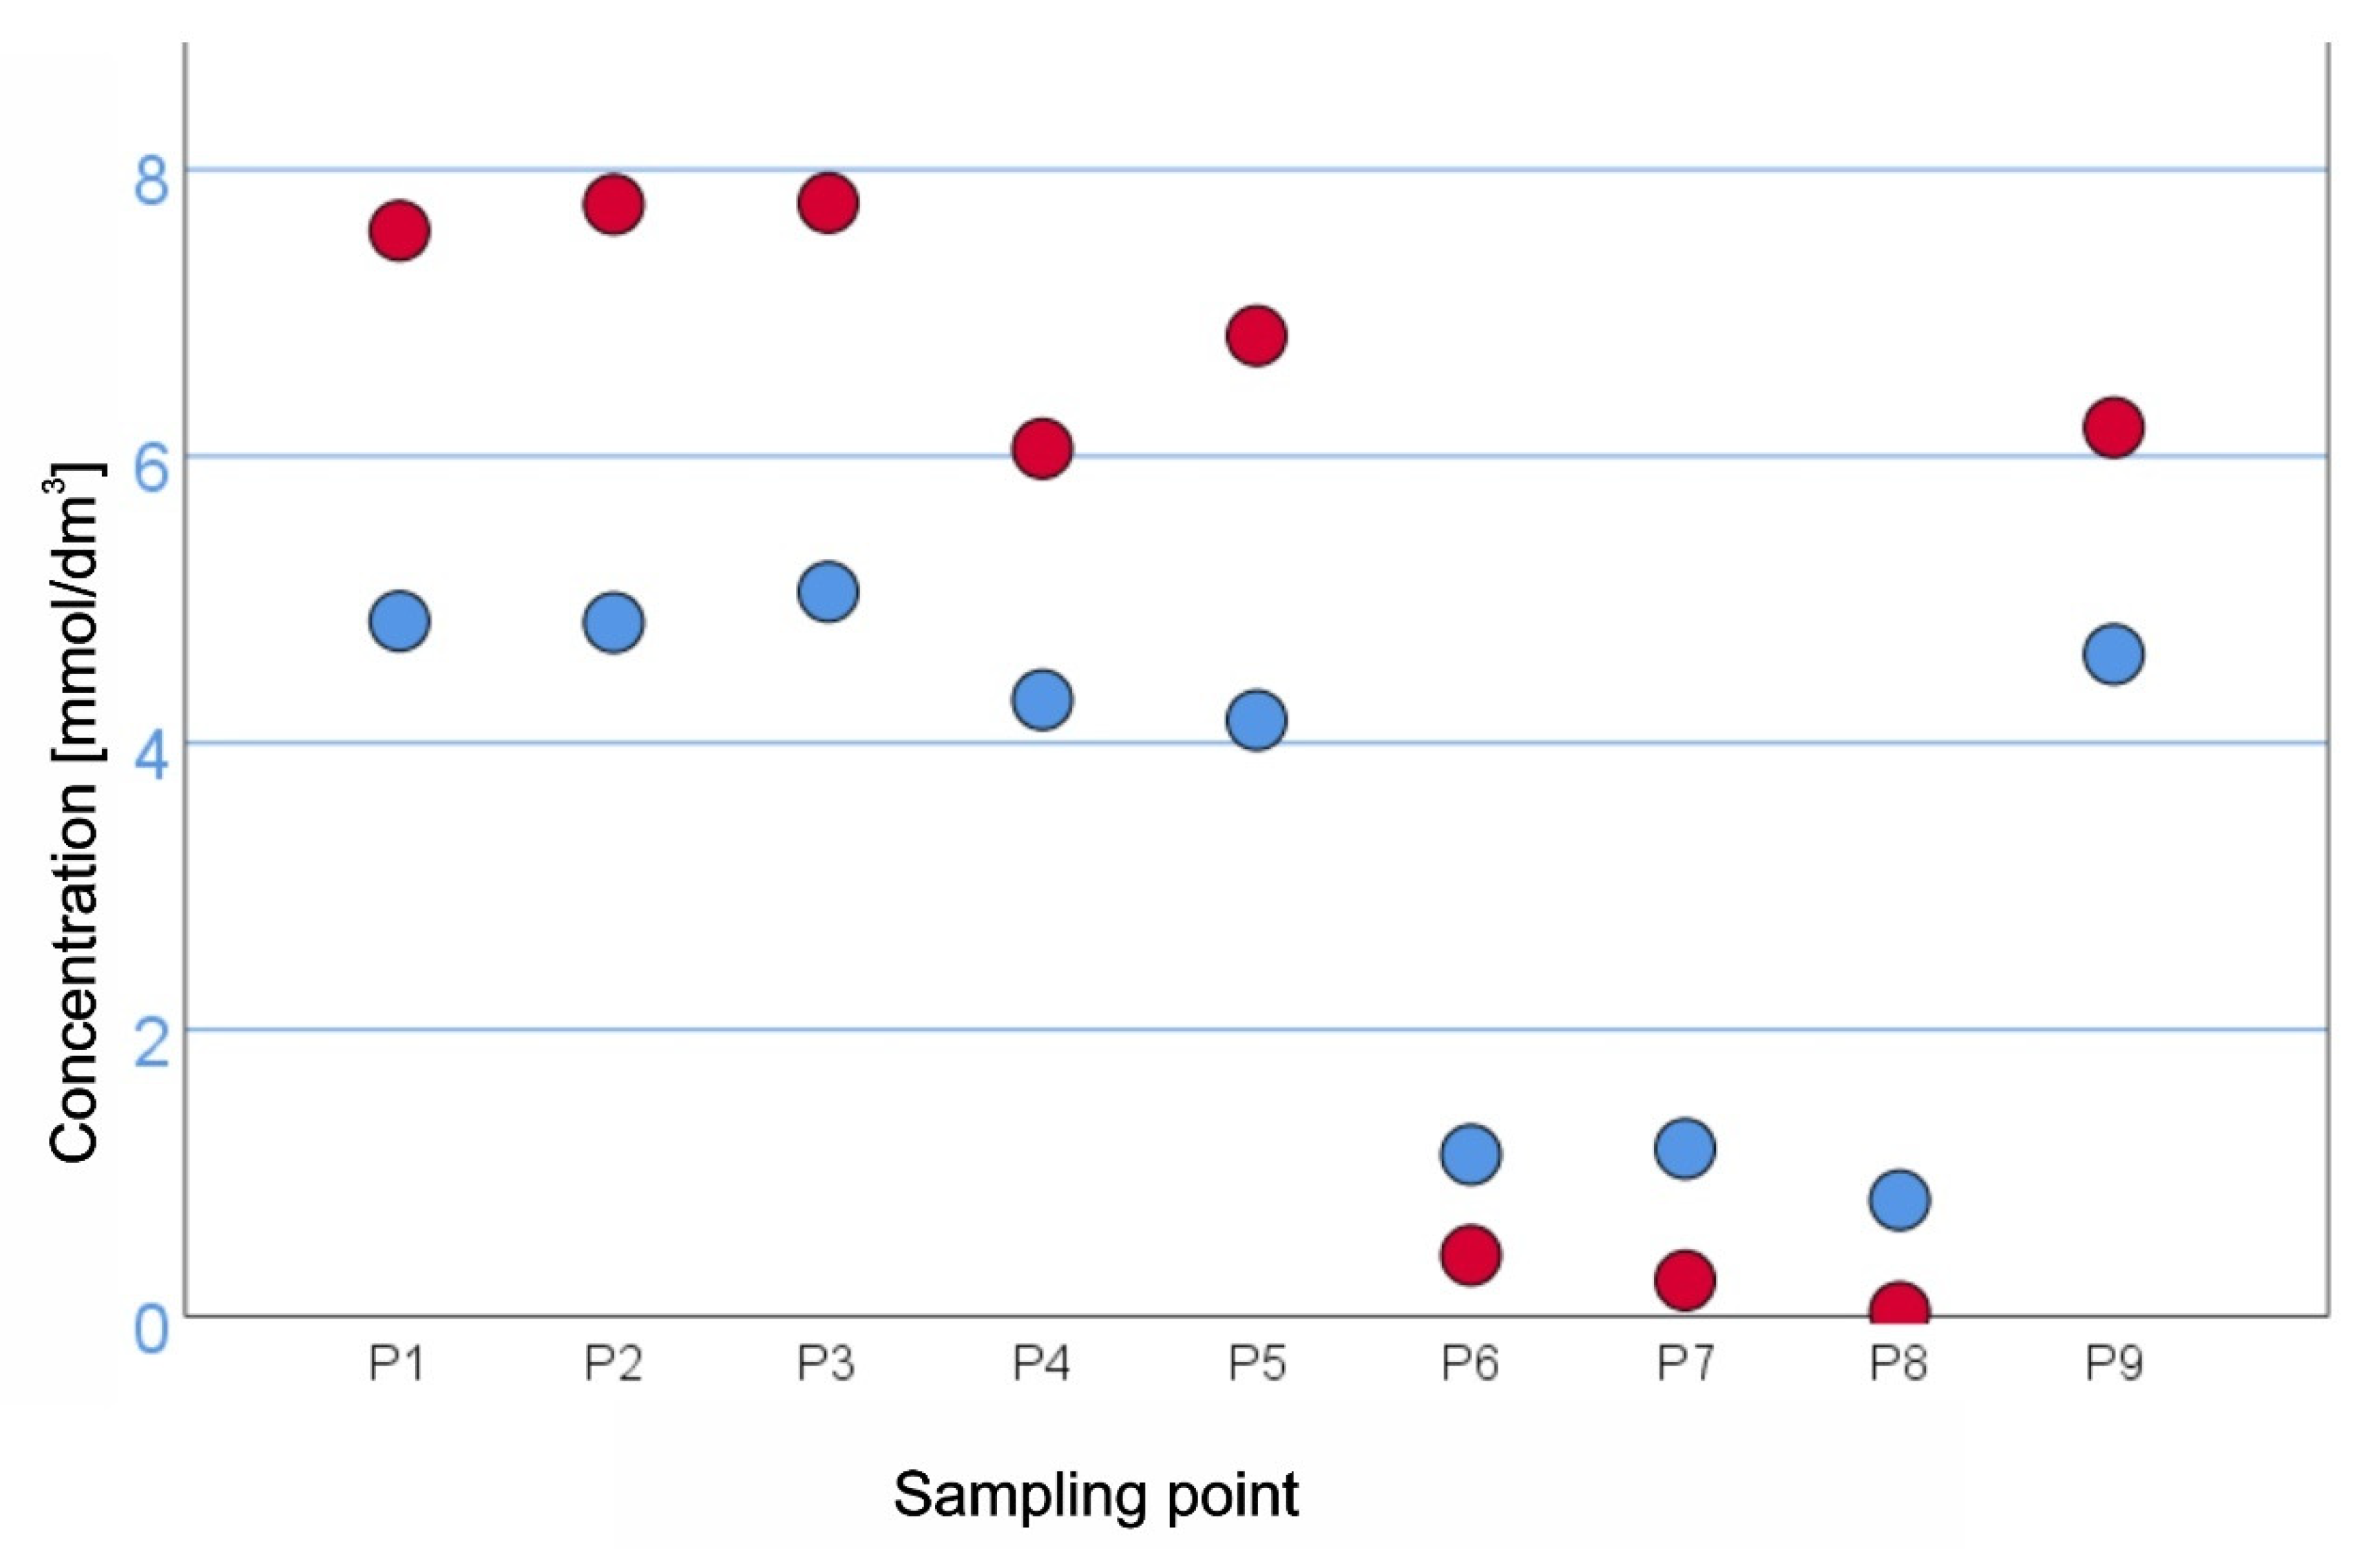
Assuming that all the SO42− ions in the thermal waters is came from gypsum dissolution, the non-gypsum Ca2+ source can be specified by subtracting the amount of Ca2+ equivalent to the amount of SO42− from the total Ca2+ concentration and expressed in mmol/dm3 [82]. Figure 8 compares the amount of SO42− and Ca2+ at individual sampling points expressed in mmol/dm3. It is noticeable that the amount of Ca2+ in sampling points located in the south (P6–P8) exceeds the equivalent amount of SO42−, which indicates the occurrence in this part of the basin of processes related to both gypsum and another mineral phase dissolution or ion exchange.
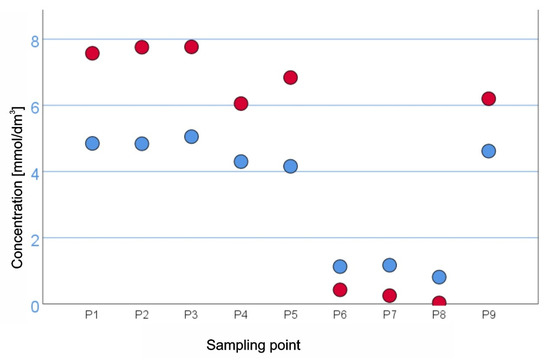
Figure 8.
Concentration of Ca2+ (blue points) and SO42− (red points) in sampling points [mmol/dm3].
At sampling points located further from the recharge area (P1–P5, P9), this relationship is inverse, which shows that the dominant process responsible for the concentration of calcium ions in this water is gypsum dissolution process. This process found its reflection in molar ratios of rCa2+/(rCa2+ + rSO42−) where the values lower than 0.5 indicate that the source of calcium in water is connected with the dissolution of gypsum (Table 4). If the molar ratio of this hydrochemical index is higher than 0.5 the Ca2+ source is other than gypsum and in terms of the authors’ study present are carbonate minerals [76].
There is also known that geothermal activity can favour the mechanism of dolomitization [83,84,85]. The presented research shows the undersaturation of Podhale thermal water relative to gypsum and supersaturation in relation to dolomite. Calcium ions released during the gypsum dissolution process may participate in the dolomitization process according to the reaction:
Ca2+ + Mg2+ + 4HCO3− ↔ CaMg(CO3)2 + 2CO2 + 2H2O
The change of the hydrogeochemical type of thermal water from HCO3-Ca-Mg to SO4-Cl-Na-Ca and SO4-Ca-Mg, demonstrated the dissolution of gypsum. Supersaturation of this water relative to dolomite, as well as decreasing amounts of bicarbonates and magnesium ions with a relatively constant calcium content (Figure 3), show that the process of dolomitization is progressing along the flow direction.
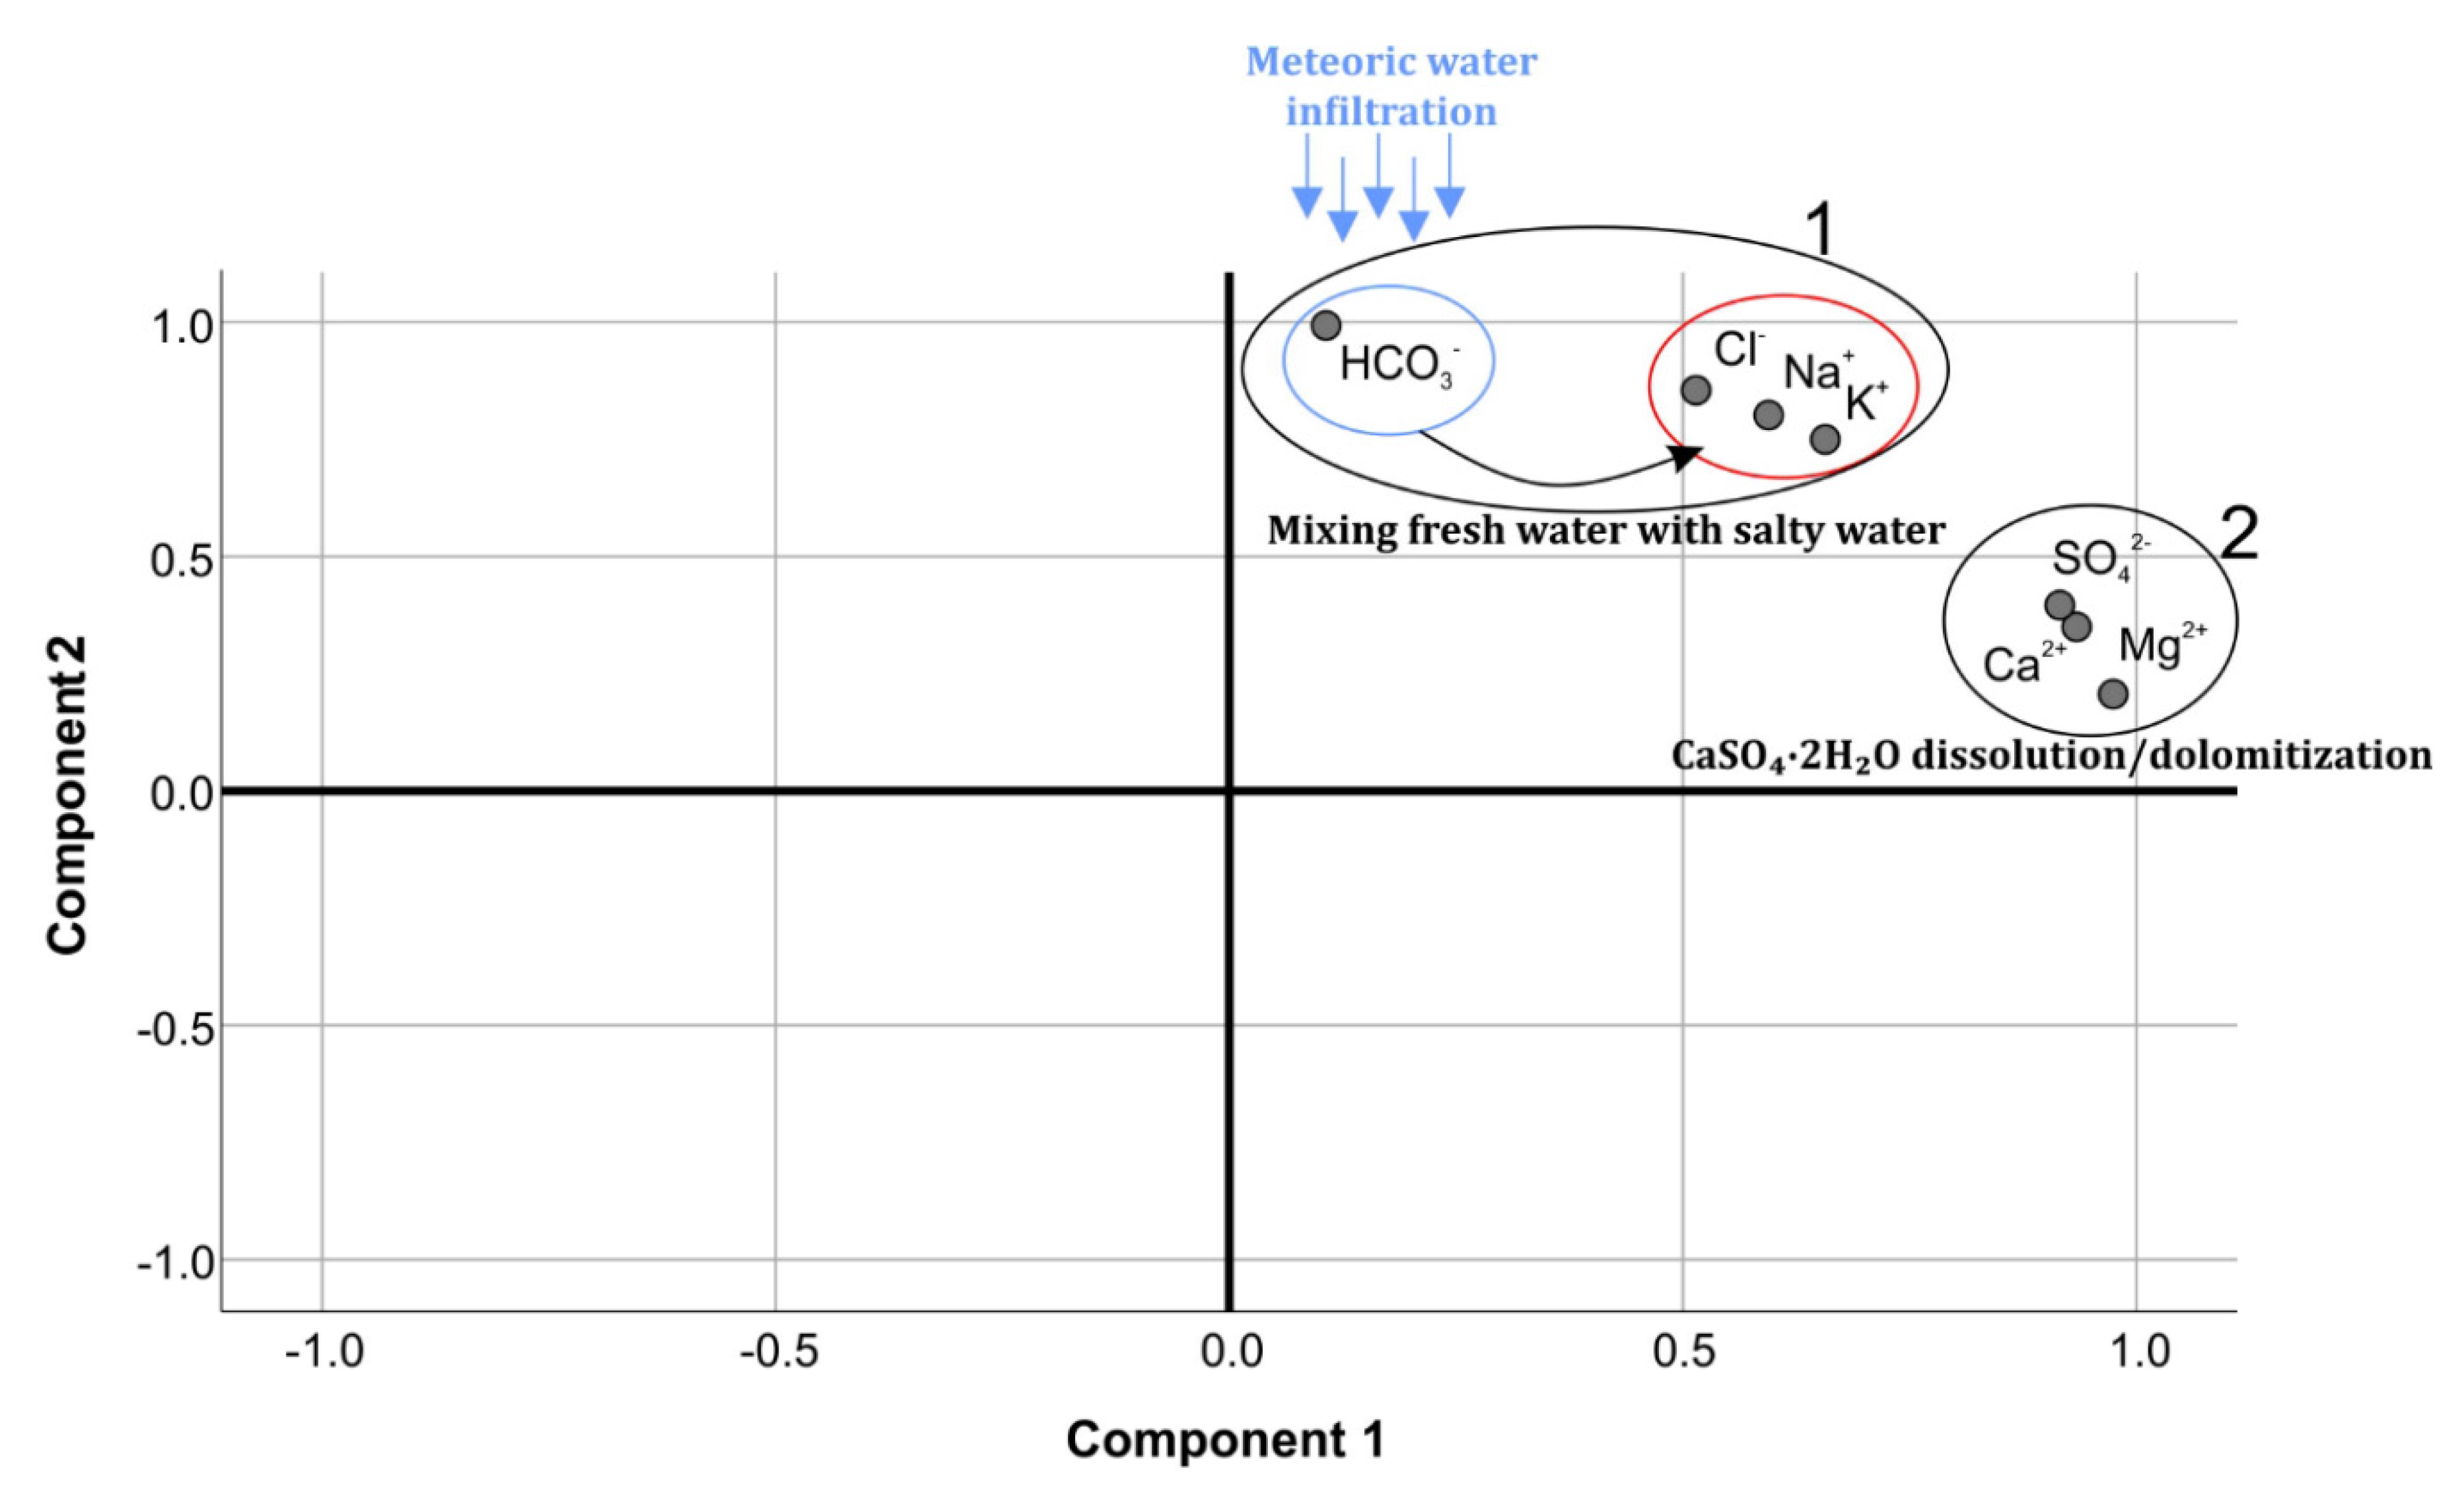
The processes described above found the confirmation in the results of principal component analysis (PCA) with the VARIMAX rotation. The data consist of seven variables (major ions—Na+, K+, Mg2+, Ca2+, Cl−, HCO3− and SO42−) and nine observations—the results of the physicochemical analyses of each thermal water intake. The Kaiser-Mayer-Olkin (KMO) and Bartlett’s tests were done to appraise correlations between data and the adequacy of the input data for the PCA concept. The results indicated a good selection of data at the significance level of 0.05 (Table 5).

Table 5.
KMO test of sampling adequacy and Bartlett’s test of sphericity.
Two principal components were selected that explained about 99.5% of the total variance. The component plot in rotated space distinguished two smaller groups of parameters in component 1 (Figure 9). They present different processes during the formation of the chemical composition of thermal water in the Podhale Trough.
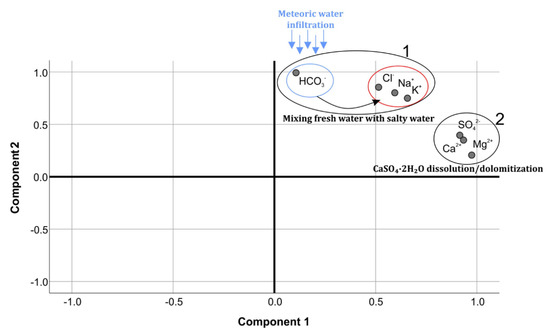
Figure 9.
Components plot in rotated space.
4. Conclusions
The research presents the regional conceptual model regarding the factors, which control the chemistry of thermal water from the Podhale Trough and the conditions of its changes. This is the region of one of the most intensive thermal water exploitations in Poland. This water is an important source of heat and it is a part of an increasingly renewable energy sources (RES) policy. This water also serves for recreational and therapeutic purposes, thus increasing the attractiveness of the entire region. Exploitation in Podhale has been significantly intensified in recent years. Greater use of thermal energy is also planned, e.g., for electricity production, by drilling new boreholes.
Directions and conditions of circulation of thermal water in the Podhale geothermal reservoir have already been the subject of research by many scientists. However, field studies and resource analyses based on numerical modelling do not comprehensively capture the hydrogeochemical characteristics of this water. The performed chemical composition analyses and attempts to determine its genesis have not been conducted before regionally with the current increased exploitation.
Due to the large exploitation and the planned increase in the use of geothermal energy in Podhale, the authors have attempted to determine not only the hydrogeochemical characteristics of the currently exploited water but also recognised the impact of reservoir rocks on the formation and the evolution of its chemical composition in the spatial and temporal system. This creates the opportunity to anticipate possible changes in its chemical composition and quality in the future.
The article presents the change of the hydrogeochemical type of the Podhale Trough thermal water from HCO3-Ca-Mg to SO4-Cl-Na-Ca and SO4-Ca-Mg along with the direction of their flow from the recharge zone in the southern part to the Pieniny Klippen Belt in the northern part.
It has been shown that the increase in the concentration of chloride and sodium ions is associated with the progressive washing of the thermal water reservoir, which in the past was filled with salty water. A decrease values of rNa+/rCl− index along with the direction of water flow indicates an increase in its salinity.
The authors also explained the change in the equivalent percentage content of sulphate, calcium, magnesium and bicarbonate ions in a few steps.
Firstly, it was shown that the source of sulphates ions increase is the gypsum dissolution process, in relation to which the examined water indicate undersaturation. The calcium ions released in this process, together with magnesium and bicarbonate ions, take part in the dolomitization process. The possibility of the dolomitization process is supported by the supersaturation index of the examined water relative to the dolomite and values of the analyzed rCa2+/rMg2+ index. The ongoing dolomitization process is probably responsible for the decrease in the equivalent percentage content of calcium, magnesium and bicarbonate ions. To check the thermodynamic feasibility of all the processes and which ones are likely taking place, the whole set of reactions should be modelled in detail with PHREEQC. This will be a subject of a further studies undertaken by the Authors. This can help to predict the influence of increased exploitation of thermal water in the Podhale Trough on its quality in terms of physical and chemical parameters. Rational thermal water management is crucial for maintaining a good quality of thermic parameters of the geothermal reservoir.
Supplementary Materials
The following are available online at https://www.mdpi.com/1996-1073/13/21/5584/s1, Figure S1: Bar graphs presenting the major ions concentrations (mg/dm3) in geothermal water of Podhale Trough (Error bars ± 1SD), the red line presents results of the latest sampling series), Figure S2: Saturation index for chosen mineral-phase. Legend: blue point—undersaturated solution, green point—stable solution, red point—oversaturated solution, red whiskers—state of equilibria
Author Contributions
Conceptualization, K.S., P.R., K.W. and E.K.; methodology, K.S., P.R., K.W. and E.K.; validation, P.R. and K.W.; formal analysis, K.S.; investigation, K.S., P.R. and K.W.; writing—original draft preparation, K.S.; writing—review and editing, P.R. and K.W.; supervision, E.K. All authors have read and agreed to the published version of the manuscript.
Funding
This research received no external funding.
Conflicts of Interest
The authors declare that they have no known competing financial interests or personal relationships that could have appeared to influence the work reported in this paper.
References
- Yang, P.; Cheng, Q.; Xie, S.; Wang, J.; Chang, L.; Yu, Q.; Zhan, Z.; Chen, F. Hydrogeochemistry and geothermometry of deep thermal water in the carbonate formation in the main urban area of Chongqing; China. J. Hydrol. 2017, 549, 50–61. [Google Scholar] [CrossRef]
- Apollaro, C.; Vespasiano, G.; Muto, F.; De Rosa, R.; Marini, L. Use of mean residence time of water, flowrate, and equilibrium temperature indicated by water geothermometers to rank geothermal resources. Application to the thermal water circuits of Northern Calabria. J. Volcanol. Geotherm. Res. 2016, 328, 147–158. [Google Scholar] [CrossRef]
- Bujakowski, W.; Tomaszewska, B.; Miecznik, M. The Podhale geothermal reservoir simulation for long-term sustainable production. Renew. Energy 2016, 99, 420–430. [Google Scholar] [CrossRef]
- Mehl, V.; Johannsen, K. Calculating chemical speciation; pH; saturation index and calcium carbonate precipitation potential (CCPP) based on alkalinity and acidity using OpenModelica. J. Water Supply Res. Technol.—AQUA 2018, 67, 1–11. [Google Scholar] [CrossRef]
- Olivier, J.; Van Niekerk, H.J.; Van der Walt, I.J. Physical and chemical characteristics of thermal springs in the Waterberg area in Limpopo Province; South Africa. Water SA 2008, 34, 163–174. [Google Scholar] [CrossRef]
- Süer, S.; Güleç, N.; Mutlu, H.; Hilton, D.R.; Çifter, C.; Sayin, M. Geochemical Monitoring of Geothermal Waters (2002–2004) along the North Anatolian Fault Zone; Turkey: Spatial and Temporal Variations and Relationship to Seismic Activity. Pure Appl. Geophys. 2008, 165, 17–43. [Google Scholar] [CrossRef]
- Tomaszewska, B.; Kmiecik, E.; Wątor, K.; Tyszer, M. Use of numerical modelling in the prediction of membrane scaling. Reaction between antiscalants and feedwater. Desalination 2018, 427, 27–34. [Google Scholar] [CrossRef]
- Tomaszewska, B.; Pająk, L. Dynamics of clogging processes in injection wells used to pump highly mineralized thermal waters into the sandstone structures lying under the Polish Lowland. Archiv. Environ. Protect. 2012, 38, 103–117. [Google Scholar] [CrossRef]
- Gheorghe, A.; Grǎciun, P. Thermal aquifers in Romania. J. Hydrol. 1993, 145, 111–123. [Google Scholar] [CrossRef]
- Vaselli, O.; Minissale, A.; Tassi, F.; Magro, G.; Seghedi, I.; Ioane, D.; Szakacs, A. A geochemical traverse across the Eastern Carpathians (Romania): Constraints on the origin and evolution of the mineral water and gas discharges. Chem. Geol. 2002, 182, 637–654. [Google Scholar] [CrossRef]
- Fendek, M.; Rebro, A.; Fendekova, M. A spell cast: Historical aspects of thermal spring use in the Western Carpathian Region. In Stories From a Heated Earth: Our Geothermal Heritage, 1st ed.; Cataldi, R., Hodgson, S.F., Lund, J.W., Eds.; Geothermal Resources Council; International Geothermal Association: Sacramento, CA, USA, 1999; pp. 251–265. [Google Scholar]
- Varga, C. Volatile organics in thermal spa waters: Active ingredients or environmental toxicants. Thermae Spa Med. 2012, 1, 1–8. [Google Scholar]
- Barbacki, A.; Bujakowski, W.; Pająk, L.; Ney, R. Atlas of Geothermal Water Reservoirs in Malopolska; Wydawnictwo Instytutu Gospodarki Surowcami Mineralnymi i Energią PAN: Kraków, Poland, 2006. (In Polish) [Google Scholar]
- Kasztelewicz, A. Selected mineralogical and petrographic aspects of the reservoir rock of the Podhale geothermal system. Tech. Poszuk. Geolog. Geotermia Zrówn. Rozwój 2018, 1, 105–117. (In Polish) [Google Scholar]
- Kępińska, B. Warunki Termiczne I Hydrotermalne Podhalańskiego Systemu Geotermalnego, 1st ed.; Wydawnictwo IGSMiE PAN: Kraków, Poland, 2006. (In Polish) [Google Scholar]
- Chenaker, H.; Houha, B.; Vincent, V. Hydrogeochemistry and geothermometry of thermal water from north-eastern Algeria. Geothermics 2018, 75, 137–145. [Google Scholar] [CrossRef]
- Wątor, K.; Dobrzyński, D.; Sugimori, K.; Kmiecik, E. Redox potential research in the field of balneochemistry: Case study on equilibrium approach to bioactive elements in therapeutic waters. Int. J. Biometeorol. 2020, 64, 815–826. [Google Scholar] [CrossRef] [PubMed]
- Tomaszewska, B. The prognosis of scaling phenomena in geothermal system using the geochemical modeling methods. Miner. Resour. Manag. 2008, 24, 399–407. [Google Scholar]
- Tomaszewska, B.; Dendys, M. Zero-waste initiatives—Waste geothermal water as a source of medicinal raw material and drinking water. Desalin. Water Treat. 2018, 112, 12–18. [Google Scholar] [CrossRef]
- Gerardo, J.Y.; Nuti, S.; D’Amore, F.; Seastres, J., Jr.; Gonfiantini, R. Isotopic evidence for magmatic and meteoric water recharge and the processes affecting reservoir fluids in the Palinpinon geothermal system, Philippines. Geothermics 1993, 22, 521–533. [Google Scholar] [CrossRef]
- Lambrakis, N.J.; Stamatis, G.N. Contribution to the study of thermal waters in Greece: Chemical patterns and origin of thermal water in the thermal springs of Lesvos. Hydrol. Process. Int. J. 2008, 22, 171–180. [Google Scholar] [CrossRef]
- Lambrakis, N.; Kallergis, G. Contribution to the study of Greek thermal springs: Hydrogeological and hydrochemical characteristics and origin of thermal waters. Hydrogeol. Geol. J. 2005, 13, 506–521. [Google Scholar] [CrossRef]
- Marques, J.M.; Carreira, P.M.; Carvalho, M.R.; Matias, M.J.; Goff, F.E.; Basto, M.J.; Rocha, L. Origins of high pH mineral waters from ultramafic rocks; Central Portugal. Appl. Geochem. 2008, 23, 3278–3289. [Google Scholar] [CrossRef]
- He, K.; Stober, I.; Bucher, K. Chemical evolution of thermal waters from limestone aquifers of the Southern Upper Rhine Valley. Appl. Geochem. 1999, 14, 223–235. [Google Scholar] [CrossRef]
- Lipiec, I.; Wątor, K.; Kmiecik, E. The application of selected hydrochemical indicators in the interpretation of hydrogeochemical data—A case study from Busko-Zdroj and Solec-Zdroj (Poland). Ecol. Indic. 2020, 115, 106460. [Google Scholar] [CrossRef]
- Vengosh, A.; Helvacı, C.; Karamanderesi, I.H. Geochemical constraints for the origin of thermal waters from western Turkey. Appl. Geochem. 2002, 17, 163–183. [Google Scholar] [CrossRef]
- Besser, H.; Mokadem, N.; Redhaounia, B.; Hadji, R.; Hamad, A.; Hamed, Y. Groundwater mixing and geochemical assessment of low-enthalpy resources in the geothermal field of southwestern Tunisia. Euro-Mediterranean J. Env. Integ. 2018, 3, 16. [Google Scholar] [CrossRef]
- Foued, B.; Hénia, D.; Lazhar, B.; Nabil, M.; Nabil, C. Hydrogeochemistry and geothermometry of thermal springs from the Guelma region, Algeria. J. Geol. Soc. India 2017, 90, 226–232. [Google Scholar] [CrossRef]
- Mendonca, J.L.; da Silva, M.O.; Bahir, M. Considerations concerning the origin of the Estoril (Portugal) thermal water. Estud. Geológicos 2004, 60, 153–159. [Google Scholar]
- Venturelli, G.; Boschetti, T.; Duchi, V. Na-carbonate waters of extreme composition: Possible origin and evolution. Geochem. J. 2003, 37, 351–366. [Google Scholar] [CrossRef]
- Chowaniec, J.; Poprawa, D.; Witek, K. Occurrence of thermal waters in the Polish Carpathians (southern Poland). Przegląd Geolog. 2001, 49, 734–742. (In Polish) [Google Scholar]
- Korzec, K. Charakterystyka Hydrogeochemiczna Wód Termalnych w Rejonie Bańskiej Niżnej. Ph.D. Thesis, AGH University of Science and Technology, Kraków, Poland, 2016. (In Polish). [Google Scholar]
- Mika, A.; Wątor, K.; Kmiecik, E.; Sekuła, K. Determination of iodine in geothermal water samples—Preliminary ICP-MS method validation results. Water Sci. Tech. W. Sup. 2019, 19, 1264–1270. [Google Scholar] [CrossRef]
- Porowski, A. Chemical and Isotopic Characteristics of Thermal Waters in the Carpathian Region; South Poland: Implication to the Origin and Resources. In Thermal and Mineral Waters, 1st ed.; LaMoreaux, J.W., Ed.; Springer: Tuscaloosa, AL, USA, 2014. [Google Scholar] [CrossRef]
- Rusiniak, P.; Ruszczyńska, A.; Wątor, K.; Bulska, E.; Kmiecik, E. Methodological aspects concerning sampling and determination of total selenium and selenium species in geothermal waters. Bull. Geogr. Phys. Geogr. Ser. 2020, 18, 5–16. [Google Scholar] [CrossRef]
- Shvartsev, S.L.; Sun, Z.; Borzenko, S.V.; Gao, B.; Tokarenko, O.G.; Zippa, E.V. Geochemistry of the thermal waters in Jiangxi Province; China. Appl. Geochem. 2018, 96, 113–130. [Google Scholar] [CrossRef]
- Chowaniec, J.; Duliński, M.; Mochalski, P.; Najman, J.; Śliwka, I.; Zuber, A. Environmental tracers in thermal water of Podhale Basin. Przegląd Geol. 2009, 57, 685–693. (In Polish) [Google Scholar]
- Oszczypko, N.; Zuber, A. Geological and isotopic evidence of diagenetic waters in the Polish Flysch Carpathians. Geol. Carpath. 2002, 53, 257–268. [Google Scholar]
- Porowski, A. Origin of mineralized waters in the central Carpathian synclinorium; SE Poland. Studia Geol. Pol. 2006, 125, 5–67. [Google Scholar]
- Witczak, S. Analiza i Interpretacja Składu Fizyko-Chemicznego Wód Eksploatowanych W Białym Dunajcu I Bańskiej Pod Kątem Poznawania Systemu Geotermalnego Podhala, 1st ed.; Arch. IGSMiE PAN: Kraków, Poland, 1999. (In Polish) [Google Scholar]
- Dz. U. 2011 nr 163 poz. 981 Polish Geological and Mininig Law. Available online: https://isap.sejm.gov.pl/isap.nsf/download.xsp/WDU20111630981/U/D20110981Lj.pdf (accessed on 1 September 2020). (In Polish)
- Hałaj, E. Geothermal bathing and recreation centres in Poland. Environ. Earth Sci. 2015, 74, 7497–7509. [Google Scholar] [CrossRef][Green Version]
- Kępińska, B.; Ciągło, J. Możliwość zagospodarowania wód geotermalnych Podhala do celów balneoterapeutycznych i rekreacyjnych [Possibilities of use of the Podhale geothermal waters for balneotherapeutical and recreational purposes]. Geologia 2008, 34, 541–559. (In Polish) [Google Scholar]
- Kępińska, B. Model Geologiczno-Geotermalny Niecki Podhalańskiej, 1st ed.; Wyd. CPPGSMiE PAN: Kraków, Poland, 1997; pp. 5–11. (In Polish) [Google Scholar]
- Dowgiałło, J. Occurrence and use of mineral and thermal waters in Poland. Environ. Earth Sci. 2012, 67, 2251–2259. [Google Scholar] [CrossRef]
- ISO 5667-11. Water Quality—Sampling—Part 11: Guidance on Sampling of Groundwaters; ISO: Geneva, Switzerland, 2009. [Google Scholar]
- Kmiecik, E.; Wątor, K.; Tomaszewska, B.; Sekuła, K.; Mika, A. Methodological aspects of pH and EC measurements in geothermal water. Bull. Geogr. Phys. Geogr. Ser. 2019, 17, 39–47. [Google Scholar] [CrossRef]
- EN 27888. Water Quality—Determination of Electrical Conductivity, 1993; Comite Europeen de Normalisation: Brussels, Belgique, 1993. [Google Scholar]
- ISO 10523. Water Quality—Determination of pH; ISO: Geneva, Switzerland, 2008. [Google Scholar]
- Standard Methods. Standard Methods for the Examination of Water and Wastewater, 22nd ed.; American Public Health Association: Washington, DC, USA; American Water Works Association: Denver, CO, USA; Water Environment Federation: Alexandria, VA, USA, 2012. [Google Scholar]
- ISO 11885. Water Quality—Determination of Selected Elements by Inductively Coupled Plasma Optical Emission Spectrometry (ICP-OES); ISO: Geneva, Switzerland, 2007. [Google Scholar]
- ISO 17294-2. Water Quality—Application of Inductively Coupled Plasma Mass Spectrometry (ICP-MS)—Part 2: Determination of Selected Elements Including Uranium Isotopes; ISO: Geneva, Switzerland, 2016. [Google Scholar]
- ISO 9297. Water quality—Determination of Chloride—Silver Nitrate Titration with Chromate Indicator (Mohr’s Method); ISO: Geneva, Switzerland, 1989. [Google Scholar]
- ISO 9963-1. Water Quality—Determination of Alkalinity—Part 1: Determination of Total and Composite Alkalinity; ISO: Geneva, Switzerland, 1994. [Google Scholar]
- PN-C-04566-03. Woda I Ścieki—Badania Zawartości Siarki I Jej Związków—Oznaczanie Siarkowodoru I Siarczków Rozpuszczalnych Metodą Tiomerkurymetryczną; Polish Commenttee for Standardization: Warsaw, Poland, 1982. (In Polish) [Google Scholar]
- Miller, J.N.; Miller, J.C. Statistics and Chemometrics for Analytical Chemistry, 5th ed.; Pearson Education: Harrow, UK, 2005. [Google Scholar]
- Otto, M. Chemometrics: Statistics and Computer Application in Analytical Chemistry, 3rd ed.; Wilet-VCH: Freiberd, Germany, 2016. [Google Scholar]
- Wątor, K.; Kmiecik, E.; Lipiec, I. The use of principal component analysis for the assessment of the spatial variability of curative waters from the Busko-Zdrój and Solec-Zdrój region (Poland)–Preliminary results. Water Supply 2019, 19, 1137–1143. [Google Scholar] [CrossRef]
- Kmiecik, E.; Korzec, K. Ocena stabilności składu chemicznego wód termalnych ujmowanych otworem Bańska PGP-1 w Bańskiej Niżnej; Podhale—Analysis of chemical composition stability of thermal water from Bańska PGP-1 well; Podhale. Przegląd Geol. 2015, 63, 830–833. (In Polish) [Google Scholar]
- Wątor, K.; Mika, A.; Sekuła, K.; Kmiecik, E. Assessment the impact of samplers change on the uncertainty related to geothermal water sampling. In Proceedings of the E3S Web of Conferences Water, “Water, Wastewater and Energy in Smart Cities”: The First Conference of the International Water Association IWA for Young Scientist in Poland, Kraków, Poland, 12–13 September 2018; pp. 1–8. [Google Scholar]
- Mika, A.; Korzec, K. Ocena stabilności stężeń kwasu metakrzemowego w wodach termalnych ujmowanych otworem Bańska PGP-1 w Bańskiej Niżnej—Analysis of the concentration stability of metasilic acid in the thermal water from the Bańska PGP-1 well. Tech. Poszu. Geolog. Geoterm. Zrówn. Rozwój 2015, 54, 89–96. (In Polish) [Google Scholar]
- Pazdro, Z.; Kozerski, B. Hydrogeologia Ogólna, 1st ed.; Wydawnictwa Geologiczne: Warsaw, Poland, 1990. (In Polish) [Google Scholar]
- Witczak, S.; Kania, J.; Kmiecik, E. Katalog Wybranych Fizycznych I Chemicznych Wskaźników Wód Podziemnych I Metod Ich Oznaczania, 1st ed.; IOŚ: Warszawa, Poland, 2013. (In Polish) [Google Scholar]
- Borzenko, S.V.; Zippa, E.V. Isotopic Composition and Origin of Sulfde and Sulfate Species of Sulfur in Thermal Waters of Jiangxi Province (China). Aquat. Geochem. 2019, 25, 49–62. [Google Scholar] [CrossRef]
- Goldstein, T.P.; Aizenshtat, Z. Thermochemical sulfate reduction. A review. J. Therm. Anal. Calorim. 1994, 42, 241–290. [Google Scholar] [CrossRef]
- Appelo, C.A.J.; Postma, D. Geochemistry Groundwater and Pollution, 2nd ed.; CRC Press Balkema: Rotterdam, The Netherlands, 2005. [Google Scholar]
- Parkhurst, D.L.; Appelo, C.A.J. User’s Guide to PHREEQC—A Computer Program for Speciation Reaction-Path 1D-Transport and Inverse Geochemical Calculations, 1st ed.; US Geological Survey: Denver, CO, USA, 1999.
- Chowaniec, J.; Kępińska, B.; Mazurek, J.; Pawlikowski, M.; Poprawa, D. Badania mineralogiczno-petrograficzne skał zbiornikowych wód termalnych z otworu Bukowina Tatrzańska PIG/PNiG-1. Mineralogical and petrographical investigations of thermal waters’ reservoir rocks from Bukowina Tatrzańska PIG/PNiG-1 well (southern Poland). Przegląd Geol. 1999, 47, 1096–1100. (In Polish) [Google Scholar]
- Sekuła, K.; Tomaszewska, B.; Wątor, K.; Kmiecik, E.; Mika, A. Modelowanie hydrogeochemiczne wód termalnych eksploatowanych z trzech ujęć geotermalnych w Bańskiej Niżnej (Podhale)—Hydrogeochemical modelling of thermal waters exploited from three geothermal wells in Bańska Niżna (Podhale; south Poland). Przegląd Geol. 2017, 65, 1014–1018. (In Polish) [Google Scholar]
- Bea, S.A.; Mayer, U.K.; Macquarrie, T.B. Reactive transport and thermo-hydro-mechanical coupling in deep sedimentary basins affected by glaciation cycles: Models development, verification, and illustrative example. Geofluids 2016, 16, 279–300. [Google Scholar] [CrossRef]
- Cloutier, V.; Lefebvre, R.; Savard, M.M.; Therrien, R. Desalination of a sedimentary rock aquifer system invaded by Pleistocene Champlain Sea water and processes controlling groundwater geochemistry. Environ. Earth Sci. 2010, 59, 977–994. [Google Scholar] [CrossRef]
- Pavlova, G.Y.; Tishchenko, P.Y.; Khodorenko, N.D.; Shvetsova, M.G.; Sagalaev, S.G. Major ion composition and carbonate equilibrium in the sediment pore water of the Razdol’naya River estuary of Amur Bay; the Sea of Japan. Russ. J. Pac. Geol. 2012, 6, 251–262. [Google Scholar] [CrossRef]
- Tianxiao, Y.; Min, W.; Liang, C. Hydrogeochemical characteristics and genetic analysis of Dongying Basin. In Proceedings of the 30th International Geological Congress, Beijing, China, 4–14 August 1996; Krothe, F.J., Ed.; Taylor & Francis Group: Utrecht, The Netherlands, 1997; Volume 22, pp. 80–88. [Google Scholar]
- Zghibi, A.; Merzougui, A.; Zouhri, L.; Tarhouni, J. Interaction between groundwater and seawater in the coastal aquifer of Cap-Bon in the semi-arid systems (north-east of Tunisia). Carbonates Evaporites 2014, 29, 309–326. [Google Scholar] [CrossRef]
- Sapińska-Śliwa, A.; Lewkiewicz-Małysa, A.; Winid, B. Wody termalne Uniejowa w świetle interpetacji wskaźników hydrogeochemicznych. Wiert. Naft. Gaz 2011, 28, 359–369. (In Polish) [Google Scholar]
- Hounslow, A. Water Quality Data: Analysis and Interpretation, 1st ed.; CRC Press: Boca Raton, FL, USA, 1995; pp. 167–180. [Google Scholar]
- Ma, R.; Wang, Y.; Sun, Z.; Zheng, C.; Ma, T.; Prommer, H. Geochemical evolution of groundwater in carbonate aquifers in Taiyuan; northern China. Appl. Geochem. 2011, 26, 884–897. [Google Scholar] [CrossRef]
- Xiao, Q.; Jiang, Y.; Shen, L.; Tuan, D. Origin of calcium sulfate-type water in Triassic carbonate thermal water system in Chongqing; China: A chemical and isotopic reconnaissance. Appl. Geochem. 2018, 86, 49–58. [Google Scholar] [CrossRef]
- Gemici, Ü.; Tarcan, G.; Çolak, M.; Helvacı, C. Hydrogeochemical and hydrogeological investigations of thermal waters in the Emet area (Kütahya, Turkey). Appl. Geochem. 2004, 19, 105–117. [Google Scholar] [CrossRef]
- Kawouridis, T.; Kuris, D.; Leonis, C.; Liberopoulou, V.; Leontiadis, J.; Panichi, C.; La Ruffa, G.; Caprai, A. Isotope and chemical studies for a geothermal assessment of the island of Nisyros (Greece). Geothermics 1999, 28, 219–239. [Google Scholar] [CrossRef]
- Lowenstein, T.K.; Risacher, F. Close Basin Brine Evolution and the Influence of Ca–Cl Inflow Waters: Death Valley and Bristol Dry Lake California; Qaidam Basin; China; and Salar de Atacama; Chile. Aquat. Geochem. 2009, 15, 71–94. [Google Scholar] [CrossRef]
- Wang, Y.; Guo, Q.; Su, C.; Ma, T. Strontium isotope characterization and major ion geochemistry of karst water flow; Shentou; northern China. J. Hydrol. 2006, 328, 592–603. [Google Scholar] [CrossRef]
- Abarca, E.; Idiart, A.; Grandia, F.; Rodríguez-Morillas, N.; Pellan, C.; Zen, M.; Aït-Ettajer, T.; Fontanelli, L. 3D reactive transport modeling of porosity evolution in a carbonate reservoir through dolomitization. Chem. Geol. 2019, 513, 84–199. [Google Scholar] [CrossRef]
- Dong, Y.; Chen, H.; Wang, J.; Hou, M.; Xu, S.; Zhu, P.; Zhang, C.; Cui, Y. Thermal convection dolomitization induced by the Emeishan Large Igneous Province. Mar. Pet. Geol. 2020, 116, 104308. [Google Scholar] [CrossRef]
- Ngia, N.R.; Hu, M.; Gao, D. Tectonic and geothermal controls on dolomitization and dolomitizing fluid flows in the Cambrian-Lower Ordovician carbonate successions in the western and central Tarim Basin; NW China. J. Asian Earth Sci. 2019, 172, 359–382. [Google Scholar] [CrossRef]
Publisher’s Note: MDPI stays neutral with regard to jurisdictional claims in published maps and institutional affiliations. |
© 2020 by the authors. Licensee MDPI, Basel, Switzerland. This article is an open access article distributed under the terms and conditions of the Creative Commons Attribution (CC BY) license (http://creativecommons.org/licenses/by/4.0/).

