Abstract
Accurate simulation and prediction of occupants’ energy use behavior are crucial in building energy consumption research. However, few studies have focused on household energy use behavior in severely cold regions that have unique energy use patterns because of the low demand of cooling in summer and the use of central heating system in winter. Thus, we developed an agent-based model to simulate the household electricity use behavior in severely cold regions, according to data for Harbin, China. The model regards apartments, residents, household appliances, and energy-management departments as agents and generates the household electricity consumption with respect to time, temperature, and energy-saving events. The simulation parameters include basic information of the residents, their energy-saving awareness, their appliance use behaviors, and the impact of energy-saving management. Electricity use patterns are described by decision-making mechanisms and probabilities obtained through a questionnaire survey. In the end, the energy-saving effects of different management strategies are evaluated. The results indicate that the model can visually present and accurately predict the dynamic energy use behavior of residents. The energy-saving potential of household electricity use in severely cold regions is mainly concentrated in lighting and standby waste, rather than cooling and heating, since the cooling demand in summer is low and the heating in winter mainly relies on central heating system of the city, not on household electricity appliances. Energy-saving promotion can significantly reduce the amount of energy waste (41.89% of lighting and 97.79% of standby energy consumption), and the best frequency of promotional events is once every four months. Residents prefer incentive policies, in which energy-saving effect is 57.7% larger than that of increasing electricity prices. This study realized the re-presentation of the changes of energy consumption in a large number of households and highlighted the particularity of household energy-saving potential in severely cold regions. The proposed model has a simple structure and high output accuracy; it can help cities in severely cold regions formulate energy-saving management policies and evaluate their effects.
1. Introduction
The energy use behavior of occupants is an important factor affecting the overall energy consumption of buildings [1,2,3,4,5]. Previous studies have indicated that occupants account for 80% of the building energy consumption [6], and improper usage habits can cause >30% of the total energy waste [7]. Therefore, there is considerable potential to conserve energy by changing the energy use behavior. However, because of its subjectivity and randomness, energy use behavior has always been regarded as a source of uncertainty in simulations and predictions of building energy consumption [8] and has been the main reason for differences between the simulation results and the actual situation [9,10,11,12]. In the simulation process, a simplified and fixed energy behavior schedule can lead to simulation results >2 times smaller than the actual energy consumption [6,7,12]. A better understanding of occupants’ energy use behaviors and their interactions with buildings will help to improve the accuracy of the model [12,13].
In the past 10 years, complex modeling methods for occupants’ energy use behavior have emerged, among which agent-based modeling (ABM) is one of the most popular. ABM is a decentralized simulation technique [14] that can effectively deal with the complexity and random changes in the energy use behavior and then construct an accurate dynamic model [15]. Agents in ABM can behave as humans; they can interact with other agents or environments according to certain rules of behavior, operate under autonomous control, and adapt to changes. The macroscopic behavior pattern of all the individual agents is the global behavior pattern [16]. Compared with other models, the advantage of the ABM is its bottom–up structure, which can flexibly obtain information; self-learn; restore and simulate complex, nonlinear, and discrete interactions; and provide global visualization results [8,17]. Researchers can change an agent’s interaction with its surroundings by controlling its behavior, allowing agents to learn and change their behaviors in response [18]. However, ABM has limitations. The key to ABM is whether the detailed information of interactions between the agents and the environment can be accurately obtained [19].
ABM of occupants’ energy use behavior involves three essential processes: define behaviors, identify behavior triggers, and quantify behaviors [20]. Defining behaviors is the basis of the modeling. It involves not only classifying the energy use behavior but also classifying people according to the behavior. Linkola et al. constructed water behavior models for different types of households and concluded that retired households used more water [21]. According to the energy use characteristics, Azar et al. [22,23] and Ding et al. [7] divided residents into three categories—a “high energy-consuming group”, “medium and high energy-consuming group”, and “low energy consumption group”—and examined the effects of social propaganda and peer influence on the energy use behaviors of the three groups. In some studies, in addition to the occupants, the energy-management system was treated as a behavior agent. Gomes et al. built a complete microgrid management system using ABM, realizing the monitoring, management, and control of the energy consumption [24]. Identifying behavior triggers and quantifying behavior are the keys to modeling. The research of Chen [25] indicated that the “moving mechanism” and “event mechanism” are the two main control methods in current behavior research. The moving mechanism requires long-term complex and accurate movement tracking, and the trigger condition of each behavior is defined by time-varying parameters. The main function of the event mechanism is to determine the type and arrangement of basic events and then trigger the energy-consuming behavior randomly by changing the probability and occurrence frequency. Mittal et al. used an agent-based model to simulate the triggers of renewable energy use behaviors at the household level under different selection conditions [26]. Khansari et al. designed energy use behavior models for families and individuals and predicted the potential of New York City to achieve the goal of reducing carbon emissions by 80% by 2050 [27]. Pagani et al. constructed a large-scale agent-based energy-consumption model of a residential building and accurately captured the time-resolved dynamics of the heat demand by considering the behaviors of the building occupants [28]. Additionally, owing to the extensive use of ABM technique, the model accuracy is increasing. Scholars proposed the use of sensors with models to improve the simulation accuracy [29]. Jia et al. developed a sophisticated agent-based energy use behavior model for office buildings and compared its output results with measurements to evaluate its accuracy and limitations [30]. Dziedzic et al. developed an energy use behavior simulation model in which accuracy can be improved by testing the changes and feedback of the energy use behavior in different scenarios [31].
Based on the review of existing research, we found that there are two gaps in the research regarding to energy use behavior: (1) Household energy use in severely cold regions is affected by special climatic conditions and has its particularity, but there are very few discussions on energy use behavior in severely cold regions; and (2) the discussion on household energy use behavior focuses on the simulation of a single family, while there are few research on energy use behavior of a large number of individual households on the urban scale. First, the discussion on the occupants’ energy use behavior mainly focuses on the air-conditioning use [25]. There has been inadequate research on severe cold cities that have a low demand for cooling in the summer and depend on central heating systems in the winter. We conducted a literature search on the Web of Science database with search query of two key concepts: energy use behavior; and severe cold region. Table 1 shows the final search terms of each concept adjusted after multiple searches. The final search query is: TS = (energy use behavior* in building* OR occupant behavior* OR energy usage behavior*) AND TS = (cold climate OR severe cold OR severely cold region OR winter city) AND PY = (2010–2020). Search results showed that only 12 articles were highly relevant to the topic: energy use behavior in severe cold regions, in the last 10 years. However, the characteristics of occupants’ energy use behavior and energy-saving potential in the severely cold regions should not be ignored. The special climatic conditions make most of the research results based on air conditioning inapplicable to severely cold regions. It is necessary to obtain a better understanding of the building energy use behavior and the evaluation of energy-saving measures for improving the energy use behavior in severely cold regions. Second, compared with commercial buildings, residential buildings have more flexible and complex activities and time schedules, leading to higher randomness in the energy use behaviors [25]. Studying the energy needs of a large number of individual households is a complex task that requires data collection, as well as comprehensive consideration of the decision-making mechanism underlying the occupant behavior. Differences in the resident characteristics, energy-saving awareness level, outdoor temperature, and work schedule can lead to changes in the energy use behavior, affecting the building energy consumption. Therefore, it is difficult to design rules for the energy use behavior in residential buildings.

Table 1.
Concepts and search terms for the search query.
This study aimed to address the current research gaps and challenges by developing an agent-based model to simulate the household electricity use behavior in severely cold region. The objectives supposed to achieve in this study are: (1) to build an agent-based model which is suitable for a large number of individual households, (2) to identify the characteristics and energy-saving potential of household electricity use behavior in severely cold regions, and (3) to quantify the impact of energy-saving management on household electricity consumption. Harbin, China was taken as the research area for data collection. The energy use behavior was described by statistical data, the behavioral probability, and the decision-making mechanism. The effects of different energy-saving management scenarios were evaluated to investigate the energy-saving potential of behavior in households under severe cold climate conditions. As central heating systems are adopted in severely cold regions of China, the main portion of the heating energy consumption is controlled by not residents but heating companies, mainly using hot water and adjusted according to external temperature. In other words, in one household, the heating energy consumption cannot be adjusted by residents themselves, indicating that residents’ energy use behavior will not show significant effect on heating energy demand. The energy-saving for heating of residential buildings in severely cold regions mainly depends on the building envelope structure and the heat loss in the heating path, rather than the behavior of household energy use. Therefore, in severely cold regions, the most important portion of energy in household which can be reduced by changing energy use behavior is residents’ daily electricity consumption. The proposed model in this study, which takes the weather conditions, basic personal information and behavioral characteristics of the occupants, and energy-saving management as inputs, can provide a dynamic representation of the household electricity consumption per hour in severely cold regions. Additionally, the characteristics of the annual electricity consumption can be identified through a statistical analysis of the electricity consumption per day. The sufficient data and simple structure are conducive to the application of this model for predicting the electricity demand of numerous individual households.
2. Materials and Methods
2.1. Energy Use Behavior Data Collection
The questionnaire (Appendix A) was distributed randomly and submitted anonymously. The respondents did not communicate with each other, eliminating the interference of expectation deviation. A total of 368 questionnaires were returned in the survey, but the sample sizes for the groups under 18 and over 60 (years of age) were too small for the results to be statistically significant. Therefore, there were 362 valid questionnaires, and the effective rate was 98.4% (Table 2). The Cronbach alpha coefficient was used for a reliability test. The value of the reliability coefficient was 0.791, which was >0.7, indicating that the data were reliable.
Table 2.
Resident survey responses.
According to the questionnaire results (Table 3), >97% of the interviewees agreed that energy conservation is a major factor related to the national economy and people’s livelihood (Q1). This indicates that the residents in severely cold regions in China understand the importance of energy conservation. However, only approximately 60% of the respondents were familiar with the energy-saving policies and electricity prices in their area (Q2, Q3), >36% of the respondents did not know how to save energy (Q6), and >82% of the respondents considered that the community energy-saving promotion and education should be strengthened (Q8), indicating that the current energy-saving management is insufficient. Approximately 80% of respondents indicated that they would be affected by energy-conservation promotion (Q5). Further, 57% of respondents indicated that changes in electricity prices would affect their behavior in using household appliances (Q4), and >88% of respondents indicated that rewards could promote energy conservation (Q7), which suggested that economic incentives are more likely to encourage households to take active energy-conservation measures than increasing fees. Although, there are several studies that have observed that rising energy prices will prompt residents to reduce energy consumption, and the greater the increase in the peak electricity price, the more obvious the reduction and transfer of electricity load, regarding tiered electricity price [32,33,34,35]. However, from the result obtained in this study, it can be seen that the varying tariffs on residential electricity proposed so far in Harbin do not strongly motivate residents to modify their electricity use habits, as they are unable to effectively trigger behavioral changes and offer flexibility services [36]. The current electricity price of Harbin is 0.51 yuan/kW·h for the monthly electricity consumption less than 170 kW·h, 0.56 yuan/kW·h for 70–260 kW·h and 0.81 yuan/kW·h for more than 260 kW·h. For most households, the monthly electricity consumption is less than 170 kWh, and the price fluctuation is quite small, which will not attract their attention. Compared with electricity price, research shows that consumers are more willing to pay for energy efficiency appliances in China’s market to save daily energy consumption [37,38]. Regarding to incentive policies, studies have shown that the behavioral results of economic savings have a small impact on energy-saving intentions, but the spiritual satisfaction brought by incentive policies will significantly affect energy-saving intentions [39]. Generally, economic incentives provided through policy means can effectively expand energy-saving benefits [34].
Table 3.
Awareness and willingness of energy saving.
More than 86% of the respondents turn off the lights in time when leaving the room; only approximately 8% of the respondents do not (Table 4). More than 90% of the respondents turn off home appliances when they are not in use, and only 9.94% of the respondents set them to standby (Table 5).
Table 4.
Household light use behavior.
Table 5.
State of household appliances not in use.
Cities in severely cold regions are usually cool in summer and do not have strict cooling requirements. Therefore, the energy-consumption characteristics of cooling and heating in residential buildings are different from those for cities in other regions. The survey results (Figure 1a) indicated that the usage rate of air conditioning in residential buildings in summer is only 17.96%, and that of electric fans is 14.64%, while the remaining 67.40% of the residents selected natural ventilation. Cities in severely cold regions in China mainly use central heating systems in winter, and the heating intensity is uniformly deployed by the heating company according to the weather conditions. Thus, residents usually cannot adjust the heating themselves. The survey results indicated (Figure 1b) that only 16% of the residents use air-conditioning or electric heaters for supplementary heating in winter.
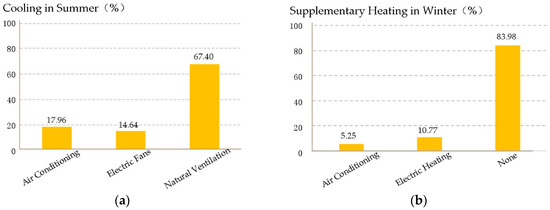
Figure 1.
(a) Cooling methods used in summer; (b) supplementary heating methods used in winter.
2.2. Awareness of Energy Saving and Impact Level of Energy-Saving Management
The use behaviors for lighting and household appliance were used as measures of the energy-saving awareness. The feedback regarding various energy-saving events was used as a measure of the impact of energy-saving management. The answers to related questions were divided into three levels (Table 6). When the options of the three questions related to energy-saving awareness were all in level I, the resident was considered to have high awareness. When at least two of the three questions were in level III, the resident was considered to have low awareness. In other cases, the resident was considered to have medium awareness. The survey results indicated that only 17.96% of the residents had high energy-saving awareness, and >78% of the residents had medium awareness. Compared with the results for Q1, the cognitive attitude towards energy saving did not determine whether the behavior was energy-saving. This is consistent with the research results of Yue et al. [39]. Therefore, social promotion and policy guidance are necessary.
Table 6.
Awareness of energy saving and impact level of energy-saving events.
Cross-comparing the energy-saving awareness with the interviewees’ information revealed that gender did not significantly affect the awareness. Residents 18–25 and 40–60 years old had slightly higher awareness of energy saving than those in the other age groups. Residents whose education level was graduate or above had significantly lower energy-saving awareness than those with other education levels. Residents whose income was <3000 yuan/month paid more attention to daily energy conservation than residents at other income levels. Residents who lived in dormitories or shared rent with others were more energy-efficient than those in other living situations. The energy-saving awareness exhibited a similar stepwise proportional distribution for the education level and income level. Therefore, to match the actual situation, the income level is taken as the classification standard in the setting of residents’ energy-saving awareness parameters.
2.3. Model System
The software employed in this study—AnyLogic—is widely used for modeling and simulating the dynamics of multi-agent and hybrid systems and is suitable for modeling complex systems that evolve over time [8,22,40]. By issuing instructions to independently operating “agents”, modelers investigate the relationship between individual behaviors and macro-patterns emerging from interactions between individuals, that is, unpredictable and complex phenomena created by simple interaction behaviors between individuals in a system.
2.3.1. Defining Agents and Behaviors
The model consists of 16 agents and is divided into two main systems: the apartment system and the energy-management system (Figure 2). The overall energy consumption of the apartment system is affected by the energy-saving management.
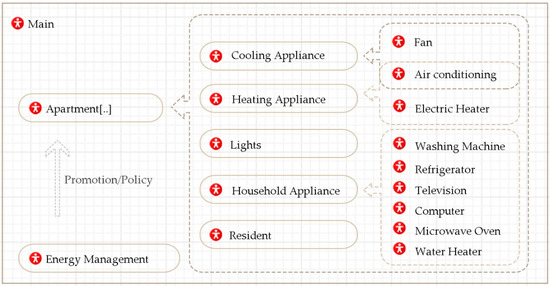
Figure 2.
Agents in the household electricity use behavior model.
The apartment system includes residents and energy-consuming appliances. Residents’ daily routines, energy use habits, and energy-saving awareness affect the building energy consumption. Energy-consuming appliances mainly include cooling and heating appliances, lights, and household appliances. The energy-management system includes social promotion and polices. Residents’ knowledge and awareness of energy conservation in their daily lives are affected by social promotion and relevant energy-conservation policies.
2.3.2. Identifying Behavior Triggers
The behavior control of the agent is mainly divided into the control of the residents’ energy use behavior and the control of the operating state of the energy-consuming appliances. The simulated time unit is ’day’; thus, the behavior and parameter updates for each agent take 24 h.
The daily status of residents is at home or out, which determines their home time and affects the use of appliances. The characteristics of energy use behavior in the model are reflected by the control parameters and control conditions of the appliances. Another important parameter of the residents is the energy-saving awareness. When residents receive the information conveyed by the occurrence of an energy-saving event, the energy-saving awareness parameters are changed according to the impact level of the energy-saving event on the resident agent, affecting their energy use behavior.
Figure 3 shows the state charts of energy-consuming appliances. In addition to refrigerators, lights and other energy-consuming appliances, which needs to be set in standby or off state when not in use, are inspected every 24 h to ensure that the operating time, operating probability, and status during the simulation date are updated according to the residents’ personal characteristics, temperature, and other conditions. The operating time of lights mainly depends on the home time of the residents and the season (Figure 3d). The operating status of cooling, heating (Figure 3a,b), and household appliances (Figure 3c) depends on the possession probability, operation time, and residents’ energy-saving awareness. The energy-saving awareness determines whether an appliance is in a standby or off state when not in use. For cooling and heating appliances, another important behavioral trigger which determines when cooling and heating appliances will be turned on is the external temperature. In the existing studies, cooling and heating temperature for household usually refers to indoor temperature. However, in this study, we used the outdoor temperature for three reasons. First, from the survey, we found that residents usually used the outdoor temperature on a certain day to describe their heating and cooling demand. Second, because of the lack of indoor temperature monitoring, it is difficult to obtain the corresponding changes in their energy use behavior with indoor temperature. Third, considering this model aims to simulate the energy-saving effect of energy management on a large number of individual households on the urban scale, it is easier for model users to operate and obtain data by using outdoor temperature to set the temperature point. We set a cooling setpoint temperature at 26 °C and a heating setpoint temperature at 12 °C. In other words, when the external temperature is higher than 26 °C, the residents will choose to use the cooling appliance, while when the external temperature is lower than 12 °C, they will choose to use the heating appliance. For refrigerators, its normal operating state is 24 h a day. Normal household use will not specifically set it to standby or turned off. Therefore, the operating state chart of the refrigerator is relatively simple. As shown in Figure 3e, there is only one state of “Turn On”.
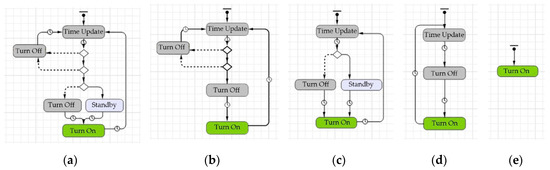
Figure 3.
State charts of energy-consuming appliances: (a) air conditioning (for cooling and heating) and electric fan; (b) electric heater; (c) household appliances (except refrigerator); (d) lights; (e) refrigerator.
2.3.3. Quantifying Behavior
The state parameters set in the model were obtained from the survey questionnaire, the 2019 Heilongjiang Statistical Yearbook (Heilongjiang is the province where Harbin is located), the National Meteorological Science Data Center, and the JGJ 26-2018 Residential Building Energy Efficiency Design Standard in Severe Cold and Cold Areas.
The main panel parameter settings included the quantity of simulated apartment, simulated daily temperature which referred to the average outdoor temperature of the simulated day, simulated date (DayOfYear), and energy-saving management (Figure 4). The parameters of the residents included their basic information, home time, energy-saving awareness, and impact level of management. The basic information included the age, gender, education level, income, and living situation. All the parameter values were set according to the results of the foregoing questionnaire. The energy-consuming appliance parameters included the operating rate, quantity of a certain appliance, operating time (TO), and standby time (TS).
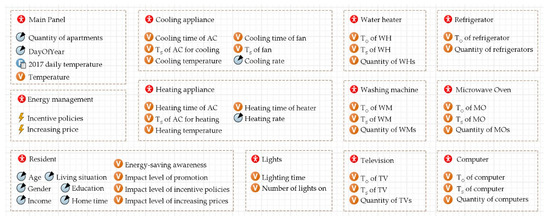
Figure 4.
Parameters of each agent.
Table 7 presents the parameter settings of the main panel and resident agents. The model used “households” as the simulation unit, and the initial quantity of simulated apartments was set as 100. The variable “Temperature” obtained the day’s temperature from the table function “2017 daily temperature” based on the value of “DayOfYear”. The ’energy-saving awareness’ of the residents was classified as high, medium, or low. The ‘impact level’ indicated how likely the residents were to increase their own energy-saving awareness after participating in energy-saving events. The initial values of the awareness and impact level were set according to the percentages obtained from the questionnaire survey.
Table 7.
Parameter settings of the main panel and resident agents.
Table 8 presents the main parameter settings for the cooling and heating appliances. The cooling point and heating point are set to an outdoor temperature of 26 °C and 12 °C, respectively. According to the survey questionnaire, the operating probabilities were as follows: air-conditioning (AC) for cooling, 17%; electric fan, 15%; air-conditioning for heating, 5%; electric heater, 11%. Air conditioning for cooling and electric fan were controlled by the same ‘cooling rate’ parameter, preventing the simultaneous operation of both. This was also true for the heating appliances.
Table 8.
Parameter settings for the cooling and heating appliances.
The use of the lights is controlled by two parameters: “lighting time” and “number of lights on” (Table 9). The “lighting time” is affected by the residents’ “home time” and seasons. In winter, the sunshine time is short, and the lighting time is increased compared with other seasons. According to the sunset time of each day in Harbin in 2017, February 15 and October 9 were taken as the “turning points” for the change in the lighting time. The “number of lights on” indicated whether residents would turn off the lights when they left the room. In this study, we hypothesized that residents with high, medium, and low energy-saving awareness would keep one, two, and four lights, respectively, turned on simultaneously. The parameters of the other five categories of household appliances (except for refrigerators) included the TO, TS, and quantity of appliances. The daily operating time for refrigerators is 24 h. The quantities of certain appliances per household were obtained from the 2017 Heilongjiang Statistical Yearbook.
Table 9.
Parameter settings for the lights and household appliances.
According to the statistical yearbook, the average number of residents per household in 2017 was 2.5, and the average apartment size was 81.5 m2. The interior design temperature, the lighting power, and the operating power (P) and standby power (PS) of household appliances were set according to the “JGJ 26-2018 Design Standard for Energy Conservation of Residential Buildings in Cold and Cold Regions” and average level of each kind of appliances in China (Table 10).
Table 10.
Parameter settings for apartment and household appliances.
2.4. Model Validation
2.4.1. Single-Agent State Tracking
We randomly observed whether the statuses of energy-consuming appliances and the resident of one “apartment agent” changed over time according to the suggested behavior rules, as well as whether the variables and parameters were correctly calculated and updated. Figure 5 shows the daily electricity consumption in January and July 2017 for “Agent11” with low energy-saving awareness, “Agent60” with medium awareness, and “Agent96” with high awareness. The electricity use exhibits periodic changes: two levels are observed on weekdays and weekends, which is consistent with the model’s setting of behavior rules for residents’ energy use, indicating that the transformation of the state of energy use by a single agent was correct during the running of the model.
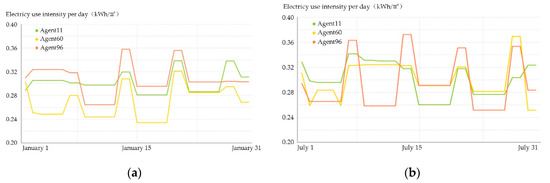
Figure 5.
Electricity use intensity validation for a single agent: (a) January; (b) July.
2.4.2. Stability and Accuracy Validation
Increasing the number of agents increases the complexity of the model, and it can also test all possible random results. To evaluate the overall stability of the model, 100 apartment agents were used for a simulation, which was performed 10 times to obtain 1000 sample data. The results indicated that the standard deviation of the average annual electricity use intensity was 0.4023 kW·h/m2; the coefficient of variation was 0.542%, indicating that the model was relatively stable (Table 11).
Table 11.
Stability validation results for the model.
The simulation results for the monthly electricity use intensity of 1000 samples were compared with the actual data in terms of cumulative values [7]. The actual building energy consumption data were obtained from the 2017 Harbin residential building energy consumption database provided by the Chinese government. The trend line of the cumulative value indicated that the overall trends of the two datasets were almost identical, with small differences (Figure 6). The independent sample test results indicated that the Sig value was >0.05, indicating that there was no significant difference between the two datasets; that is, the simulated value was very close to the actual value, and the model was accurate.
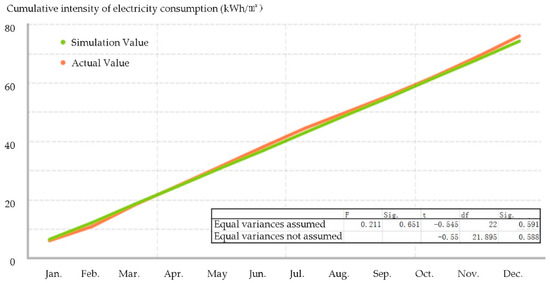
Figure 6.
Accuracy validation results for the model.
3. Scenario Simulation and Results
In this study, three types of energy-saving management were considered: energy-saving promotion, incentive policies, and increasing electricity prices. We hypothesized that for all three types, information can be transmitted to all residents and improve their energy-saving awareness, thereby changing their energy use behavior. And also, the energy-saving management should not affect the residents’ daily needs regarding the use of household appliances.
3.1. Energy-Saving Promotion
Existing studies indicated that “communication” affects the spread of energy-saving ideas [7,41,42,43]. In the present study, 82% of the survey respondents thought that the community should strengthen the energy-saving promotion, and >36% of the respondents indicated that they did not know how to save energy, suggesting that energy-conservation education and promotion are necessary. The probability of residents with different levels of energy-saving awareness being affected by energy-saving promotion was determined according to the results of the survey questionnaire (Table 7). The probability of awareness changing was 100%, 50%, and 0% for residents who responded with “changed”, “maybe”, and “unchanged”, respectively.
The simulation results (Table 12) indicate that proper energy-saving promotion can reduce the annual electricity use intensity of lighting by 42.06% (0.2962 kW·h/m2) and reduce the amount of energy waste generated by standby consumption by 97.51% (0.0705 kW·h/m2). The impact on daily household appliances and cooling and heating appliances is negligible. According to the average size of an apartment, each household can reduce its electricity consumption by 29.886 kW·h per year. Meanwhile, the proportion of energy-saving awareness levels indicates that energy-saving promotion can significantly enhance residents’ energy-saving awareness.
Table 12.
Simulation results for energy-saving promotion.
3.2. Energy-Saving Policies
Two types of policies were considered in this study: incentives and increasing electricity prices. At present, many countries and regions in the world have implemented the policy of “peak and valley electricity price” [44,45,46,47]; that is, the price ladders are set at different time periods to reduce the peak electricity consumption of residents and ease the pressure on power supply. Meanwhile, more and more studies and practices have proven that the use of energy-saving incentives can also greatly encourage active energy-saving behaviors [48,49,50,51,52,53].
The simulation results (Table 13) indicate that the energy-saving effect of the incentive measures is more significant than an increase in the electricity price. The incentive policy can reduce the lighting energy consumption by 42.88% and the standby energy waste by 90.18%, whereas the corresponding reductions due to the increase in the electricity price were 29.05% and 42.60%, respectively. According to the average apartment size, the incentive policy can save 29.92 kW·h per year for each household, whereas the electricity-price increase can save 19.2 kW·h (36.6% less). Compared with policies that increase the cost of energy, such as increasing the electricity price, incentives for energy conservation can better promote residents’ awareness of energy conservation and change their energy use habits. More than 40% of the survey respondents indicated they were unaware of the cost of energy. Public unawareness is one of the reasons for the low impact of raising electricity prices. Therefore, if local economic conditions permit, appropriate standards and incentive measures for energy use can be formulated to reward households for energy conservation and reduce residents’ energy waste in their daily lives.
Table 13.
Simulation results for energy-saving policies.
3.3. Energy-Saving Event Frequency
Taking the energy-saving promotion as an example, the energy-saving effects of an energy-saving event with four occurrence frequencies—once a year (1 January), twice a year (1 January and 1 July), three times a year (1 January, 1 May and 1 September), and four times a year (1 January, 1 April, 1 July and 1 October)—were simulated.
The simulation results (Table 14) indicated that the energy-saving effect decreased with the increasing frequency; that is, the effect of the first energy-saving promotion was the most significant, and the effect decreased thereafter. Figure 7 shows the changing rate of the percentage of “high”, “medium”, and “low” awareness groups after each time of energy-saving promotion, which can explain the decreasing changing trend. Since the total population size was fixed, the first-time promotion led to the largest increase in residents’ awareness. If the energy-saving awareness of one person reaches “high” level, or he/she is unlikely to be changed by promotion, the model considers that the promotion will not work on him/her. In other words, along with the increase of promotion frequency, the remaining number of people who can be promoted decreases, leading to the effect of promotion decline. The frequency of three times a year yielded the optimal effect. After three times promotion, the percentage of “medium” and “low” group reached the minimum, and didn’t change afterwards. Compared with no energy-saving event, the electricity use intensity of lighting and standby was reduced by 52.27% (approximately 0.4059 kW·h/m2). According to the average apartment size, each household can save 33.081 kW·h of energy per year. Therefore, the study suggests that the frequency of social and community energy-saving promotion should be kept between once a year and once every four months to ensure effectiveness while avoiding the waste of resources.
Table 14.
Simulation results for different energy-saving promotion frequency.
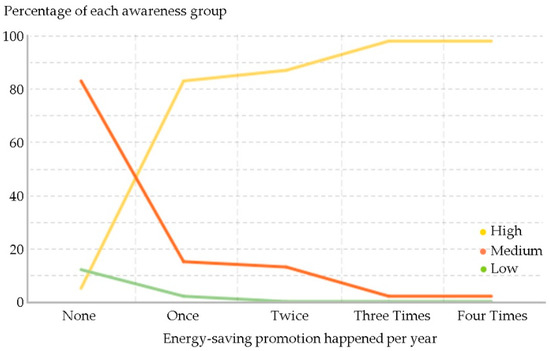
Figure 7.
Changes in awareness groups under different frequency of energy-saving promotion.
4. Conclusions
Energy use behavior is the main cause of fluctuations in building energy consumption. A dynamic description and understanding of changes in energy use behavior can help improve the accuracy of building energy consumption prediction and evaluation. The energy use behavior characteristics of residents in severely cold regions exhibit particularities. In-depth simulation and dynamic display of the residential energy use behavior changes are important for research on the building energy consumption in severely cold regions.
In this study, according to the event mechanism of energy use behavior, an agent-based model of the residential building electricity use behavior in a severely cold region was constructed. The dynamic change characteristics of the household energy use behavior were identified, the energy-saving potential of residential buildings in severely cold regions was evaluated, and the effects of different types of energy-saving management and different frequencies of energy-saving events were analyzed and compared. From the simulation results, the particularity of energy-saving potential in severely cold regions was identified, which highlighted the importance of detailed research in severely cold regions.
The results indicated that most of the residents had a good understanding of energy conservation, but only 16.85% of them had a high awareness of energy conservation. Their cognitive attitude towards energy conservation did not determine whether their behaviors were energy-saving. The unawareness of energy conservation methods in daily life and the lack of promotion and policy guidance are considered to lead to inefficient energy use behaviors. The demand for summer cooling of urban residential buildings in severely cold regions was low, with only 17.96% of the respondents using air conditioners in summer. Nearly 70% residents chose nature ventilation for cooling, which did not consume electricity. In winter, the city used central heating, with only 16% of residents using air conditioning or electric heaters for additional heating. The energy consumption of central heating system for each household did not rely on electricity and was not affected by residents themselves, but heating companies. Therefore, the electricity was mainly consumed by household appliances and lights, and the energy-saving potential was concentrated in the consumption of lighting and standby waste. Promotion of energy conservation could significantly enhance residents’ energy-saving awareness, and the effectiveness decreases after the first promotional event, as the total population who can receive the energy-saving promotion message is fixed for a community or a city. The optimal energy-saving effect could be achieved at the frequency of once every four months. After the third time of the year, the remaining population whose energy-saving awareness could be improved reached the minimum and stayed the same even the frequency increased. The energy-saving effect of the incentive measures was approximately 1.5 times that of increasing the electricity price, and the incentive measures also have a more significant impact on the residents’ energy-saving awareness. According to the survey, only 60% residents were familiar with the electricity price, indicating that at least 40% residents did not care about their cost on electricity. Besides, the varying tariffs on residential electricity proposed so far in Harbin showed quite small change on household cost on electricity. By contrast, the incentive policy which can reward their energy-saving behavior and bring spiritual satisfaction will enhance their interests more significantly.
The agent-based model proposed in this study has a clear hierarchy of multiple agents. Its structure is suitable for general household electricity use behavior and is not limited to severely cold regions. Additional agents can be continuously added into the model as the increase of household electricity-consuming appliances. The newly-added agents can choose different operating state charts (Figure 3) to define their behavior according to their own operating characteristics. The output of the model can be used to identify the energy-saving potential regarding to energy use behavior in the early stage of formulating energy-saving policies and can also be used to predict the effects of energy-saving management. It should be noted that, in practical applications, the parameter values should be updated according to specific conditions, including the characteristic parameters of energy use behavior of residents, possession rate of certain appliance, operation and standby power of certain appliance, and energy-saving policy types.
The study has the following two limitations, which will be addressed in future studies. (1) The method of combining the intelligent agent model with sensors will be adopted to monitor the actual heating demand of residents in winter, including the response to overheating and the actual indoor temperature. (2) For energy-saving promotion, we should investigate the degree of mutual influence among family members with different awareness levels, which has been proven to show great impact on household energy conservation [54].
Author Contributions
Conceptualization, S.-Y.S.; Data curation, S.-Y.S.; Formal analysis, S.-Y.S.; Funding acquisition, H.L.; Investigation, S.-Y.S.; Methodology, S.-Y.S.; Project administration, H.L.; Resources, S.-Y.S.; Software, S.-Y.S.; Supervision, H.L.; Validation, S.-Y.S.; Visualization, S.-Y.S.; Writing—original draft, S.-Y.S.; Writing—review & editing, S.-Y.S. and H.L. All authors have read and agreed to the published version of the manuscript.
Funding
This research was funded by National Natural Science Foundation of China, grant number 51678178.
Conflicts of Interest
The authors declare no conflict of interest. The funder had no role in the design of the study; in the collection, analyses, nor interpretation of data; in the writing of the manuscript, nor in the decision to publish the results.
Appendix A
Questionnaire
- Gender: □ Male □ Female
- Age: □ 0–18 □ 19–25 □ 26–30 □ 31–40 □ 41–60
- Education: □ Under college □ College □ Undergraduate □ Graduate
- Income: □ ≤3000 yuan/month □ 3000–5000 yuan/month □ 5000–8000 yuan/month □ ≥8000 yuan/month
- Living Situation: □ Alone □ With family □ Dormitory/Renting □ Others
- How much time do you spend at home per day?
Weekdays □ ≤8 h □ 9–14 h □ ≥14 h Weekend □ ≤8 h □ 9–14 h □ ≥14 h - What status of household appliances will you set when they are not in use (except refrigerator)?□ Standby □ Sometimes turned off □ Turned off
- What is your usage habit of lights?
Always Usually Sometimes Seldom Never Turn on the light during daytime. □ □ □ □ □ Turn off the light when leaving the room. □ □ □ □ □ - What is the main cooling method used in your home in summer?□ Air-conditioning □ Electric fans (to Q11) □ Natural ventilation (to Q12)
- Which is the temperature of the air-conditioning for cooling in summer?□ 15–17 °C □ 18–20 °C □ 21–23 °C □ 24–26 °C □ ≥26 °C
- How much time do you use the air-conditioning/electric fans in summer per day?
Weekdays □ ≤1 h □ 1–2 h □ 2–4 h □ ≥4 h Weekend □ ≤1 h □ 1–2 h □ 2–4 h □ ≥4 h - In addition to central heating, does your home use other heating methods in winter?□ Air-conditioning □ Electric heaters (to Q14) □ None (to Q16)
- Which is the temperature of the air-conditioning for heating in winter?□ 18–20 °C □ 21–23 °C □ 24–26 °C □ ≥27 °C
- In addition to central heating, does your home use other heating methods in winter?□ 8–10 °C □ 11–13 °C □ 14–16 °C
- How much time do you use the air-conditioning/electric heaters in winter per day?
Weekdays □ ≤1 h □ 1–2 h □ 2–4 h □ ≥4 h Weekend □ ≤1 h □ 1–2 h □ 2–4 h □ ≥4 h - What do you think of the following statement?
Statement Strongly Agree Agree Neutral Disagree Strongly Disagree 1. Energy conservation is a major issue concerning the national economy and people’s livelihood. □ □ □ □ □ 2. You are familiar with the policies and measures of energy conservation in your city and region. □ □ □ □ □ 3. You are familiar with the household electricity price. □ □ □ □ □ 4. The change of electricity price will affect your using habits of household appliances. □ □ □ □ □ 5. You will be influenced by the promotion about energy saving. □ □ □ □ □ 6. Energy saving is far from your life, and you don’t know how to save energy. □ □ □ □ □ 7. You are willing to save energy if the behavior can be rewarded. □ □ □ □ □ 8. Your community should strengthen the promotion of energy conservation in daily life. □ □ □ □ □
References
- Zhao, J.; Lasternas, B.; Lam, K.P.; Yun, R.; Loftness, V. Occupant behavior and schedule modeling for building energy simulation through office appliance power consumption data mining. Energy Build. 2014, 82, 341–355. [Google Scholar] [CrossRef]
- Thomas, A.; Menassa, C.C.; Kamat, V.R. Distributed simulation framework to analyze the energy effects of adaptive thermal comfort behavior of building occupants. In Proceedings of the 2016 Winter Simulation Conference (WSC), Washington, DC, USA, 11–14 December 2016; pp. 3225–3236. [Google Scholar] [CrossRef]
- Turner, W.; Hong, T. A Technical Framework to Describe Occupant Behavior for Building Energy Simulations; Lawrence Berkeley National Laboratory: Berkeley, CA, USA, 2013; pp. 13–15. [Google Scholar]
- Asadi, I.; Mahyuddin, N.; Shafigh, P. A review on indoor environmental quality (IEQ) and energy consumption in building based on occupant behavior. Facilities 2017, 35, 684–695. [Google Scholar] [CrossRef]
- Barthelmes, V.M.; Becchio, C.; Corgnati, S.P.; Barthelmes, V.M.; Becchio, C.; Corgnati, S.P. Occupant behavior lifestyles in a residential nearly zero energy building: Effect on energy use and thermal comfort Occupant behavior lifestyles in a residential nearly zero energy building: Effect on energy use and thermal comfort. Sci. Technol. Built Environ. 2016, 22, 960–975. [Google Scholar] [CrossRef]
- Zou, P.X.W.; Xu, X.; Sanjayan, J.; Wang, J. A mixed methods design for building occupants’ energy behavior research. Energy Build. 2018, 166, 239–249. [Google Scholar] [CrossRef]
- Ding, Z.; Hu, T.; Li, M.; Xu, X.; Zou, P.X.W. Agent-based model for simulating building energy management in student residences. Energy Build. 2019, 198, 11–27. [Google Scholar] [CrossRef]
- Berger, C.; Mahdavi, A. Review of current trends in agent-based modeling of building occupants for energy and indoor-environmental performance analysis. Build. Environ. 2020, 173, 106726. [Google Scholar] [CrossRef]
- Stoppel, C.M.; Leite, F. Integrating probabilistic methods for describing occupant presence with building energy simulation models. Energy Build. 2014, 68, 99–107. [Google Scholar] [CrossRef]
- Fabi, V.; Andersen, R.V.; Corgnati, S.; Olesen, B.W. Occupants’ window opening behaviour: A literature review of factors influencing occupant behaviour and models. Build. Environ. 2012, 58, 188–198. [Google Scholar] [CrossRef]
- Buso, T.; Fabi, V.; Andersen, R.K.; Corgnati, S.P. Occupant behaviour and robustness of building design. Build. Environ. 2015, 94, 694–703. [Google Scholar] [CrossRef]
- Hong, T.; Taylor-Lange, S.C.; D’Oca, S.; Yan, D.; Corgnati, S.P. Advances in research and applications of energy-related occupant behavior in buildings. Energy Build. 2016, 116, 694–702. [Google Scholar] [CrossRef]
- D’Oca, S.; Hong, T. A data-mining approach to discover patterns of window opening and closing behavior in offices. Build. Environ. 2014, 82, 726–739. [Google Scholar] [CrossRef]
- Bonabeau, E. Agent-based modeling: Methods and techniques for simulating human systems. Proc. Natl. Acad. Sci. USA 2002, 99, 7280–7287. [Google Scholar] [CrossRef]
- Bäumelt, T.; Dostál, J. Distributed agent-based building grey-box model identification. Control Eng. Pract. 2020, 101, 104427. [Google Scholar] [CrossRef]
- Cuevas, E. An agent-based model to evaluate the COVID-19 transmission risks in facilities. Comput. Biol. Med. 2020, 121, 103827. [Google Scholar] [CrossRef] [PubMed]
- Papadopoulos, S.; Azar, E. Integrating building performance simulation in agent-based modeling using regression surrogate models: A novel human-in-the-loop energy modeling approach. Energy Build. 2016, 128, 214–223. [Google Scholar] [CrossRef]
- Chen, J.; Taylor, J.E.; Wei, H.H. Modeling building occupant network energy consumption decision-making: The interplay between network structure and conservation. Energy Build. 2012, 47, 515–524. [Google Scholar] [CrossRef]
- Gaetani, I.; Hoes, P.J.; Hensen, J.L.M. Occupant behavior in building energy simulation: Towards a fit-for-purpose modeling strategy. Energy Build. 2016, 121, 188–204. [Google Scholar] [CrossRef]
- Lee, Y.S.; Malkawi, A.M. Simulating multiple occupant behaviors in buildings: An agent-based modeling approach. Energy Build. 2014, 69, 407–416. [Google Scholar] [CrossRef]
- Linkola, L.; Andrews, C.J.; Schuetze, T. An agent based model of household water use. Water 2013, 5, 1082–1100. [Google Scholar] [CrossRef]
- Azar, E.; Menassa, C.C. A Conceptual Framework to Energy Estimation in Buildings Using Agent Based Modeling. In Proceedings of the 2010 Winter Simulation Conference, Baltimore, MD, USA, 5–8 December 2010; pp. 3145–3156. [Google Scholar] [CrossRef]
- Azar, E.; Menassa, C.C. Agent-Based Modeling of Occupants and Their Impact on Energy Use in Commercial Buildings. J. Comput. Civil Eng. 2012, 26, 506–518. [Google Scholar] [CrossRef]
- Gomes, L.; Vale, Z.; Corchado, J.M. Microgrid management system based on a multi-agent approach: An office building pilot. Meas. J. Int. Meas. Confed. 2020, 154. [Google Scholar] [CrossRef]
- Chen, S.; Wu, J.; Pan, Y.; Ge, J.; Huang, Z. Simulation and case study on residential stochastic energy use behaviors based on human dynamics. Energy Build. 2020, 223. [Google Scholar] [CrossRef]
- Mittal, A.; Krejci, C.C.; Dorneich, M.C.; Fickes, D. An agent-based approach to modeling zero energy communities. Sol. Energy 2019, 191, 193–204. [Google Scholar] [CrossRef]
- Khansari, N.; Hewitt, E. Incorporating an agent-based decision tool to better understand occupant pathways to GHG reductions in NYC buildings. Cities 2020, 97, 102503. [Google Scholar] [CrossRef]
- Pagani, M.; Maire, P.; Korosec, W.; Chokani, N.; Abhari, R.S. District heat network extension to decarbonise building stock: A bottom-up agent-based approach. Appl. Energy 2020, 272. [Google Scholar] [CrossRef]
- Liao, C.; Barooah, P. An integrated approach to occupancy modeling and estimation in commercial buildings. In Proceedings of the 2010 American Control Conference, Baltimore, MD, USA, 30 June–2 July 2010. [Google Scholar] [CrossRef]
- Jia, M.; Srinivasan, R.S.; Ries, R.; Weyer, N.; Bharathy, G. A systematic development and validation approach to a novel agent-based modeling of occupant behaviors in commercial buildings. Energy Build. 2019, 199, 352–367. [Google Scholar] [CrossRef]
- Dziedzic, J.W.; Yan, D.; Sun, H.; Novakovic, V. Building occupant transient agent-based model—Movement module. Appl. Energy 2020, 261, 114417. [Google Scholar] [CrossRef]
- Alberini, A.; Khymych, O. Responsiveness to energy price changes when salience is high: Residential natural gas demand in Ukraine. Energy Policy 2020, 144. [Google Scholar] [CrossRef]
- Heberlein, T.A.; Warriner, G.K. The influence of price and attitude on shifting residential electricity consumption from on- to off-peak periods. Econ. Psychol. 1983, 4, 107–130. [Google Scholar] [CrossRef]
- Hu, S.; Yan, D.; Azar, E.; Guo, F. A systematic review of occupant behavior in building energy policy. Build. Environ. 2020, 175, 106807. [Google Scholar] [CrossRef]
- He, Y.X.; Liu, Y.Y.; Xia, T.; Zhou, B. Estimation of demand response to energy price signals in energy consumption behaviour in Beijing, China. Energy Convers. Manag. 2014, 80, 429–435. [Google Scholar] [CrossRef]
- Steriotis, K.; Tsaousoglou, G.; Efthymiopoulos, N.; Makris, P.; Varvarigos, E. (Manos) A novel behavioral real time pricing scheme for the active energy consumers’ participation in emerging flexibility markets. Sustain. Energy Grids Netw. 2018, 16, 14–27. [Google Scholar] [CrossRef]
- Zhang, Y.; Tao, W. Will energy efficiency affect appliance price? An empirical analysis of refrigerators in China based on hedonic price model. Energy Policy 2020, 147, 111818. [Google Scholar] [CrossRef]
- Zhang, Y.; Xiao, C.; Zhou, G. Willingness to pay a price premium for energy-saving appliances: Role of perceived value and energy efficiency labeling. J. Clean. Prod. 2020, 242, 118555. [Google Scholar] [CrossRef]
- Yue, T.; Long, R.; Chen, H.; Liu, J.; Liu, H.; Gu, Y. Energy-saving behavior of urban residents in China: A multi-agent simulation. J. Clean. Prod. 2020, 252. [Google Scholar] [CrossRef]
- Anylogic. Available online: https://www.anylogic.com/ (accessed on 13 September 2020).
- Meyers, R.J.; Williams, E.D.; Matthews, H.S. Scoping the potential of monitoring and control technologies to reduce energy use in homes. Energy Build. 2010, 42, 563–569. [Google Scholar] [CrossRef]
- Petersen, J.E.; Shunturov, V.; Janda, K.; Platt, G.; Weinberger, K. Dormitory residents reduce electricity consumption when exposed to real-time visual feedback and incentives. Int. J. Sustain. High. Educ. 2007, 8, 16–33. [Google Scholar] [CrossRef]
- Chiang, T.; Mevlevioglu, G.; Natarajan, S.; Padget, J.; Walker, I. Inducing [sub]conscious energy behaviour through visually displayed energy information: A case study in university accommodation. Energy Build. 2014, 70, 507–515. [Google Scholar] [CrossRef]
- Guang, F.; He, Y.; Wen, L. Impacts of hybrid time-varying tariffs on residential electricity demand: The case of Zhejiang Province. Util. Policy 2019, 61, 100969. [Google Scholar] [CrossRef]
- Mbungu, N.T.; Bansal, R.C.; Naidoo, R.; Miranda, V.; Bipath, M. An optimal energy management system for a commercial building with renewable energy generation under real-time electricity prices. Sustain. Cities Soc. 2018, 41, 392–404. [Google Scholar] [CrossRef]
- Pereira, D.S.; Marques, A.C. How should price-responsive electricity tariffs evolve? An analysis of the German net demand case. Util. Policy 2020, 66. [Google Scholar] [CrossRef]
- Sulaima, M.F.; Dahlan, N.Y.; Yasin, Z.M.; Rosli, M.M.; Omar, Z.; Hassan, M.Y. A review of electricity pricing in peninsular Malaysia: Empirical investigation about the appropriateness of Enhanced Time of Use (ETOU)electricity tariff. Renew. Sustain. Energy Rev. 2019, 110, 348–367. [Google Scholar] [CrossRef]
- Ghesla, C.; Grieder, M.; Schmitz, J.; Stadelmann, M. Pro-environmental incentives and loss aversion: A field experiment on electricity saving behavior. Energy Policy 2020, 137, 111131. [Google Scholar] [CrossRef]
- Hellwig, M.; Schober, D.; Cabral, L. Low-powered vs high-powered incentives: Evidence from German electricity networks. Int. J. Ind. Organ. 2020, 102587. [Google Scholar] [CrossRef]
- Menezes, F.M.; Zheng, X. Regulatory incentives for a low-carbon electricity sector in China. J. Clean. Prod. 2018, 195, 919–931. [Google Scholar] [CrossRef]
- Baldini, M.; Trivella, A.; Wente, J.W. The impact of socioeconomic and behavioural factors for purchasing energy e ffi cient household appliances: A case study for Denmark. Energy Policy 2018, 120, 503–513. [Google Scholar] [CrossRef]
- Alberini, A.; Bigano, A. How effective are energy-efficiency incentive programs? Evidence from Italian homeowners. Energy Econ. 2015, 52, S76–S85. [Google Scholar] [CrossRef]
- Zhao, T.; Bell, L.; Horner, M.W.; Sulik, J.; Zhang, J. Consumer responses towards home energy financial incentives: A survey-based study. Energy Policy 2012, 47, 291–297. [Google Scholar] [CrossRef]
- Andor, M.A.; Fels, K.M. Behavioral Economics and Energy Conservation—A Systematic Review of Non-price Interventions and Their Causal Effects. Ecol. Econ. 2018, 148, 178–210. [Google Scholar] [CrossRef]


Publisher’s Note: MDPI stays neutral with regard to jurisdictional claims in published maps and institutional affiliations. |
© 2020 by the authors. Licensee MDPI, Basel, Switzerland. This article is an open access article distributed under the terms and conditions of the Creative Commons Attribution (CC BY) license (http://creativecommons.org/licenses/by/4.0/).