Article

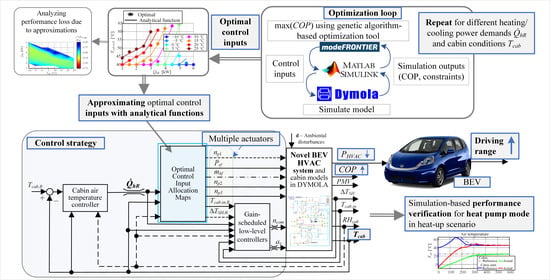
Optimisation of Control Input Allocation Maps for Electric Vehicle Heat Pump-based Cabin Heating Systems

Faculty of Mechanical Engineering and Naval Architecture, University of Zagreb, 10000 Zagreb, Croatia
*
Author to whom correspondence should be addressed.
Energies 2020, 13(19), 5131; https://doi.org/10.3390/en13195131
Submission received: 1 September 2020 / Revised: 24 September 2020 / Accepted: 28 September 2020 / Published: 2 October 2020

Abstract

:
The heating, ventilation and air conditioning (HVAC) system negatively affects the electric vehicle (EV) driving range, especially under cold ambient conditions. Modern HVAC systems based on the vapour-compression cycle can be rearranged to operate in the heat pump mode to improve the overall system efficiency compared to conventional electrical/resistive heaters. Since such an HVAC system is typically equipped with multiple actuators (compressor, pumps, fans, valves), with the majority of them being controlled in open loop, an optimisation-based control input allocation is necessary to achieve the highest efficiency. This paper presents a genetic algorithm optimisation-based HVAC control input allocation method, which utilises a multi-physical HVAC system model implemented in Dymola/Modelica. The considered control inputs include the cabin inlet air temperature reference, blower and radiator fan air mass flows and secondary coolant loop pumps’ speeds. The optimal allocation is subject to specified, target cabin air temperatures and heating power. Additional constraints include actuator hardware limits and safety functions, such as maintaining the superheat temperature at its reference level. The optimisation objective is to maximise the system efficiency defined by the coefficient of performance (COP). The optimised allocation maps are fitted by proper mathematical functions to facilitate the control strategy implementation and calibration. The overall control strategy consists of superimposed cabin air temperature controller that commands heating power, control input allocation functions, and low-level controllers that ensure cabin inlet air and superheat temperature regulation. The control system performance is verified through Dymola simulations for the heat pump mode in a heat-up scenario. Control input allocation map optimisation results are presented for air-conditioning (A/C) mode, as well.

Graphical Abstract

1. Introduction

Electric vehicles are steadily gaining a foothold in market and this trend is bound to continue with stronger consumer acceptance and favorable emissions and carbon tax legislation, e.g., those in European Union [1] and China [2]. However, the increase in mass market-share of battery electric vehicles (BEVs) is hindered by end users’ perspective of BEVs having limited driving range when compared to conventional vehicles. Passenger cabin heating presents an additional challenge, because the abundant waste heat of the internal combustion engine is no longer available, while the e-drive and battery pack waste heat is scarce due to their high efficiency.
Early BEVs, such as the first-generation Nissan Leaf and Tesla Model S use positive thermal coefficient (PTC) heater elements to achieve resistive heating of the cabin air. However, the coefficient of performance of PTC heaters is 1 at maximum [3]. This leads to high energy consumption of the heating, ventilation and air-conditioning (HVAC) system and since the HVAC system is the highest energy consumer of all BEV auxiliary systems, this can greatly impact the BEV driving range [4,5]. Ambient conditions, thermal loads and user preferences influence the overall HVAC system performance and determine its impact on driving range. In [6] it is reported that the average reduction of vehicle range can go up to 60% in cold weather, and up to 33% in hot weather. The authors in [7] analysed the influence of ambient air temperature on driving range reduction of a B-segment BEV under laboratory conditions using the WLTP driving cycle, and they reported that at −10 °C the driving range is reduced by 59% when compared to the nominal range obtained at +23 °C.
To overcome the BEV range reduction in extremely cold environments, new energy-efficient heating concepts have been developed. These systems use multiple energy flows, integrated cabin and battery/powertrain thermal management and more energy-efficient [8], vapour-compression cycle-based heat pump systems, which allow for coefficients of performance higher than 1 and for operation in heating or cooling mode [9]. The configurations can be based on direct exchange solutions, where the refrigerant exchanges energy directly with air, or alternative solutions involving secondary loops in which a refrigerant, typically R134a or CO2, exchanges energy with a coolant (typically water-glycol mix) and then between the coolant and air [8,10,11]. Both solutions employ additional three-way or four-way valves to direct the refrigerant and/or coolant flow to achieve different operating modes. The latter solution has more components that have to be coordinated during heat pump mode, thus making it more complex and more difficult to control.
When applied to hybrid electric vehicles (HEVs), heat pump systems can improve fuel economy and emissions [12], they boost the electric driving range of PHEVs [13], and in BEV applications they significantly increase the driving range. An increase of driving range by 18% at −10 °C by replacing the PTC-based heating system with a heat pump-based system in a Fiat 500e is demonstrated in [14]. Similarly, in [7] it is reported that reducing the BEV HVAC system energy consumption by 40% leads to increase of driving range by more than 25% in extreme cold weather (−10 °C). To date, the commercially available BEVs with heat-pump systems are the Nissan Leaf EV [15], Renault Zoe, BMW i3, VW Golf-e, Jaguar I-Pace, [9], and most recently the Tesla Model Y [16] and Porsche Taycan [17]. It is expected that heat pump-based HVAC systems will gain acceptance due to their superior efficiency. Additionally, novel HVAC systems may utilise new types of refrigerant, e.g., propane (R290) (see [18] for details and a broader discussion of refrigerant selection), and they can be supplemented by infrared panels [19] to achieve better efficiency and thermal comfort at the expense of increased complexity.
The increased number of actuators that are present in modern BEV HVAC system extends the requirements for designing the HVAC energy management system. The actuators are often redundant, and to achieve high efficiency it is necessary to develop new HVAC control systems that coordinate actuators in an optimal manner. A rule-based PID controller is proposed in [20] to coordinate actions of multiple actuators for cabin air temperature regulation, where a set of rules is used for blower fan control and cabin air inlet distribution. However, a disadvantage of such an approach is generally related to the sub-optimal performance of the overall system. Optimal allocation-based control strategy for a conventional vehicle air-conditioning (A/C) system is presented in [21]. The hierarchical control strategy presented therein uses a superimposed cabin air temperature controller, which commands the cooling capacity demand that is allocated to low-level control inputs by means of instantaneous on-line optimisation. Another approach relying on optimisation over the prediction horizon, i.e., model-predictive control, is proposed in [22] to achieve optimal cooling performance of HEV. Since the on-line optimisation is computationally demanding, particularly for the case of increased number of actuators, one can use off-line optimized control law or maps. An off-line artificial neural network model-based optimisation of control trajectories is presented in [23], and carried out for two different heat pump operating modes in cold weather conditions for minimal energy consumption. Alternative off-line optimisation method is the multi-objective genetic algorithm-based optimisation, as employed in [24] to determine optimal A/C system low-level control inputs in the form of look-up tables. If the control strategy structure is already available, multi-objective optimisation may also be employed to find optimal control strategy calibration parameters [25].
In this paper the genetic algorithm-based optimisation method from [24] is extended and applied to obtain optimal control input allocation maps of an advanced BEV HVAC system from [18], with the aim of maximising the HVAC efficiency in the heat pump operating mode. The optimal allocation maps are used within a hierarchical cabin temperature control system. The main contributions of the paper are twofold. The first contribution relates to the optimisation method itself, which determines optimal setpoint maps of multi-actuator HVAC system depending on cabin air conditions and heating demand commanded by the superimposed cabin temperature controller. The added benefit of the proposed optimisation approach is that it does not rely on a cabin thermal dynamics model and related thermal load disturbances, thus making the optimisation computationally more efficient and straightforward. The second contribution concerns analysis of optimisation results with the aim of providing easy-to-calibrate analytical functions that replace the allocation maps. The special emphasis is on careful selection of analytical function inputs for more straightforward implementation and more efficient operation in highly transient conditions. Although the presented control allocation approach is applied for the heat pump operating mode, it can readily be applied to other characteristic modes of the BEV HVAC system, as illustrated in Appendix A for the example of A/C operating mode.
The remainder of the paper is organized as follows: Section 2 describes the multi-physical model of the HVAC system coupled with a passenger cabin subsystem. The overall hierarchical control framework based on optimal control input allocation maps is set up in Section 3. The optimisation problem is formulated, and the corresponding method is defined in Section 4. The optimised allocation maps are presented in Section 5 and used for derivation of analytical allocation function. Section 6 presents and discusses the results of simulation-based verification of the overall optimal control strategy, which is implemented along the plant model within the Dymola/Modelica simulation environment. Concluding remarks are given in Section 7.

2. HVAC System Model

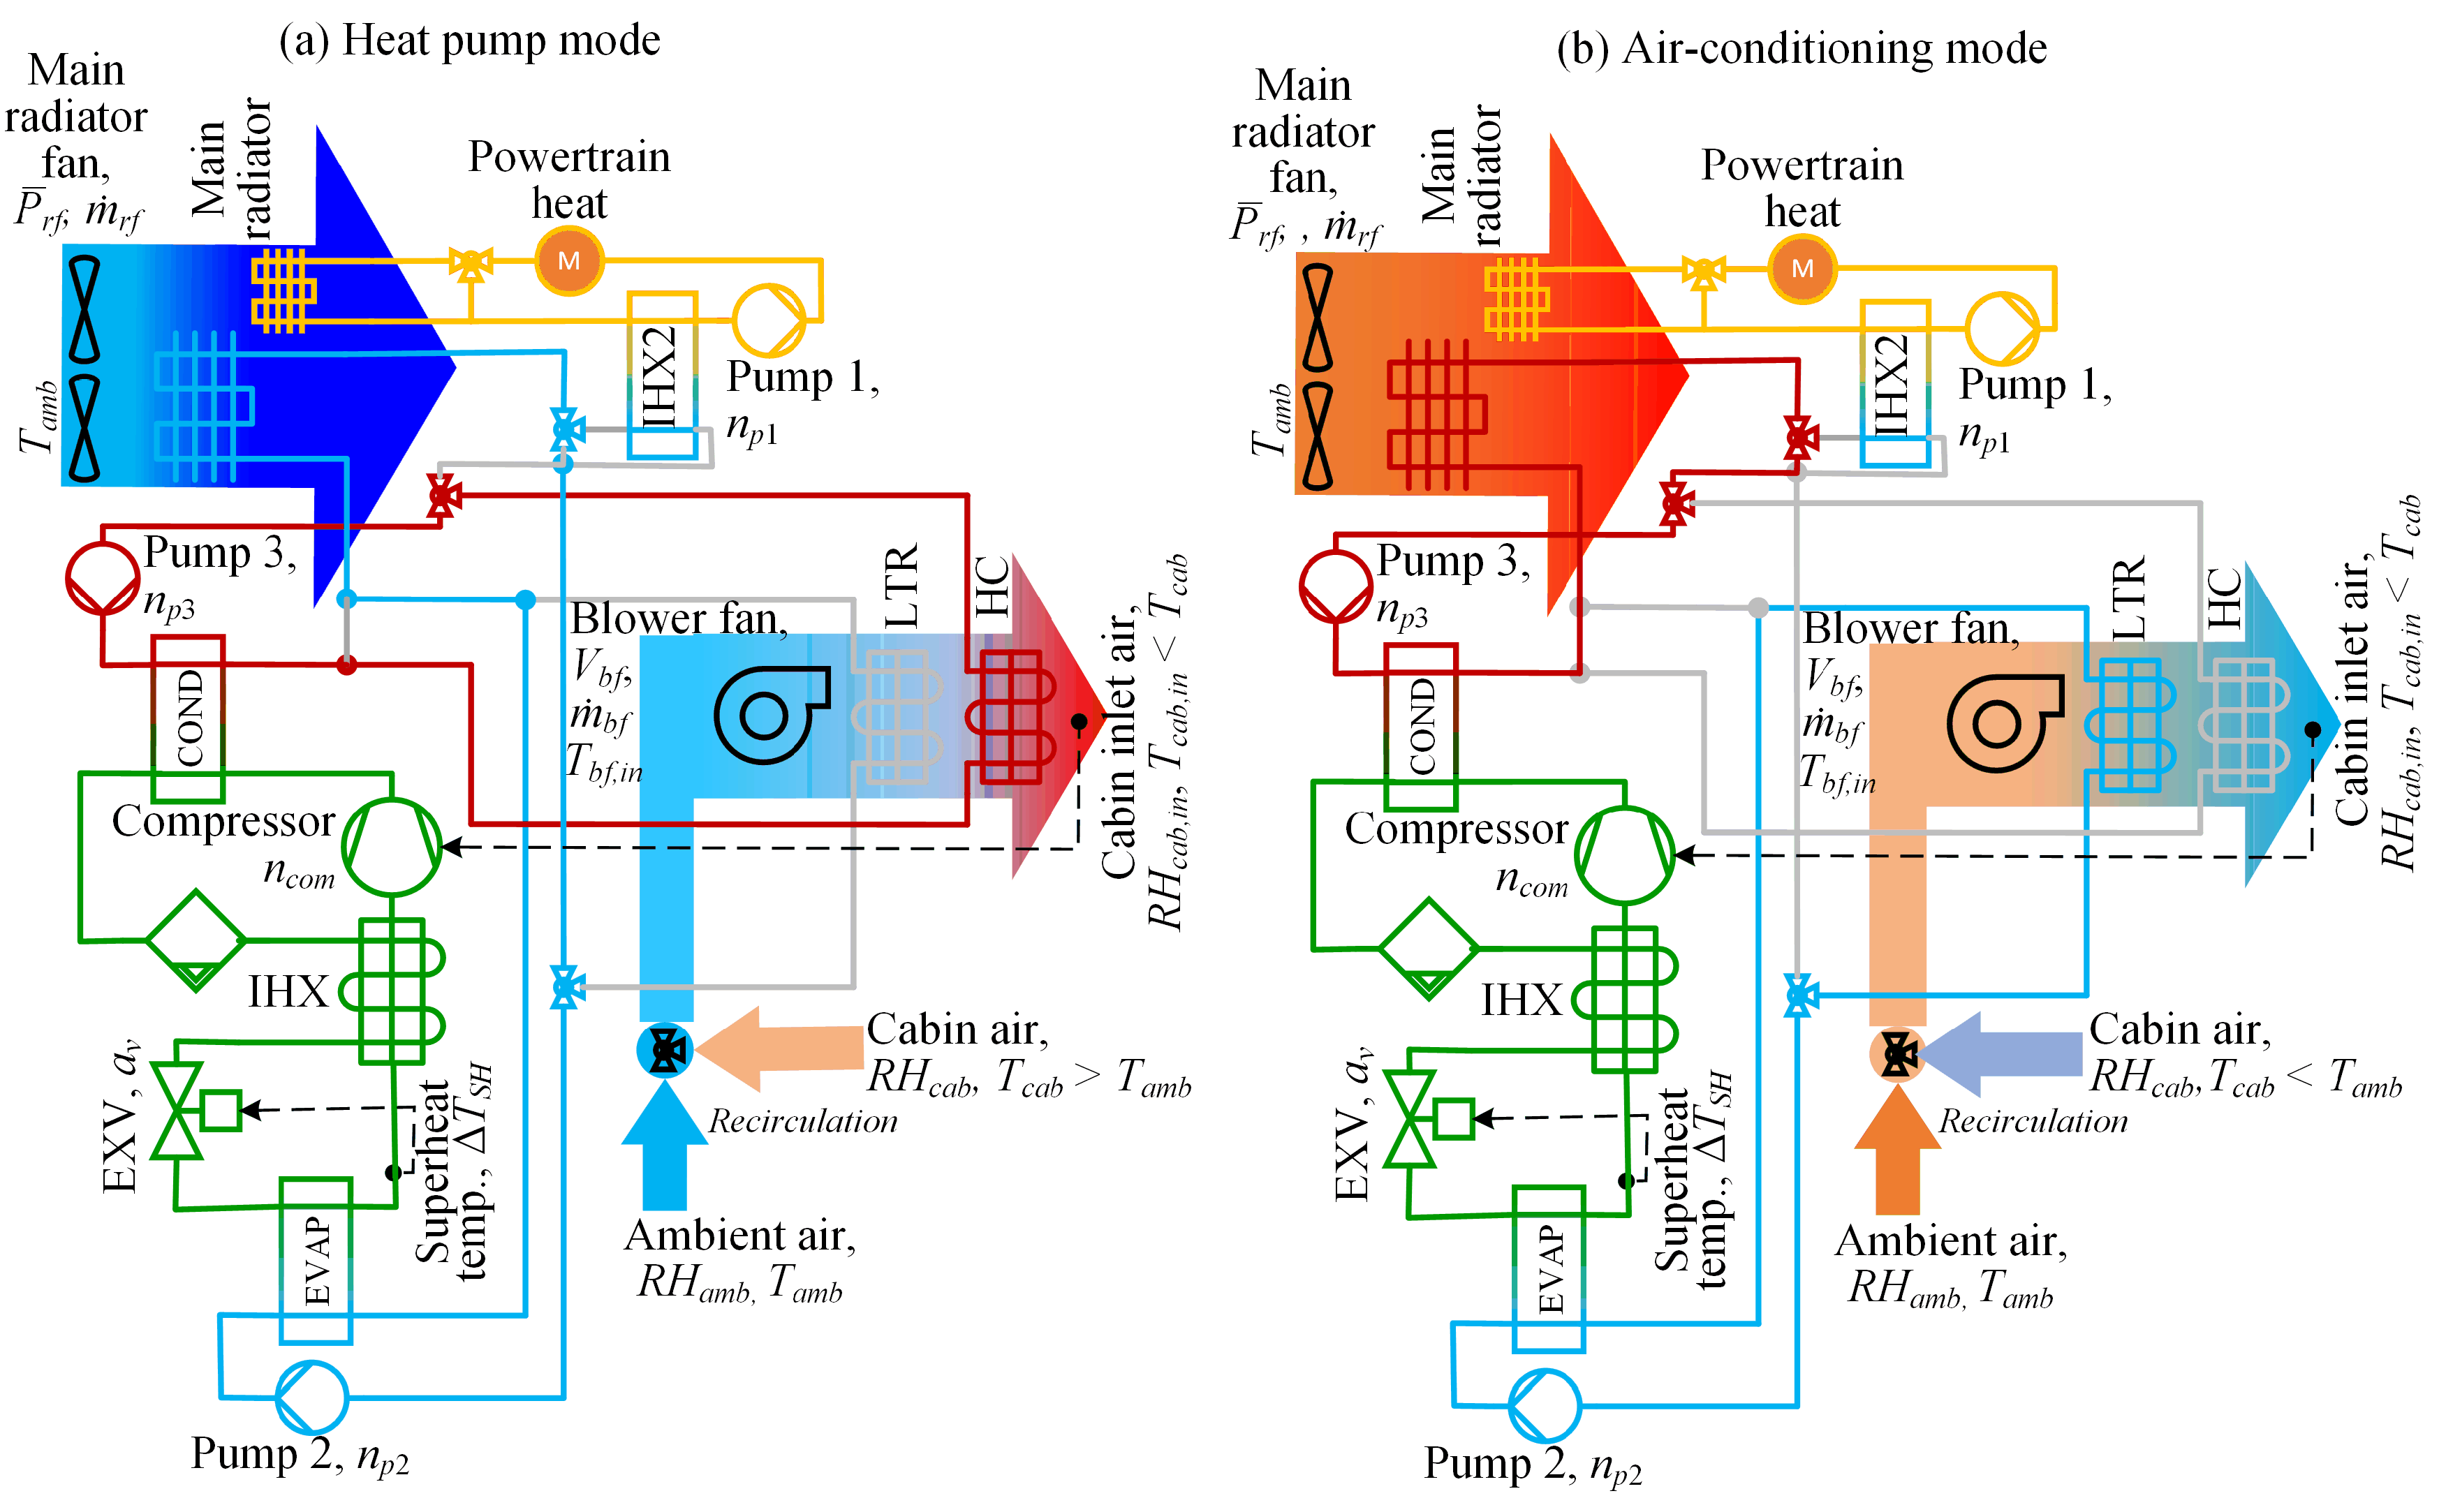
2.1. HVAC System Configuration

The considered R290 refrigerant (propane)-centred HVAC system is based on the concept presented in [18]. The system consists of three specific thermal energy exchange cycles (see the illustration in Figure 1): the vapour-compression cycle (VCC, denoted by green lines), three secondary coolant cycles (red/blue/orange lines) and two air cycles (denoted by coloured arrows).
The VCC consists of the compressor, electronic expansion valve (EXV), separator and three plate-type heat exchangers including condenser (COND), evaporator (EVAP) and internal heat exchanger (IHX). The secondary coolant cycles act as an intermediary medium in heat exchange between the VCC and two air cycles-ambient and cabin-or other heat sources, e.g., the one related to powertrain/battery waste heat. Note that PTC heater (omitted in this study) can also be used in the high temperature secondary loop for aiding the heat pump or completely by-passing the heat pump. Three distinct coolant cycles are present, and each is equipped with corresponding pump. The powertrain/battery loop (orange) is mainly used for cooling the powertrain-related components, when necessary, by dissipating the heat at the smaller, secondary main radiator (hot weather) or redirecting the coolant flow through another internal heat exchanger (IHX2) to use the waste heat for improved heating performance (cold weather). The evaporator and condenser of the VCC are connected to the other two coolant loops. The evaporator-related, low temperature coolant loop (light blue) directs the coolant to main radiator to receive the heat from the ambient air in the heat pump (HP) mode (Figure 1a), while in the air-conditioning mode the coolant flow is directed through low-temperature radiator (LTR; Figure 1b). The condenser-related high temperature loop (red) directs the coolant to either heater core (HC) in the HP mode or main radiator in the A/C mode. The coolant flow is controlled by multiple proportional three-way valves (see valve symbols in the Figure 1), where more complex operating modes, such as partial waste-heat use, air reheating/dehumidification, or radiator defrosting can be achieved by splitting the coolant loop flows. This paper concerns the HP operating mode without waste heat use (note that in the extremely cold environments the powertrain/battery waste heat is relatively low).
The ambient air cycle exchanges heat between the ambient air and the evaporator-related coolant loop in the HP mode via the main (front) radiator. For lower vehicle velocities, air is forced through the radiator by main radiator fan. The air flow in the cabin air cycle is forced by blower fan, and it passes over the LTR and HC before entering the vehicle cabin. The blower fan inlet is connected to mixing chamber to enable cabin air recirculation, i.e., mixing of the fresh/ambient air and cabin air in a specified ratio.

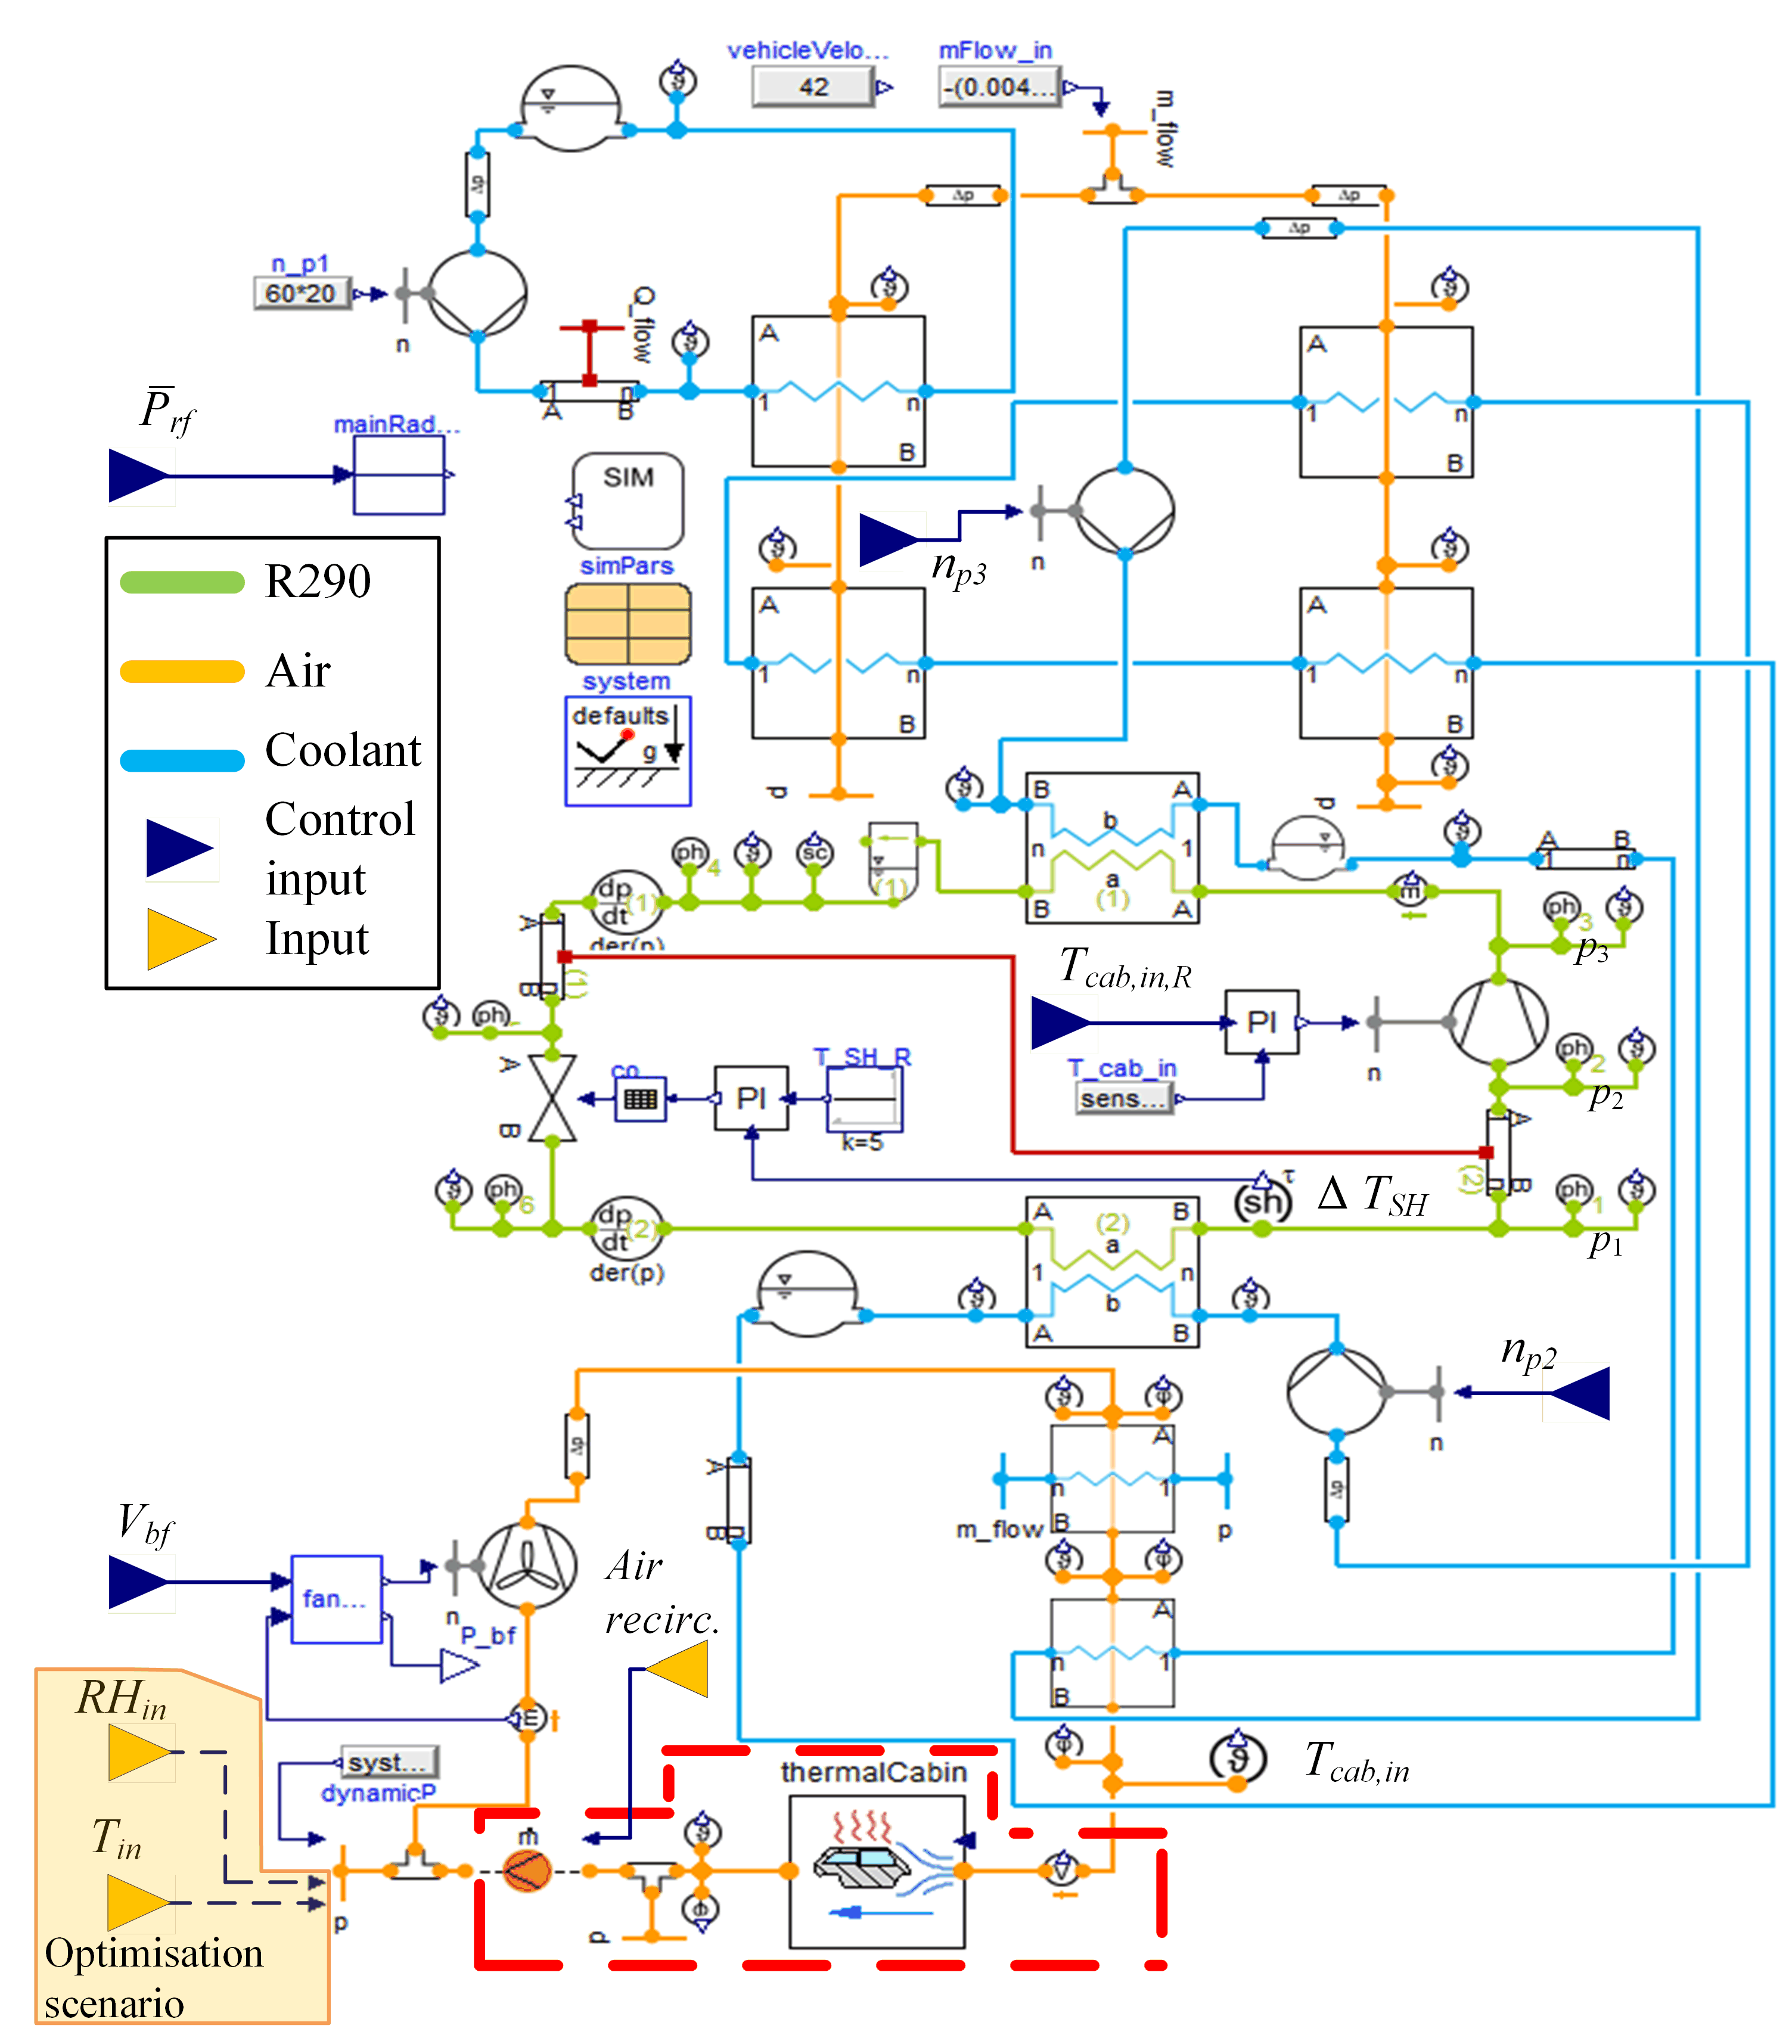
2.2. Heat pump (HP) Mode Simulation Model

The employed multi-physical HVAC system model is implemented in Dymola/Modelica, and it has been parametrised based on the available system design data and component bench test data, and partly validated using test rig data [26]. The model structure for the HP operating mode is shown in Figure 2. The VCC loop, coolant loops, and air cycles are denoted by green, blue and orange lines, respectively. The considered model inputs are compressor speed ncom, EXV stepper motor position av, evaporator-related coolant pump speed np2, condenser-related coolant pump speed np3, blower fan input voltage Vbf, and radiator fan power level rf. Since powertrain cooling is not considered herein, the corresponding pump speed np1 is omitted from the control input vector (it is set to constant value). The relevant HVAC model outputs include superheat temperature ΔTSH, heater core outlet/cabin inlet air temperature Tcab,in, blower fan air mass flow rate bf, total power consumptions P of HVAC actuators and thermal energy exchange between the coolant and the air in the heater core QHC. The specific sub-models outlined below and not covered in [26] include radiator and blower fan models, EXV model and cabin thermal model.
The radiator fan has three discrete input settings rf ϵ {0, 0.5, 1} corresponding to different fan power levels (turned off, at half power and at full power). Beside the power state of the radiator fan rf, the actual radiator fan mass flow rate rf accounts for ramming due to vehicle velocity.
The blower fan is described by two look-up tables based on test bench measurements. The resulting blower fan air mass flow rate is a function of input/control voltage Vbf and intake air temperature, i.e., bf = fbf(Vbf,Tbf,in). The inverse of fbf, i.e., Vbf = fbf-1(bf, Tbf,in), which is need to transform the control input bf to the model input Vbf, has been described by a cubic polynomial function of bf. The polynomial coefficients are described as functions of the intake air temperature Tbf,in based on extensive open-loop model simulations. The blower fan power consumption is described by a look-up table. The EXV valve model contains a nonlinear characteristic describing the EXV opening surface Av with respect to stepper motor position av. The opening surface is then used for determining the refrigerant flow through the valve.
For the purpose of overall control strategy simulation verification (Section 6), the cabin is modelled as a single-zone moist air volume, encompassed by body elements lumped in a single thermal mass [27]. Figure 3 shows the cabin model block diagram. The cabin inlet is connected to the HVAC outlet, and the heat-treated air stream characterised by temperature Tcab,in and relative humidity RHcab,in enters the cabin volume at the rate bf. The cabin air volume exchanges the convective heat conv with body elements. The cabin inlet air is assumed to ideally mix with the cabin air within the cabin volume at constant pressure. Thus, the air mass flow rate entering the cabin is equal to the sum of air mass flows exiting the cabin to the ambient (amb) and recirculating at the blower inlet (rec; depends on the recirculation ratio) Two different recirculation settings can be achieved: (i) FRESH, which is used herein for HP mode and which takes 90% of fresh air with 10% of cabin air recirculation to account for leakages; and (ii) full recirculation, which is used in A/C mode (Appendix A) and which recirculates 100% of cabin air. The lumped body thermal mass is subject to various thermal loads, including (forced) convective heat transfer to ambient air due to vehicle traveling at velocity vveh, metabolic loads from the passengers and solar load.
The cabin model is parametrized by using real measurements of cabin temperatures [27]. The thermal comfort is evaluated by using a look-up table-based cabin air flow distribution subsystem and the predicted mean vote (PMV) index, as described in [27]. The air flow distribution subsystem accounts for different cabin ventilation modes, such as HEAT mode used herein, in which the air is directed to the legs, and DEF mode used in the case of A/C mode (Appendix A), which directs the air mostly to the front windshield.

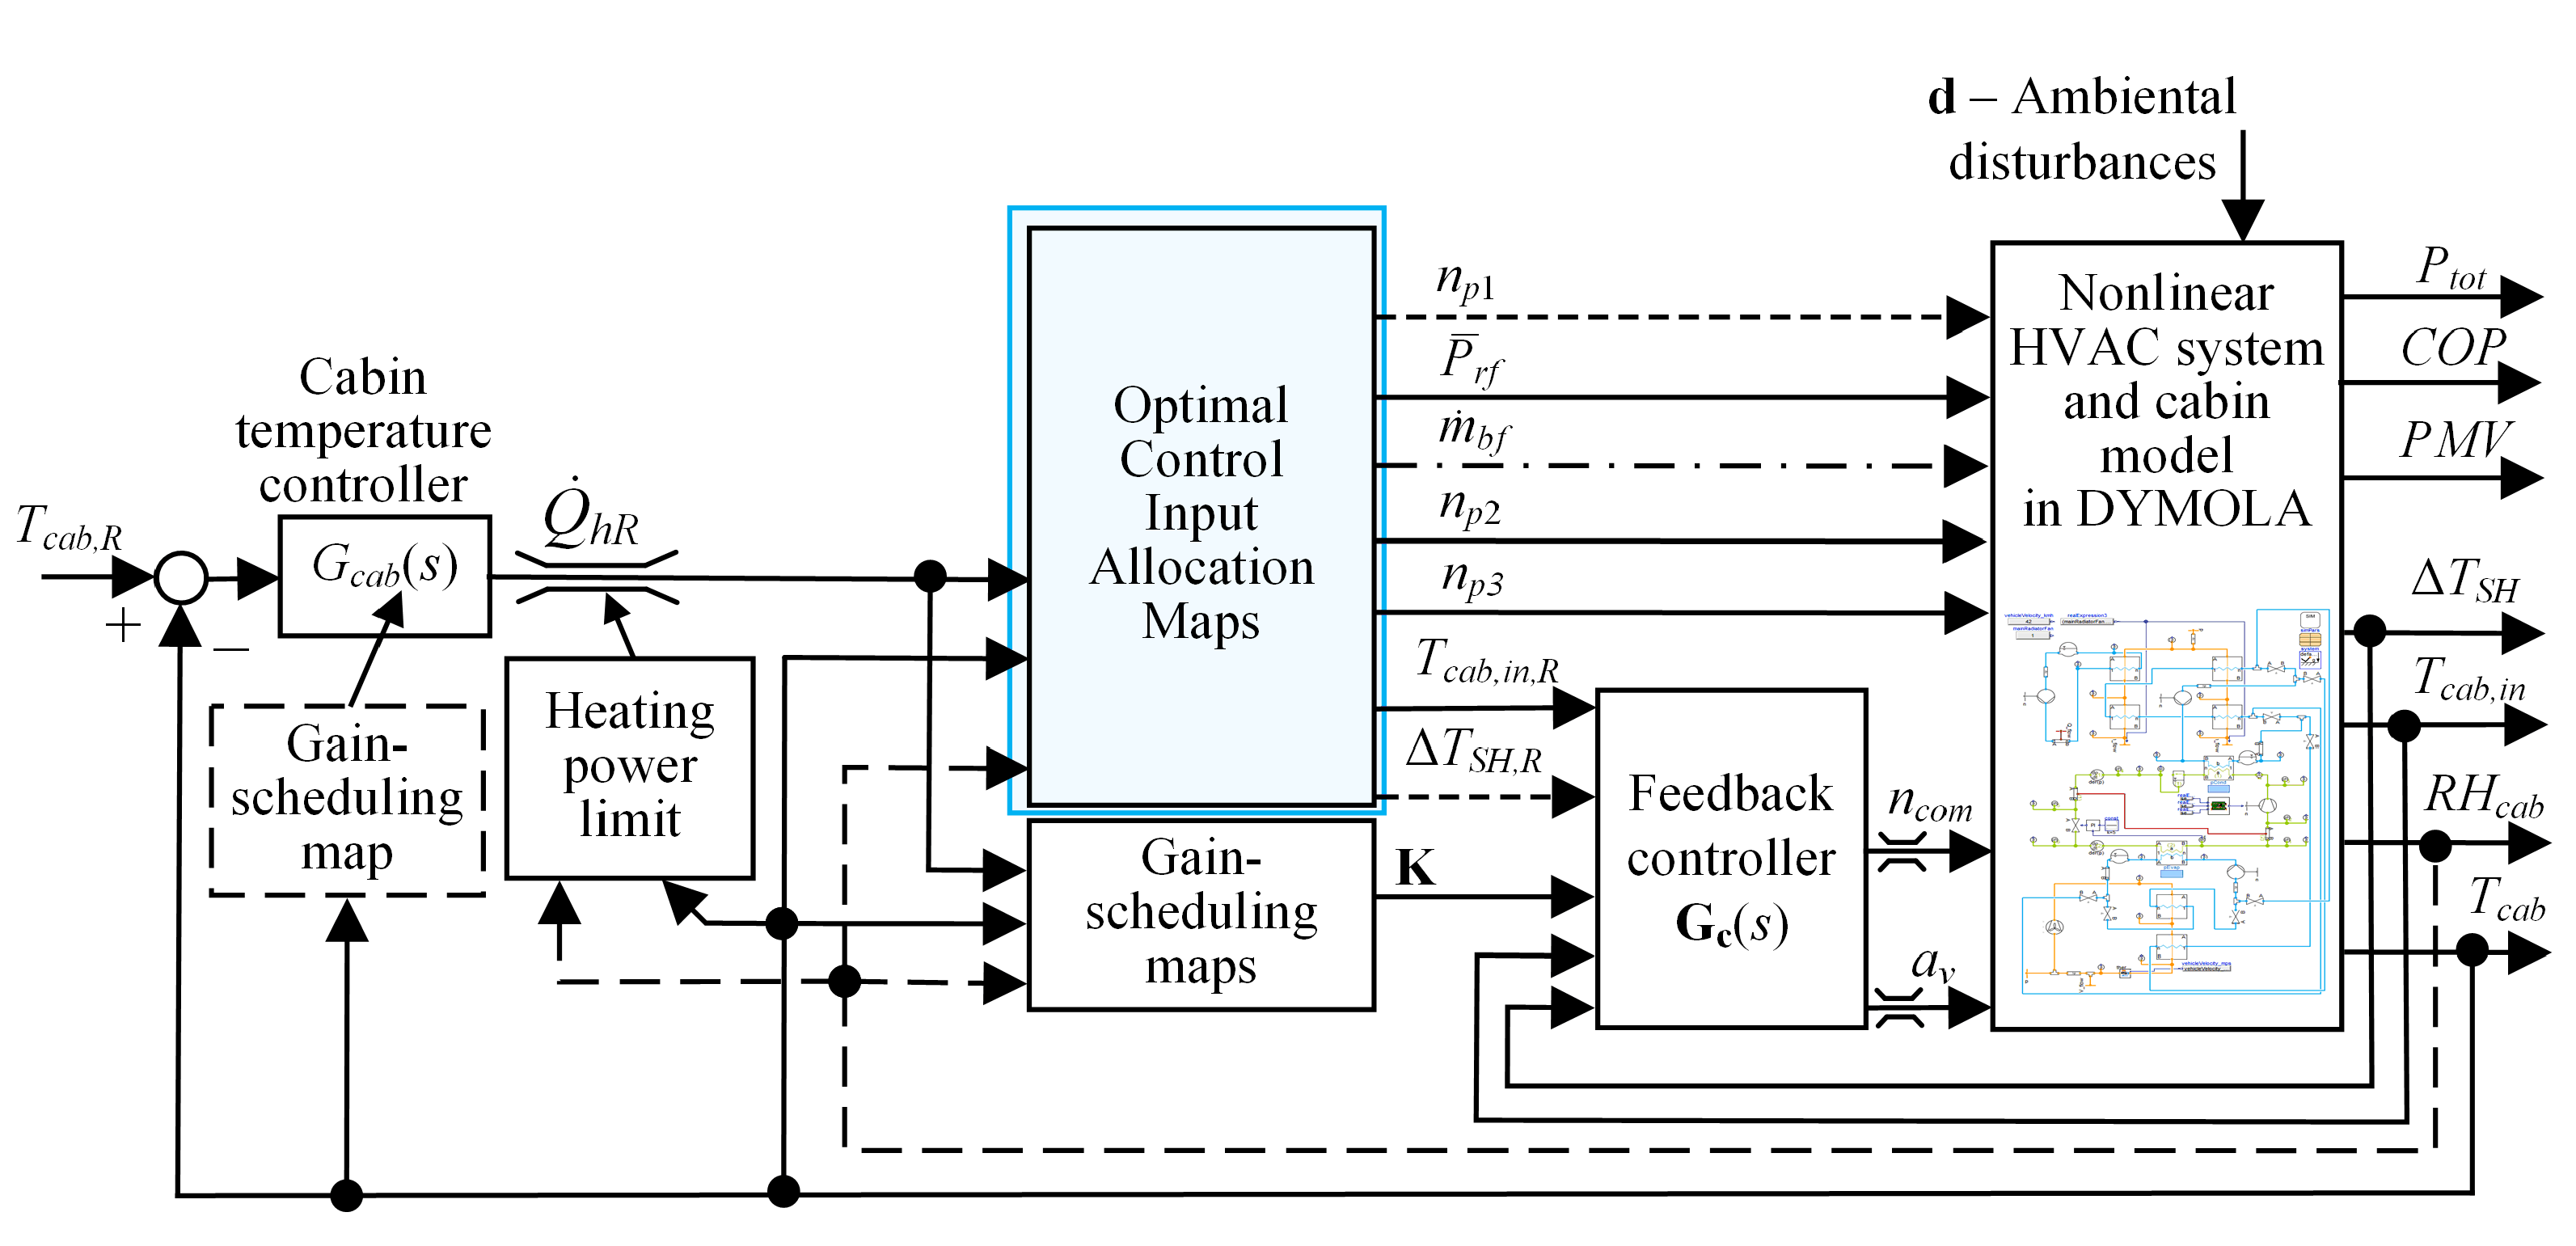
3. HVAC Control Framework

The considered control strategy is shown in Figure 4 based on the hierarchical structure proposed in [21]. The high-level control subsystem consists of two key components: a superimposed cabin air temperature controller and optimal control input allocation maps. The superimposed controller regulates the cabin air temperature Tcab by commanding the heating power demand hR. The controller has variable output saturation to reflect the maximum heating power dependence on cabin air temperature and relative humidity. The cabin air temperature controller can optionally be extended with gain-scheduling algorithm [21].
The optimal control allocation maps (highlighted in blue in Figure 4) transform the heating power demand hR to low-level controller inputs/references. Using the cabin air conditions (Tcab and RHcab) along with the heating power demand as inputs to optimal control allocation map allows for omitting the cabin dynamics model from control allocation map optimisation, thus resulting in more straightforward and computationally more efficient optimisation [21].
It should be noted that the optimal allocation ensures optimal control system performance only for quasi-steady-state operation, under which the actual HVAC variables (e.g., Tcab,in) accurately follow the optimal allocation commands (e.g., Tcab,in,R). For abrupt transient conditions, such as those related to heat-up scenario, the cabin inlet air temperature Tcab,in or the superheat temperature ∆TSH can significantly differ from the corresponding commanded value, because the starting temperatures typically correspond to ambient conditions and the HVAC system has internal thermal inertias (refrigerant, coolant, heat exchanger walls, etc.). Once the setpoints are reached they vary slowly, and the optimal allocation can ensure optimal performance. These (quasi)-stationary modes have a dominant influence on power consumption, because the heat-up period is typically small when compared to the overall length of driving cycle.
In the case of HP mode the allocated open-loop control inputs include blower fan air mass flow rate bf, radiator fan setpoint rf, and two pump speeds np2 and np3. Optimal allocation additionally commands the cabin inlet air temperature reference Tcab,inR to the corresponding low-level, feedback controller that manipulates the compressor speed ncom. Note that for given cabin conditions and heating power demand, the blower fan air mass flow rate can be determined directly from the cabin inlet air temperature reference from the following relation (cp = air specific heat capacity):
m ˙ b f = Q ˙ h R c p ( T c a b , i n , R T c a b ) ,
so that is not treated as a separate control input to be allocated. The second low-level feedback controller command is the superheat temperature reference ΔTSH,R, which is typically set to a fixed value (5 °C, herein). The superheat temperature controller determines the EXV position.

4. Control Input Optimisation Framework

4.1. Cabin Model Decoupling

As discussed in Section 3, the cabin model can conveniently be omitted while optimising the control input allocation maps. To this end, the model used in optimisation differs from the original model outlined in Section 2, in terms of omitting the cabin model (red box in Figure 2) and replacing it with the boundary conditions that determines the cabin air properties (Tcab and RHcab), where the recirculation setting determines the ideally mixed air temperature Tin and its relative humidity RHin at the blower fan inlet (orange box in Figure 2). Repeating the optimisation for different cabin air conditions and different heating power demands (see illustration in Figure 5), and potentially different ambient conditions and vehicle velocity, yields optimal allocation map. Additional benefit of this approach is that it yields the HVAC system operational limits for given ambient conditions, beyond which the optimisation will not find feasible solution (red crosses in Figure 5). These limits are used to parameterise the heating power limit map shown in Figure 4. Opting for higher grid resolution (denser operating points in Figure 5) will result in more precise allocation map and operational limits at the expense of increased optimisation time.

4.2. Optimisation Problem

4.2.1. Cost Function
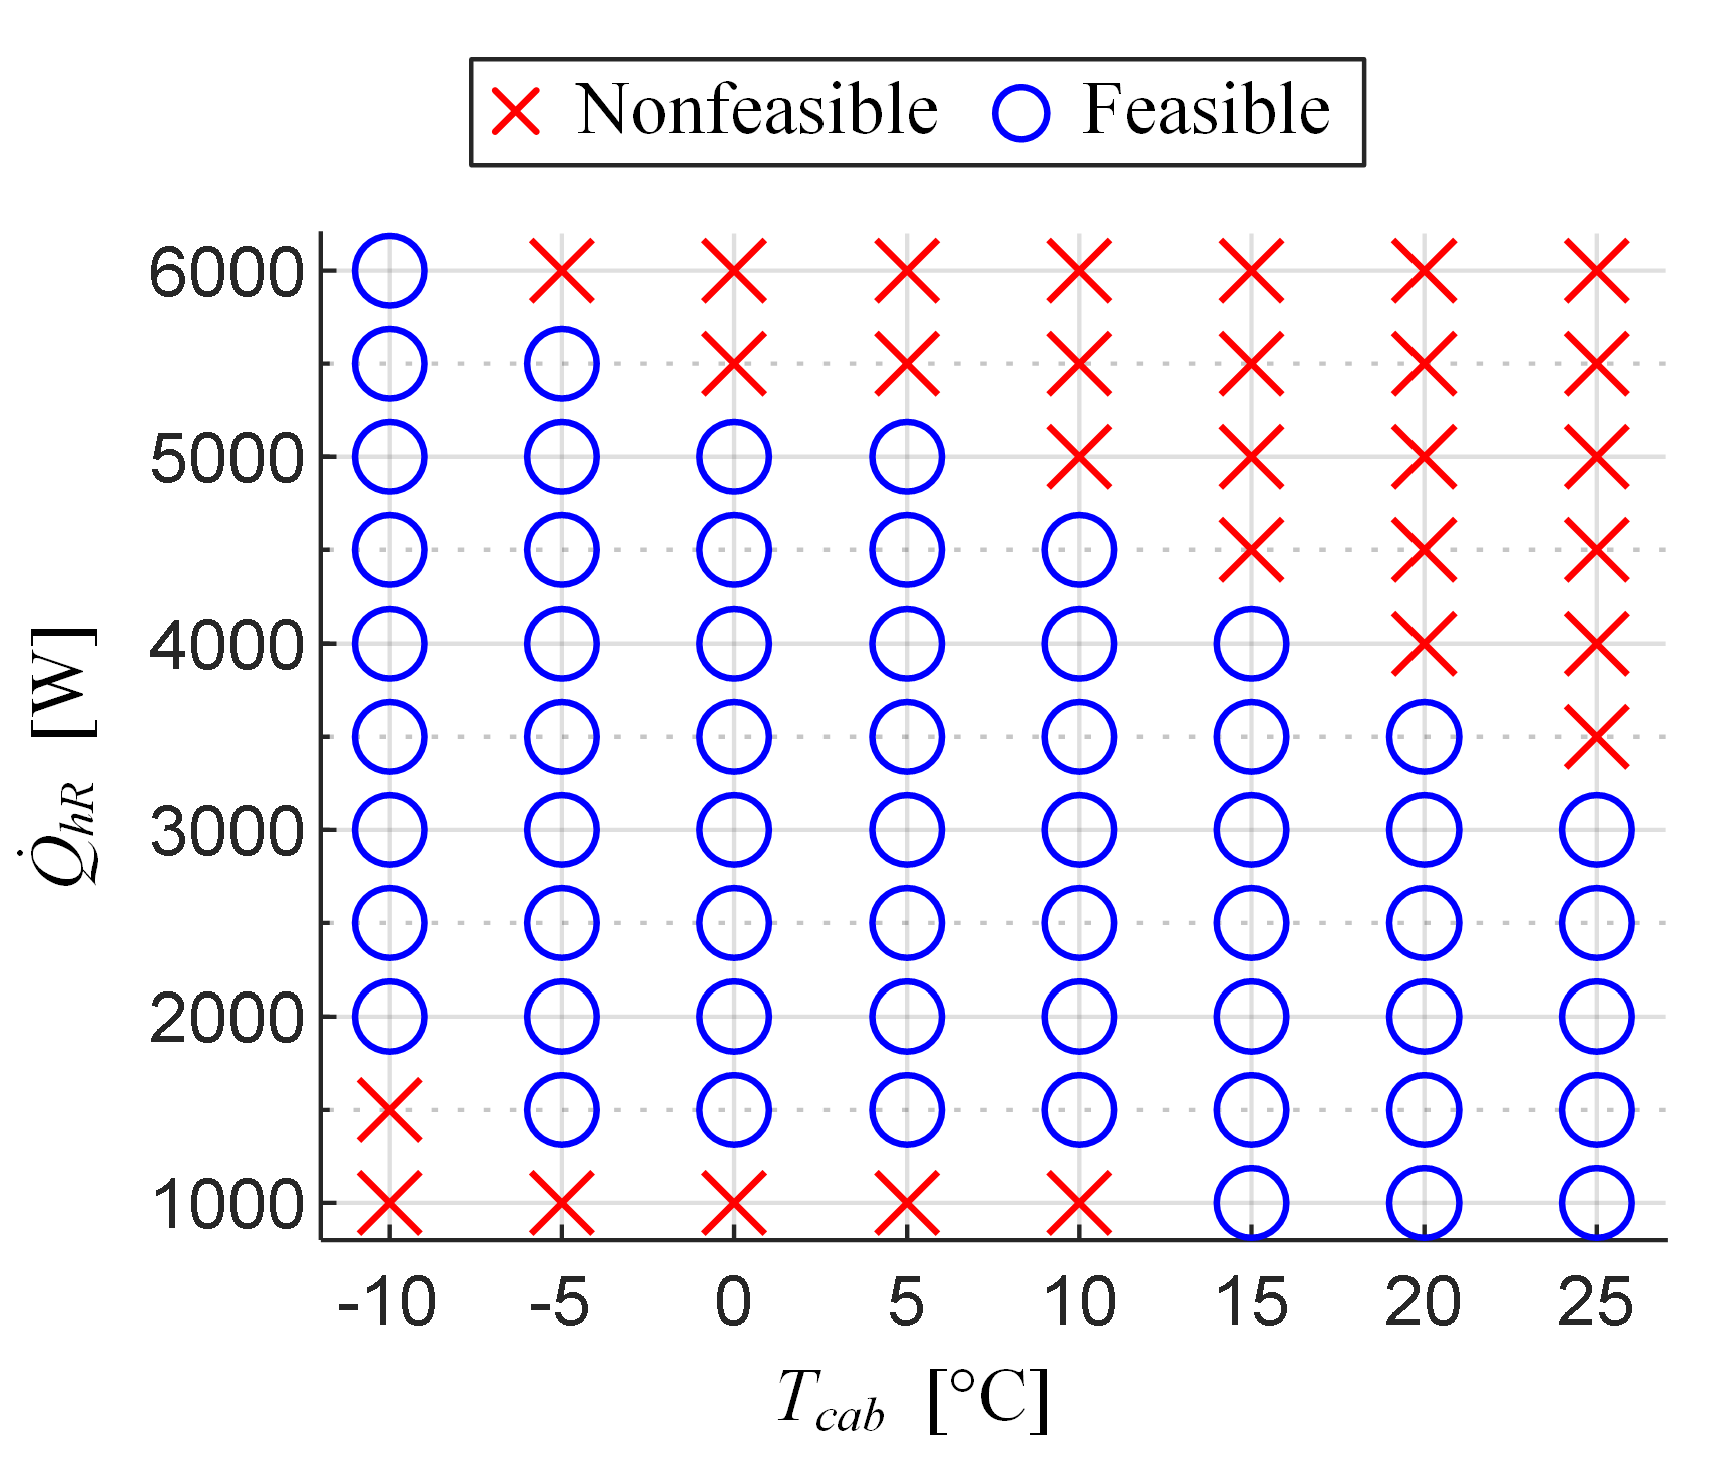
The optimisation is aimed at maximizing the HVAC system efficiency under steady-state conditions, which is defined by the coefficient of performance (COP):
J = max(COP)
where the COP is defined as the ratio of useful thermal energy exchanged at the heater core and the total electric power consumption of HVAC actuators including compressor, blower fan, radiator fan and pumps [28]:
COP    Q ˙ H C P c o m + P b f + P r f + P p 2 + P p 3
where the useful thermal energy exchanged at the heater core is given by
Q ˙ H C = c p , a m ˙ b f ( T c a b , i n T a m b )
In the case of HP mode, the thermal energy exchanged at the heater core corresponds to sensible heat since the air is not dehumidified (latent heat is zero). The consumption of low-power positioning HVAC actuators, such as EXV stepper motor or cabin air distribution flaps is not modelled, and thus not included in COP calculation. Note that the power consumption of the powertrain coolant loop pump Pp1 is constant for the constant pump speed (Section 2), and as such it is not included in Equation (3).
Instead of using the cost Equation (2), one may opt for minimizing the total electric power consumption, especially when considering the fact that the thermal energy exchanged at the heater core (Equation (4)) differs to some extent to the heating power entering the cabin (Equation (1)). This typically occurs at higher cabin temperatures and can result in somewhat different allocation map optimisation results. Employing such an alternative cost function is beyond the scope of this work.

4.2.2. Constraints

Optimisation is subject to various hardware and controller setpoint tracking constraints, which are overviewed in Table 1. The control input constraints relate to actuator output limits (pumps), discrete states of actuator power (radiator fan) and software limits of cabin inlet air temperature reference for comfortable operation. There are additional hardware constraints related to other HVAC actuators. In the HP mode, these are the compressor speed, EXV valve position and blower fan control voltage. These constraints are not implemented on the side of optimisation algorithm, but rather as explicit limit within the simulation model. They relate to the compressor speed and EXV position limits (i.e., limits of low-level feedback controllers, Figure 4). Similarly, the demanded blower fan air mass flow rate, calculated by using Equation (1), is converted in the model to the blower fan voltage input Vbf,in using the polynomial approximation given in Section 2, which is saturated according to the limits set within the simulation model.
The controller setpoint tracking constraints are applied to ensure that the low-level feedback controllers’ reference values are achievable for the given set of allocated control inputs under steady-state conditions or, otherwise, to signal that the low-level loop actuators are saturated. Suppressing the superheat temperature control error is a safety feature that ensures that the refrigerant at the compressor inlet is in gas state. Significant superheat control errors typically occur due to saturated EXV opening, which is a signal to the optimizer that such operating point is unfeasible. Similarly, the cabin inlet air temperature tracking error may occur if the compressor speed is saturated. In this paper, the temperature tracking error up to 1 °C is tolerated (Table 1). The third setpoint tracking constraint is related to heating power demand, which may not be satisfied if e.g., the blower fan is saturated for given cabin air conditions and cabin inlet air temperature (see Equation (1)). Herein, a heating power error of 100 W is tolerated. Lower error thresholds will ensure better tracking at the expense of potentially longer optimisation runs. In order to mark the operating point as feasible (blue circles in Figure 5), all setpoint tracking constraints need to be satisfied.

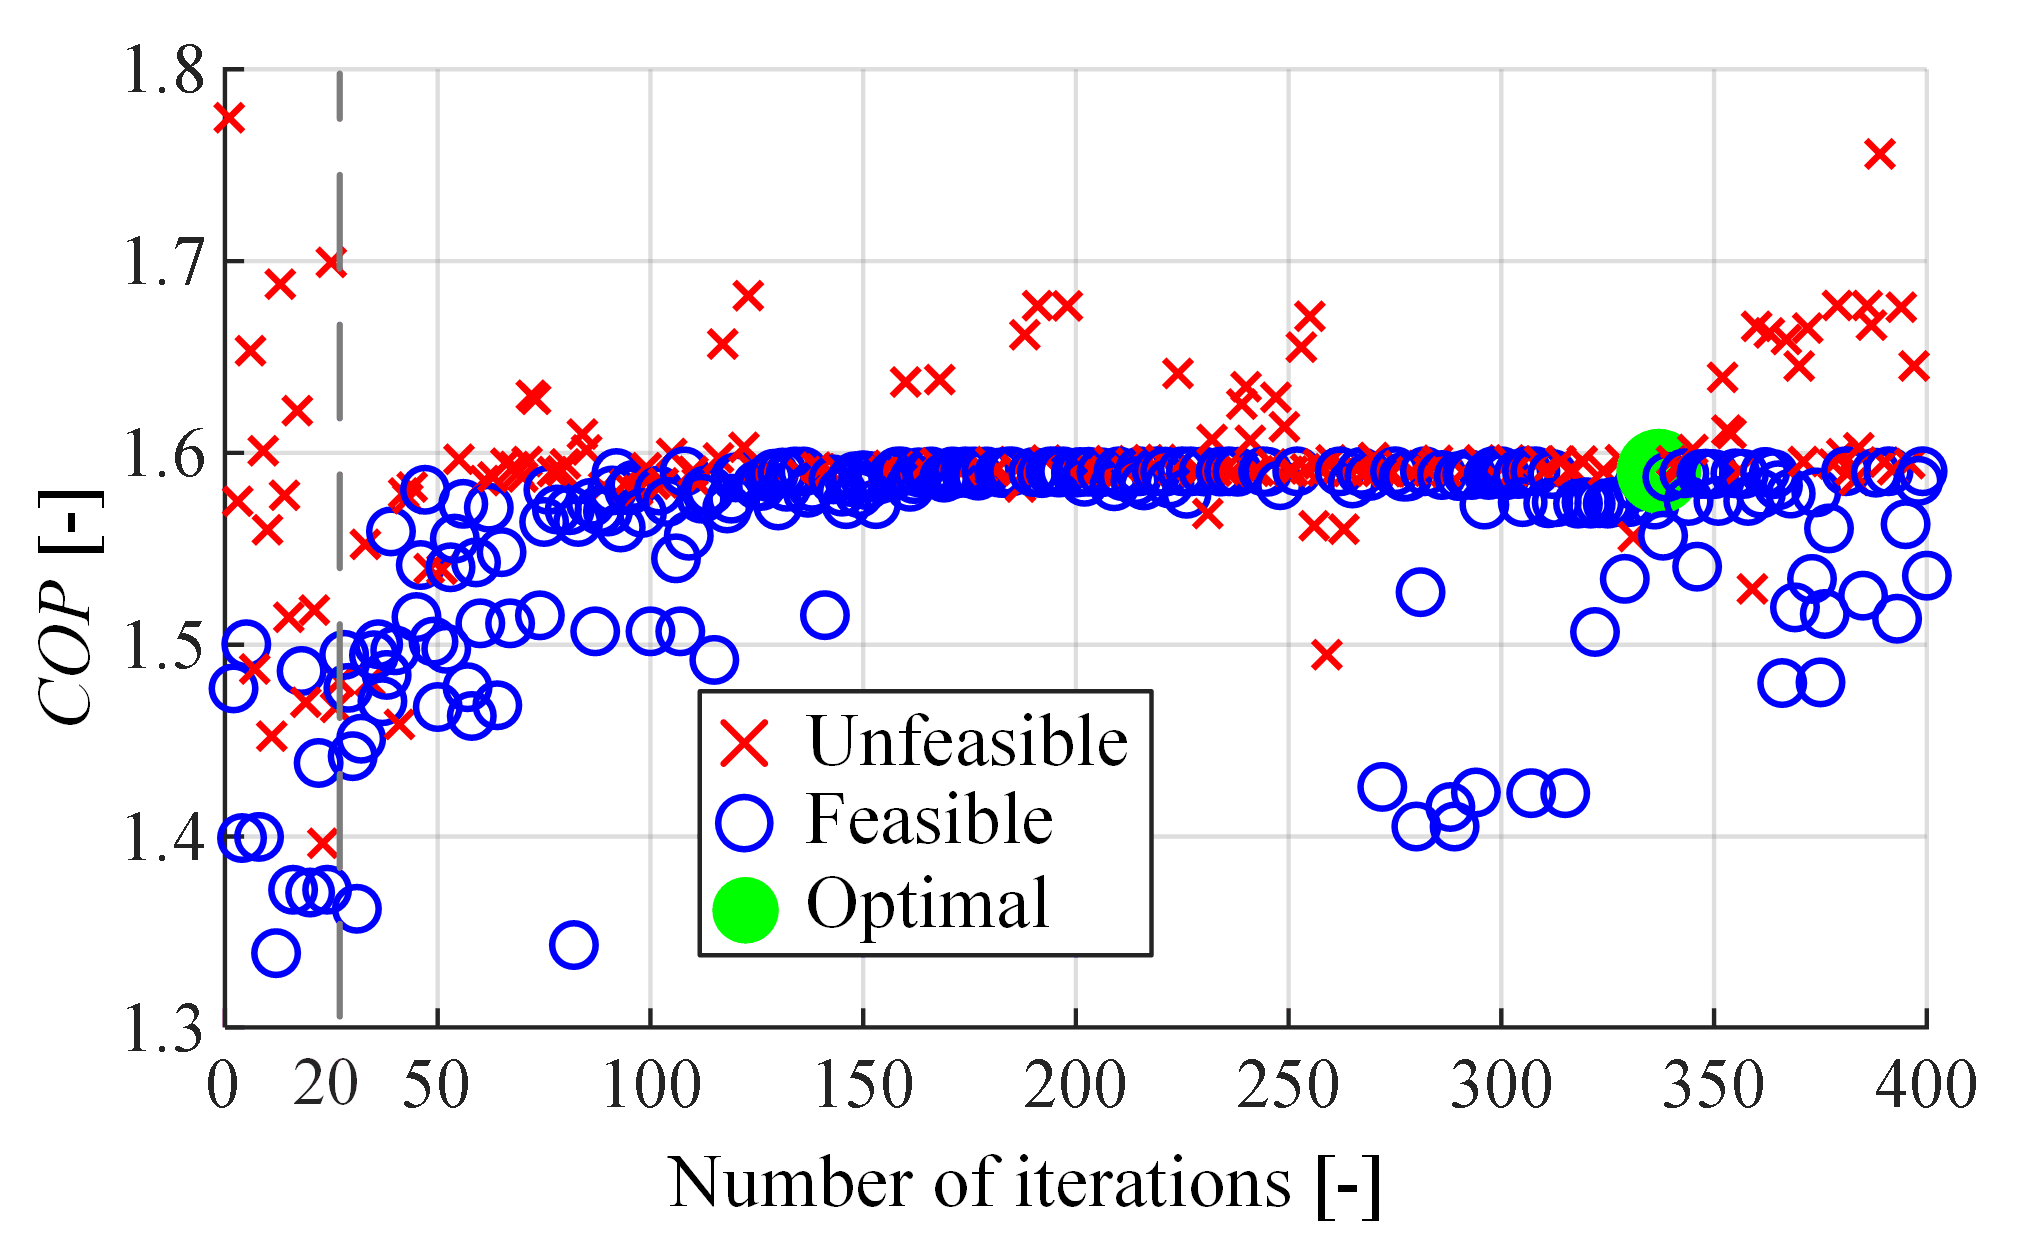
4.3. Optimisation Method

Optimisation of HVAC control inputs has been carried out using ESTECO’s modeFrontier software and the built-in multi-objective genetic algorithm MOGA-II [29]. The implemented workflow is shown in Figure 6, where its central part corresponds to a MATLAB node.
The MATLAB node acts as an interface between the Dymola simulation model and modeFrontier. The control inputs determined by the genetic algorithm (GA) in modeFrontier (blue box in Figure 6) are fed to the MATLAB script. The script transforms the control inputs into simulation model inputs, sets the simulation parameters (e.g., ambient and cabin conditions) and simulates the Dymola HVAC model (exported from Dymola in the executable form). The model simulation is controlled as described in [24], where the model is gradually initialized in accordance with the set control inputs, and where enough time is given to simulation to settle to steady-state value (1200 s, herein). After the simulation ends, the MATLAB script feeds the steady simulation outputs back to modeFrontier for evaluation of the setpoint tracking constraints (dashed purple box in Figure 6) and cost function (dashed orange box; Equation (2)). The modeFrontier generates a new set of control inputs based on the evaluated outputs for the new iteration run. This process runs for a specified number of GA iterations (400, herein). Initial control input population of 20 combinations (i.e., initial design of experiments) is generated by using a quasi-random Sobol sequence.
The control input constraints from Table 1 are implemented in the form of limited GA search space. All optimisation inputs have continuous values between bounds, with the exception of main radiator fan where only three distinct values are given to GA to choose from. The controller setpoint tracking constraints are implemented by using the modeFrontier’s constraint node. The MOGA-II algorithm handles these hard constraints as soft constraints when evaluating the cost function, i.e., they are penalized in the GA cost function proportionally to constraint violation [30].
The optimisation procedure described above for a single HVAC operating point, defined by a single set of cabin air conditions and single heating power demand, is repeated in a loop for other operating points defined (see Figure 5). This finally results in optimal control input allocation maps. The operating point range, optimisation setting parameters and main simulation parameters used herein for the heat pump mode are given in Table 2.
Figure 7 shows the GA convergence to optimal solution for a single operating point. The GA starts with 20 initial designs (first 20 iterations), some of which are feasible (blue symbols) and others are unfeasible (red symbols). The GA then generates next designs, and iteratively pushes the objective (COP) to higher values, until it eventually saturates at around 1.6 after 150 iterations (green symbols). Even though the COP has converged, the GA generates a plethora of solution, testing the search space for better accuracy and avoiding local minima.

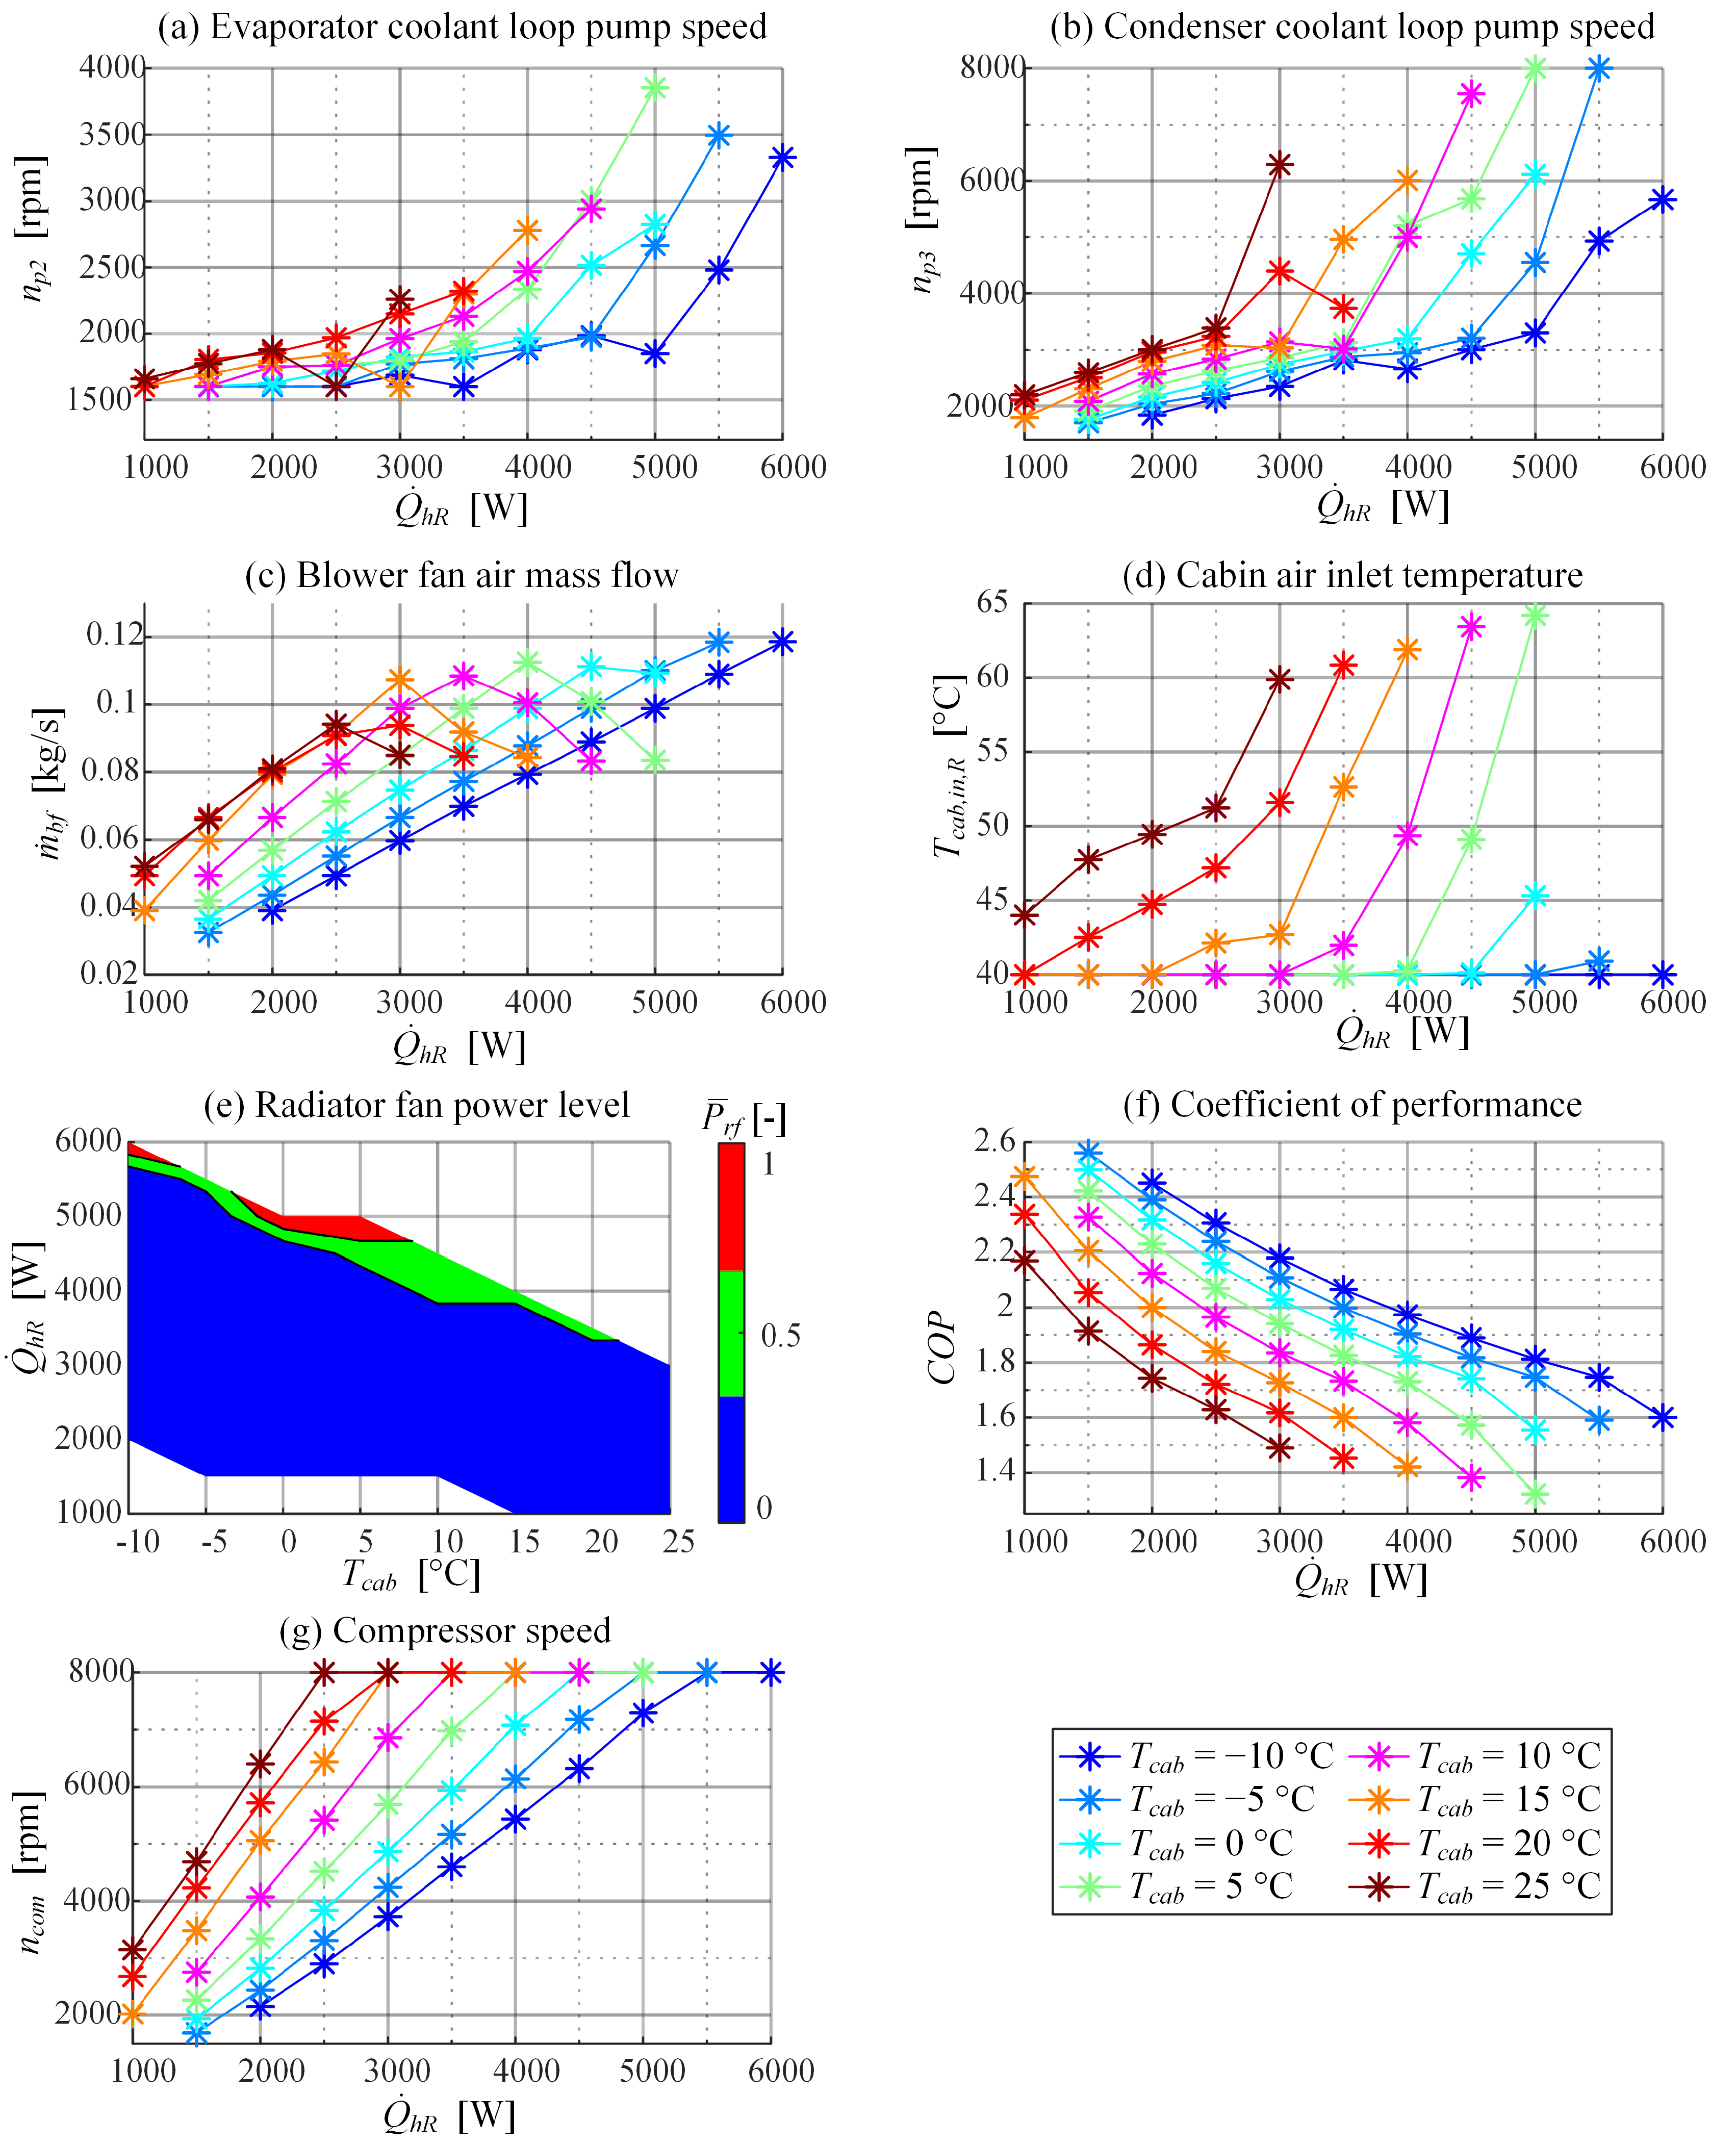
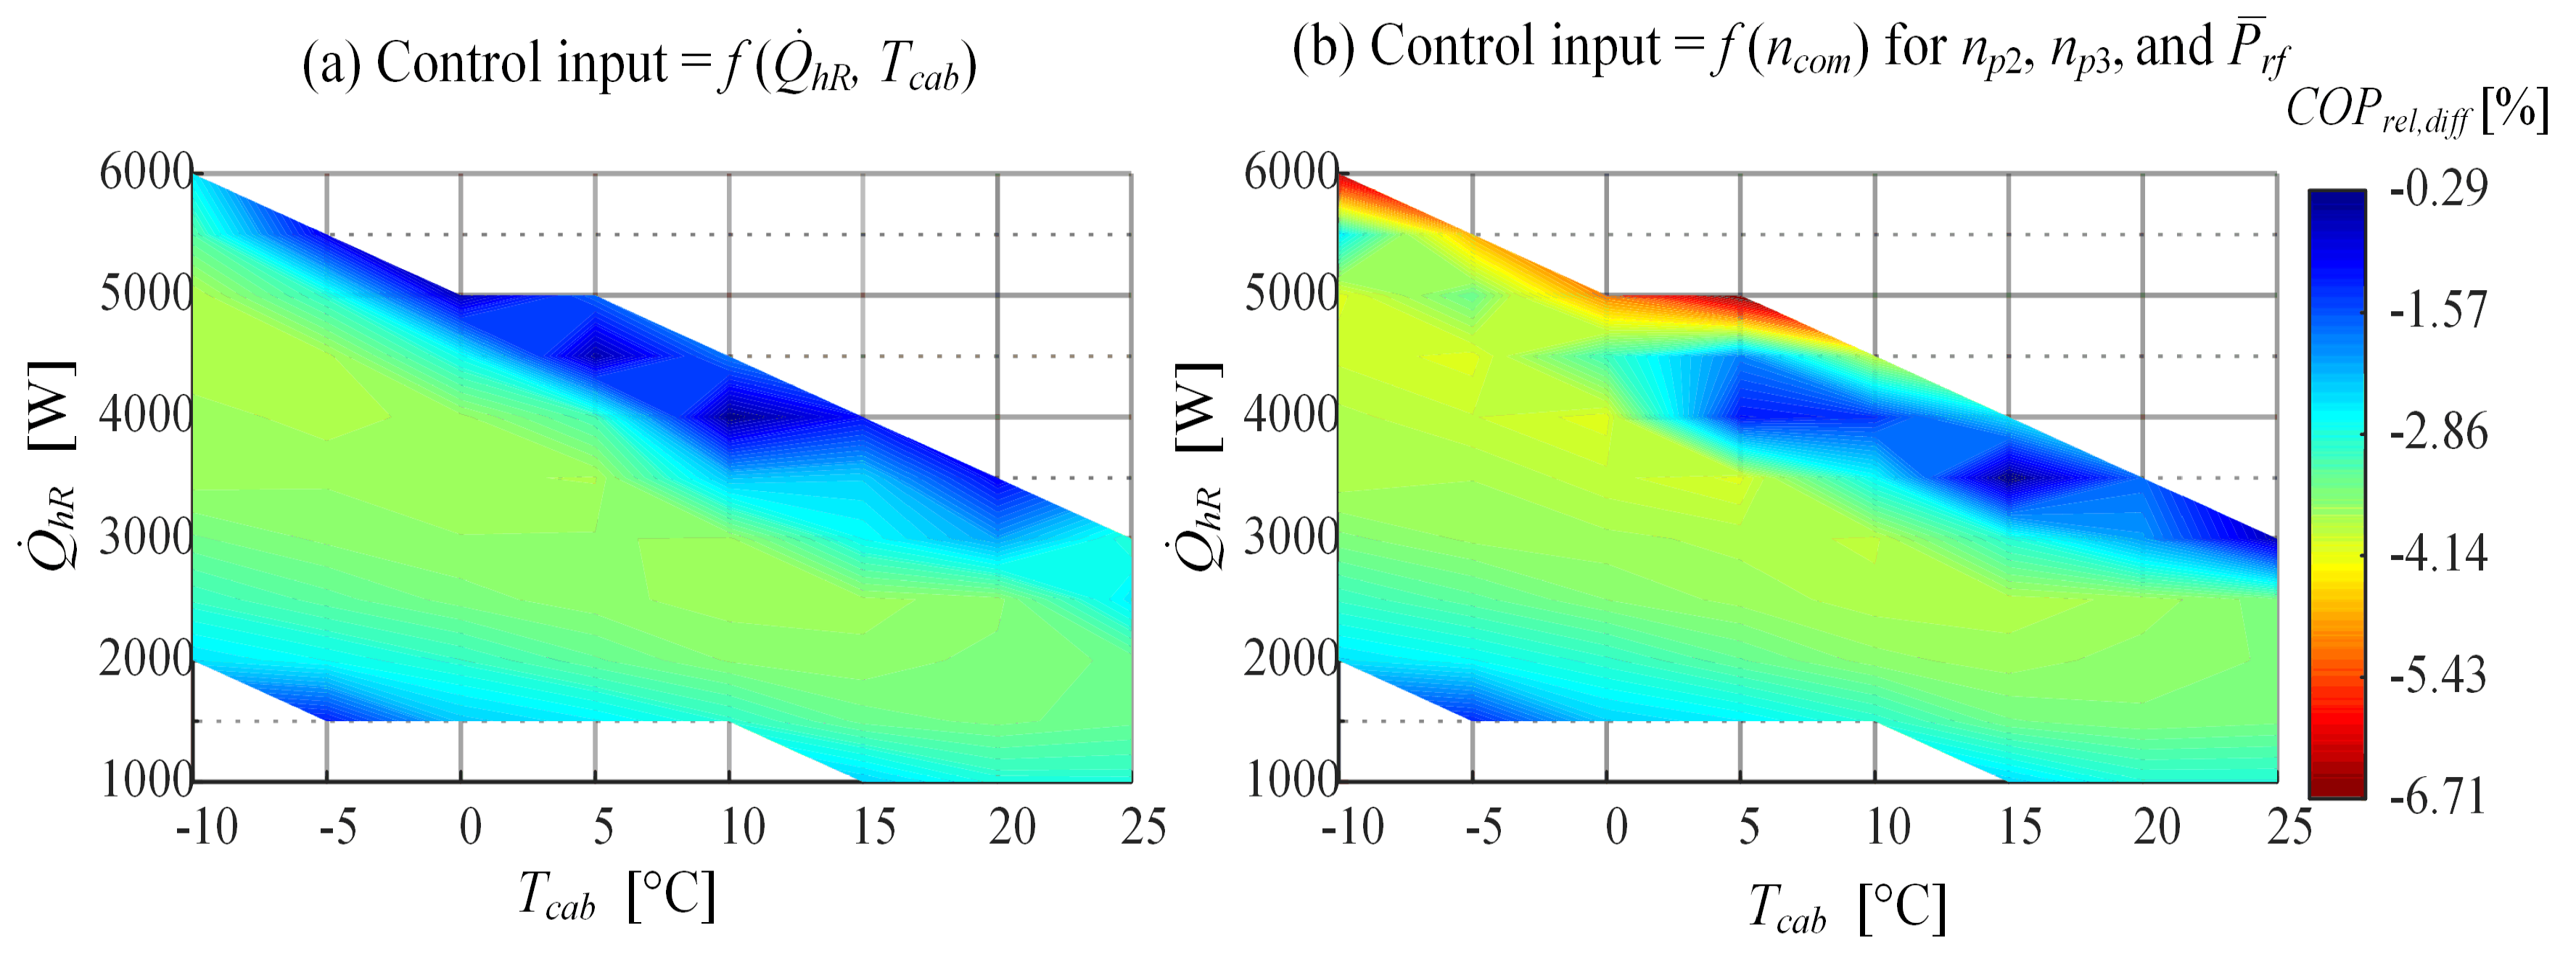
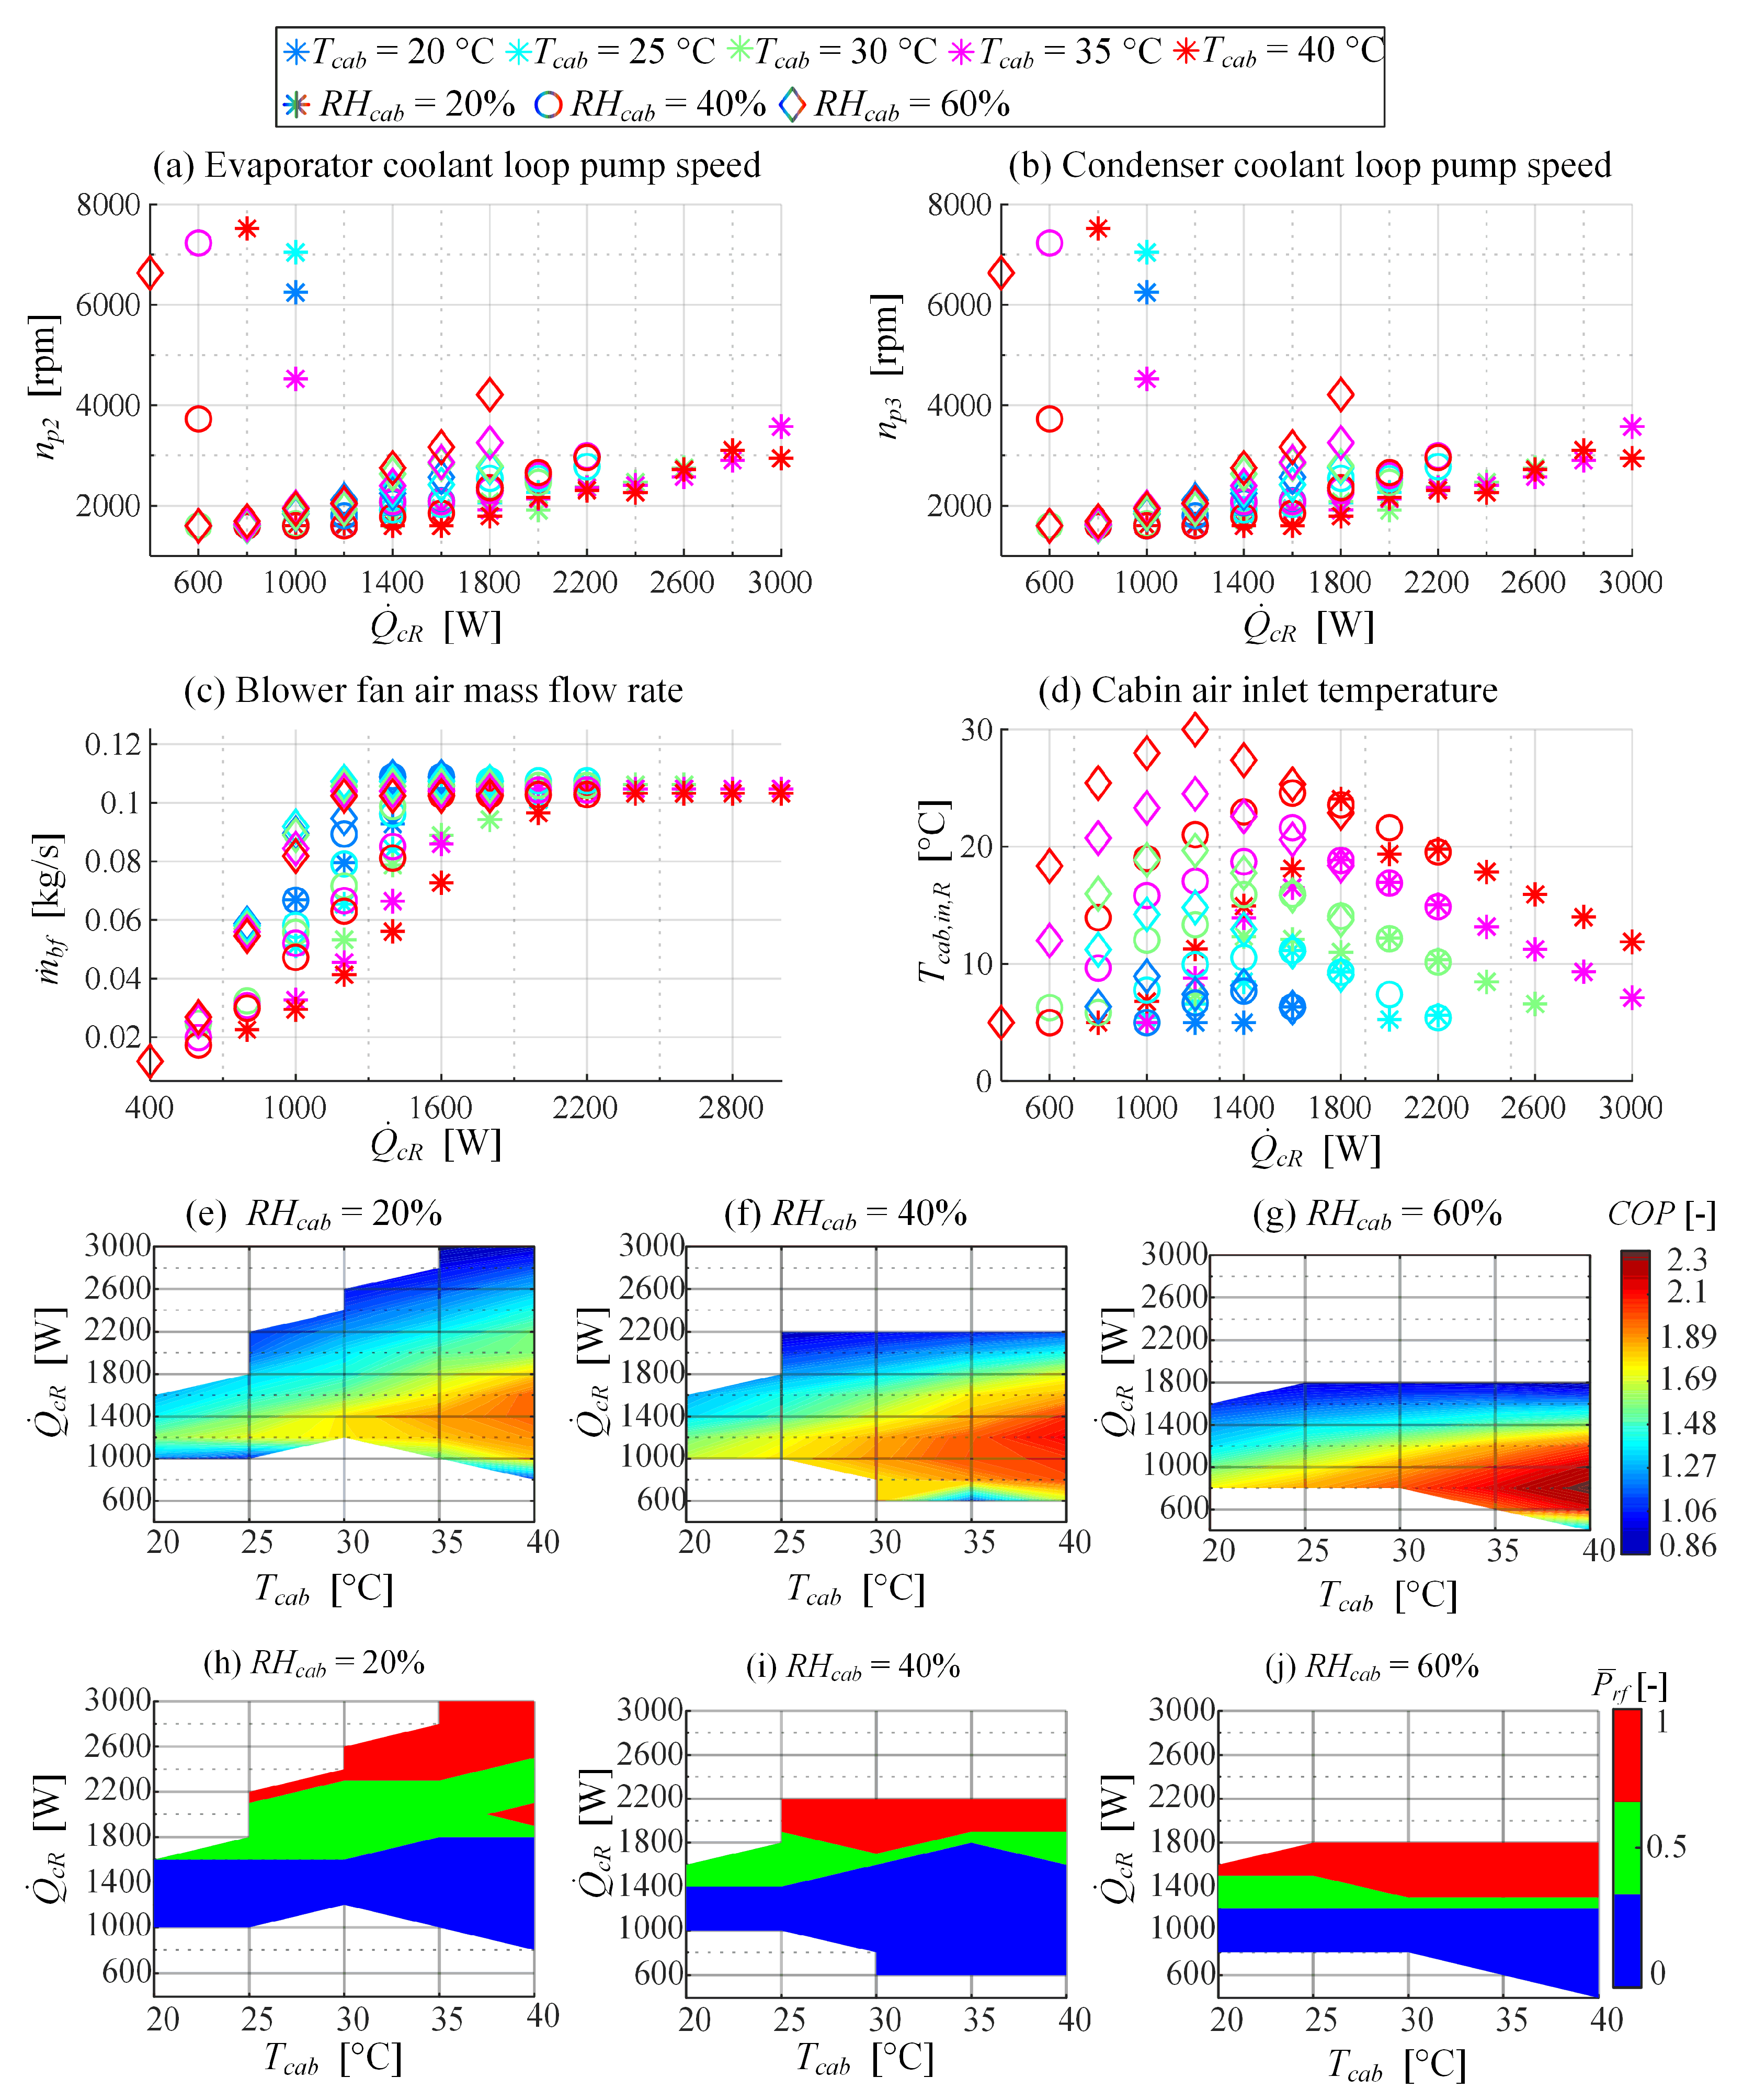
5. Optimisation Results and Control Input Allocation Mapping

5.1. Optimisation Results

Figure 8 shows the optimisation results obtained for the HP operating mode, while the main results related to the A/C mode are given in Appendix A. Figure 8d shows the optimal cabin inlet air temperature reference Tcab,in,R, which is often saturated to its lower limit of 40 °C to reduce the compressor speed (Figure 8g) and maximize the efficiency, i.e., COP (Figure 8f). In the case of saturated Tcab,in,R, the blower fan air mass flow bf linearly increases with respect to heating power demand hR (Figure 8c). Once the compressor speed saturates (Figure 8g), the cabin inlet air temperature is mostly further increased, while at the same time the blower fan air mass flow is decreased to maintain feasibility. Both the cabin inlet air temperature and air mass flow increase with rise of cabin air temperature Tcab at constant heating power demand.
The optimised evaporator-side pump speed np2 (Figure 8a) progressively grows with increase of heating power demand hR for a constant cabin temperature Tcab, and also increases with the cabin temperature for a fixed heating power demand. The condenser coolant pump speed np3 (Figure 8b) increases linearly with heating power up to a point, after which the pump speed is significantly increased to meet the heating power demand. This turning point is typically triggered by increased cabin inlet air temperature (related to saturated compressor speed). Note that similar to the evaporator-side pump speed, the condenser pump speed increases with cabin air temperature.
The radiator fan (Figure 8e) is turned off at a majority of operating points, while half- or full-power is demanded only at high heating power demands hR. This indicates that for the considered vehicle velocity of 60 km/h, the air mass flow through the main radiator produced by ramming is usually high enough.
Finally, the HVAC efficiency (Figure 8f) is higher at lower heating power demands, where the actuator setpoints are lower, thus resulting in lower power consumptions. The efficiency decreases with increasing cabin temperatures. Note that the lowest COP is around 1.35, while for a majority of operating points it is greater than 1.5, and it peaks at around 2.6.
The optimized allocation maps may be expressed with respect to different sets of input variables to facilitate map fitting with analytical functions. A natural candidate for replacing the heating power demand input hR is the compressor speed ncom. The corresponding allocation maps are shown in Figure 9. Figure 9a,b indicate that pump speeds depend solely on compressor speed, unless the compressor speed is saturated when the pump speeds strongly depend on the cabin temperature, as well. The radiator fan power level (Figure 9c) can also be brought to a straightforward correlation with compressor speed; namely, it is turned off if the compressor speed is not saturated. Finally, Figure 9d shows the cabin inlet air temperature plotted against compressor speed, which confirms that the temperature reference is typically increased when the compressor speed saturates at its upper limit.

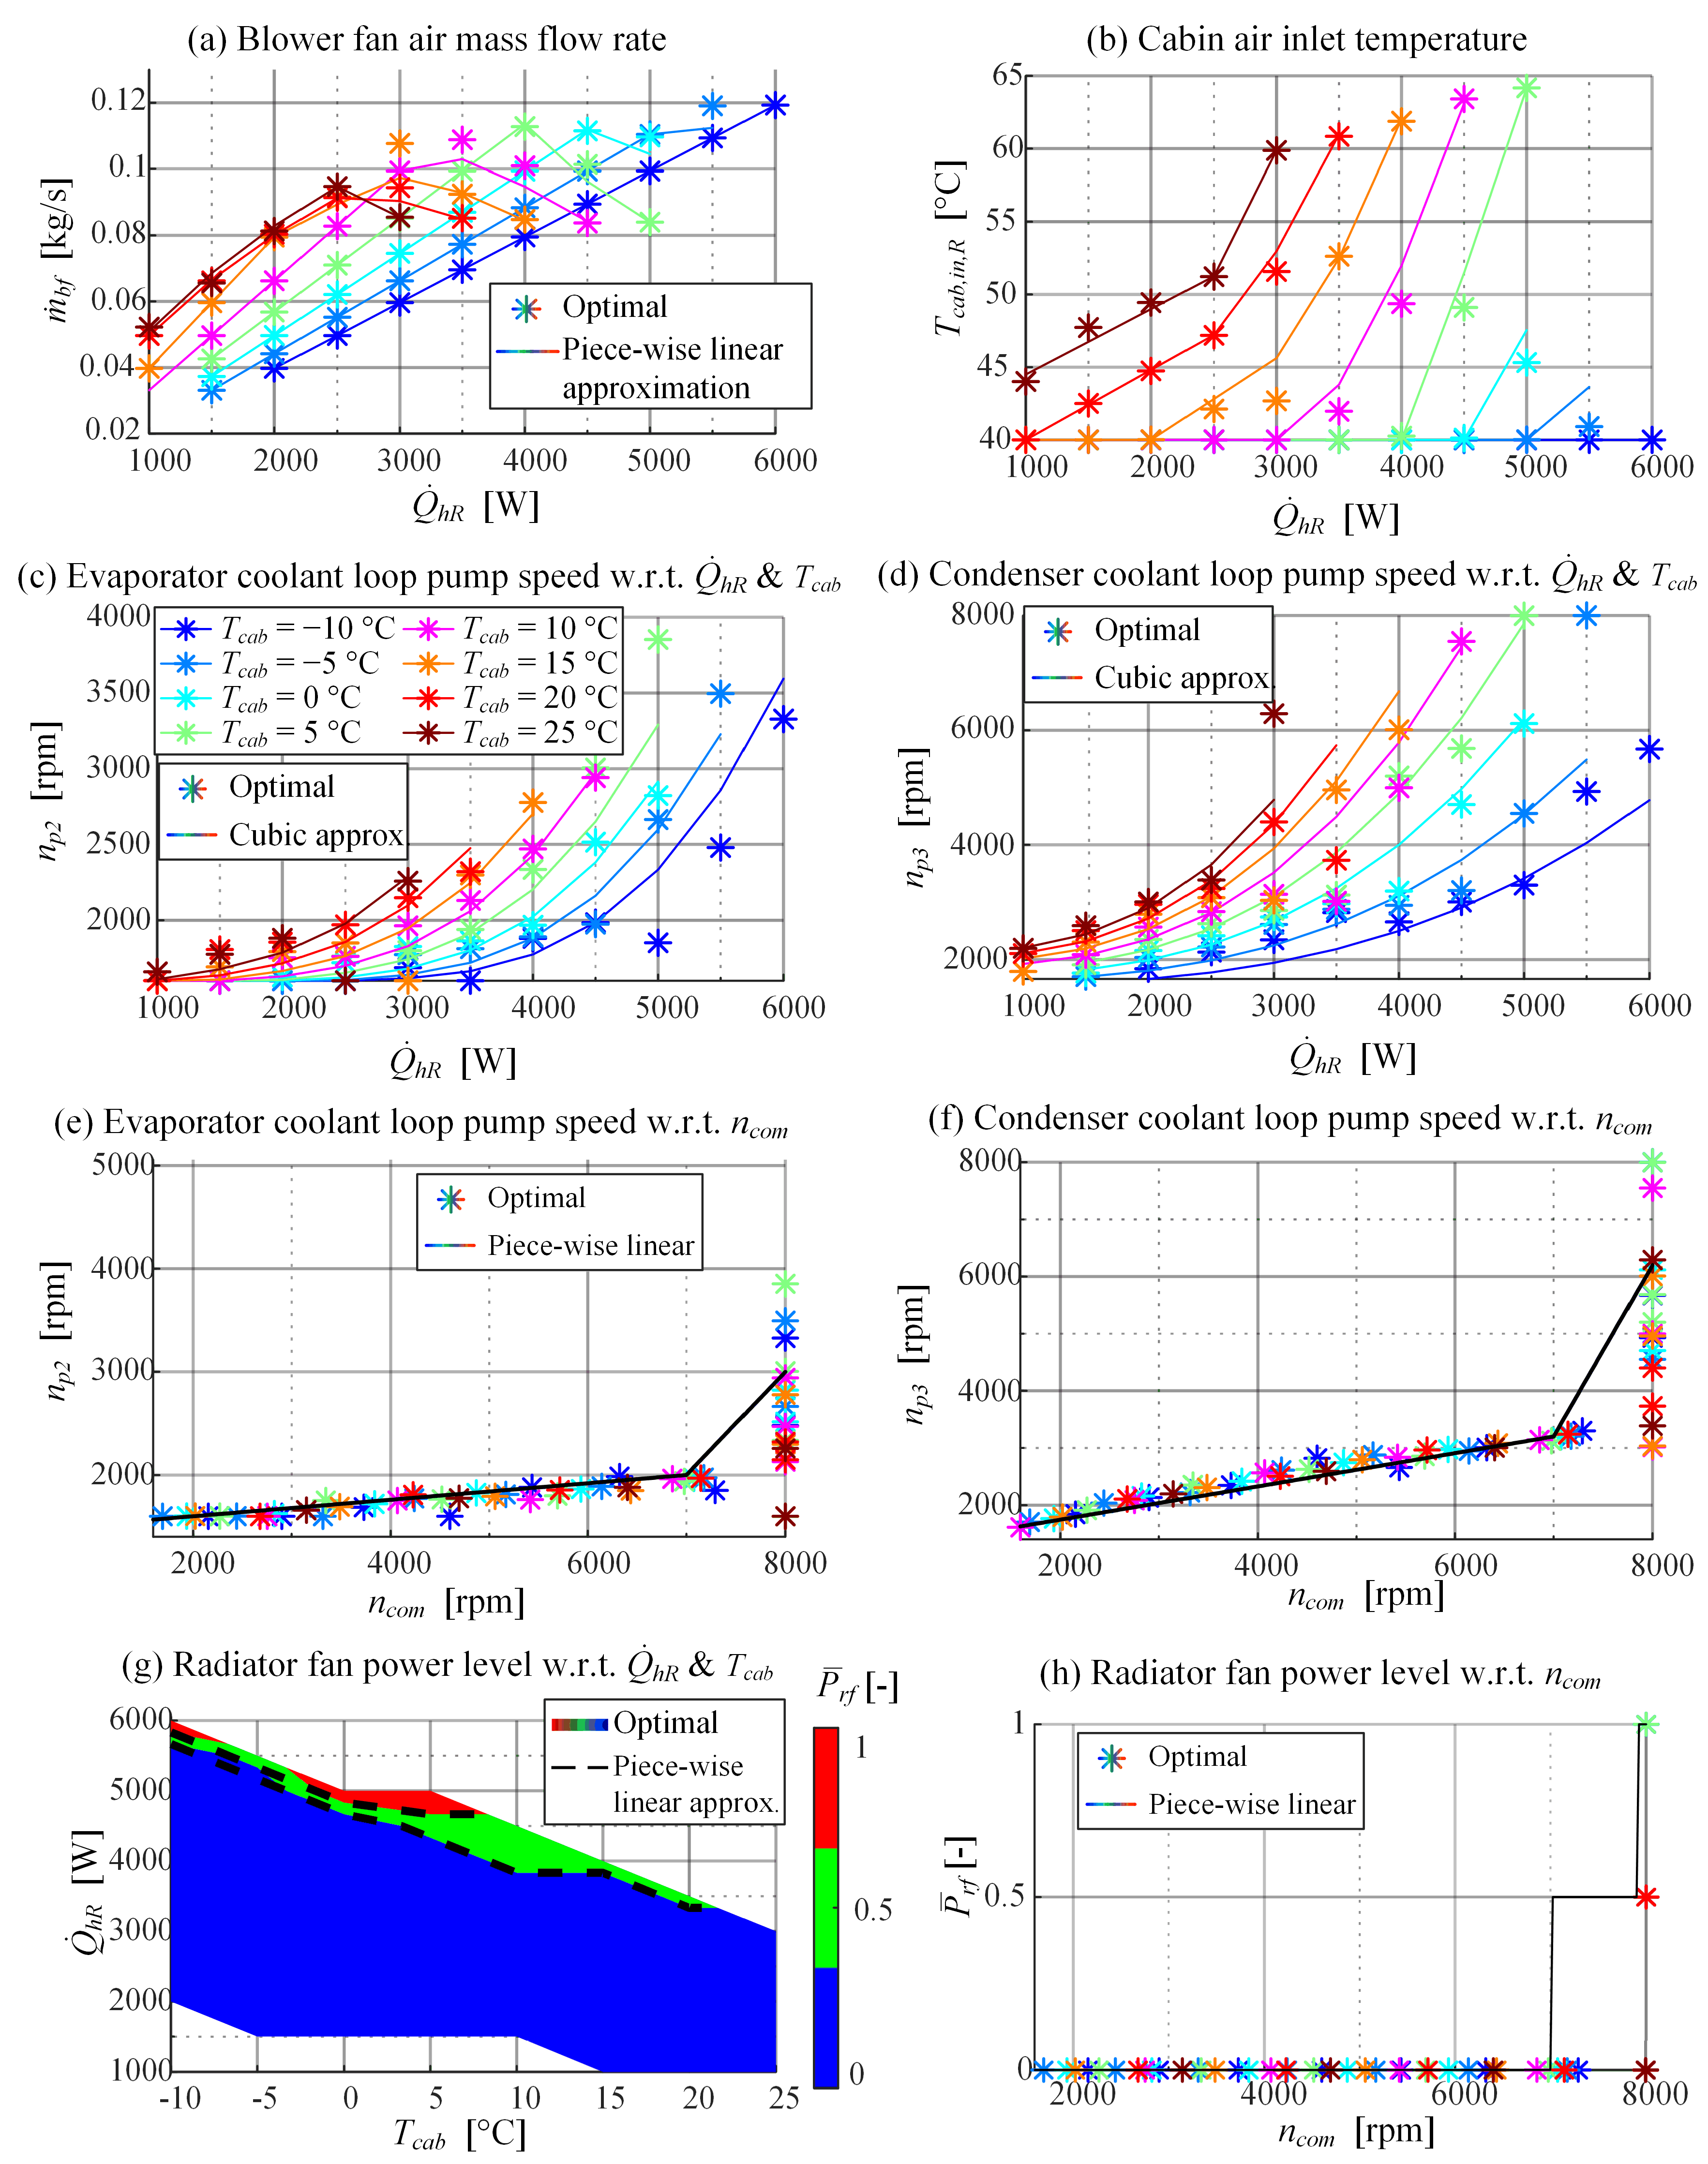
5.2. Approximation of Optimized Allocation Maps with Analytical Functions

The optimized allocation maps shown in Figure 8 or Figure 9 can be approximated by analytical expressions describing the map outputs as functions of cabin air conditions (Tcab, and also RHcab in the A/C mode, Appendix A) and the heating power demand hR or alternatively the compressor speed ncom. These approximations should include a very limited set of parameters that can be tuned, which generally facilitates the control strategy implementation and calibration
The cabin inlet air temperature map Tcab,in,R(hR, Tcab) from Figure 8d is approximated as a piece-wise linear function of heating power demand hR, where the breakpoints of the linear functions are scheduled with respect to cabin air temperature Tcab. The function output is saturated to the limits specified in Table 1. The blower fan air mass flow is then calculated based on Equation (1). Figure 10a,b indicate that these approximations are well-suited, with minor, locally occurring differences with respect to optimized inputs.
The pump speeds are approximated either as functions of heating power demand and cabin air temperature (based on Figure 8a,b) or solely compressor speed (based on Figure 9a,b). In the former case the pump speeds are described as cubic functions of heating power demand, where the fitting function coefficients are scheduled with respect to cabin air temperature. The latter approximation describes the pump speeds as piecewise linear functions of compressor speed. The accuracy of approximations is illustrated in Figure 10c,d for the former case and Figure 10e,f in the latter case.
The radiator fan discrete power level maps shown in Figure 8e and Figure 9c are approximated in similar ways as in the case of pump speeds. The radiator fan control relies on a switching algorithm based on the heating power demand input, while the switching threshold curve is implemented as a piecewise linear function of the cabin air temperature (Figure 10g). An alternative switching algorithm is based on the compressor speed input with constant switching points (Figure 10h). Note that when implementing the allocation functions, a hysteresis is applied to avoid chattering in the vicinity of switching thresholds.
Apart from simplifying the fitting functions and, thus, facilitating the control strategy calibration, there are two additional possible benefits of approximating the pump speeds and radiator fan power levels in dependence of the compressor speed. First, the system behaviour during intense transients (e.g., during the heat-up scenario) could potentially be improved because the compressor speed is typically swiftly increased in those operating conditions (unlike the slower transient of heat capacity demand), and consequently the pump speeds and the radiator fan power level are abruptly increased, thus resulting in increased coolant flow and radiator air mass flow, respectively, i.e., in higher energy exchange. Secondly, because of the higher coolant and air mass flows, the resulting temperatures and pressures in the heat exchangers would be reduced during the abrupt transient intervals, thus keeping the compressor in the safe operating range.
A simulation-based analysis has been carried out to verify the control input allocation map approximations and to test the COP sensitivity to approximation errors. The first approach considers all control inputs to be functions of heating power demand and cabin air temperature, while in the second approach the pump speeds and the radiator fan power level are described as functions of compressor speed. The maximum relative COP difference between the cases when the approximated and original allocation maps are used is less than 5% when using the former approach (Figure 11a) and less than 5% for majority of operating points when using the latter approach (Figure 11b). Using the compressor speed as input to analytical approximations results in higher performance deterioration, particularly in the region of higher heating power demands. This small degradation of the approximation accuracy is connected with the region of saturated compressor speed, in which there is a significant simplification of pump speed input-related approximation (see Figure 10e,f for the highest/saturated compressor speed of 8000 rpm).

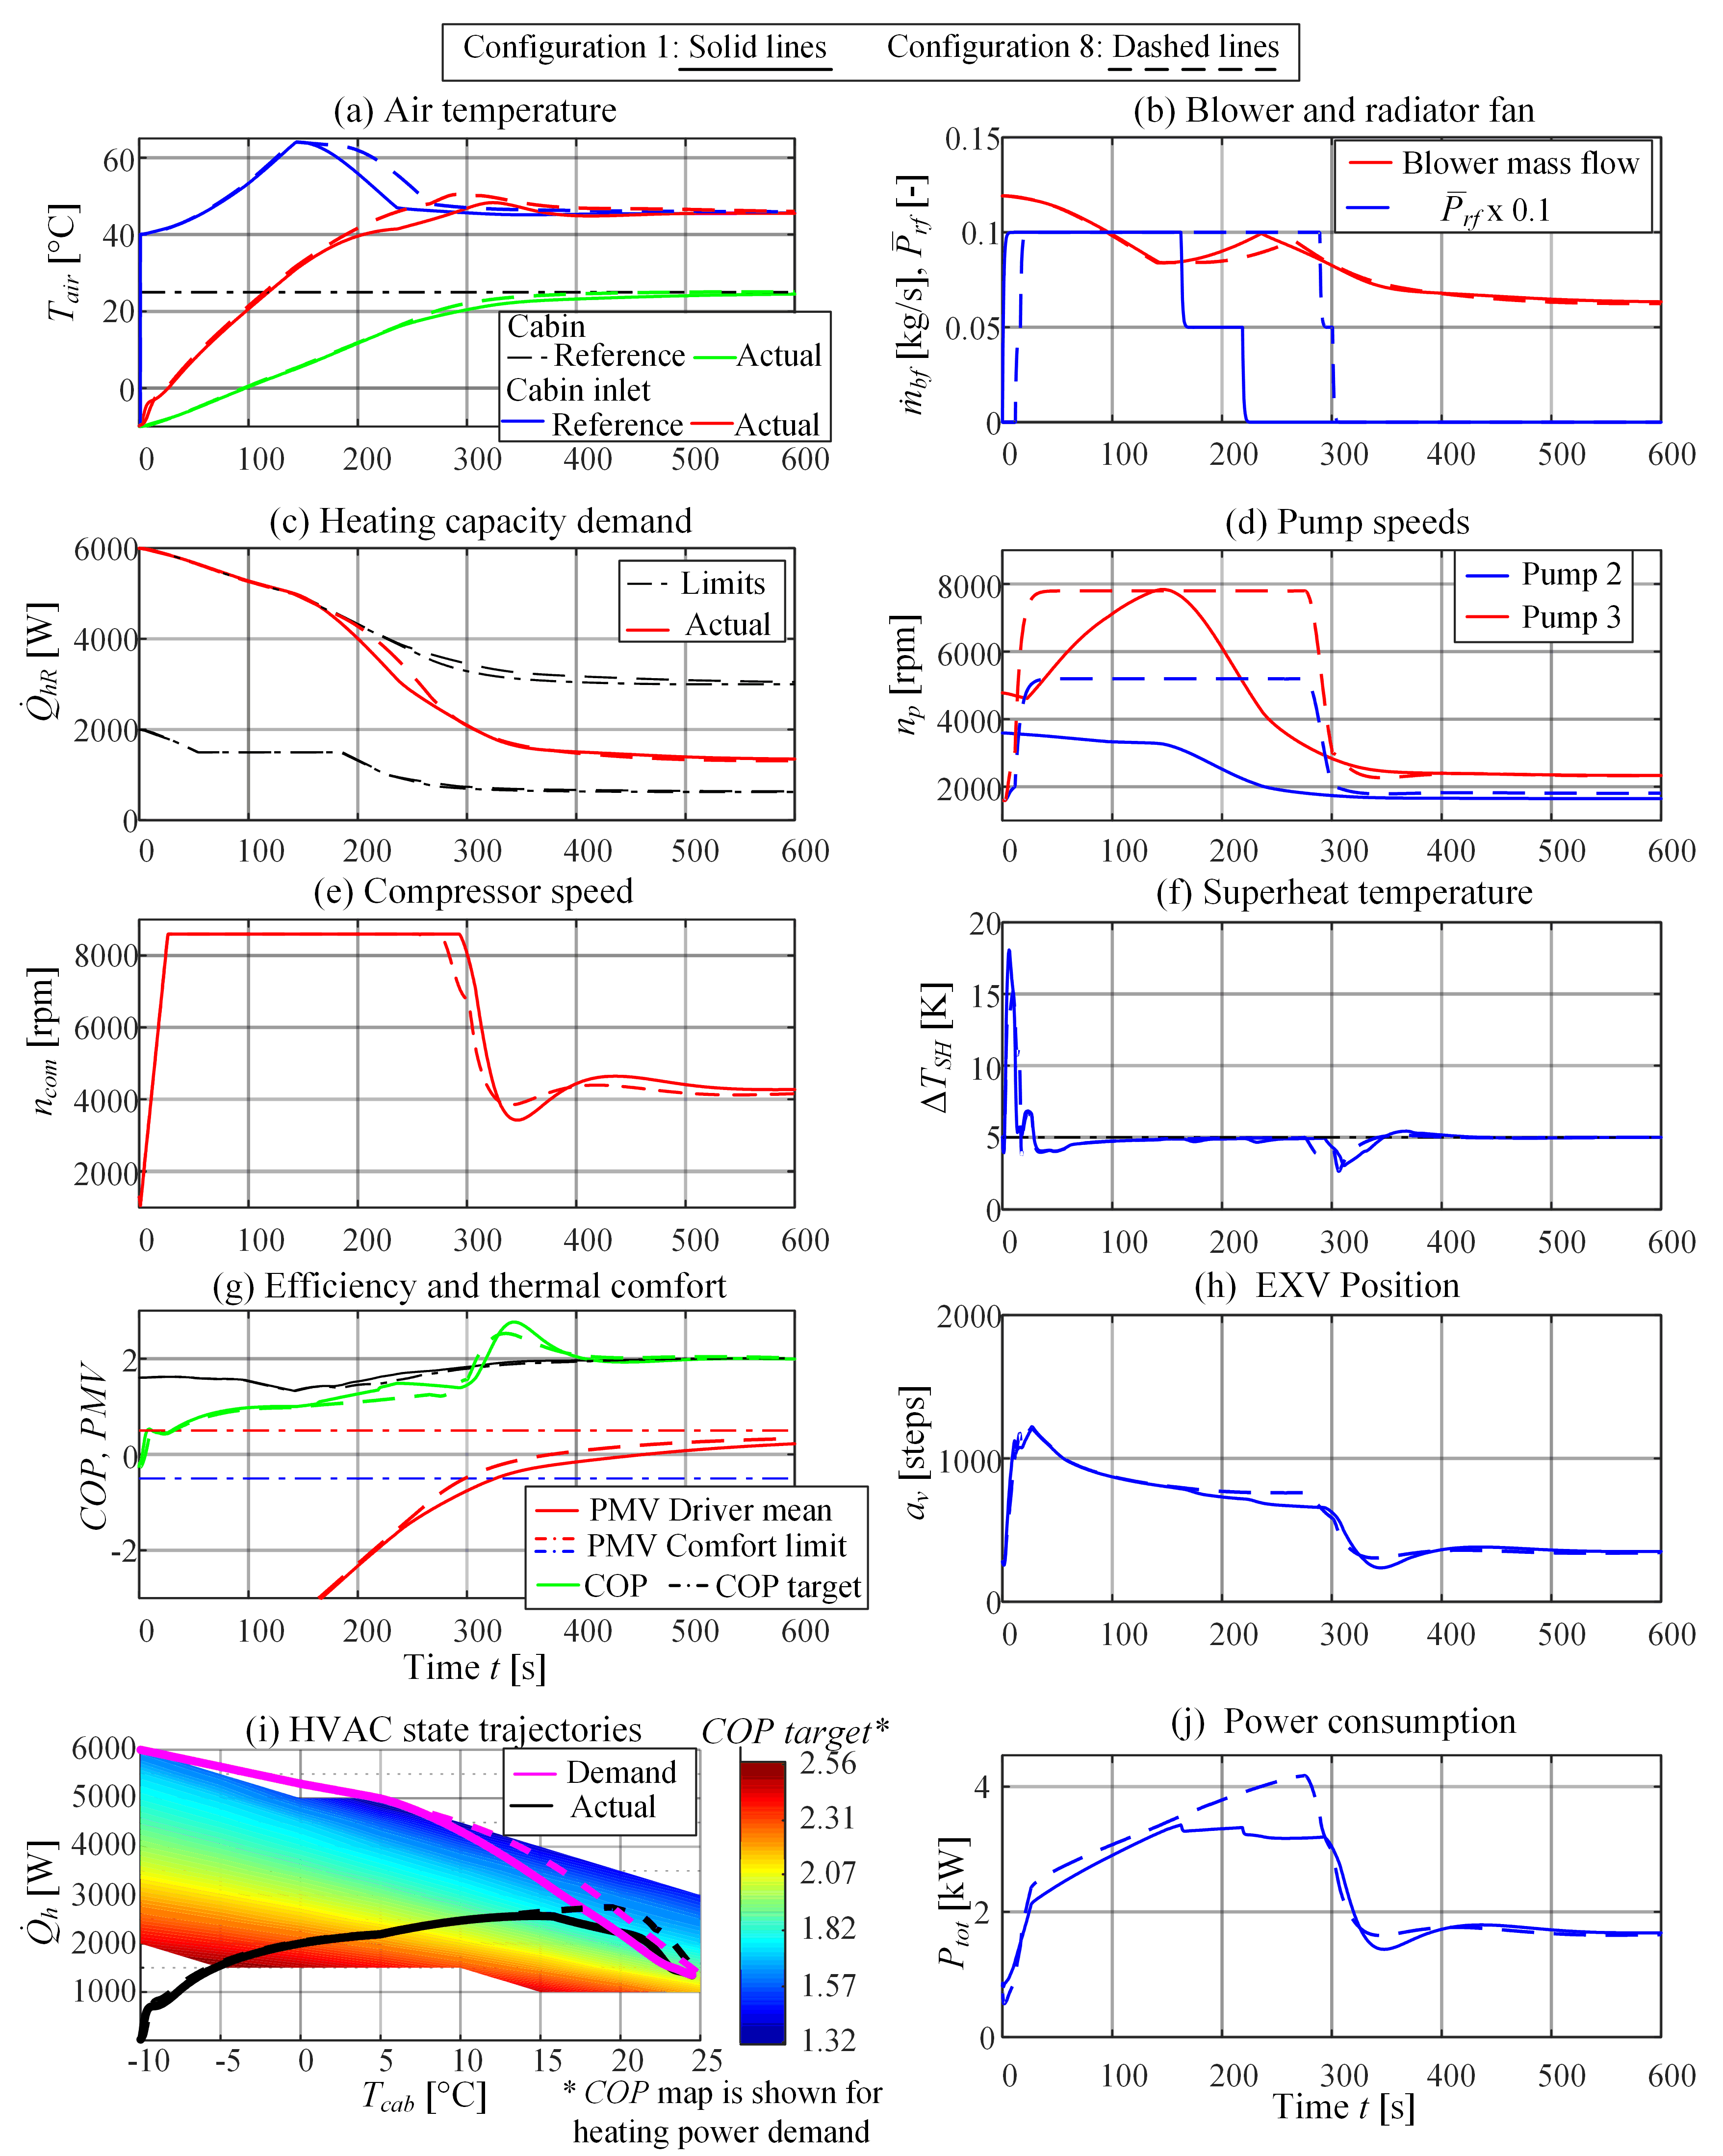
6. Control Strategy Verification

6.1. Control Strategy Implementation within Dymola

The overall Dymola simulation model is extended with the hierarchical control strategy shown in Figure 4. The cabin air temperature controller Gcab(s) is of proportional-integral (PI) type, it has constant parameters (no gain scheduling), and is extended with an anti-windup algorithm. The controller-demanded heating power limit is scheduled with respect to cabin air temperature. The optimised control input allocation maps are implemented in the form of analytical expressions, as described in Section 5. Both types of analytical expressions, the first one based on inputs hR and Tcab and the second one mostly relying solely on input ncom (see Figure 10), have been tested in simulations.
The cabin air inlet temperature and the superheat temperature are also controlled by PI controllers, which are given in a modified form with the P action moved into the feedback path. Both controllers are extended with gain-scheduling maps and the anti-windup algorithm. The gain-scheduling maps have been designed based on controller parameter optimisation method described in [21] and they involve the heating power demand hR and cabin temperature Tcab as inputs.

6.2. Simulation Results

Simulation verification of the designed HVAC control strategy has been carried out for the heat-up scenario. In this scenario, the cabin and HVAC system are initialized with ambient conditions (Tamb = −10 °C, RHamb = 60%), and the goal is to reach the cabin air temperature setpoint Tcab,R = 25 °C in less than 10 min. The vehicle velocity is set to 60 km/h and no solar load is set. It is assumed that two passengers occupy the vehicle with the total metabolic thermal load of 150 W.
In order to investigate the impact of different control strategy settings on the HVAC system performance, eight control configurations (Table 3) have been analysed and compared. The distinct configurations relate to the aforementioned types of allocation map approximations and different values of the cabin temperature controller bandwidth (changed by adjusting the controller integral time constant). The considered HVAC control performance metrics (Table 3) include:
  • Energy consumed (Eel) during the heat-up scenario, which is inversely related to the efficiency.
  • Time needed to reach the cabin inlet temperature of 40 °C (tin,40), which is related to the impact of control strategy on HVAC transient performance.
  • Time needed to reach the cabin temperature of 22°C (tcab,22), which is related to the impact of strategy on cabin temperature transient performance.
  • Two thermal comfort indices: (i) time to reach the comfortable range defined by |PMV| < 0.5 (tPMV,05), and (ii) integral of absolute value of PMV in uncomfortable range C2 [min] = ∫|PMV|/60 dt, if |PMV| > 0.5 [21].
The results given in Table 3 indicate that performance differences between configurations are relatively small (up to 10%), but still relevant when considering energy saving potential. Opting for lower integral time constant (i.e., faster cabin air temperature controller) results in quicker transient and improved thermal comfort at the expense of increased energy consumption. Using the basic allocation map approximations concerning heating power demand input (Configurations 1 and 5) results in lower energy consumption but slower response when compared to the allocation approximations relying on compressor speed input (Configurations 4 and 8). This is because the compressor speed becomes swiftly saturated during the abrupt, heat-up transient due to high cabin inlet air temperature control error (i.e., high heating power demand) and the high-bandwidth low-level controller of cabin inlet air temperature. Consequently, the pump speeds and radiator fan air mass flow are increased more intensively for the allocation dependent on compressor speed, thus improving the heat exchange and achieving the setpoints faster. Furthermore, comparison of the results for Configurations 2 and 3 and Configurations 6 and 7 indicates that making the pump speeds dependent on the compressor speed is more influential with respect to obtaining faster heat-up response than when the radiator fan power level is made dependent on the compressor speed.
To summarise, opting for using the allocation with respect to heating power and the slow cabin air temperature controller (Configuration 1) results in the lowest energy consumption and the slowest response. In the opposite scenario of compressor speed input-based allocation and the fast superimposed controller (Configuration 8), the energy consumption soars by at most (7.3%), but the target HVAC outlet air temperature and the target cabin temperature are reached in minimum time when compared to Configuration 1 (by 16 s faster i.e., 8% reduction and by 36 s faster or 11% reduction, respectively).
Expectedly, the thermal comfort-related indices (tPMV,05 and C2 in Table 3) behave similarly to the cabin temperature transient response index tcab,22. Namely, the best thermal comfort is achieved by the fastest response configuration (Configuration 8).
The above findings are illustrated in Figure 12 by the comparative heat-up transient responses for Configuration 1 (solid lines) and Configuration 8 (dashed lines). The cabin air temperature (Figure 12a, green line) reaches 95% of its setpoint value of 25 °C, by approximately 2.2 min faster in Configuration 8 than in Configuration 1. Similarly, the cabin inlet air temperature (Figure 12a, red line) crosses its target value set by the allocation map (Figure 12a, blue) faster by 1/2 min when Configuration 8 is selected. For both configurations, the blower fan air mass flow (Figure 12b, red line) is high at the start of transient and it decreases as the heating power demand decreases (Figure 12c). The heating power demand is saturated at its upper limit until the cabin air temperature is increased to around 10 °C. The saturation is somewhat deeper in Configuration 8 due to higher superimposed controller bandwidth applied. When opting for Configuration 8 the pump speeds (Figure 12d) strongly respond to abrupt rise of compressor speed (Figure 12e) and they eventually become comparable to those of Configuration 1 in the response settling period. Similarly, in Configuration 8 the radiator fan is turned on to full power for longer time compared to Configuration 1 (blue lines in Figure 12b). This all improves the heat exchange during the transient process and results in the fast target temperature achievement for Configuration 8, which is in turn paid for by higher energy consumption (Table 3). The highest difference in energy/power consumption between the two configurations occurs during the last 100 s of the transient (Figure 12j), in which the saturated compressor speed results in prolonged radiator fan usage and higher pump speeds when Configuration 8 is used.
Since the system is initialized at ambient conditions, the starting COP is initially zero (no heat exchange). Significant difference between target COP and actual COP during the abrupt heat-up transient (Figure 12g) is due to the heating power and cabin inlet air temperature control errors caused by the HVAC system thermal inertia. This is clearly visible in Figure 12i, where the actual and commanded heating power trajectories are plotted in dependence of cabin temperature and COP. Once the system tends to reach steady-state conditions, the optimal COP of around 2 is achieved (see also Figure 12g). During the transient, the COP is lower for Configuration 8, which results in increased energy consumption. However, the thermal comfort is reached (|PMV| < 0.5) by about 30 s faster for Configuration 8 (red lines in Figure 12g).
The compressor speed (Figure 12e) is swiftly ramped up (due to rate limit implemented) to its maximum value and it remains saturated until the cabin inlet air temperature reference is reached. It then drops towards a steady-state value needed to maintain the cabin air inlet temperature at the value set by allocation map. Throughout the transient the superheat is well-regulated (Figure 12f), with a fast disturbance rejection at around 300 s coming from the steep compressor speed reduction.

7. Discussion

As noted in Section 3, the optimised HVAC control input allocation strategy is designed under the assumption of quasi-stationary operation or quick response of subordinate HVAC control loops. The former is satisfied under a great portion of real driving regimes, i.e., under the conditions of settled heat-up periods and small changes of reference cabin temperature, which justifies the main control system design hypothesis. The latter is not (fully) satisfied due to a large thermal inertia of the considered, multi-stage HVAC system (see e.g., the delay between actual and reference responses of cabin inlet air temperature in Figure 12a). This would generally result in sub-optimal system behaviour in abrupt transient modes (e.g., heat-up scenario). To verify the extent to which the proposed strategy results differ from the optimal behaviour in intense transient modes, the future work can concern using an off-line control trajectory optimisation method, such as the one based on dynamic programming [21].
Furthermore, the control input allocation approach falls in the category of instantaneous optimal control approaches. As such, it is not only incapable of accounting for the low-level system transients and corresponding controller limits, but it cannot benefit from prediction information either (e.g., that on ambient temperature or vehicle velocity). To this end, it is worth considering model predictive control in the future work, as an on-line optimisation method being capable of handling the process dynamics, constraints/limits, and predictive information.
The control input allocation results were presented for the fixed values of vehicle velocity vveh = 60 km/h and air temperature Ta = −10 °C. The method can, however, be readily applied to the case of input parameter space extended with the ‘disturbance’ inputs vveh and Ta, and by repeating the allocation optimisations all over the input space. Such a study has been preliminary conducted, and the results point out that the effects of varying ambient air temperature and vehicle velocity have a relatively minor influence on allocation maps. This influence can be accounted for by means of empirical corrections of individual maps, e.g., radiator fan power level correction with respect to vehicle velocity, and cabin inlet air temperature correction with respect to ambient temperature.
The allocation map optimisation was based on the single, most relevant criterion, which is the HVAC efficiency. The proposed method/tool can, tough, readily be applied to the case of multi-criteria optimisation. One of the possible candidates for another objective is some form of the thermal comfort index such as the PMV (discussed in Section 2). The optimisation would then set the trade-off between efficiency (COP) and comfort (PMV), i.e., it would result in multiple optimal solutions forming a Pareto frontier, from which the supervisory control system or driver can pick the optimal point depending on the current conditions and preferences.
Although the HVAC model used in optimisation has been carefully built up, parameterised and partly validated, the final confirmation of the model accuracy and correspondingly the control strategy performance should be obtained by means of on-vehicle tests. This is an on-going activity conducted both on dynamometers placed in climate chambers and also through on-road tests, whose results and recommendations are subject of future publications.
Some safety features, such as limiting the compressor outlet pressure p3 and the evaporator outlet pressure p1 (see Figure 2), as well as the compressor pressure ratio p3/p2, cannot rely solely on the model accuracy, i.e., they need to be satisfied explicitly. For this purpose, the overall control strategy should be extended with secondary feedback controllers of measurable variables that need to be limited (see e.g., [31]). There may be additional practical extensions of the proposed, overall control strategy, such as switching the compressor off when the cabin air temperature tends to overshoot the target temperature, which may typically occur for the conditions of relatively high ambient temperature, i.e., low thermal loads.

8. Conclusions

New HVAC system concepts targeted for application in battery electric vehicles (BEV) comprise multiple, redundant actuators and require optimal control input coordination for achieving highest efficiency and favourable driving range. A genetic algorithm-based method for obtaining optimal HVAC control input allocation maps has been proposed and applied to an advanced BEV HVAC system in the heat pump (and also A/C) operating mode. The optimal control input allocation maps have been approximated by analytical expressions describing the control inputs as functions of either heating power demand and cabin air conditions or compressor speed, and they have been implemented within a hierarchical cabin temperature comfort control strategy. Performance sensitivity analysis has shown minor performance loss when using the approximated allocation maps.
The control strategy has been verified by simulation results, presented for a heat-up scenario and eight different control setting configurations – two superimposed cabin temperature controller bandwidths and four types of allocation map approximations. The results point out that expressing the (pump speed and radiator fan power) allocation maps as functions of the compressor speed rather than the heating power demand and the cabin air temperature results in a faster transient and, consequently, improved thermal comfort, which is in turn paid for by higher energy consumption. Such trade-off between efficiency and thermal comfort can be further emphasized by tuning the cabin temperature controller, where a higher-bandwidth tuning contributes to the response speed, i.e., the thermal comfort.
The ongoing work includes considering infrared heating panel control inputs and applying multi-criteria control input allocation optimisation for favourable trade-off between the efficiency and comfort. Also, the optimisation method could be extended and re-parameterised for other HVAC operating modes, such as the heat pump mode with air reheat. In these modes, additional control inputs would be introduced, such as coolant-related proportional valves. Next, the hierarchical control strategy relying on HVAC control input allocation could be replaced by model predictive controller to account for transient effects, constraints and predictive information. Finally, the proposed control strategy will be implemented and verified on a test electric vehicle and compared with the results obtained on baseline/production vehicle equipped with a more conventional HVAC system.

Author Contributions

Conceptualization, J.D., I.C. and I.R.; methodology, I.C., I.R., and J.D.; software, I.R. and I.C.; writing—original draft preparation, I.C. and I.R.; writing—review and editing, J.D.; visualization, I.R. and I.C.; supervision, J.D. All authors have read and agreed to the published version of the manuscript.

Funding

The QUIET project has received funding from the European Union’s Horizon 2020 research and innovation programme under grant agreement No. 769826. The content of this publication is the sole responsibility of the QUIET consortium partners and does not necessarily represent the view of the European commission or its services.

Acknowledgments

It is gratefully acknowledged that the research work of the first author has been partly supported by the Croatian Science Foundation through the “Young researchers’ career development project-training of new doctoral students”.

Conflicts of Interest

The authors declare no conflict of interest.

Appendix A

Optimisation of the HVAC control input allocation maps has also been carried out in the case of A/C mode. The Dymola/Modelica HVAC model, shown in Figure 2 for the HP mode, has been modified according to schematic in Figure 1b, i.e., the coolant flow between different heat exchangers is changed to obtain A/C mode. The optimal control framework described in Section 3 is subject to the following modifications:
  • The air recirculation is set to 100% (see Section 2), where the cabin air is directly fed to the blower input. This means that the blower fan inlet air temperature and the relative humidity correspond to the cabin air conditions, i.e., Tin = Tcab and RHin = RHcab.
  • The COP calculation in the A/C mode accounts for both sensible heat and latent heat due to dehumidification effect.
  • The lower limit of cabin inlet air temperature is set to 5 °C, while the upper limit is equated with the cabin air temperature to prevent heating, i.e., 5 °C < Tcab,in,R < Tcab.
  • The control inputs are allocated with respect to three inputs: the cooling power demand cR, the cabin air temperature Tcab and the cabin relative humidity RHcab where the latter is relevant in the A/C mode due to the dehumidification effect (which has not been present in HP mode).
The optimised allocation maps are shown in Figure A1. They indicate that the increase of cabin relative humidity reduces the feasible operating range in the A/C mode (see COP plots in Figure A1e–g). Similarly to the HP mode, the COP decreases with cooling power demand increase and cabin air temperature decrease, and it also somewhat decreases with relative humidity decrease. The maximum COP is achieved at low cooling power demands and high cabin air temperature and humidity (closest to the ambient temperature and humidity).
Figure A1. Control allocation optimisation results for A/C mode.
Energies 13 05131 g0a1
Unlike in the HP mode, the optimal pump speeds (Figure A1a,b) are affected by the cabin humidity to a greater extent than by cabin air temperature. The magnitude of pump speeds increases with the cooling power demand and cabin humidity increase. This points out that the pump speeds should be expressed as functions of these two variables, while neglecting the minor influence of the cabin air temperature.
The optimal allocation maps for the blower fan air mass flow and the cabin inlet air temperature (Figure A1c,d) are affected by all three variables (cooling power demand, cabin air temperature and relative humidity). There are two distinct regions of these maps. In the first region, corresponding to lower cooling power demands, the cabin inlet air mass flow and temperature increase with cooling power demand and relative humidity. The second region is characterized by saturated blower fan air mass flow, which requires lower cabin inlet air temperatures to meet the rising cooling power demand. In this region, the growth of relative humidity causes the blower air mass flow to saturate at lower cooling power demand. This also reflects to the cabin inlet air temperature map, where lower cabin inlet air temperature is required for lower cabin relative humidity and the same cabin air temperature and cooling power demand. A piece-wise linear blower fan allocation can conveniently be applied, with breakpoints expressed in terms of cabin humidity and air temperature. The cabin inlet air temperature is the calculated based on inverted Equation (1).
The radiator fan power level (Figure A1h–j) increases with cooling power demand. The thresholds of power level are affected by cabin humidity, in terms of requiring higher radiator fan power for increased humidity. Similar switching algorithm can be applied to describe this control input as in the HP mode. However, the switching thresholds would be dependent on cabin humidity instead of on the cabin air temperature.
Finally, similarly as in the HP mode, the pump speeds and the radiator fan power level can alternatively be expressed as functions of compressor speed. The two set of analytical approximations have been validated by means of simulation, and the performance deterioration of up to 5% has been observed compared to the use of original, optimised allocation maps.

References

  1. Council of the European Union. Council Decision (EU) 2017/710 of 3 April 2017 on the position to be adopted, on behalf of the European Union, within the EEA Joint Committee concerning an amendment to Annex XX (Environment) to the EEA Agreement (CO2 Emissions). 2017. Available online: https://eur-lex.europa.eu/eli/dec/2017/710/oj (accessed on 23 June 2020).
  2. Yang, D.X.; Qiu, L.S.; Yan, J.J.; Chen, Z.Y.; Jiang, M. The government regulation and market behavior of the new energy automotive industry. J. Clean. Prod. 2019, 210, 1281–1288. [Google Scholar] [CrossRef]
  3. Park, M.H.; Kim, S.C. Heating performance characteristics of high-voltage PTC heater for an electric vehicle. Energies 2017, 10, 1494. [Google Scholar] [CrossRef] [Green Version]
  4. Pouladi, J.; Bannae Sharifian, M.B.; Soleymani, S. Determining charging load of PHEVs considering HVAC system and analyzing its probabilistic impacts on residential distribution network. Electr. Power Syst. Res. 2016, 141, 300–312. [Google Scholar] [CrossRef]
  5. Vatanparvar, K.; Al Faruque, M.A. Battery lifetime-aware automotive climate control for electric vehicles. In Proceedings of the. 2015 52nd ACM/EDAC/IEEE Design Automation Conference (DAC), San Francisco, CA, USA, 8–12 June 2015; pp. 1–6. [Google Scholar] [CrossRef]
  6. Zhang, T.; Gao, C.; Gao, Q.; Wang, G.; Liu, M.H.; Guo, Y.; Xiao, C.; Yan, Y.Y. Status and development of electric vehicle integrated thermal management from BTM to HVAC. Appl. Eng. 2015, 88, 398–409. [Google Scholar] [CrossRef]
  7. Paffumi, E.; Otura, M.; Centurelli, M.; Casellas, R.; Brenner, A.; Jahn, S. Energy consumption, driving range and cabin temperature performances at different ambient conditions in support to the design of a user-centric efficient electric vehicle: The QUIET Project. In Proceedings of the 14th SDEWES Conference, Dubrovnik, Croatia, 1–6 October 2019; p. 18. Available online: https://www.quiet-project.eu/wp-content/uploads/2020/07/JRC-DirC_Paffumi_et_al_final_SDEWES2019.pdf (accessed on 13 July 2020).
  8. Zhang, Z.; Wang, J.; Feng, X.; Chang, L.; Chen, Y.; Wang, X. The solutions to electric vehicle air conditioning systems: A review. Renew. Sustain. Energy Rev. 2018, 91, 443–463. [Google Scholar] [CrossRef]
  9. Feng, L.; Hrnjak, P. Performance characteristics of a mobile heat pump system at low ambient temperature. SAE Tech. Pap. 2018. [Google Scholar] [CrossRef]
  10. Peng, Q.; Du, Q. Progress in heat pump air conditioning systems for electric vehicles—A review. Energies 2016, 9, 240. [Google Scholar] [CrossRef] [Green Version]
  11. Qi, Z. Advances on air conditioning and heat pump system in electric vehicles—A review. Renew. Sustain. Energy Rev. 2014, 38, 754–764. [Google Scholar] [CrossRef]
  12. Okamoto, K.; Aikawa, H.; Ohmikawa, M.; Hayashi, K. Thermal management of a hybrid vehicle using a heat pump. SAE Tech. Pap. 2019. [Google Scholar] [CrossRef]
  13. Menken, J.C.; Strasser, K.; Anzenberger, T.; Rebinger, C. Evaluation of the energy consumption of a thermal management system of a plug-in hybrid electric vehicle using the example of the Audi Q7 e-tron. SAE Int. J. Passeng. Cars Mech. Syst. 2018, 11, 203–212. [Google Scholar] [CrossRef]
  14. Chowdhury, S.; Leitzel, L.; Zima, M.; Santacesaria, M.; Titov, G.; Lustbader, J.; Rugh, J.; Winkler, J.; Khawaja, A.; Govindarajalu, M. Total Thermal management of battery electric vehicles (BEVs). SAE Tech. Pap. 2018. [Google Scholar] [CrossRef] [Green Version]
  15. Nissan Motor Corporation. Heat-Pump Cabin Heater. Available online: https://www.nissan-global.com/EN/TECHNOLOGY/OVERVIEW/heat_pump_cabin_heater.html (accessed on 20 June 2020).
  16. Mancini, N.; Joseph, S.; Maxwell Mardall, J.S.; Kopitz, J.; Raymond, C.; O’Donnell, E.; Hanks, D.F.; Li, H. Optimal source electric vehicle heat pump with extreme temperature heating capability and efficient thermal. preconditioning. Patent No. US20190070924A1, 3 July 2019. Available online: https://patents.google.com/patent/US20190070924A1/ (accessed on 25 June 2020).
  17. Porsche, A.G. The Technology Behind the New Porsche Taycan. Available online: https://newsroom.porsche.com/dam/jcr:93483663-c12b-43ca-98f5-b1b8b845e321/PAG_Taycan_Technology_PM_EN.pdf.PDF (accessed on 20 June 2020).
  18. Drage, P.; Hinteregger, M.; Zotter, G.; Šimek, M. Cabin conditioning for electric vehicles. ATZ Worldw. 2019, 121, 44–49. [Google Scholar] [CrossRef]
  19. Bauml, T.; Dvorak, D.; Frohner, A.; Simic, D. Simulation and measurement of an energy efficient infrared radiation heating of a full electric vehicle. In Proceedings of the 2014 IEEE Vehicle Power and Propulsion Conference (VPPC), Coimbra, Portugal, 27–30 October 2014; pp. 1–6. [Google Scholar] [CrossRef]
  20. Khayyam, H.; Kouzani, A.Z.; Hu, E.J.; Nahavandi, S. Coordinated energy management of vehicle air conditioning system. Appl. Eng. 2011, 31, 750–764. [Google Scholar] [CrossRef]
  21. Cvok, I.; Škugor, B.; Deur, J. Control trajectory optimisation and optimal control of an electric vehicle HVAC system for favourable efficiency and thermal comfort. Optim. Eng. 2020. [Google Scholar] [CrossRef]
  22. Amini, M.R.; Wang, H.; Gong, X.; Liao-McPherson, D.; Kolmanovsky, I.; Sun, J. Cabin and battery thermal management of connected and automated hevs for improved energy efficiency using hierarchical model predictive control. IEEE Trans. Control. Syst. Technol. 2020, 28, 1711–1726. [Google Scholar] [CrossRef]
  23. De Nunzio, G.; Sciarretta, A.; Steiner, A.; Mladek, A. Thermal management optimization of a heat-pump-based HVAC system for cabin conditioning in electric vehicles. In Proceedings of the 2018 Thirteenth International Conference on Ecological Vehicles and Renewable Energies (EVER), Monte-Carlo, France, 4 October 2018; pp. 1–7. [Google Scholar] [CrossRef]
  24. Cvok, I.; Ratkovic, I.; Deur, J. Optimization of control parameters of vehicle air-conditioning system for maximum efficiency. SAE Tech. Pap. 2020. [Google Scholar] [CrossRef]
  25. Zhang, Q.; Meng, Y.; Greiner, C.; Soto, C.; Schwartz, W.; Jennings, M. Air conditioning system performance and vehicle fuel economy trade-offs for a hybrid electric vehicle. SAE Tech. Pap. 2017. [Google Scholar] [CrossRef]
  26. Dvorak, D.; Šimić, D. Model-based Design of an HVAC Control Strategy. In Proceedings of the 14th Conference on Sustainable Development of Energy, Water and Environment Systems (SDEWES), Dubrovnik, Croatia, 1–6 October 2019; Available online: https://www.quiet-project.eu/wp-content/uploads/2020/07/SDEWES2019_AIT_hvac-optimization.pdf (accessed on 13 July 2020).
  27. Basciotti, D.; Dvorak, D.; Gellai, I. A novel methodology for evaluating the impact of energy efficiency measures on the cabin thermal comfort of electric vehicles. Energies 2020, 13, 3872. [Google Scholar] [CrossRef]
  28. ASHRAE. ASHRAE Hanbook—Fundamentals; ASHRAE: Atlanta, GA, USA, 2017; ISBN 1939200598. [Google Scholar]
  29. Poles, S. MOGA-II an Improved Multi-Objective Genetic Algorithm; Technical Report; Esteco: Trieste, Italy, 2003. [Google Scholar]
  30. Esteco. Mode Frontier Software. Available online: https://www.esteco.com/modefrontier (accessed on 20 June 2020).
  31. Jeffs, J.; McGordon, A.; Picarelli, A.; Robinson, S.; Widanage, W.D. System level heat pump model for investigations into thermal management of electric vehicles at low temperatures. In Proceedings of the 13th International Modelica Conference, Regensburg, Germany, 4–6 March 2019; pp. 107–116. [Google Scholar] [CrossRef] [Green Version]
Figure 1. HVAC system schematic for heat pump (HP) mode (a) and air-conditioning (A/C) mode (b) [18].
Energies 13 05131 g001
Figure 2. HVAC system model for heat pump mode implemented within Dymola environment.
Energies 13 05131 g002
Figure 3. Principal block diagram of cabin thermal submodel.
Energies 13 05131 g003
Figure 4. Overall hierarchical HVAC control system structure.
Energies 13 05131 g004
Figure 5. Example of cabin air condition and heating power operating point grid used in optimisation of control input allocation maps for HP mode.
Energies 13 05131 g005
Figure 6. Optimisation framework implemented within ModeFrontier environment.
Energies 13 05131 g006
Figure 7. Illustration of GA optimisation convergence for operating point: Tcab = −5 °C and hR = 6 kW.
Energies 13 05131 g007
Figure 8. Control allocation optimisation results for HP operating mode.
Energies 13 05131 g008
Figure 9. Optimized control input allocations maps for HP mode, when expressed in dependence on compressor speed instead of heating power demand.
Energies 13 05131 g009
Figure 10. Comparison between HP mode-optimised control input allocation maps and corresponding analytical approximations outputs.
Energies 13 05131 g010
Figure 11. HP mode COP sensitivity analysis results when applying control input allocation map approximations as functions of: exclusively heating power demand and cabin air temperature (a), and solely compressor speed in the case of pump speeds and radiator fan power level (b).
Energies 13 05131 g011
Figure 12. Comparative simulation results for heat-up scenario and controller setting configurations 1 and 8 defined in Table 3.
Energies 13 05131 g012
Table 1. Optimisation constraints.
Control Input ConstraintsSetpoint Tracking Constraints
40 ° C T c a b , i n , R 65 ° C 1600   rpm n p 2 8000   rpm 1600   rpm n p 3 8000   rpm P ¯ r f { 0 ,   0 . 5 ,   1 } | Δ T S H , R Δ T S H | < 1 ° C | T c a b , i n , R T c a b , i n | < 1 ° C | Q ˙ h R m ˙ b f , m c p , a ( T c a b , i n T c a b ) | < 100 W
Table 2. Basic optimisation and simulation model setting parameters.
ParameterValue
Heating power demand gridhR ∈ {1:0.5:6} kW
Cabin air temperature gridTcab ∈ {−10:5:25} °C
Ambient conditionsTa = −10 °C, RHa = 60%, pa = 101.3 kPa
Vehicle velocityvveh = 60 km/h
Model execution time *8.2–10.3 s
GA iteration duration *9.57–12.8 s
Dassl solver tolerance0.0001
* Using PC with a four core Intel Xeon E5-1620, 3.50 GHz CPU.
Table 3. Control performance indices obtained by simulation results for heat-up scenario and various control strategy settings.
Conf.TI [s]Pump SpeedsRadiator FanEel [Wh]tin,40 [s],tcab,22 [s]tPMV,05 [s]C2 [min]
1240hR & TcabhR & Tcab385 (+0%)20533432617.07
(−0%)(−0%)(−0%)(−0%)
2240hR & Tcabncom390 (+1.1%)20432932116.99
(−0.5%)(−1.5%)(−1.4%)(−0.4%)
3240ncomhR & Tcab39519632631616.66
(+2.5%)(−4.4%)(−2.4%)(−3.1%)(−2.4%)
4240ncomncom39819532231216.59
(+3.4%)(−4.9%)(−3.3%)(−4.1%)(−2.8%)
5180hR & TcabhR & Tcab40019531131116.88
(+4.0%)(−4.9%)(−6.9%)(−4.6%)(−1.1%)
6180hR & Tcabncom40419530830816.83
(+5.0%)(−4.9%)(−7.8%)(−5.5%)(−1.4%)
7180ncomhR & Tcab41019030030016.51
(+6.5%)(−7.3%)(−9.9%)(−7.8%)(−3.3%)
8180ncomncom41418929829816.46
(+7.3%)(−7.8%)(−10.8%)(−8.4%)(−3.6%)

