Article

Reduction in the Fluctuating Load on Wind Turbines by Using a Combined Nacelle Acceleration Feedback and Lidar-Based Feedforward Control

Department of Civil Engineering, The University of Tokyo, Tokyo 113-8656, Japan
*
Author to whom correspondence should be addressed.
Energies 2020, 13(17), 4558; https://doi.org/10.3390/en13174558
Submission received: 7 July 2020 / Revised: 21 August 2020 / Accepted: 24 August 2020 / Published: 2 September 2020
(This article belongs to the Special Issue Control of Wind Turbines)

Abstract

:
An advanced pitch controller is proposed for the load mitigation of wind turbines. This study focuses on the nacelle acceleration feedback control and lidar-based feedforward control, and discusses how these controllers contribute to reduce the load on wind turbines. The nacelle acceleration feedback control increases the damping ratio of the first mode of wind turbines, but it also increases the fluctuation in the rotor speed and thrust force, which results in the optimum gain value. The lidar-based feedforward control reduces the fluctuation in the rotor speed and the thrust force by decreasing the fluctuating wind load on the rotor, which reduces the fluctuating load on the tower. The combination of the nacelle acceleration feedback control and the lidar-based feedforward control successfully reduces both the response of the tower first mode and the fluctuation in the rotor speed at the same time.

1. Introduction

Modern wind turbines with variable pitch and variable speed configuration need control systems of blade pitch angle and generator torques [1]. The objective of variable speed operation is to achieve the maximum efficiency in a low wind speed region, where the generator torque demand value is given as a function of the generator speed. In the region where wind speed is higher than rated wind speed, the pitch control is activated to maintain the constant power regardless of the wind speed. The pitch control is implemented by using proportional-integral (PI) controller based on the measured generator speed. Typical examples of these concepts are shown in the literature [2,3,4,5]. Jonkman et al. [2] implemented these torques and blade pitch controllers for the aeroelastic model, FAST (Fatigue, Aerodynamics, Structures, and Turbulence).
More advanced blade pitch control concepts have been proposed for wind speed higher than rated wind speed to reduce the fluctuating load on the blade and rotor [6,7,8], tower [9,10] and drivetrain [11,12]. The fluctuation in the load contains different frequencies depending on the cause of the load. The turbulence in the incoming wind causes fluctuation in the load at the same frequency of the turbulence, the resonance with the tower motion results in the fluctuation at the tower first modal frequency, and the rotor rotation causes fluctuation at rotor 1P or 3P frequencies etc. Several different approaches are taken to reduce the fluctuation in the load at different frequency ranges. Advanced pitch control is also used to stabilize the power output which is caused by the delay in the pitch actuator. Gao and Gao [13] developed novel proportional-integral-derivative-based pitch control techniques by synthesizing the optimization of PI parameter tuning, the estimation of unknown delay perturbations, and the compensation for removing effects from delay perturbations to actual outputs in wind turbine pitch control systems, and showed that the fluctuation in the power output can be reduced by using the developed controller. Kong et al. [14] proposed nonlinear economic model predictive control for variable speed wind turbines and showed that the proposed controller can reduce the fluctuation in the rotor speed and tower displacement significantly more so than the conventional nonlinear model predictive controller.
Fluctuating load at the tower first modal frequency can be mitigated by using additional feedback loops from the horizontal velocity of the nacelle on the pitch controller, so that the apparent damping ratio increases [15,16]. As mentioned by Jonkman [17], this strategy can increase the tower first modal damping ratio, but due to the pitch-to-feather nature of wind turbines, this control causes an increase in the exacerbated excursions in generator speed and electrical output. Moreover, this method can theoretically give any desired damping, but the limitation of the added damping by using this method has not been investigated. Fluctuating load at tower frequency can also be mitigated by using a passive, semi-active or active external damper. Murtagh et al. [18] proposed to use a tuned mass damper (TMD) for passive vibration control. Dinh and Basu [19] used multiple TMDs to mitigate the vibration of the tower and the nacelle. Fitzgerald et al. [20] used an active TMD to improve the reliability of onshore wind turbine towers.
Recently, the nacelle mounted lidar was used as an input to the controller for the mitigation of the load on the turbine [21,22,23,24,25,26,27,28,29,30,31,32,33,34], and a comprehensive review of this method is given by Scholbrock et al. [21]. Dunne et al. [23,24,25] implemented a feedforward controller for the mitigation of the rotor speed fluctuation in addition to the existing PI pitch controller. In this study, feedforward gain was obtained by linearizing the wind turbine system. They successfully reduced the rotor speed fluctuation as well as the fluctuating fore–aft tower base moment. However, there were no clear explanations for why the feedforward control can reduce the fluctuating tower base load significantly more so than the conventional PI pitch control method. Holger et al. [26] developed a feedforward controller for INNWIND.EU 10 MW wind turbines and optimized the lidar scanning method to show the reduction in fatigue load for low frequency. Schlipf et al. [27] implemented a model predictive controller by using nacelle-mounted lidar measurement and concluded that the extreme gust load during power production can be reduced by 50% and lifetime fatigue load by 30%. Ungurán et al. [28] proposed a fixed-structured H feedback–feedforward controller to reduce the fatigue load at the blade root and tower base. Selvam et al. [29] proposed an individual pitch control (IPC) that consists of an optimal multivariable linear-quadratic-Gaussian (LQG) controller and a feedforward disturbance rejection controller to reduce the fluctuating rotor moment. Verwaal et al. [30] implemented the lidar-based feedforward control and model predictive control in a scaled model wind turbine in a wind tunnel, demonstrating that the rotor speed fluctuation can be mitigated by both controllers significantly more so than the baseline controller. However, the literature lacks discussions regarding the load characteristic of the wind turbine when both the nacelle acceleration feedback control and the lidar-based feedforward control of the blade pitch angle are used simultaneously.
In this study, the control algorithm implemented by Yousefi et al. [5] is used as a baseline controller. A nacelle acceleration feedback control using the nacelle velocity is applied to the wind turbine. The effects and limitations of this algorithm on the rotor speed fluctuation and fore–aft tower base moment are investigated. A lidar-based feedforward control is then examined. The effects and mechanism of the feedforward control on both rotor speed fluctuation and the fluctuating component of wind turbine load are investigated. Finally, the load characteristics of the wind turbine for the case with both the nacelle acceleration feedback control and the lidar-based feedforward control are discussed.

2. The Wind Turbine Model and Controllers Used in this Study

The wind turbine model and turbulent wind condition are described in Section 2.1. The reference controller used in this study is discussed in Section 2.2. The nacelle acceleration feedback control and lidar-based feedforward control are explained in Section 2.3 and Section 2.4, respectively.

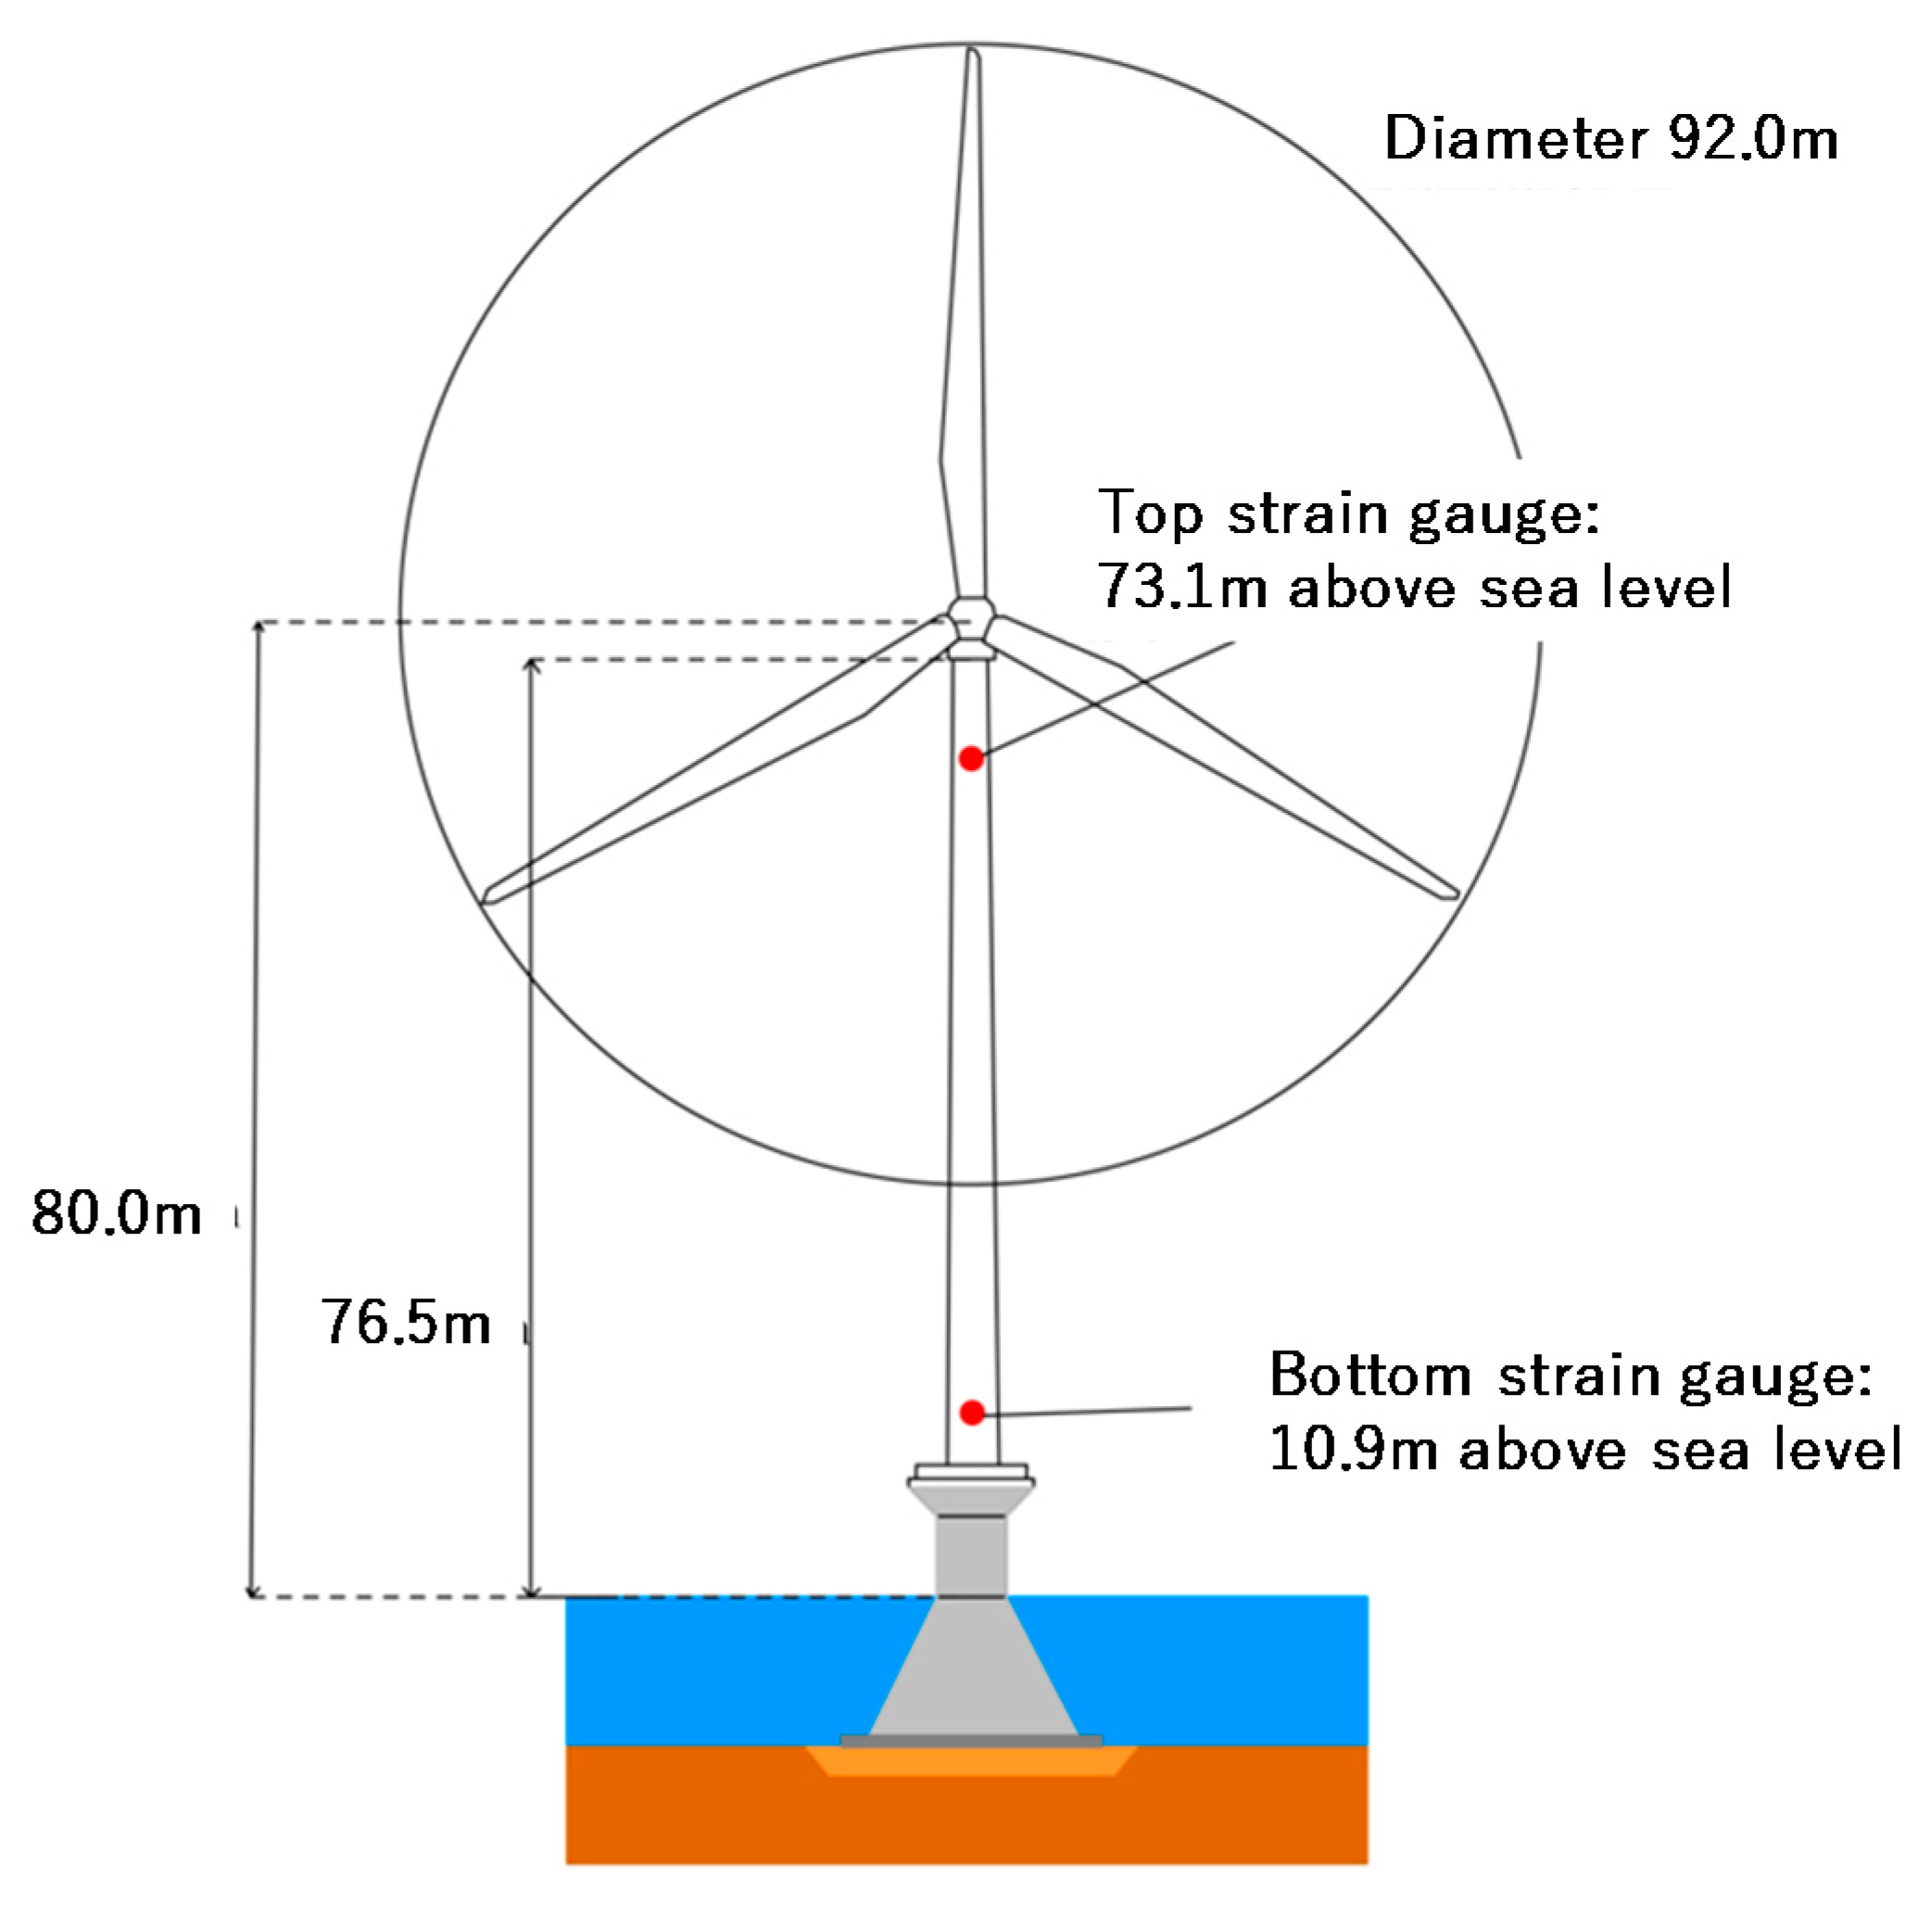
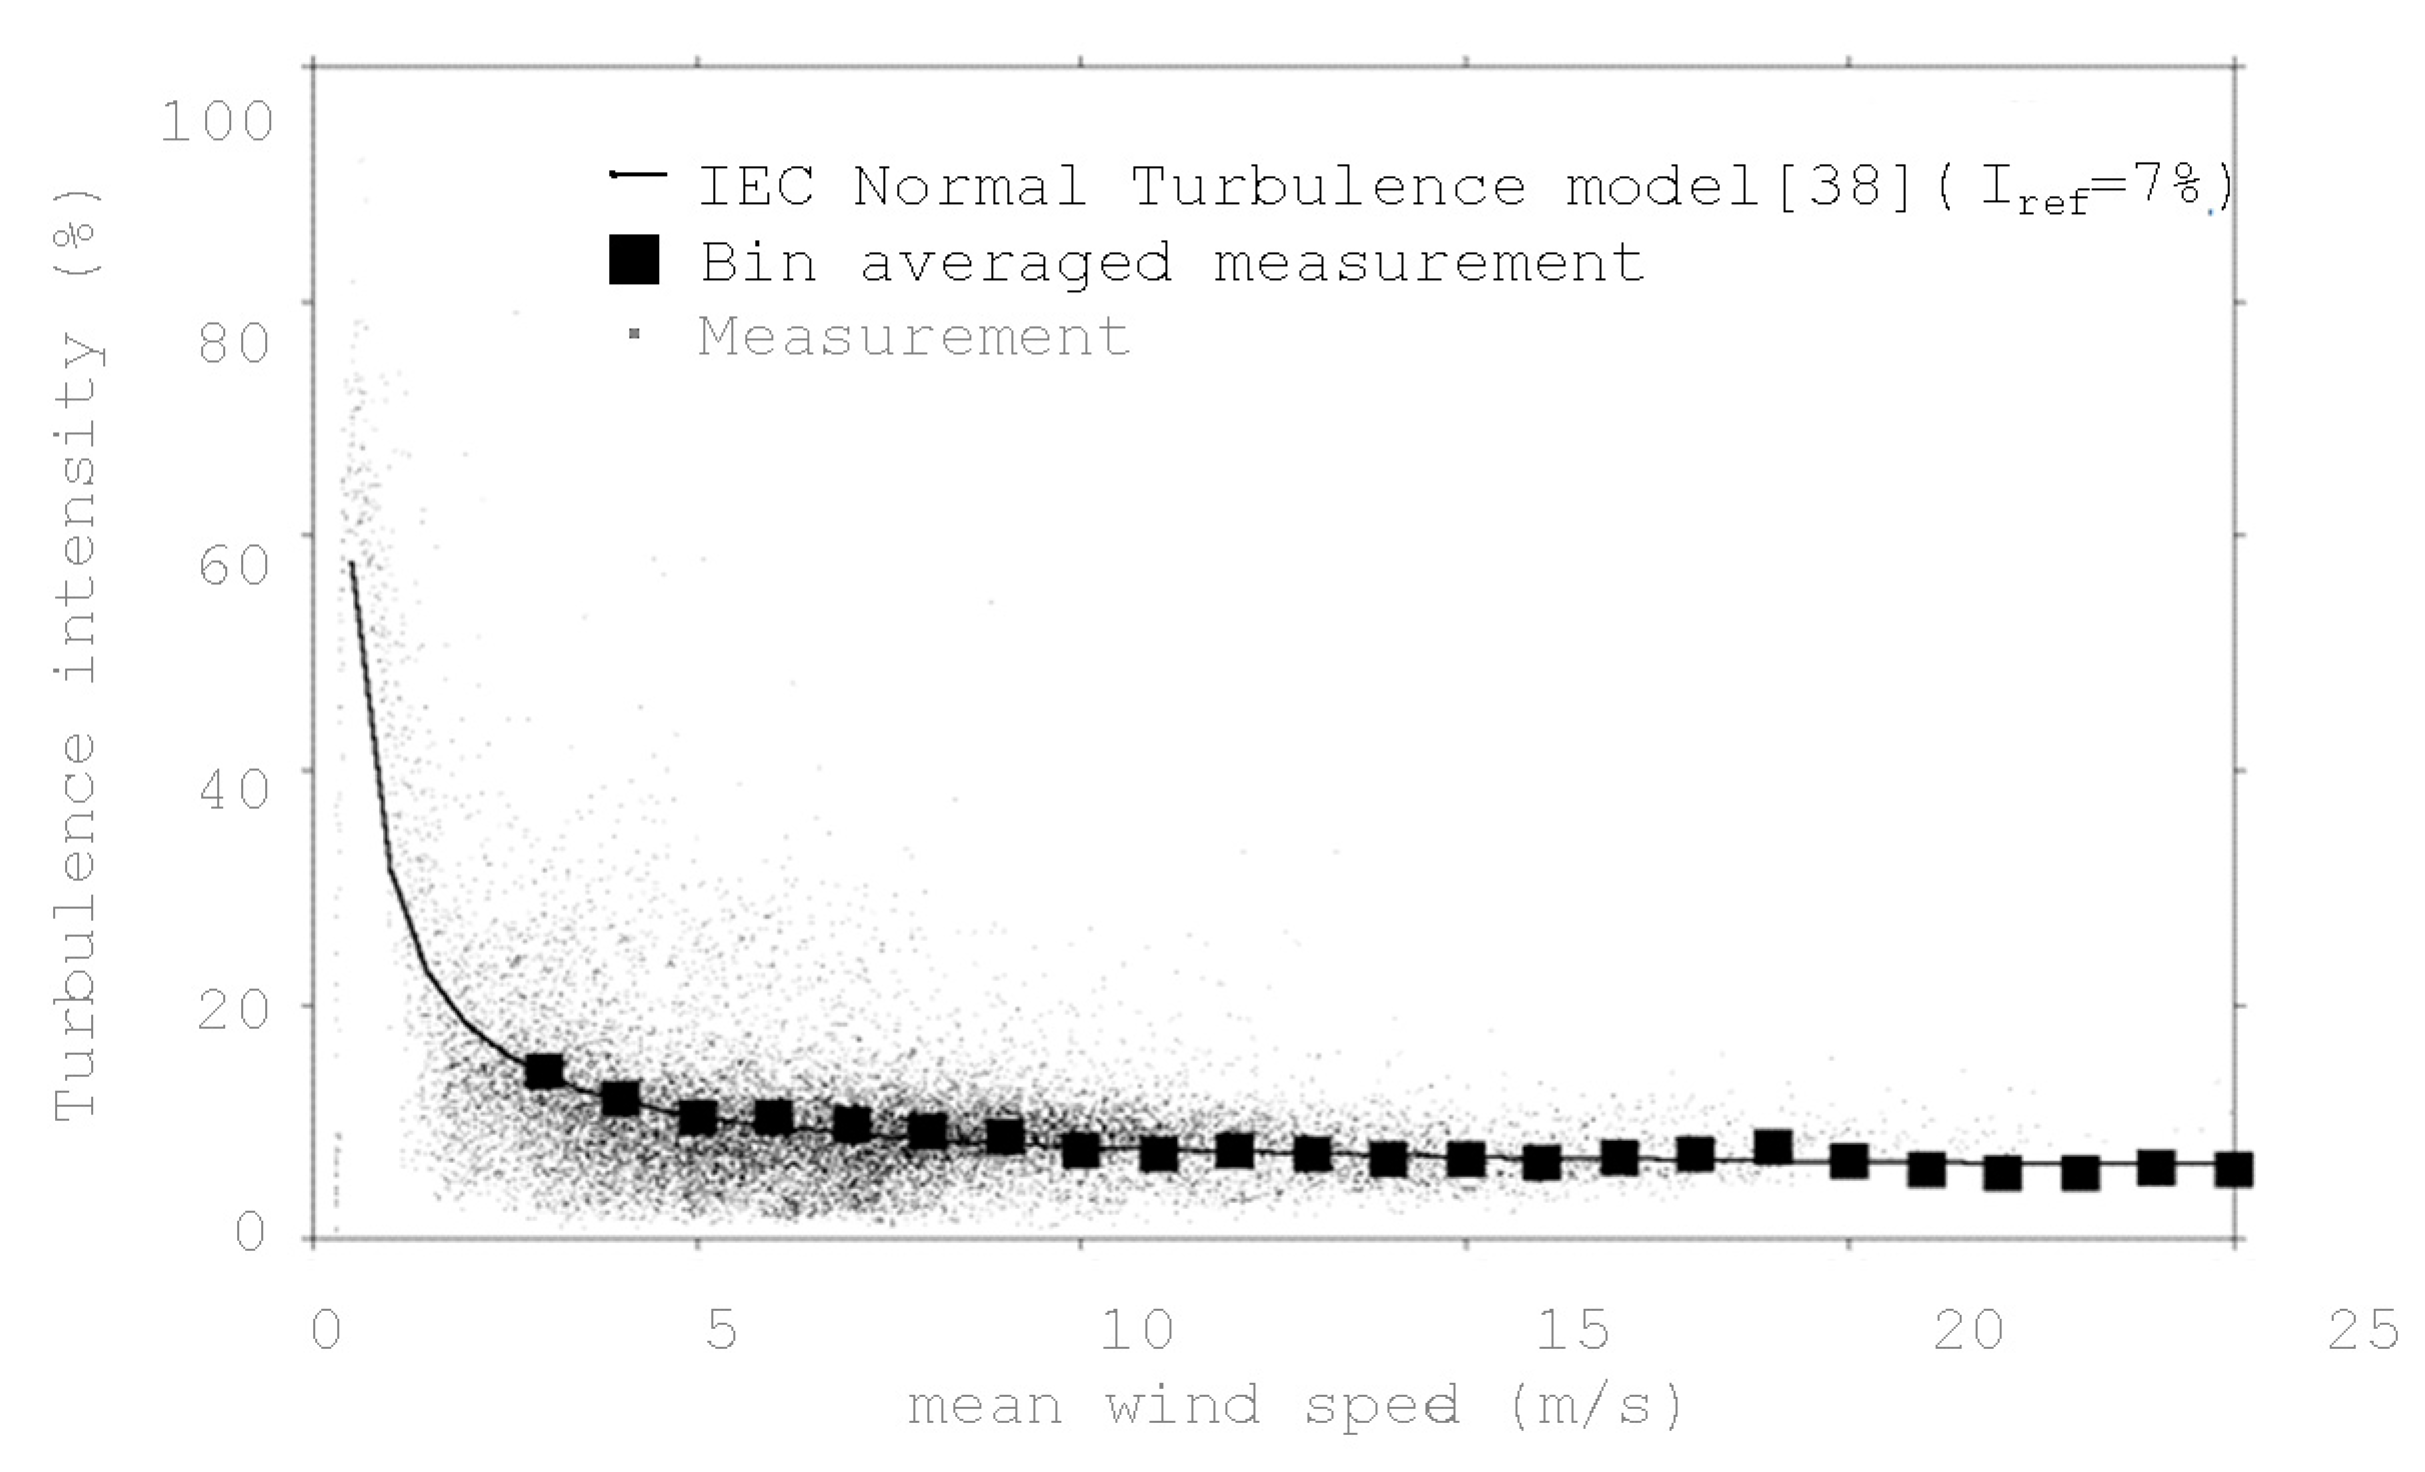
2.1. Wind Turbine Model and Turbulent Wind Condition

In this study, an offshore wind turbine with a rated capacity of 2.4 MW installed at Choshi Offshore test site is used, as shown in Figure 1. The specifications of the turbine are summarized in Table 1. The wind turbine is a horizontal axis, three-bladed, upwind, variable speed and variable pitch control turbine with a rotor diameter of 92 m and a hub height of 80 m. An aeroelastic model of this wind turbine, including the mass and other dynamic properties, is described in [35]. Aeroelastic simulations are carried out by using the dynamic simulation software FAST v8 [36]. The time step of the simulation and the communication intervals of the controller are both set to 0.002 s. A turbulent wind field is generated by using Turbsim software [37]. Turbulence intensity is defined as a function of the mean wind speed based on the 50 percentile of the normal turbulence model (NTM) defined in IEC61400-1 [38], and the value of I r e f is set to 7% based on the measurement [35], as shown in Figure 2. The sampling rate of the cup anemometer is 0.25 Hz. Two representative wind speeds of 14 m/s and 22 m/s, representing low and high wind speeds in region 3, are used in the discussion in this study. The turbulence statistics are based on the Kaimal turbulence model specified in IEC61400-1 [38].

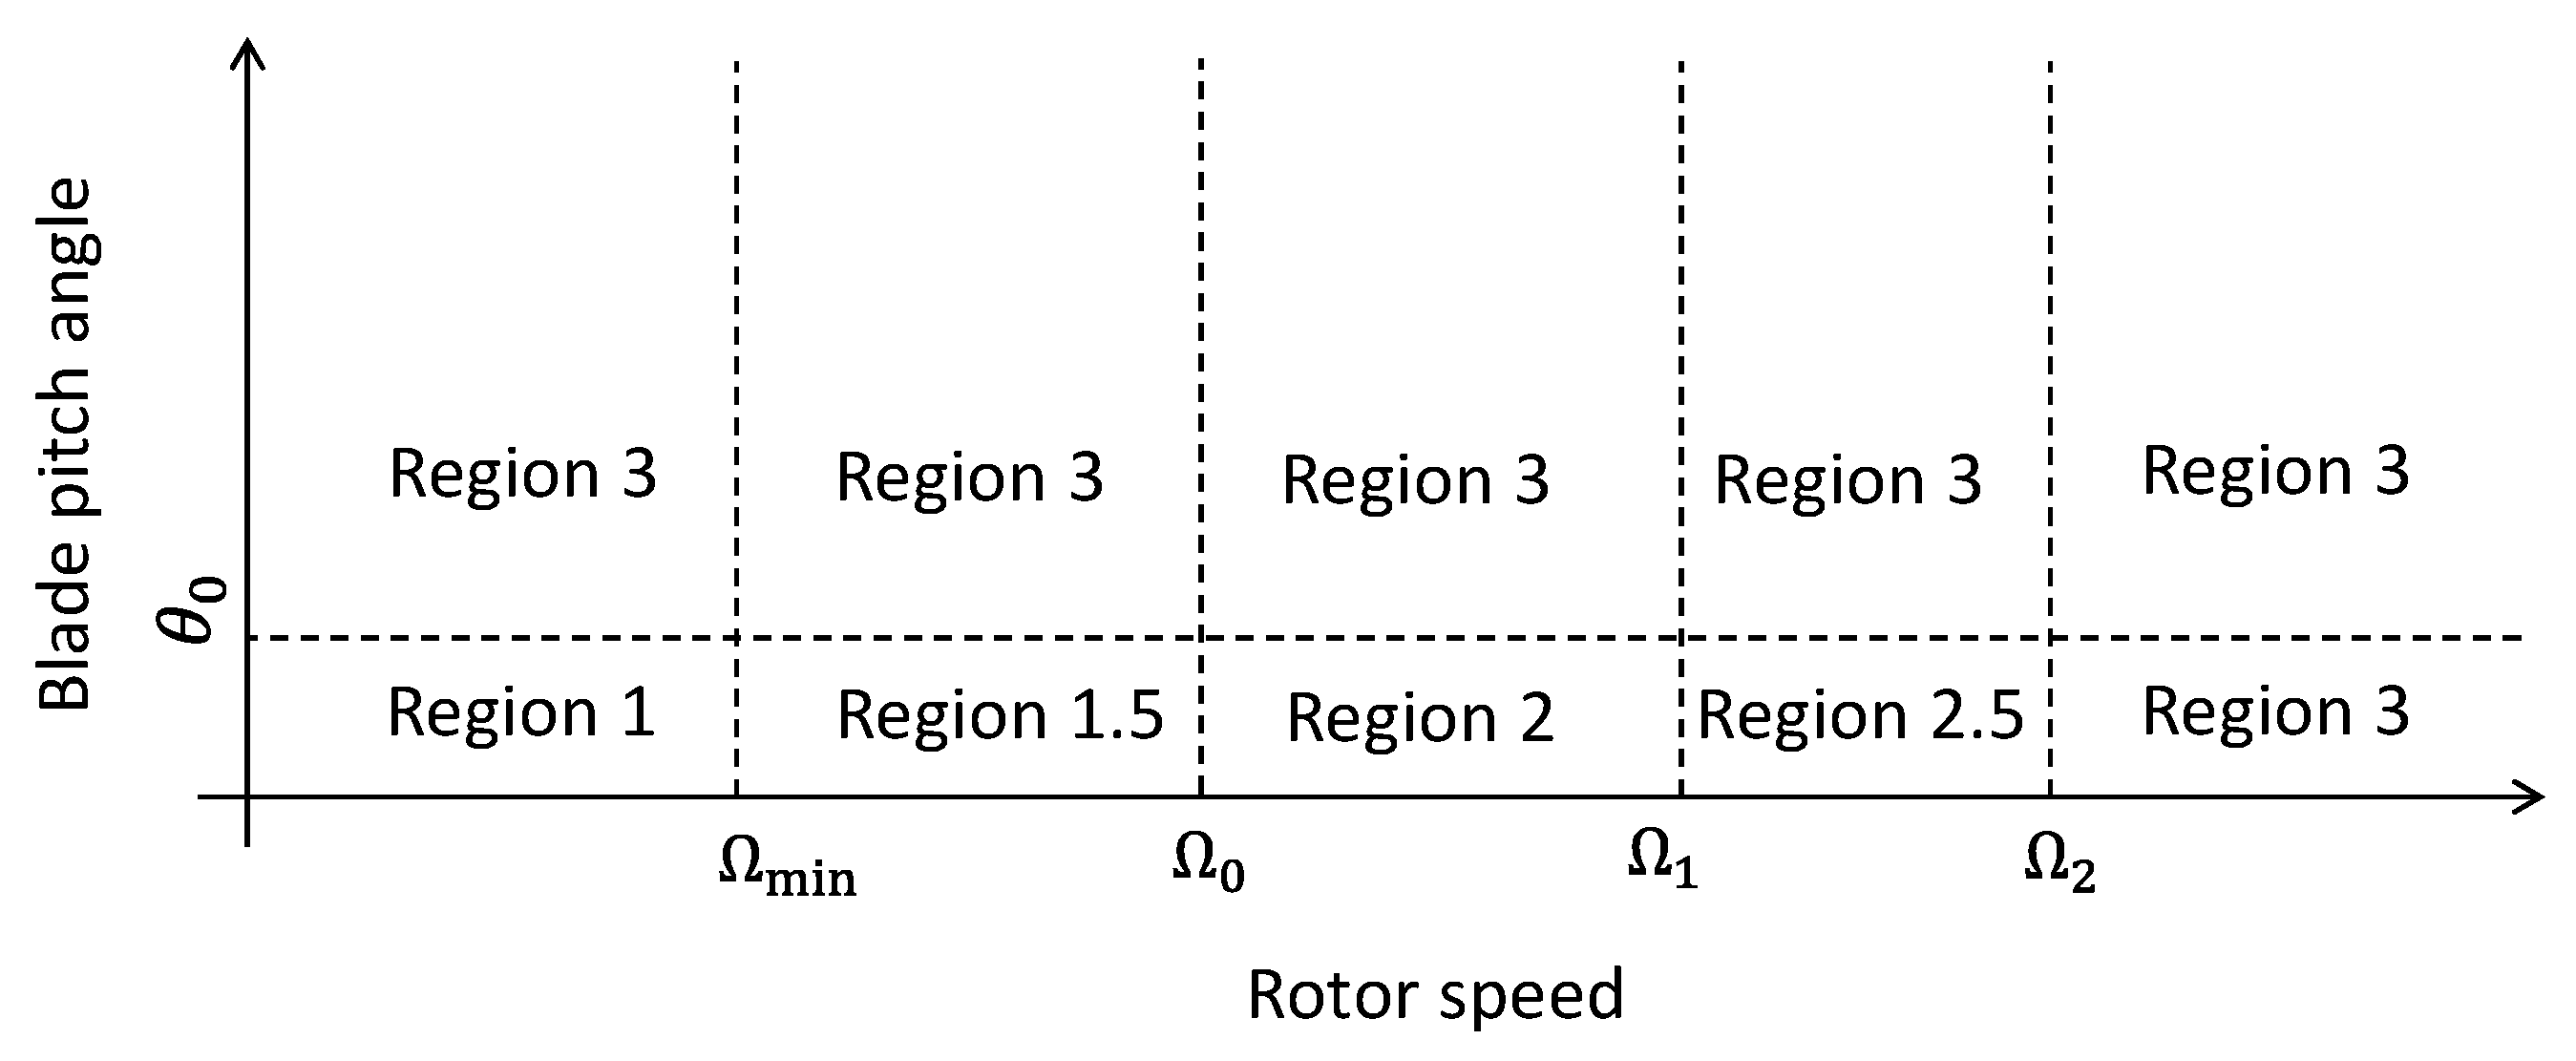
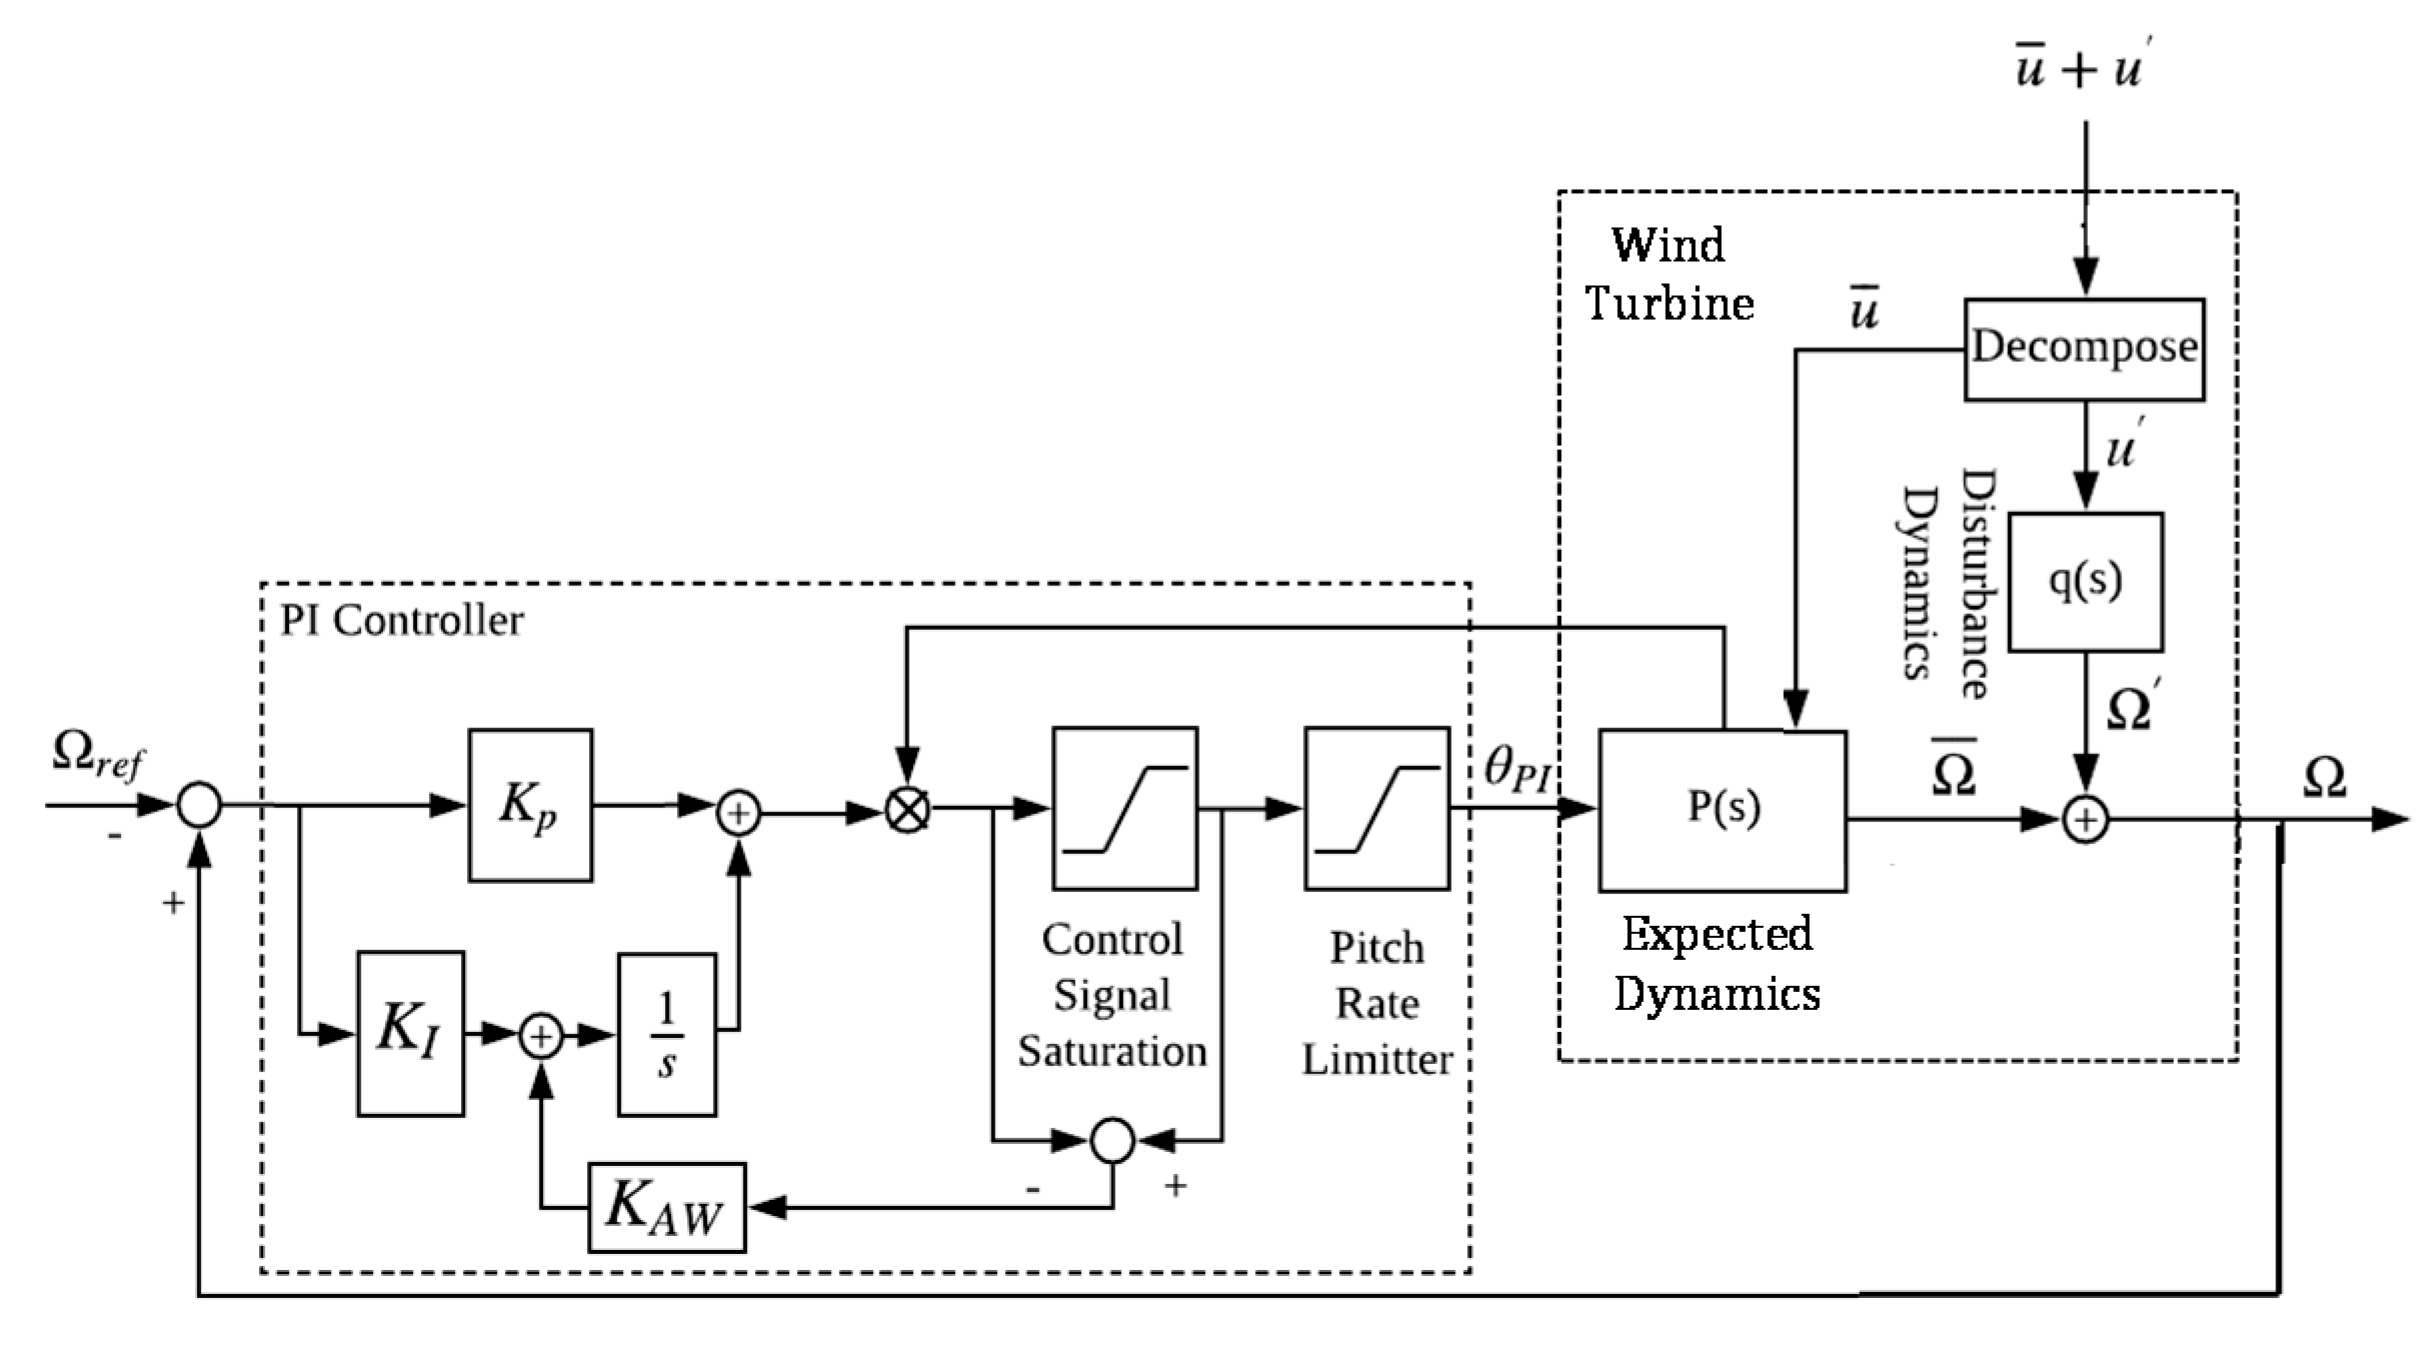
2.2. Baseline Controller

A control logic proposed by Yousefi et al. [5] is used as the baseline controller. This controller is based on the controller implemented by Jonkman et al. [2] with several improvements, in which the wind turbine control is divided into three main control regions as shown in Figure 3. In region 1, the wind turbine operates at a minimum rotor speed Ω m i n . When the rotor speed reaches Ω 0 , the wind turbine operates at its maximum efficiency (region 2) and operates at a constant power in region 3. In regions 1 and 2, the blade pitch angle is fixed to 0 degrees and the blade pitch control is activated in region 3. To smoothly connect the regions to each other, regions 1.5 and 2.5 are defined. The operations in region 1 and 1.5 are only limited to the low wind speed range and are not particularly important for the load calculation of the wind turbine. In this study, the regions 2, 2.5 and 3 are discussed. The controller determines the region as a function of blade pitch angle and generator speed, as shown in Figure 3. It is noted that regardless of the generator speed, if the pitch angle is larger than Θ 0 , then the control region is region 3, as the pitch control needs to be activated. In the baseline controller, Θ 0 is set to 1 degree.
The control logic is based on the measured generator speed, filtered with a recursive, a single pole, and a low pass filter with exponential smoothing, as shown in Equation (1).
ω [ n ] = ( 1 α ) ω mes [ n ] + α ω [ n 1 ]
α = e 2 π Δ t f c
where ω m e s is the measured generator speed, ω is the filtered generator speed, α is the low pass filter coefficient, n is the discrete time step counter, Δ t is the discrete time step and f c is the corner frequency. Jonkman et al. [2] suggest to set the corner frequency to be one quarter of the blade’s first edgewise natural frequency. In this study, the edgewise blade frequency of the wind turbine f c is 1.454 Hz.
In this controller, the generator torque is given as a function of generator speed. In region 2, the control target is to achieve the maximum efficiency of the wind turbine, which means that the wind turbine needs to be operated at the tip speed ratio of λ o p t specified to the rotor design. To achieve this, the generator torque Q R 2 is controlled as a function of the rotor speed, as shown in Equations (3) and (4).
Q R 2 = k opt Ω f 2
k opt = π ρ R 5 C p opt 2 r 3 λ opt 3 η M
where ρ is the air density, R is the rotor diameter, C p o p t is the optimum power coefficient, r is the gearbox ratio, λ o p t is the optimum tip speed ratio, and η M is the gearbox efficiency and is set to 0.96. The torque in region 3 is set to maintain the constant power as
Q R 3 = P r Ω f
where P r is the rated power and Ω f is the filtered measured rotor speed. The generator torques in region 2 as shown in Equation (3) and region 3 as shown in Equation (5) are not continuous and, thus, require a transient zone between region 2 and 3 called region 2.5. In region 2.5, a steep change in the generator torque is needed, and this can be achieved by using the feature of the induction generator as shown in Equation (6).
Q R 2.5 = k s ( Ω f Ω sync )
where Ω sync is the synchronous speed of the induction generator and is calculated as
Ω sync = Ω r 1 + 0.1 S g
where S g is the slip of the induction generator and is set to 5% in this study. The gradient k s can be calculated by using Equations (5) and (6).
k s = P r / Ω r Ω r Ω sync
In this study, Ω 2 is set to Ω r and Ω 1 is easily derived from Equations (3) and (6).
Ω 1 = k s k s ( k s 4 k opt Ω sync ) 2 k opt
Yousefi et al. [5] suggested using fuzzy weight to smoothly connect the torque demand at the boundary of the regions, i.e., Equation (10) is used to compute the generator torque demand Q for all the regions.
Q = W 2 Q R 2 + W 2.5 Q R 2.5 + W 3 Q R 3 W 2 + W 2.5 + W 3
where Q R 2 , Q R 2.5 and Q R 3 are the torque demand for regions 2, 2.5 and 3, respectively, and are defined in Equations (3), (5) and (6) in the baseline controller. W 2 , W 2.5 and W 3 are the fuzzy weights based on both rotational speed and pitch angle as defined in Equations (11)–(13),
W 2 ( Ω f , θ ) = { 1 θ < Θ 0 and Ω f Ω 1 F Ω 1 , Θ 0 ( Ω f , θ ) θ Θ 0 or Ω f > Ω 1
W 2.5 ( Ω f , θ ) = { F Ω 1 , Θ 0 ( Ω f , θ ) θ < Θ 0 and Ω f Ω 1 1 θ < Θ 0 and Ω 1 < Ω f < Ω 2 F Ω 2 , Θ 0 ( Ω f , θ ) θ Θ 0 or Ω f Ω 2
W 3 ( Ω f , θ ) = { F Ω 2 , Θ 0 ( Ω f , θ ) θ < Θ 0 and Ω f < Ω 2 1 θ Θ 0 or Ω f Ω 2
where F Ω , Θ ( Ω f , θ ) is a fuzzy function defined as follows:
F Ω , Θ ( Ω f , θ ) = exp ( ( ( Ω f Ω ) 2 2 σ ω 2 + ( θ Θ ) 2 2 σ θ 2 ) )
where σ ω and σ θ are the parameters of the Gaussian fuzzy weight functions, and, in this study, σ ω = 2.5 rpm and σ θ = 3 deg . , respectively.
The blade pitch angle demand is completely different in region 2 and region 3. In region 2, the pitch controller is not activated, i.e., the pitch angle is set to zero in region 2 as
θ R 2 = 0
In regions 2.5 and 3, the wind turbine operates at a constant power by using the pitch control. The blade pitch angle command θ is given using PI control, as shown in Equation (16).
θ R 3 = κ ( K P e ( t ) + K I u I ( t ) )
where K p is the proportional gain and K I is the integral gain. These gain values are based on the research by Yoshida [4].
K P = T S I ω c r δ ( 1 + T A 2 ω c 2 ) ( γ 2 + J 2 ω c 2 ) 1 + T S I 2 ω c 2
K I = K P T S I
where
T S I = tan ( Φ D Φ M ) ω c
and
γ = Q
δ = Q θ
Φ M = tan 1 ( γ + J T A ω c 2 ( γ T A J ) ω c ) π .
where J is the inertia moment around the rotor axis, T A is the pitch actuator time constant, ω c is the selectable gain cross frequency of speed control, Φ M is the system phase margin, Φ D is the design phase margin and T S I is the integral time constant. In this study, T A is set to 0.3, ω c is set to 0.3 times the first modal angular frequency of the wind turbine tower and Φ D is set to 50 degrees in accordance with the work of Yoshida [4]. In addition, the gain scheduling function is used for pitch control [4].
κ = min ( 1 ( 1 ξ ) + ξ κ o u t , 1 )
ξ = θ θ D e s θ o u t θ D e s
θ D e s = θ m i n + ( θ m a x θ m i n ) × 0.05
where θ D e s is the pitch angle design point; θ o u t is the pitch angle at the cutout wind speed and is set to 90 degrees; θ m i n and θ m a x are the minimum and maximum pitch angles and are 0 and 90 degrees, respectively; and κ o u t is the cut-out multiplicative gain and is set to 1/3.
In the controller by Jonkman [2], the output of the integrator is saturated. This is to limit the output of the integrator, even in the case where the steady state output of the system is different from the reference speed. However, this may cause the controller to over speed. To effectively solve this issue, the input of the integrator must be changed when the controller is saturated. Yousefi [5] proposed the use of an integral anti-windup technique of back calculation and tracking, as shown in Figure 4. The pitch demand value from the PI controller ( θ ) results in the rotor speed ( Ω ) under constant wind speed u ¯ . This dynamics is calculated through the aerodynamic simulation of the rotor and is written as P ( s ) . The linearized form of P ( s ) is shown in Equation (40). The fluctuation in the wind speed u ( = Δ u ) causes fluctuation in the rotor speed Ω ( = Δ Ω ). This mechanism is expressed as a disturbance dynamic q ( s ) , which is also calculated through the aerodynamic simulation of the rotor, and the linearized form is shown in Equation (39). This fluctuation in the rotor speed is not compensated in the baseline controller or nacelle acceleration feedback controller as discussed in Section 2.3. The mitigation of this rotor speed fluctuation is conducted in the lidar-based feedforward controller and is explained in Section 2.4. It should be noted that if K A W is too small, the anti-windup will not be sufficiently effective. On the other hand, if K A W is too large, it may once again cause fluctuations in the integrator. A trial and error technique is suggested to choose this value. In this study, K A W is set to 10.

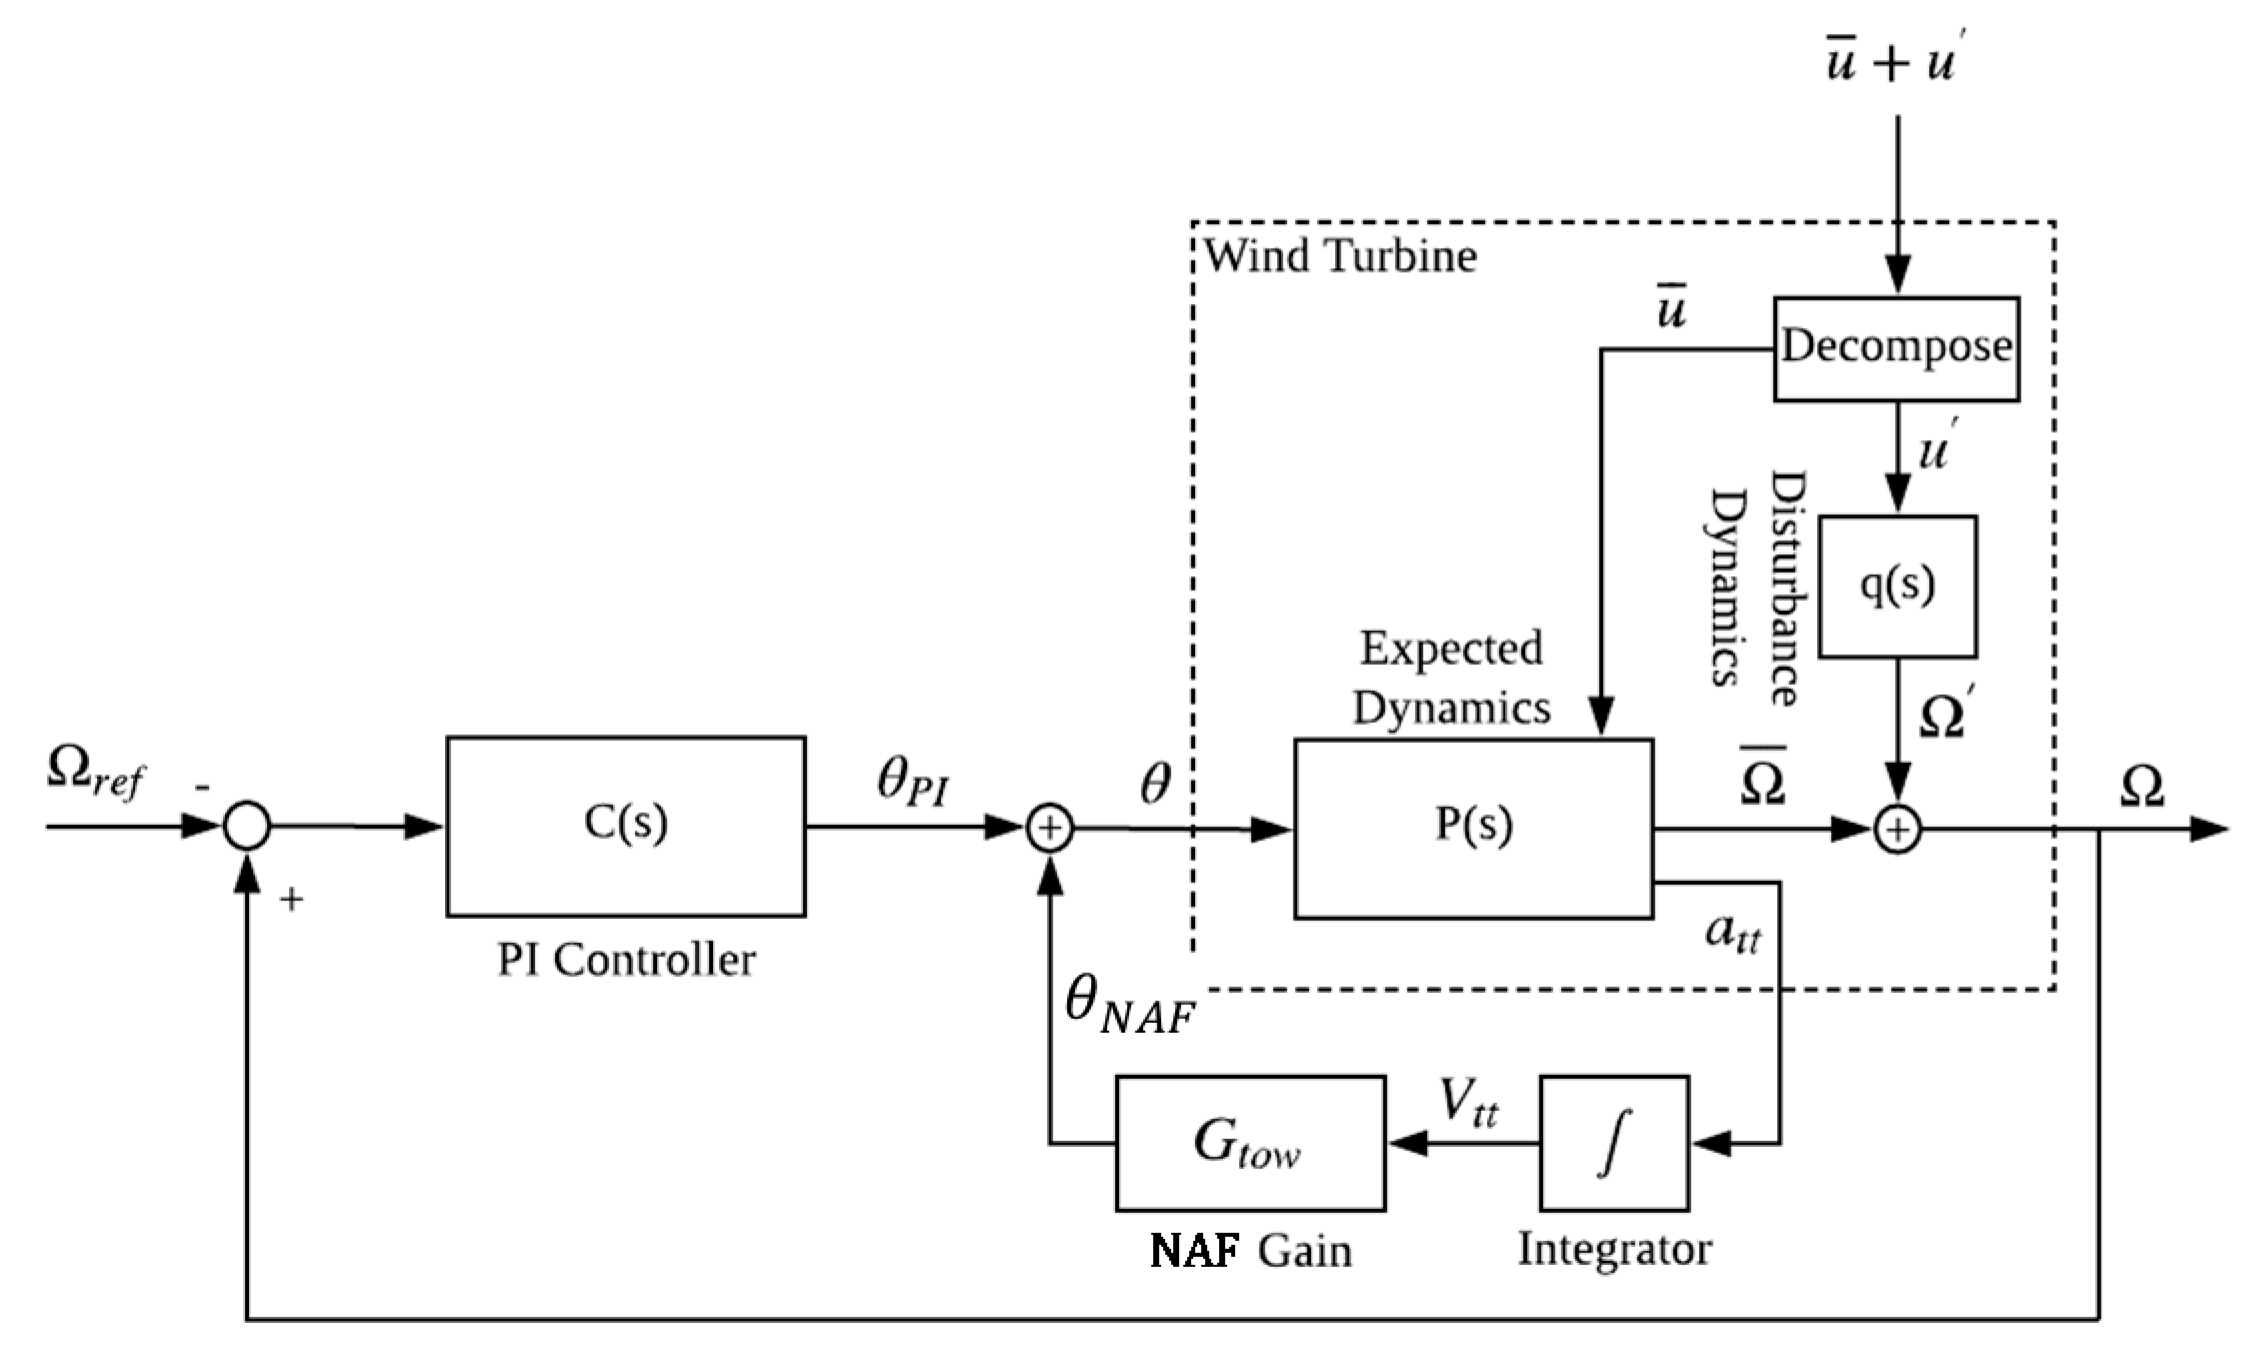
2.3. Nacelle Acceleration Feedback Control

The nacelle motion in the fore–aft direction can be reduced by using additional feedback loops to the blade pitch control with the measured nacelle speed. Typically, the nacelle speed can be estimated through the integration of the measured acceleration [15]. Consider the equation of motion of the nacelle in the fore–aft direction as a single degree of the freedom system when the wind turbine is in operation with a pitch angle of θ 0 .
m x ¨ + 4 π m η n m x ˙ + 4 π 2 m n m 2 x = T ( θ 0 )
where x is the nacelle displacement in the fore–aft direction, m is the modal mass, η is the modal damping ratio of the first mode of the system, n m is the natural frequency and T ( θ 0 ) is the thrust force at the pitch angle of θ 0 . Consider changing the thrust force by changing the pitch angle to θ 0 + Δ θ ; then, the motion of the nacelle can be approximately expressed as
m x ¨ + 4 π m η n m x ˙ + 4 π 2 m n m 2 x = T ( θ 0 ) + Δ θ T θ | θ = θ 0
The additional change in the pitch angle is given by Equation (28).
Δ θ = G tow x ˙
where G t o w is the control gain and x ˙ is the nacelle velocity, which can be calculated by numerically integrating the measured nacelle acceleration x ¨ . By substituting Equation (28) into Equation (27), the following equation can be obtained.
m x ¨ + 4 π m η n m x ˙ + 4 π 2 m n m 2 x = T ( θ 0 ) + G tow x ˙ T θ | θ = θ 0
Thus,
m x ¨ + 4 π m n m ( η + Δ η ) x ˙ + 4 π 2 m n m 2 x = T ( θ 0 )
where
Δ η = G tow 4 π m n m T θ | θ = θ 0
As T / θ is negative, the additional damping ratio Δ η in Equation (31) is positive, resulting in additional damping to the system. Equation (31) also shows the relation between the additional damping ratio Δ η and the control gain G tow . Thus, if a certain value of additional damping is desired, appropriate value of control gain can be calculated by using Equation (31). This point is further discussed in Section 3.1. The implemented block diagram of this algorithm is shown in Figure 5, where the additional pitch angle change shown in Equation (28) is given to the system in addition to the conventional PI pitch control.

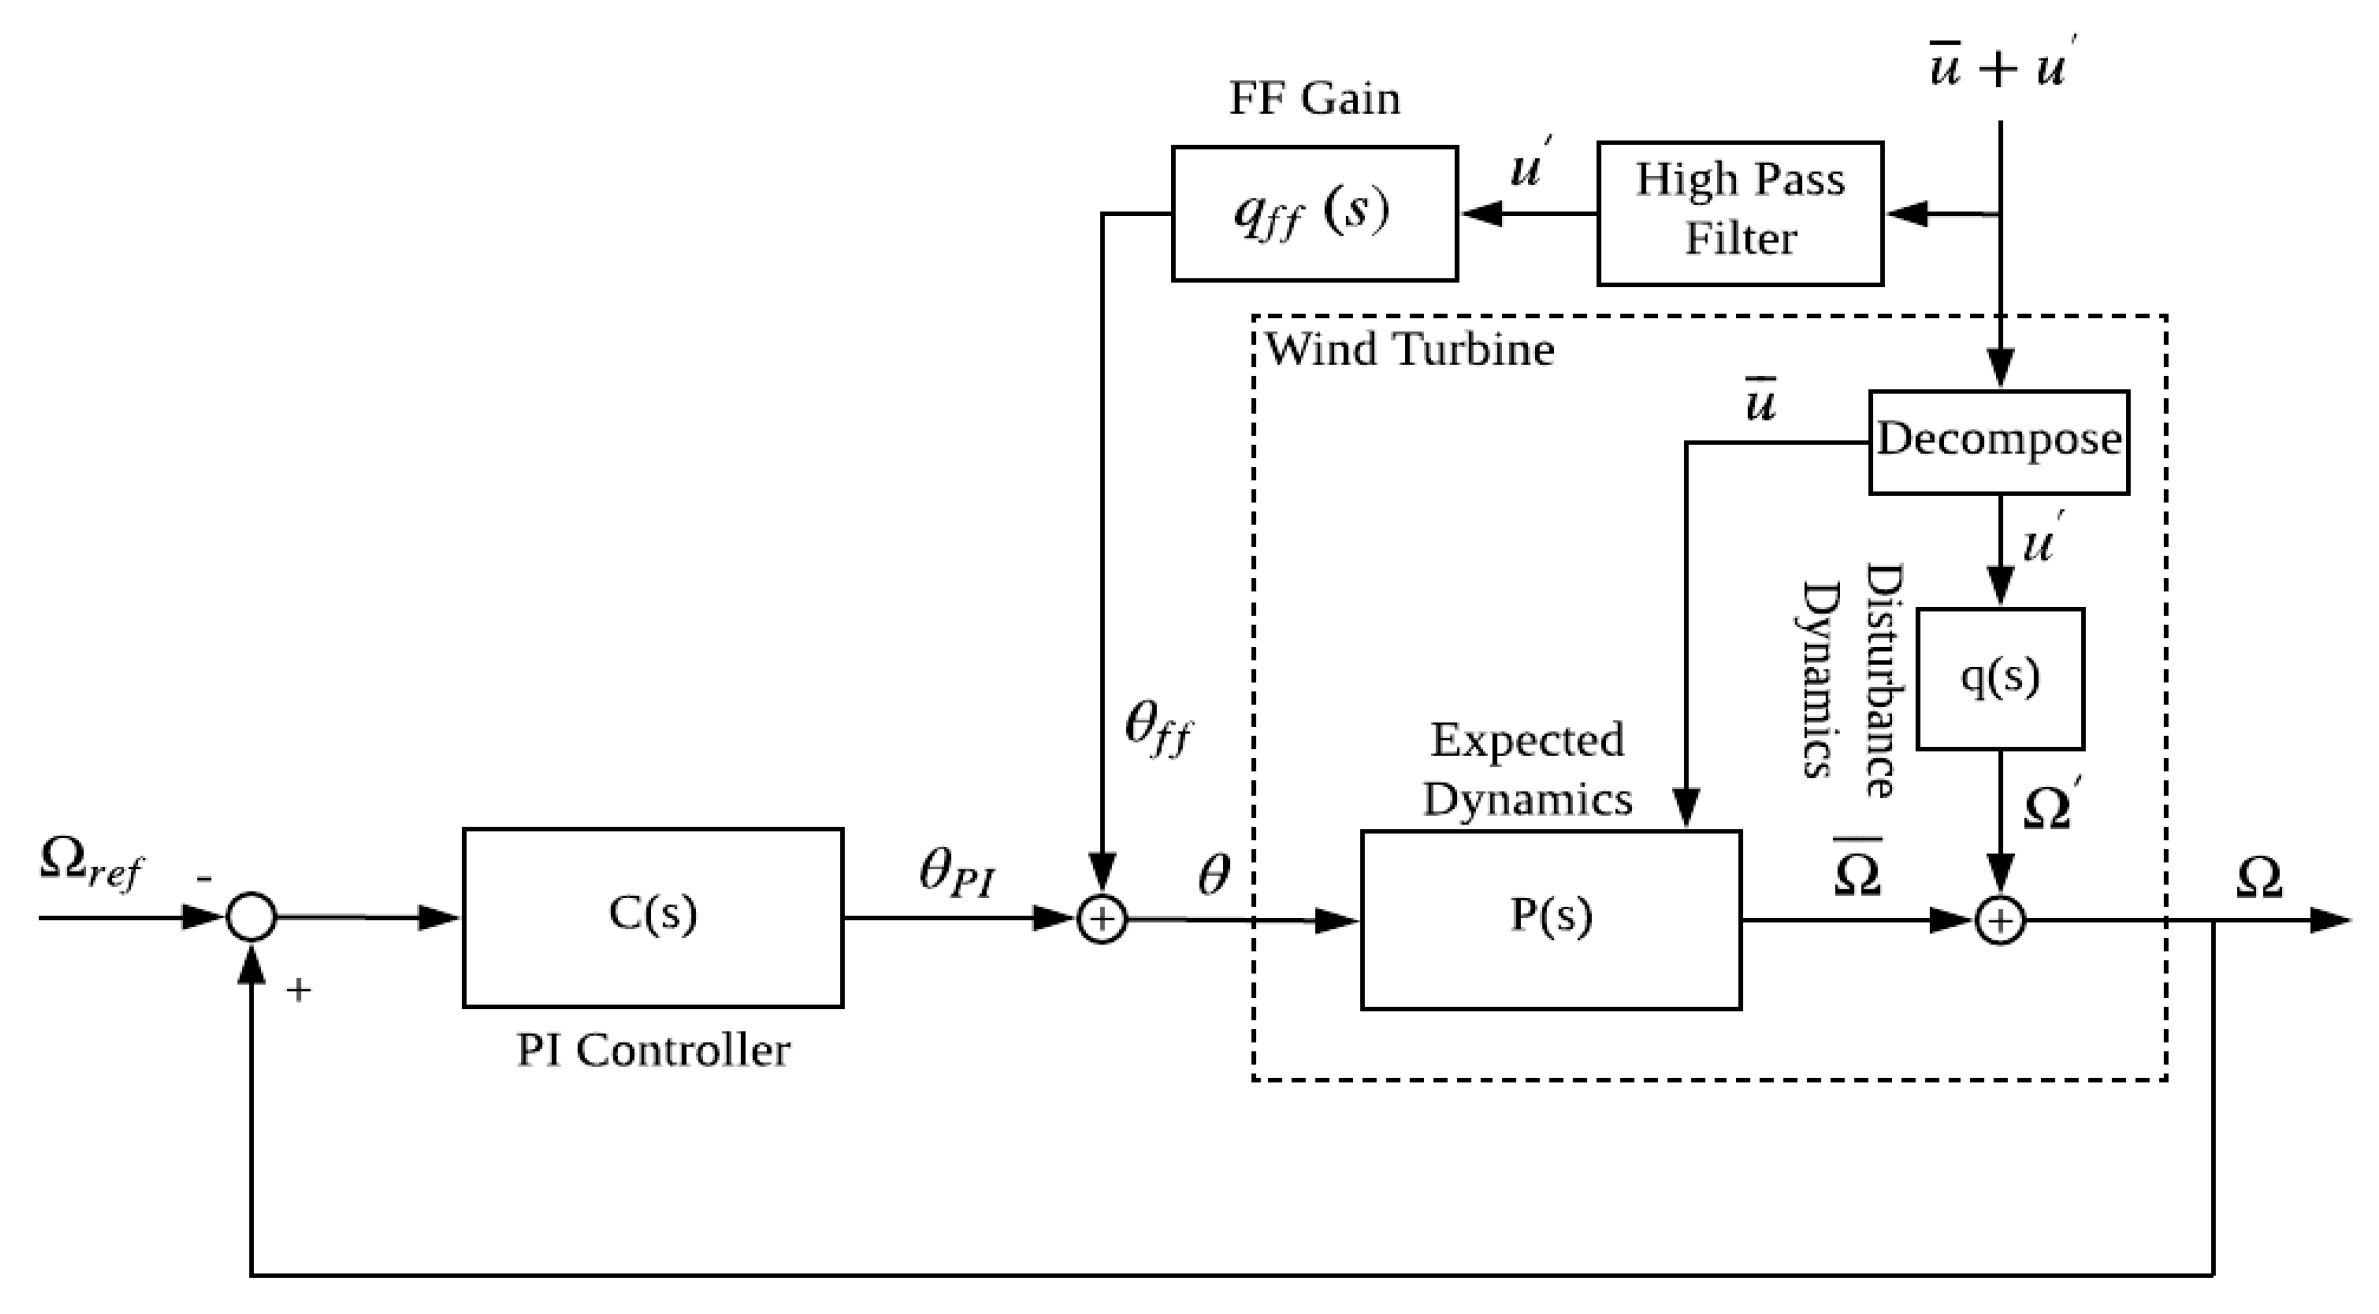
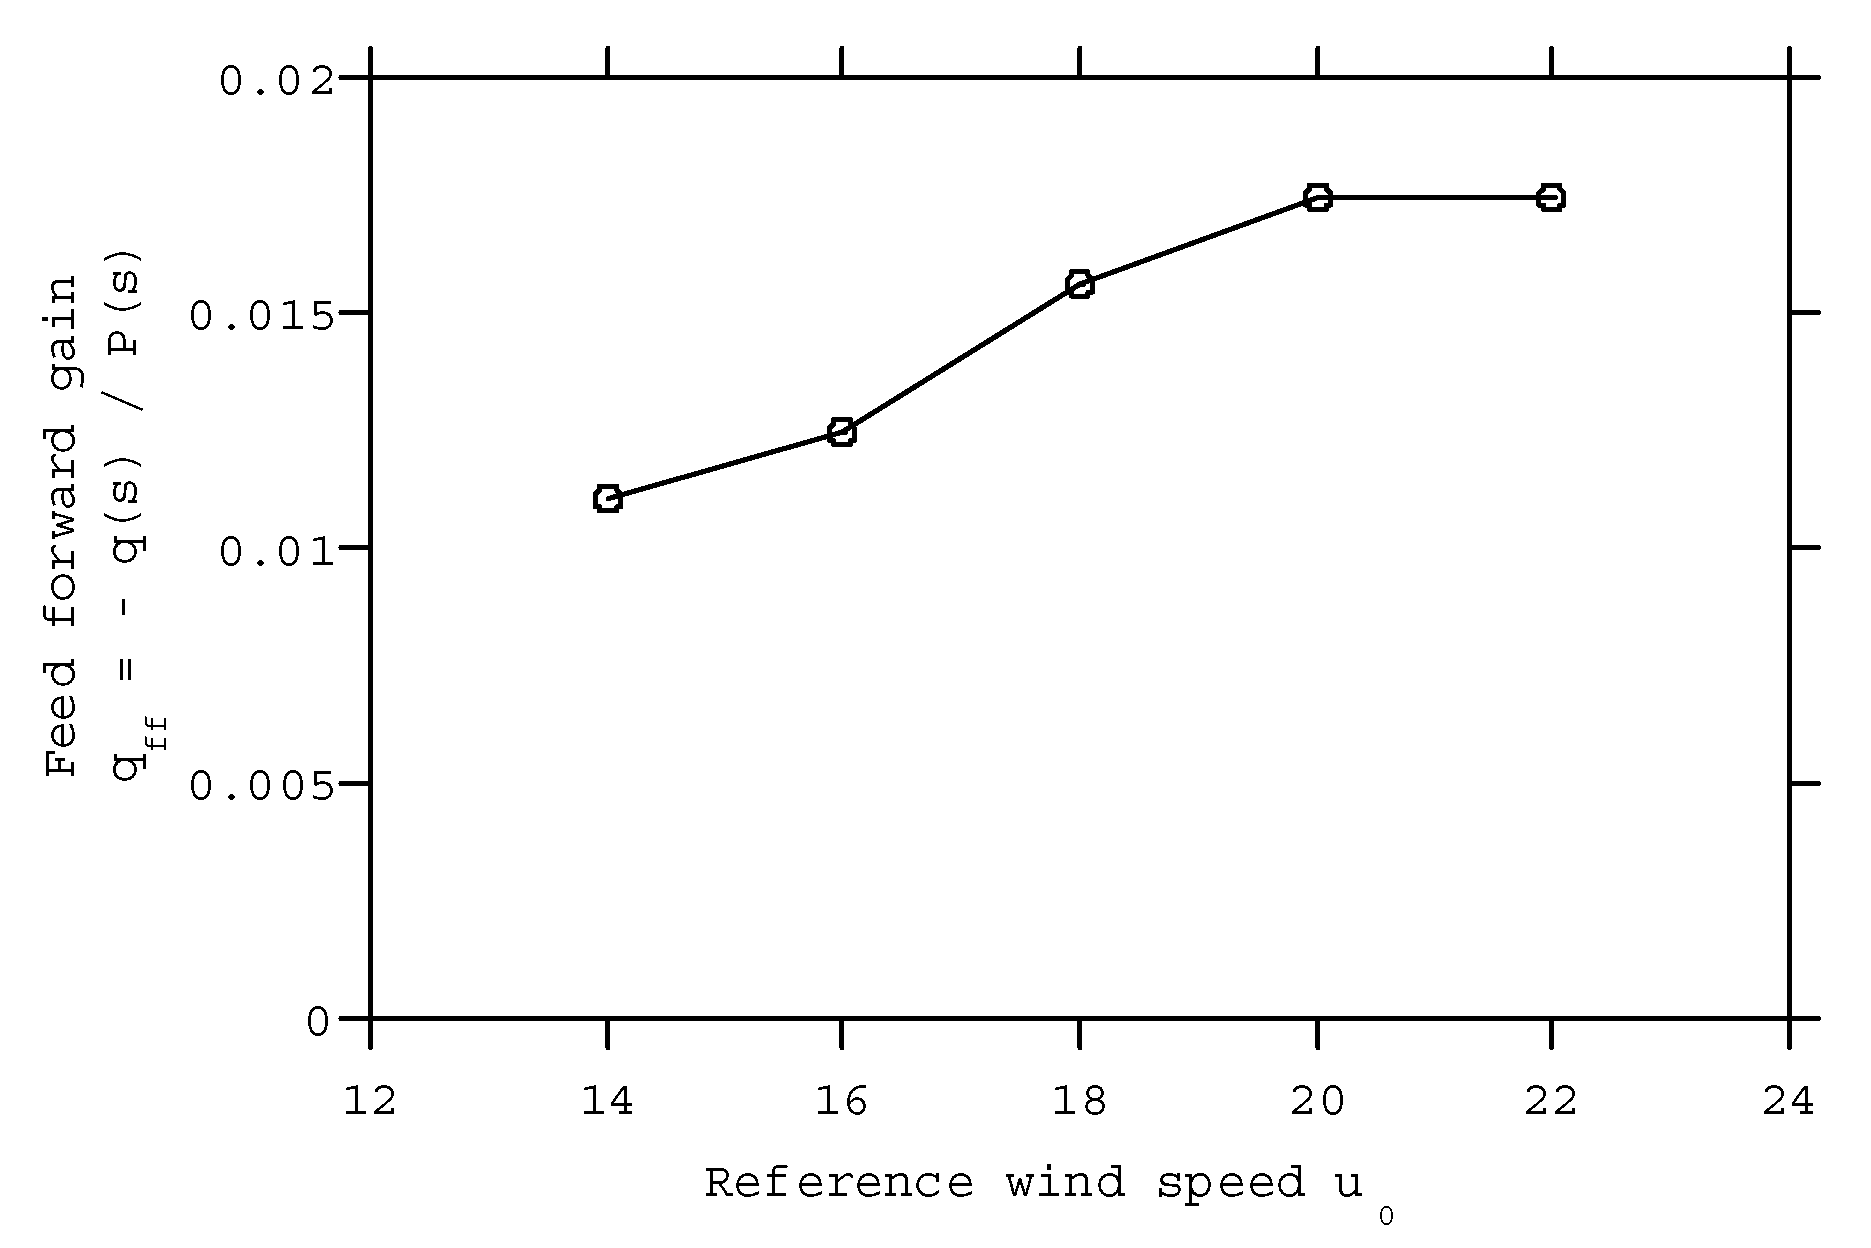
2.4. Lidar-Based Feedforward Control

As discussed by Jonkman [17], the fluctuations in rotor speed increase by using additional feedback from nacelle acceleration, and a method to reduce the rotational speed variations is needed. The lidar-based feedforward control method has been proposed to reduce the fluctuation in the rotor speed.
Figure 6 shows the block diagram of the feedforward control loop in addition to the conventional PI pitch control. As described in Section 2.2, P ( s ) is the expected dynamics of the rotor speed for the pitch demand of θ and the constant wind speed of u ¯ . q ( s ) is the disturbance dynamics of the rotor speed under the fluctuating wind speed. The rotational speed of the system can be computed as
Ω = q ( s ) Δ u + P ( s ) θ
According to Figure 6, the pitch angle demand is composed of two components as
θ = θ 0 + Δ θ f f
where Δ θ f f is additional pitch angle change induced by the feedforward controller. In this study, the system is linearized around the reference point ( u 0 ( = u ¯ ) , θ 0 , Ω 0 ) , and Equation (32) is rewritten as
Ω 0 + Δ Ω = q ( s ) Δ u + P ( s ) θ 0 + P ( s ) Δ θ f f
Thus,
Δ Ω = q ( s ) Δ u + P ( s ) Δ θ f f
The purpose of the lidar-based feedforward control is to change the pitch angle Δ θ f f to cancel the fluctuation in rotor speed caused by the fluctuation in wind speed.
In order to cancel the fluctuation in the rotor speed by changing the pitch angle, the following relation has to be met.
q ( s ) Δ u + P ( s ) Δ θ f f = 0
Thus,
Δ θ f f = q ( s ) P ( s ) Δ u = q f f Δ u
which means the feedforward gain q f f can be calculated as
q f f = q ( s ) P ( s )
In this study, q ( s ) and P ( s ) are estimated by linearizing the system around the reference point ( u 0 , θ 0 , Q 0 ) , as shown in Equations (39) and (40).
q ( s ) = Ω u | u = u 0
P ( s ) = Ω θ | θ = θ 0
Then, by using the rotor speed Ω 0 at the reference point ( u 0 , θ 0 , Q 0 ) , the feedforward gain q f f can further written as
q f f = θ u | u = u 0
Figure 7 shows the gain values as functions of the reference wind speed u 0 at which the system is linearized by using Equations (39) and (40). The dependency on the wind speed is relatively small, and the value of 0.011 is used as the gain value of the feedforward controller in this study, which will be discussed in Section 3.2.

3. Effects of Each Control on Tower Loads and Rotor Speeds

The effects of nacelle acceleration feedback and lidar-based feedforward controllers are discussed in Section 3.1 and Section 3.2, respectively. The effects of combined feedback and the feedforward controller are explained in Section 3.3.

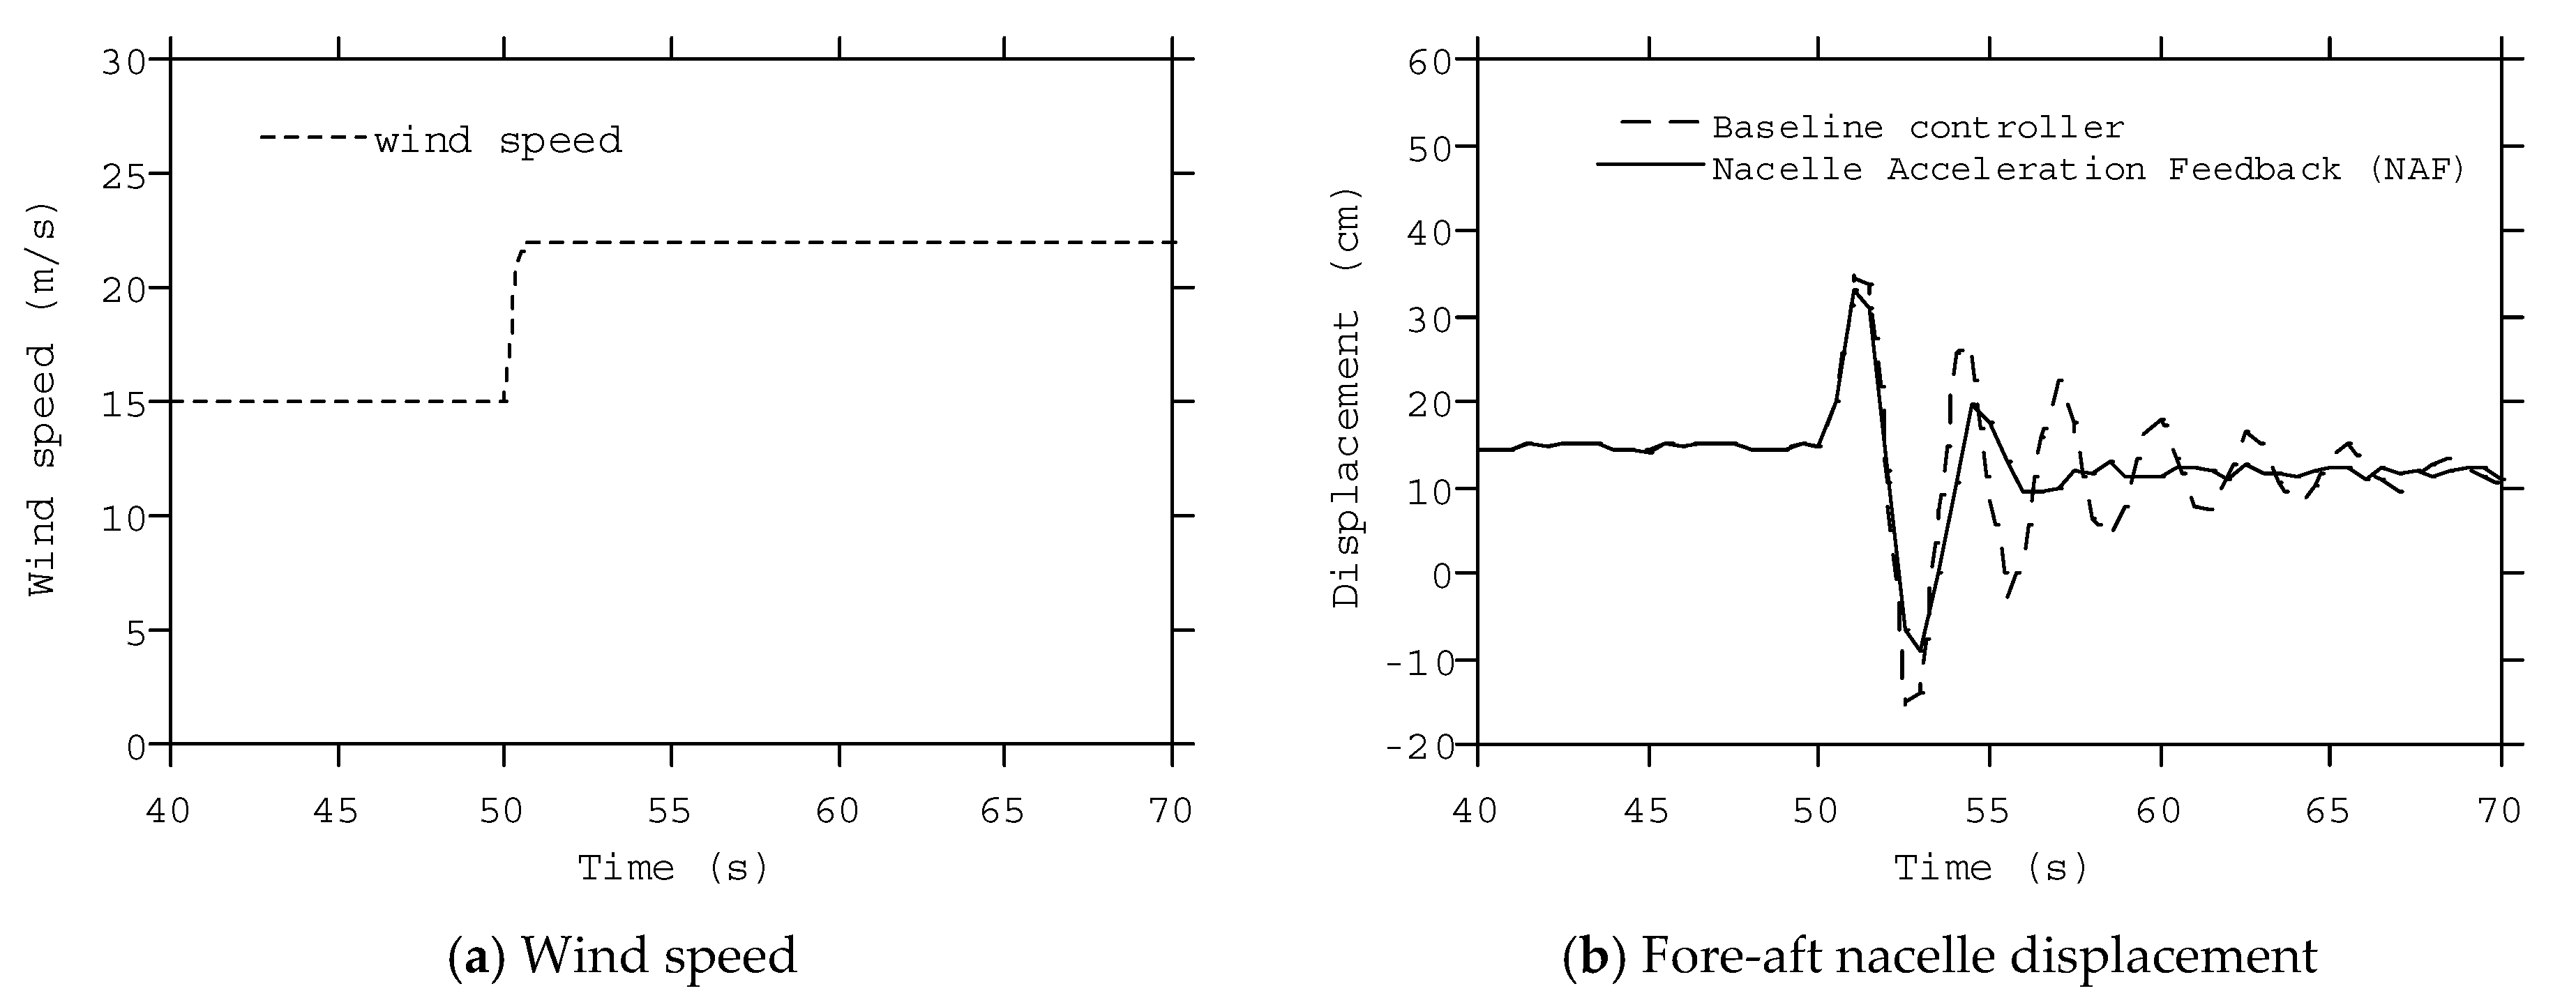
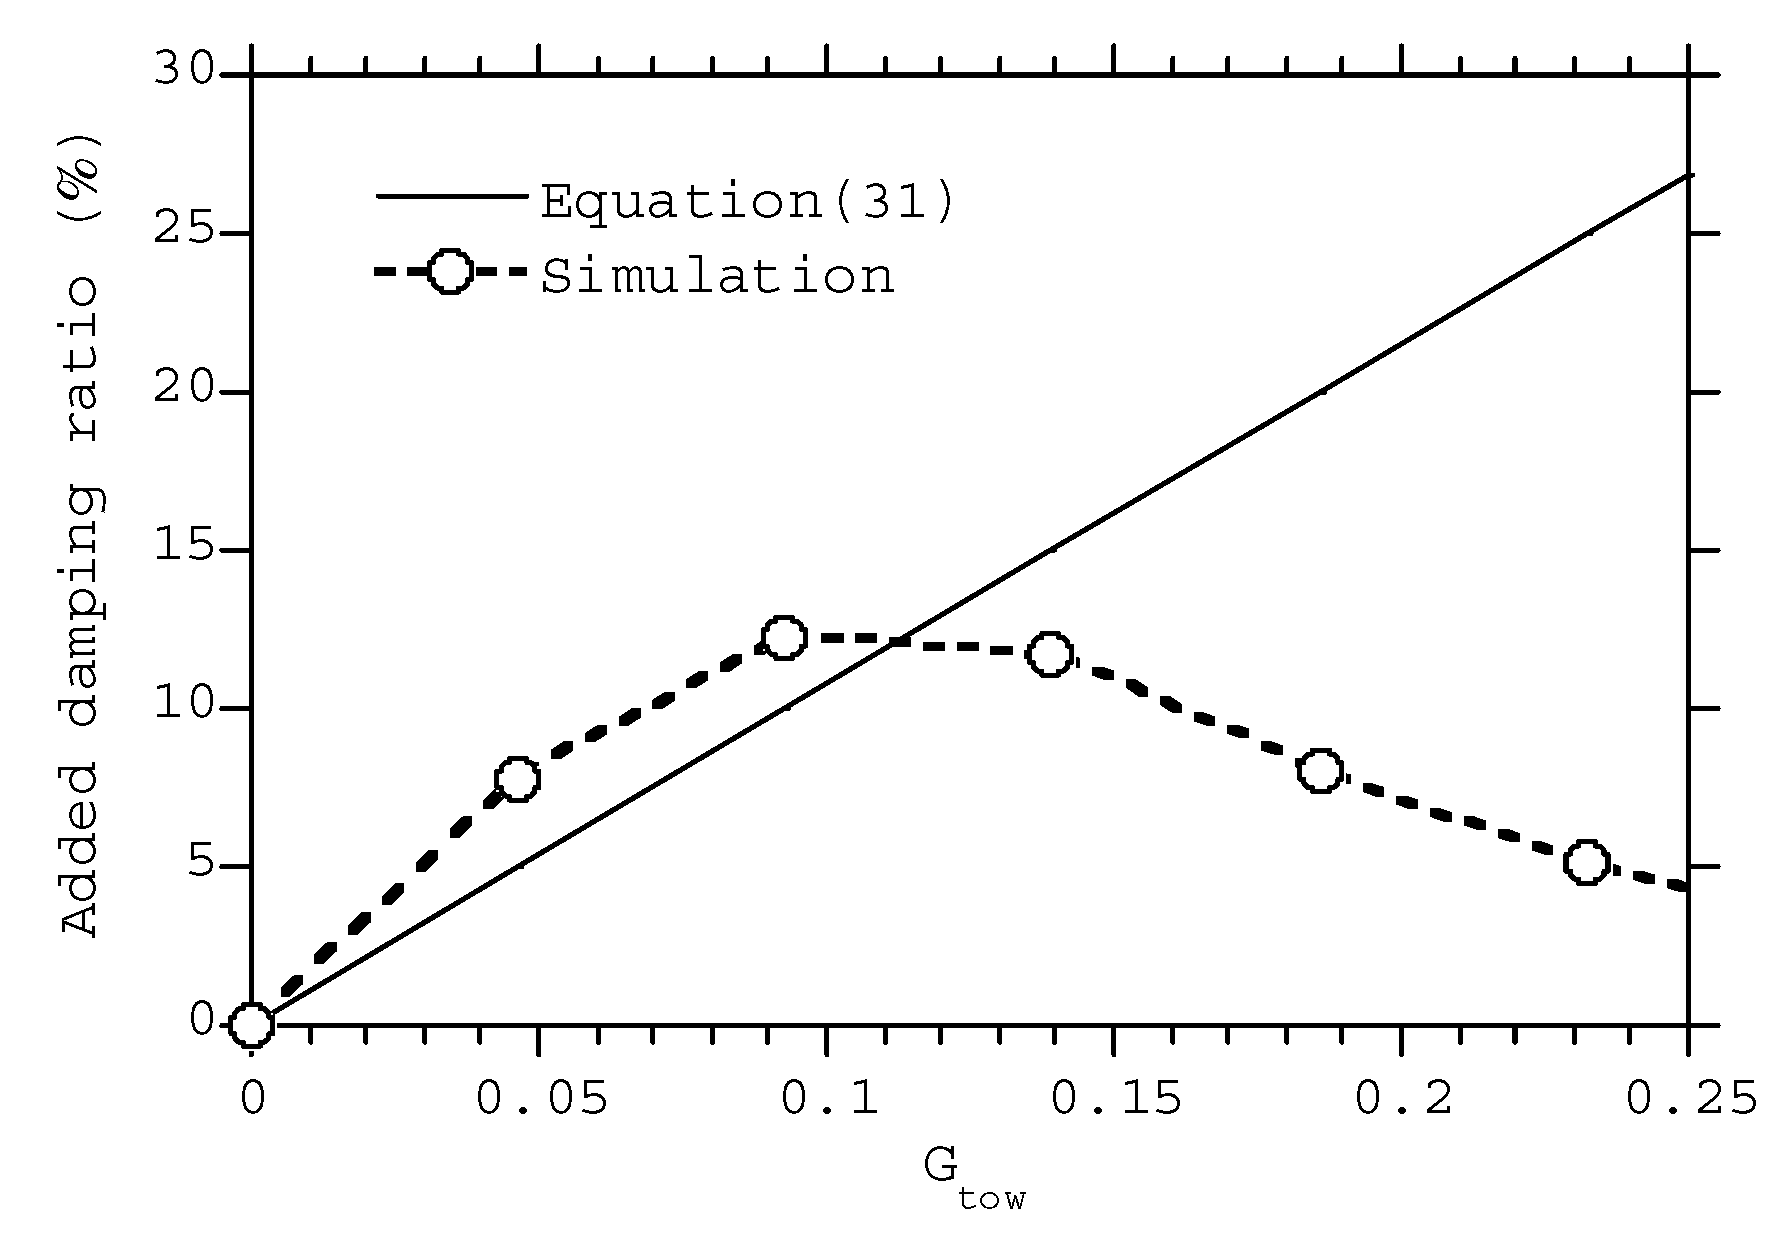
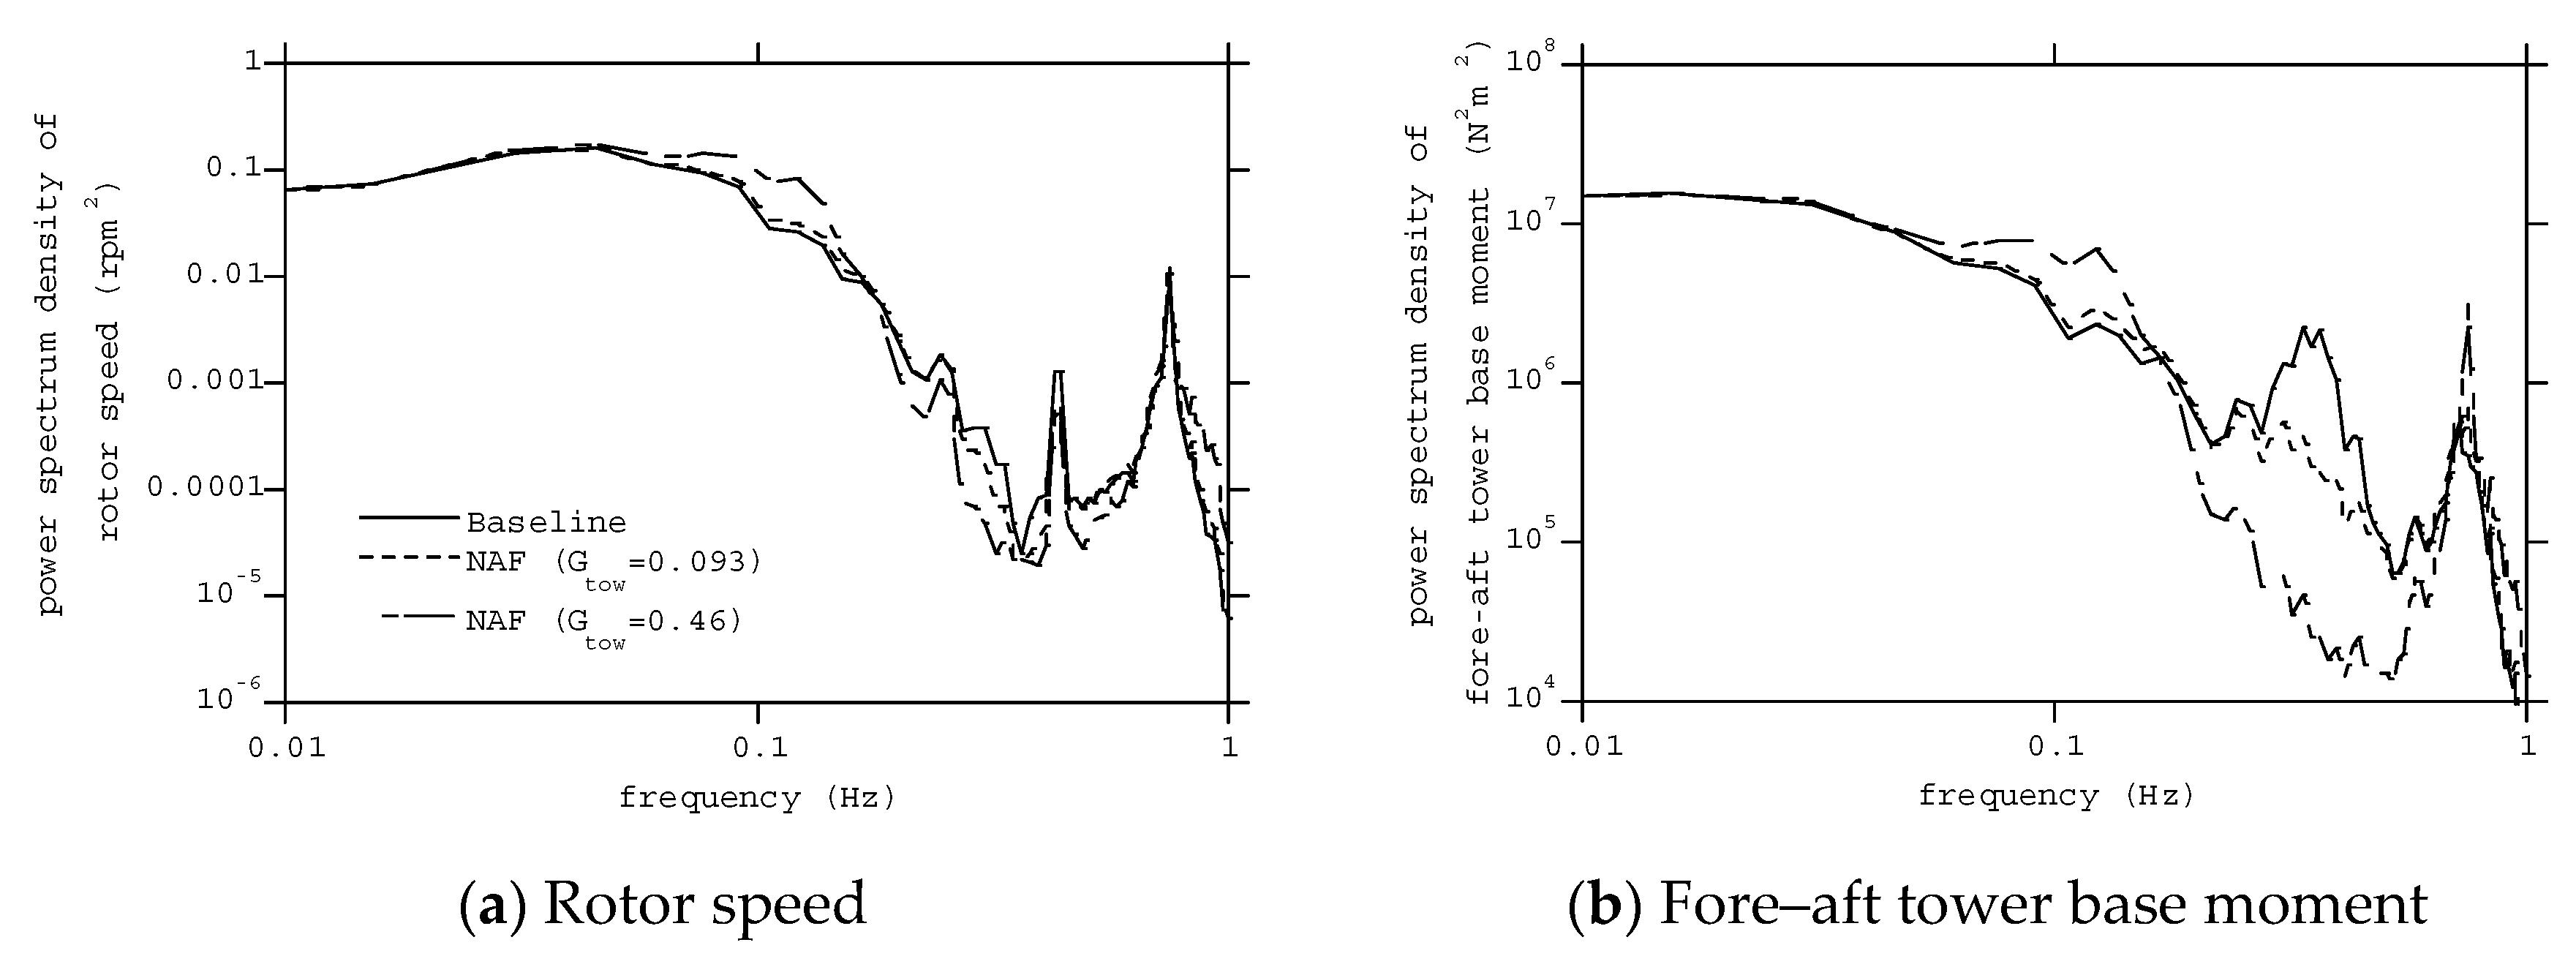
3.1. Effect of the Nacelle Acceleration Feedback Controller

The relation between the theoretical damping ratio given in Equation (31) and the actual damping of the system is investigated by changing the gain value G t o w . To compute the ideal damping by using Equation (31), the value of T / θ is needed. In this study, perturbation analysis is carried out at with an equilibrium point at a wind speed of 15 m/s, and it is used to calculate T / θ .
The estimation of actual damping is performed by using free decay tests in which the input uniform wind is suddenly changed from 15 m/s to 22 m/s, as shown in Figure 8a. Figure 8b shows the comparison of the nacelle displacement filtered around the tower first modal frequency for the baseline controller and the nacelle acceleration feedback control. Clearly, the damping of the nacelle motion is increased. By fitting the exponential decay function to the nacelle acceleration shown in Figure 8b, the damping ratio of the system can be estimated. Figure 9 shows the comparison of theoretical (Equation (31)) and actual damping ratio for different gain values G t o w . The actual and theoretical damping ratios show similar trends of up to G t o w = 0.093 , but the actual damping ratio decreases when the gain value is larger than 0.093.
The simulation under turbulent wind conditions is performed for the wind speed of 14 m/s to investigate the reason why the actual damping shows maximum value at an optimum gain value. Figure 10 shows the standard deviation of the fore–aft tower base moment under turbulent wind fields with a mean wind speed of 14 m/s for different gain values G t o w . When the gain value G t o w = 0.093 , the fluctuating tower base moment decreases when compared with the baseline controller. However, when the gain value G t o w = 0.46 is used, the fluctuating load increases. This is consistent with the results discussed above. Figure 11 shows the power spectrum density of the rotor speed and the fore–aft tower base moment for the same case. For the case of G t o w = 0.093 , the response at the tower first mode frequency is successfully mitigated without a significant increase in the load at other frequencies. On the other hand, when a higher gain value is used, the fluctuating load at the first tower modal frequency further decreases, but the response of the lower frequency between 0.06 Hz and 0.15 Hz increases. This is caused by the increase in the thrust force on the rotor due to the increase in the rotor speed fluctuation around this frequency, as shown in Figure 11a.

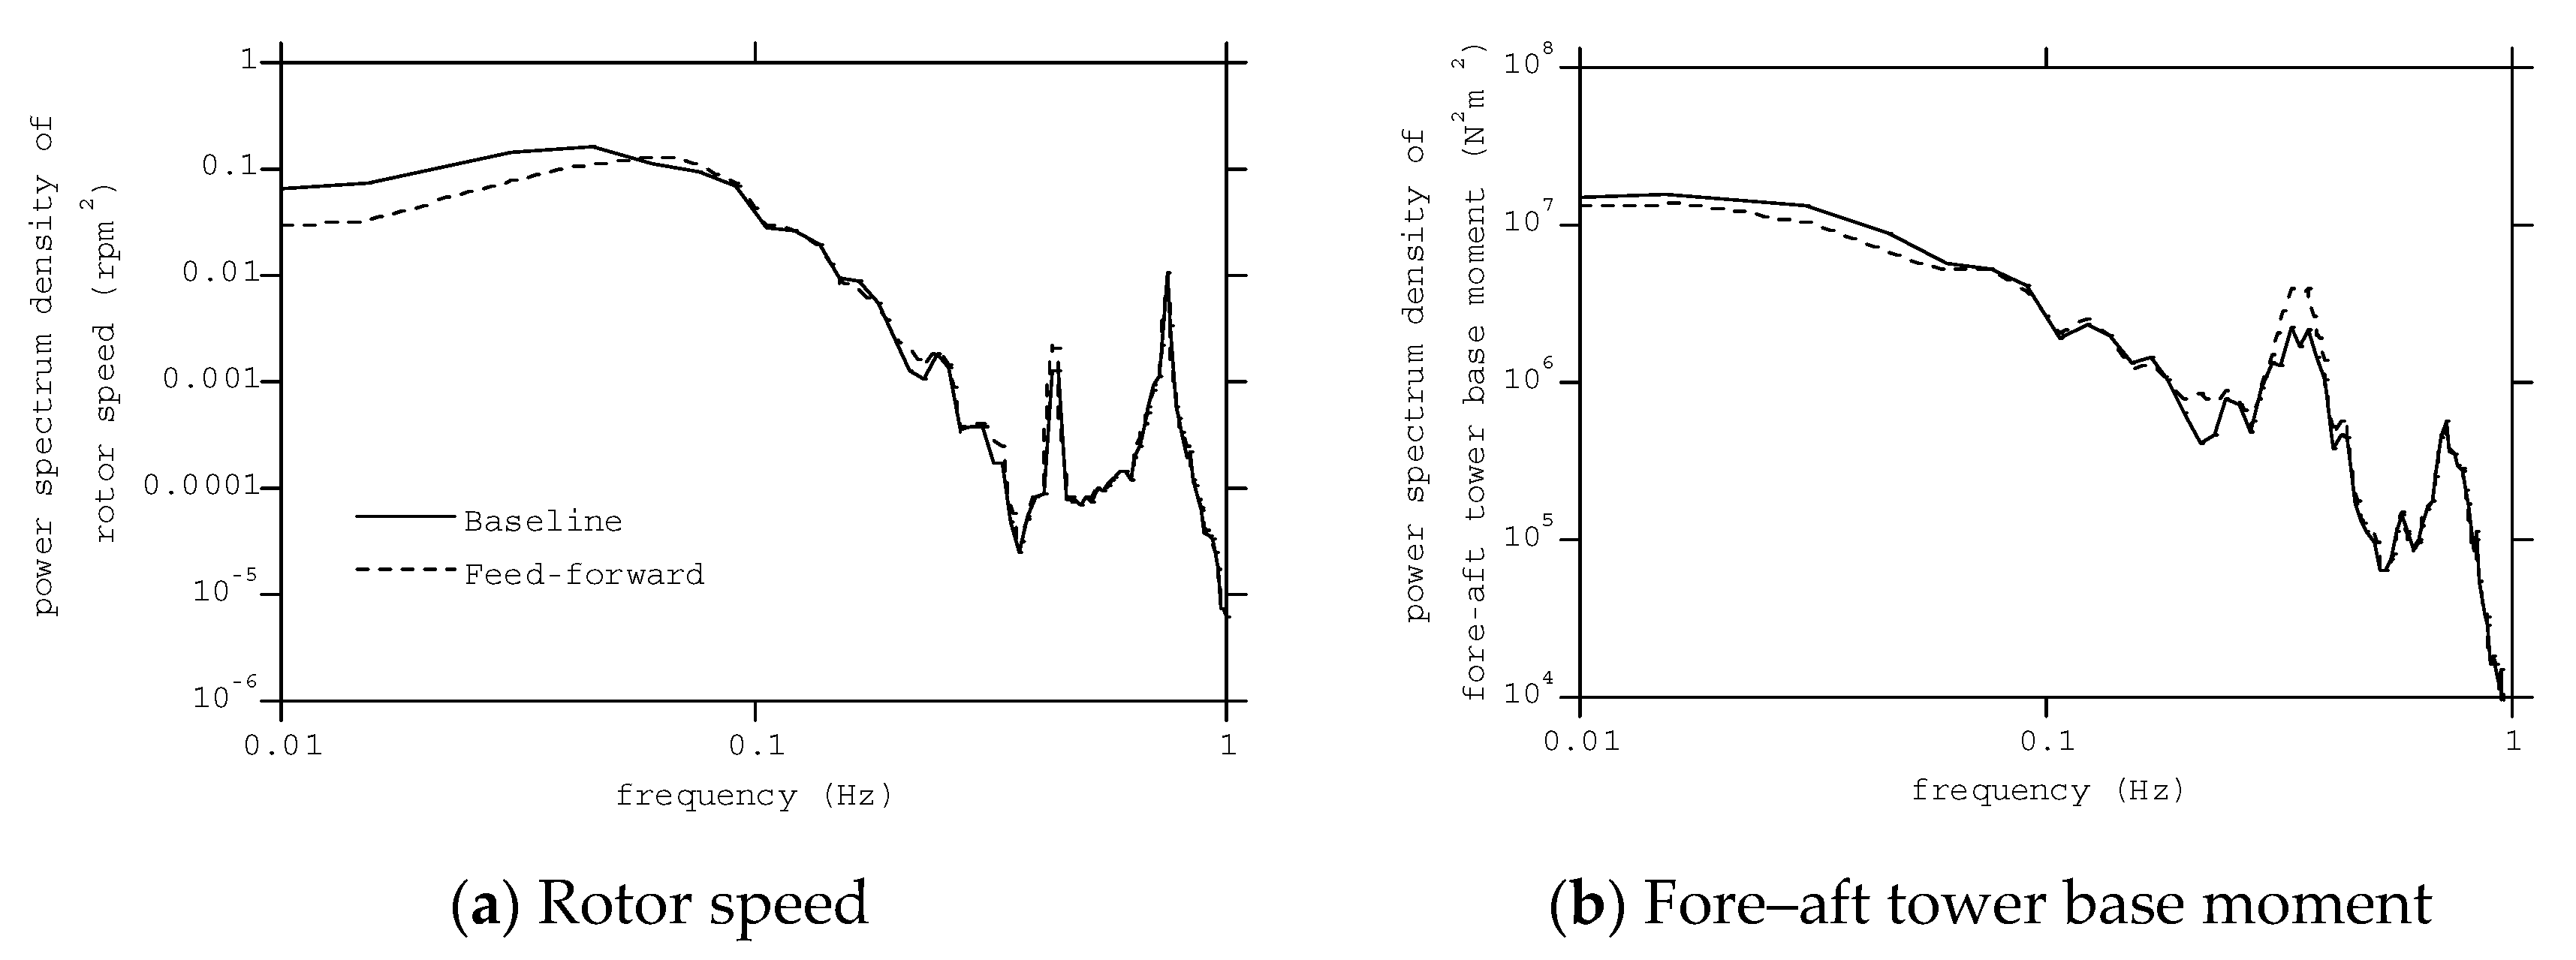
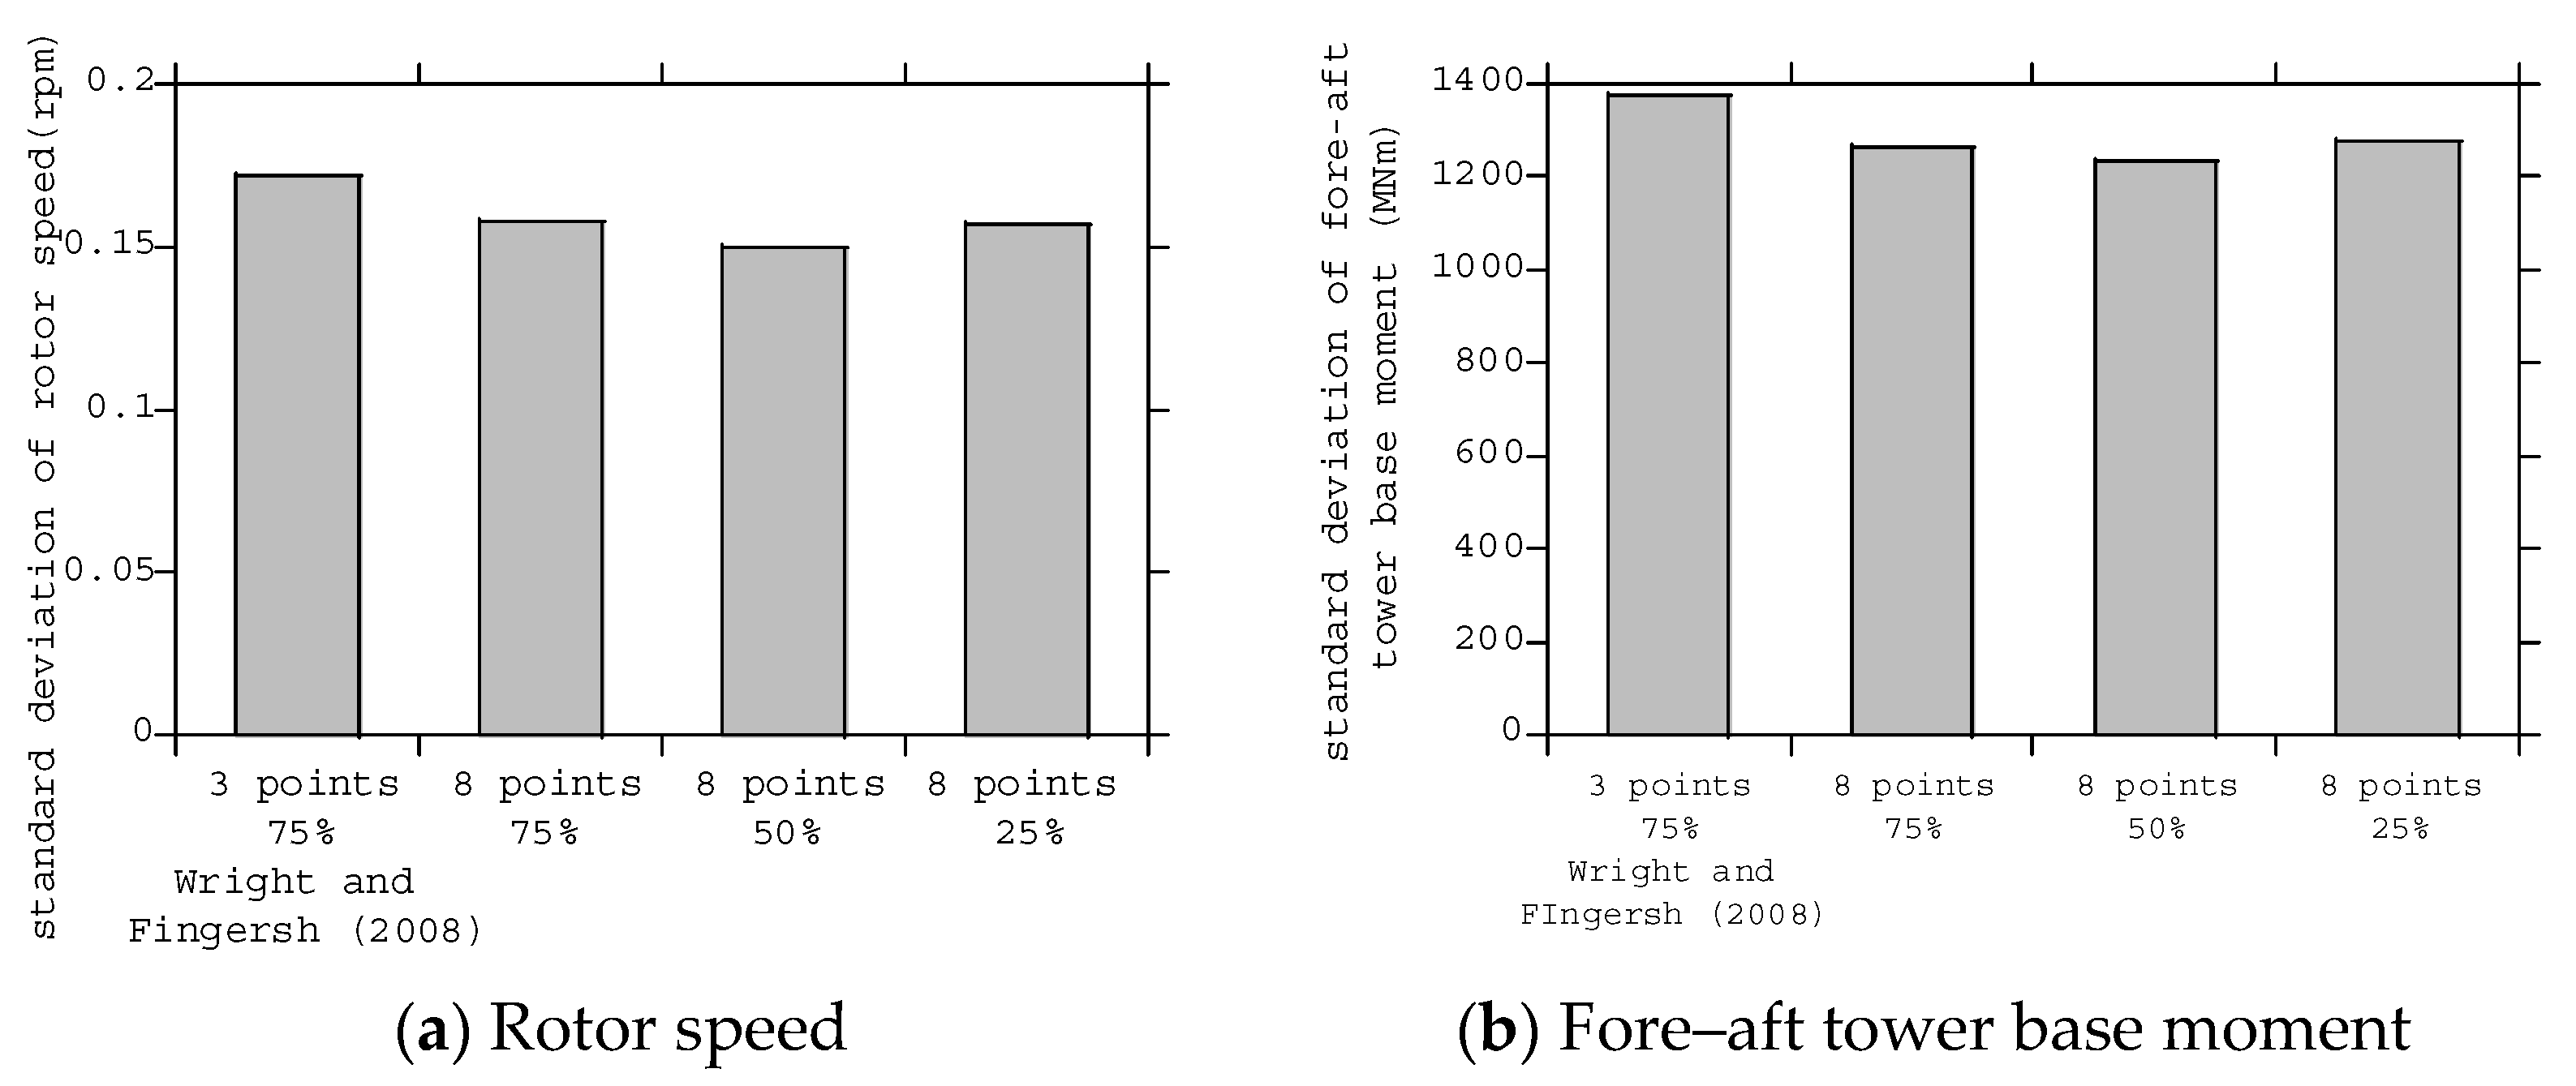
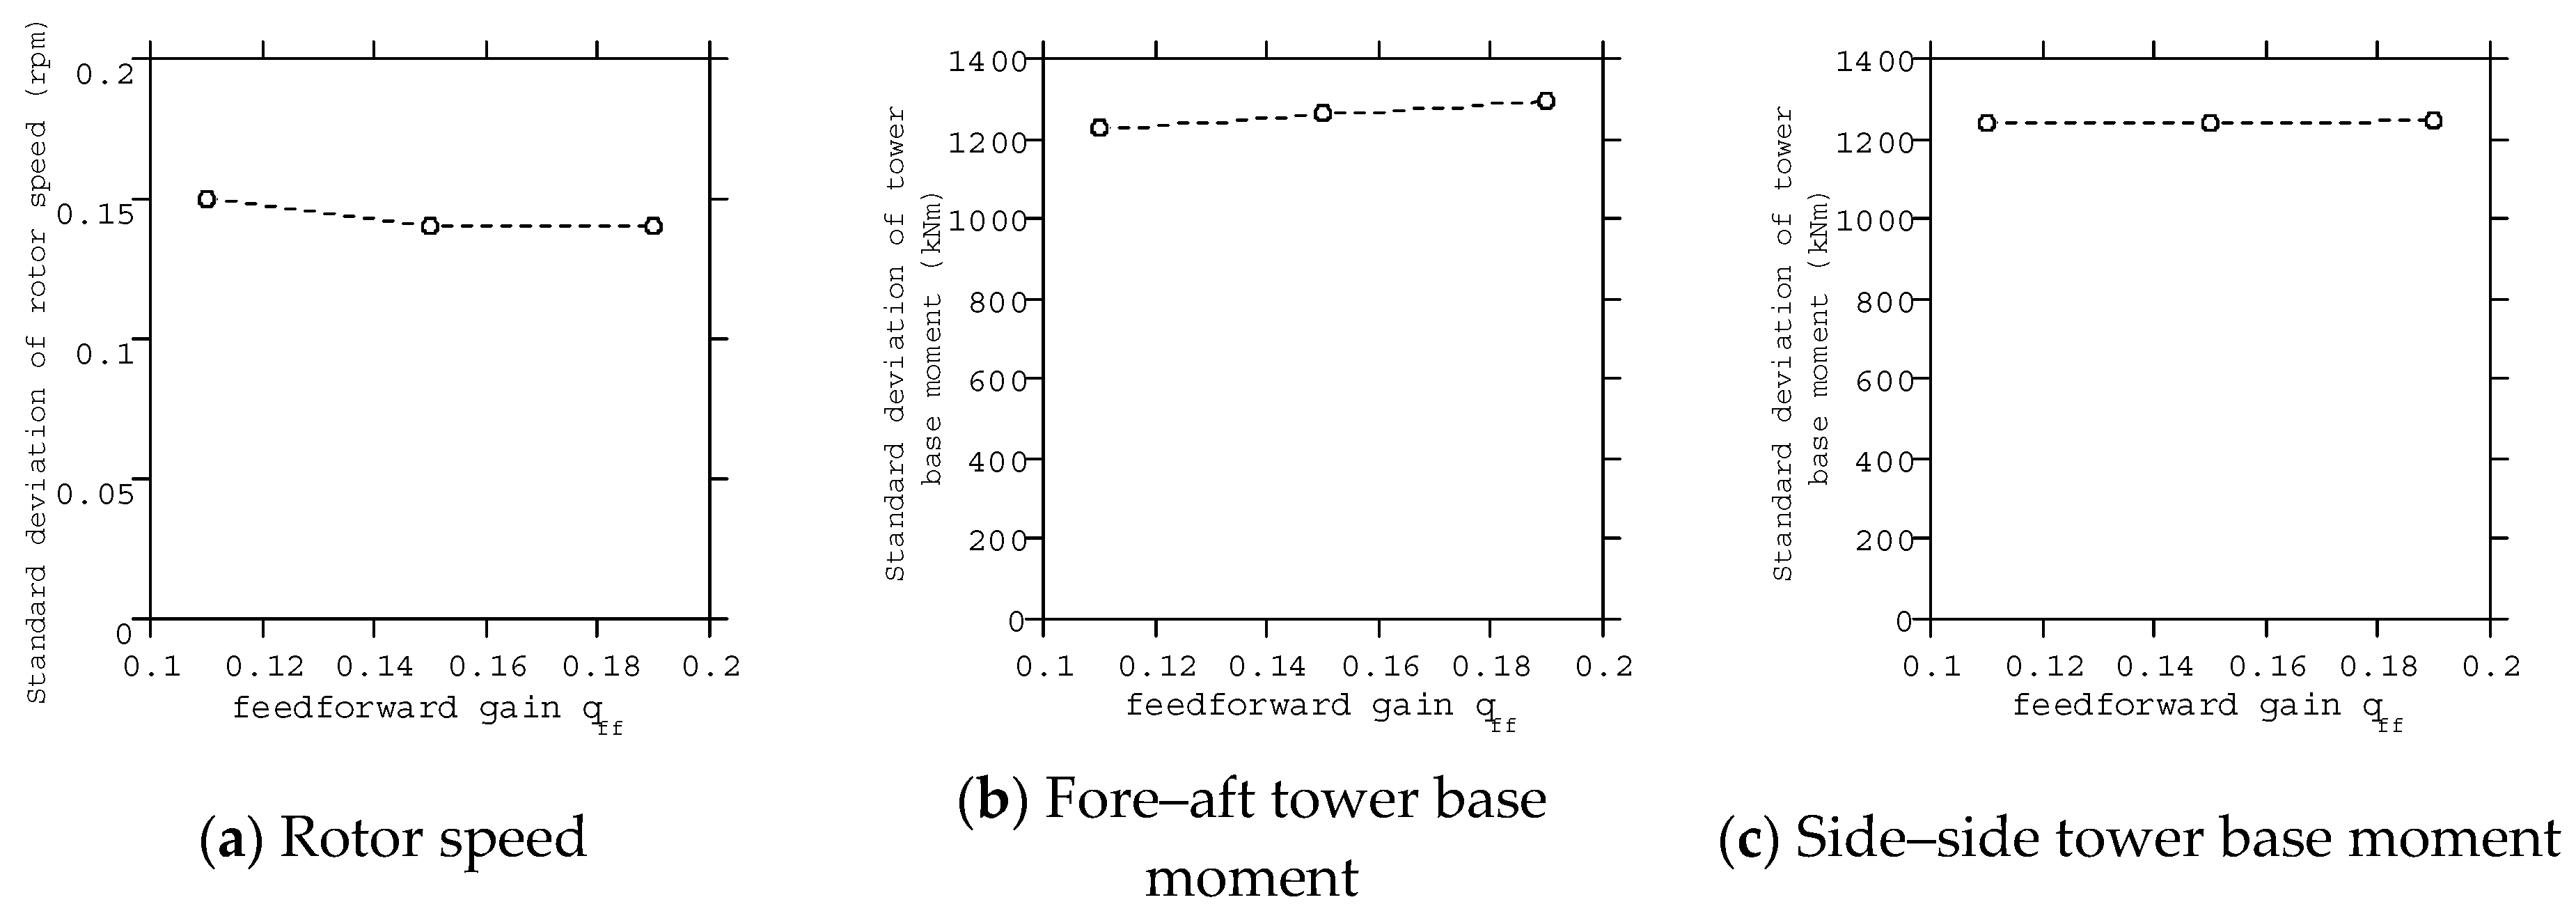
3.2. Effect of the Lidar-Based Feedforward Controller

The reduction in the fluctuating tower load by the feedforward controller is not expected because the lidar-based feedforward controller is originally designed to reduce the fluctuation in the rotor speed. The reason why the lidar-based feedforward controller can reduce the fluctuation in the rotor speed is explained. The fluctuating thrust force T is a function of the relative wind speed V r to the nacelle, blade pitch angle θ and rotor speed Ω , and can be linearized as
Δ T ( V r , θ , Ω ) = T u Δ u r + T θ Δ θ + T Ω Δ Ω
The fluctuation in relative wind speed Δ u r can be written as
Δ u r = Δ u x ˙
where Δ u is the fluctuation in the wind speed. By substituting Equations (37), (41) and (43) to Equation (42), the following equation can be obtained.
Δ T ( V r , θ , Ω ) = T u ( Δ u x ˙ ) T u Δ u + T Ω Δ Ω
This shows that the fluctuation in thrust force caused by the fluctuation in wind speed is cancelled by the fluctuation in thrust force due to the feedforward pitch control, implying that the feedforward control not only reduces the fluctuation in the rotor speed, but also the fluctuation in the thrust force on the rotor, decreasing the fluctuation in the tower base moment and other fluctuating loads.
Figure 12 shows the power spectrum of the rotor speed and tower base moment for the baseline controller and the lidar-based feedforward controller under turbulent wind fields with a mean wind speed of 14 m/s. The rotor speed fluctuation in the low frequency region, which corresponds to the peak of turbulence, decreases by using the lidar-based feedforward control and, thus, the fluctuating tower base moment in this frequency range is mitigated, as implied in Equation (44). On the other hand, the fluctuating tower base moment around the tower first mode frequency increases. As discussed by Jonkman [17], open-loop pitch controllers have smaller damping ratios at the tower first modal frequency, and the lidar-based feedforward controller is one example of these open-loop pitch controllers.
The fluctuating wind component Δ u can be measured by using Doppler lidar. Several strategies have been proposed to measure Δ u averaged over the rotor plane. Wright and Fingersh [22] proposed the use of the wind speed of three points which are equally spaced along the circle located at 75% of the rotor radius. In this study, three strategies are added and tested as follows: (i) eight points on the circle located at 75% of the rotor radius; (ii) eight points at 50% of the rotor radius; and (iii) eight points at 25% of the rotor radius. Figure 13 shows the comparison of the standard deviation of the rotor speed and fore–aft tower base moment for different wind measurement strategies at a mean wind speed of 14 m/s. It can be seen that using the wind speed averaged over eight points along the circle located at the 50% of the rotor radius gives the best performance. This strategy will be used in this study.
The sensitivity of the feedforward gain value is investigated. Figure 14 shows the standard deviation of the rotor speed, fore–aft and side–side tower base moments when the feedforward gain value is changed from 0.11 to 0.19 at the wind speed of 22 m/s. The fluctuating rotor speed and tower base moments are slightly affected by the feedforward gain. In this study, the feedforward gain of 0.11 is used, which minimizes the standard deviation of the fore–aft tower base moment.

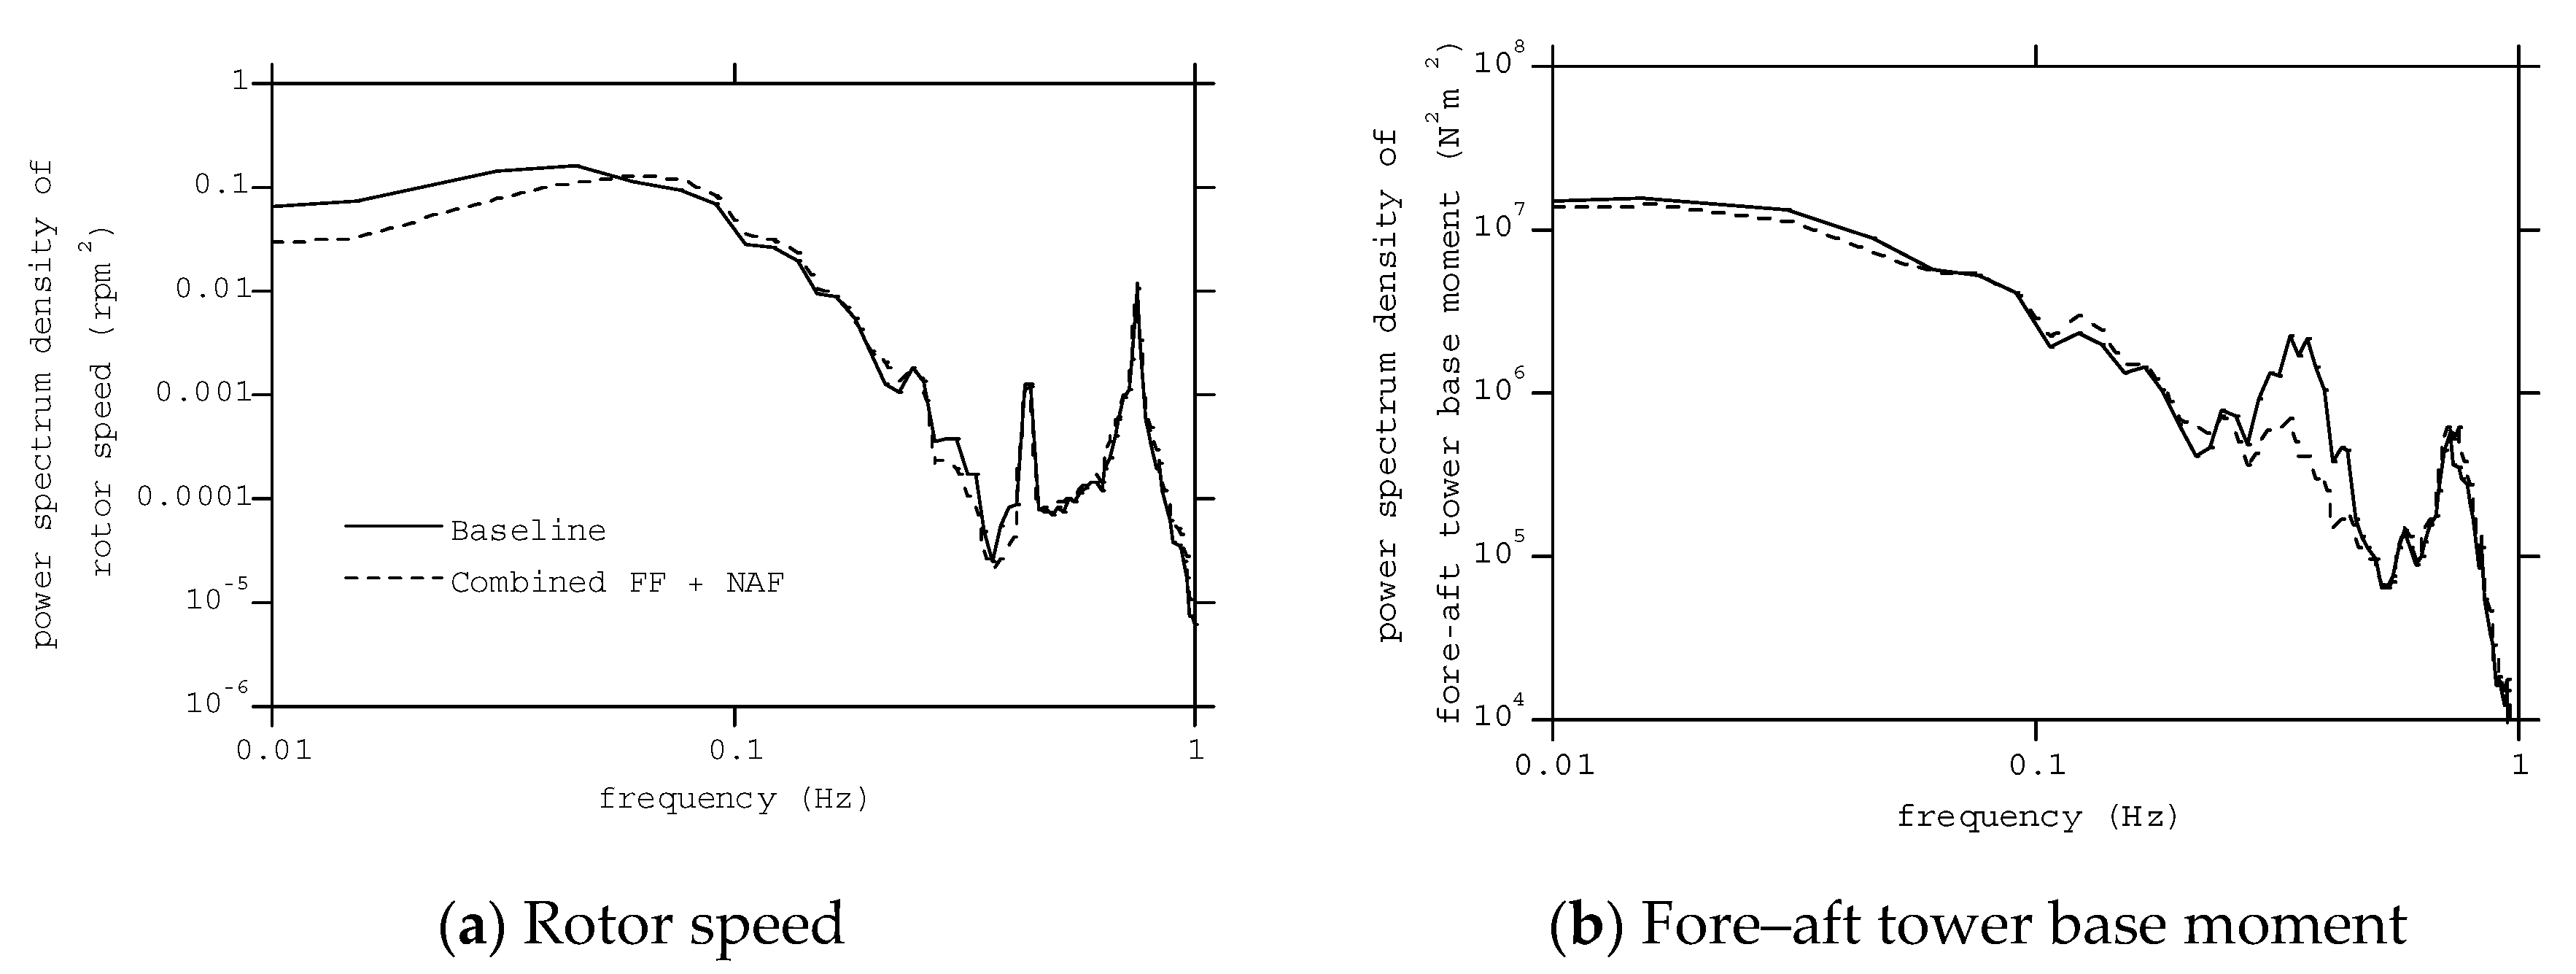
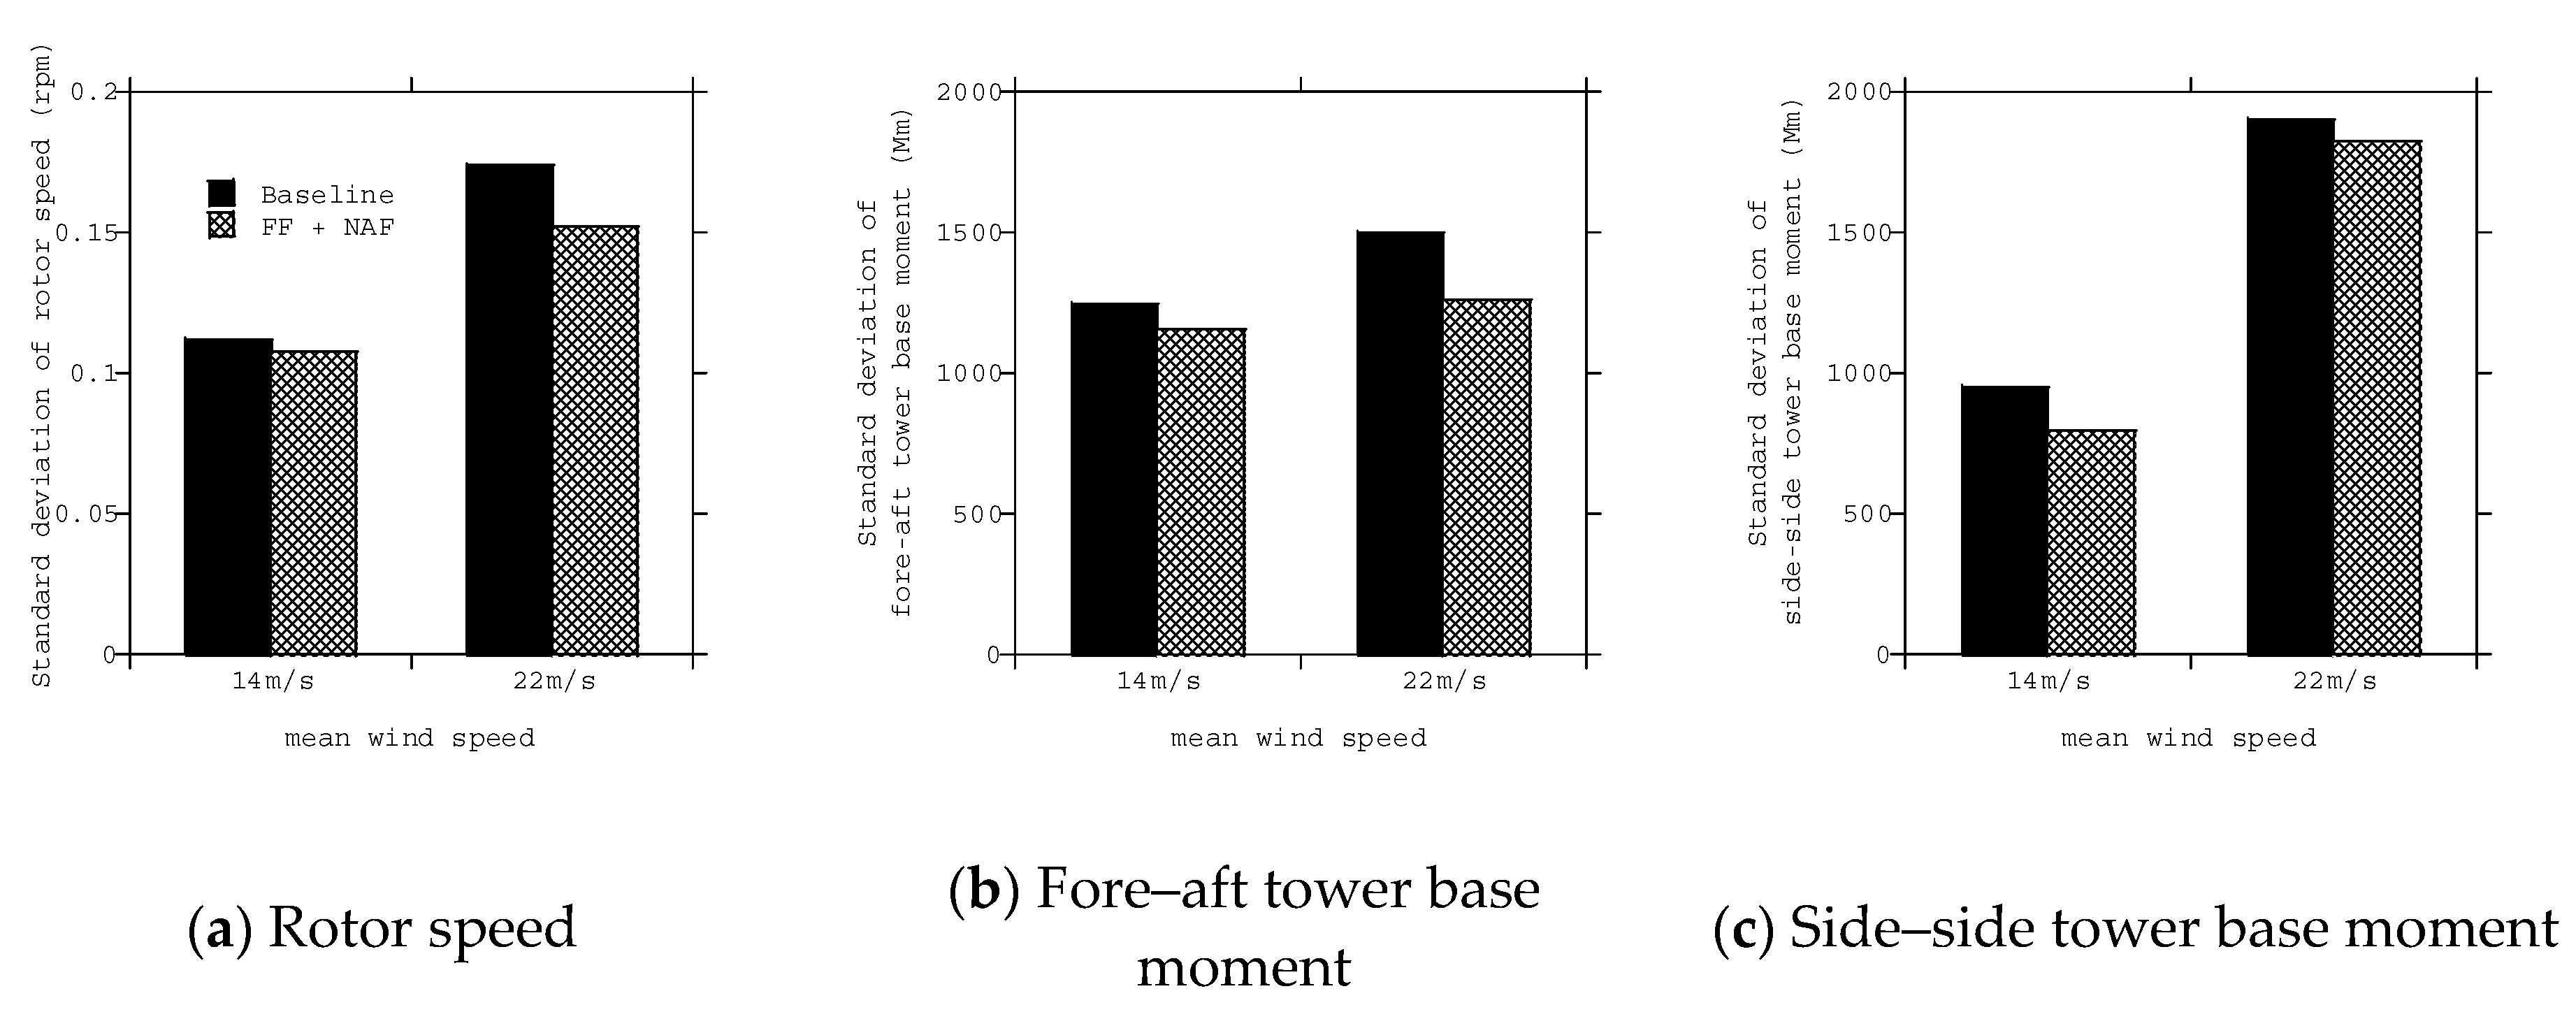
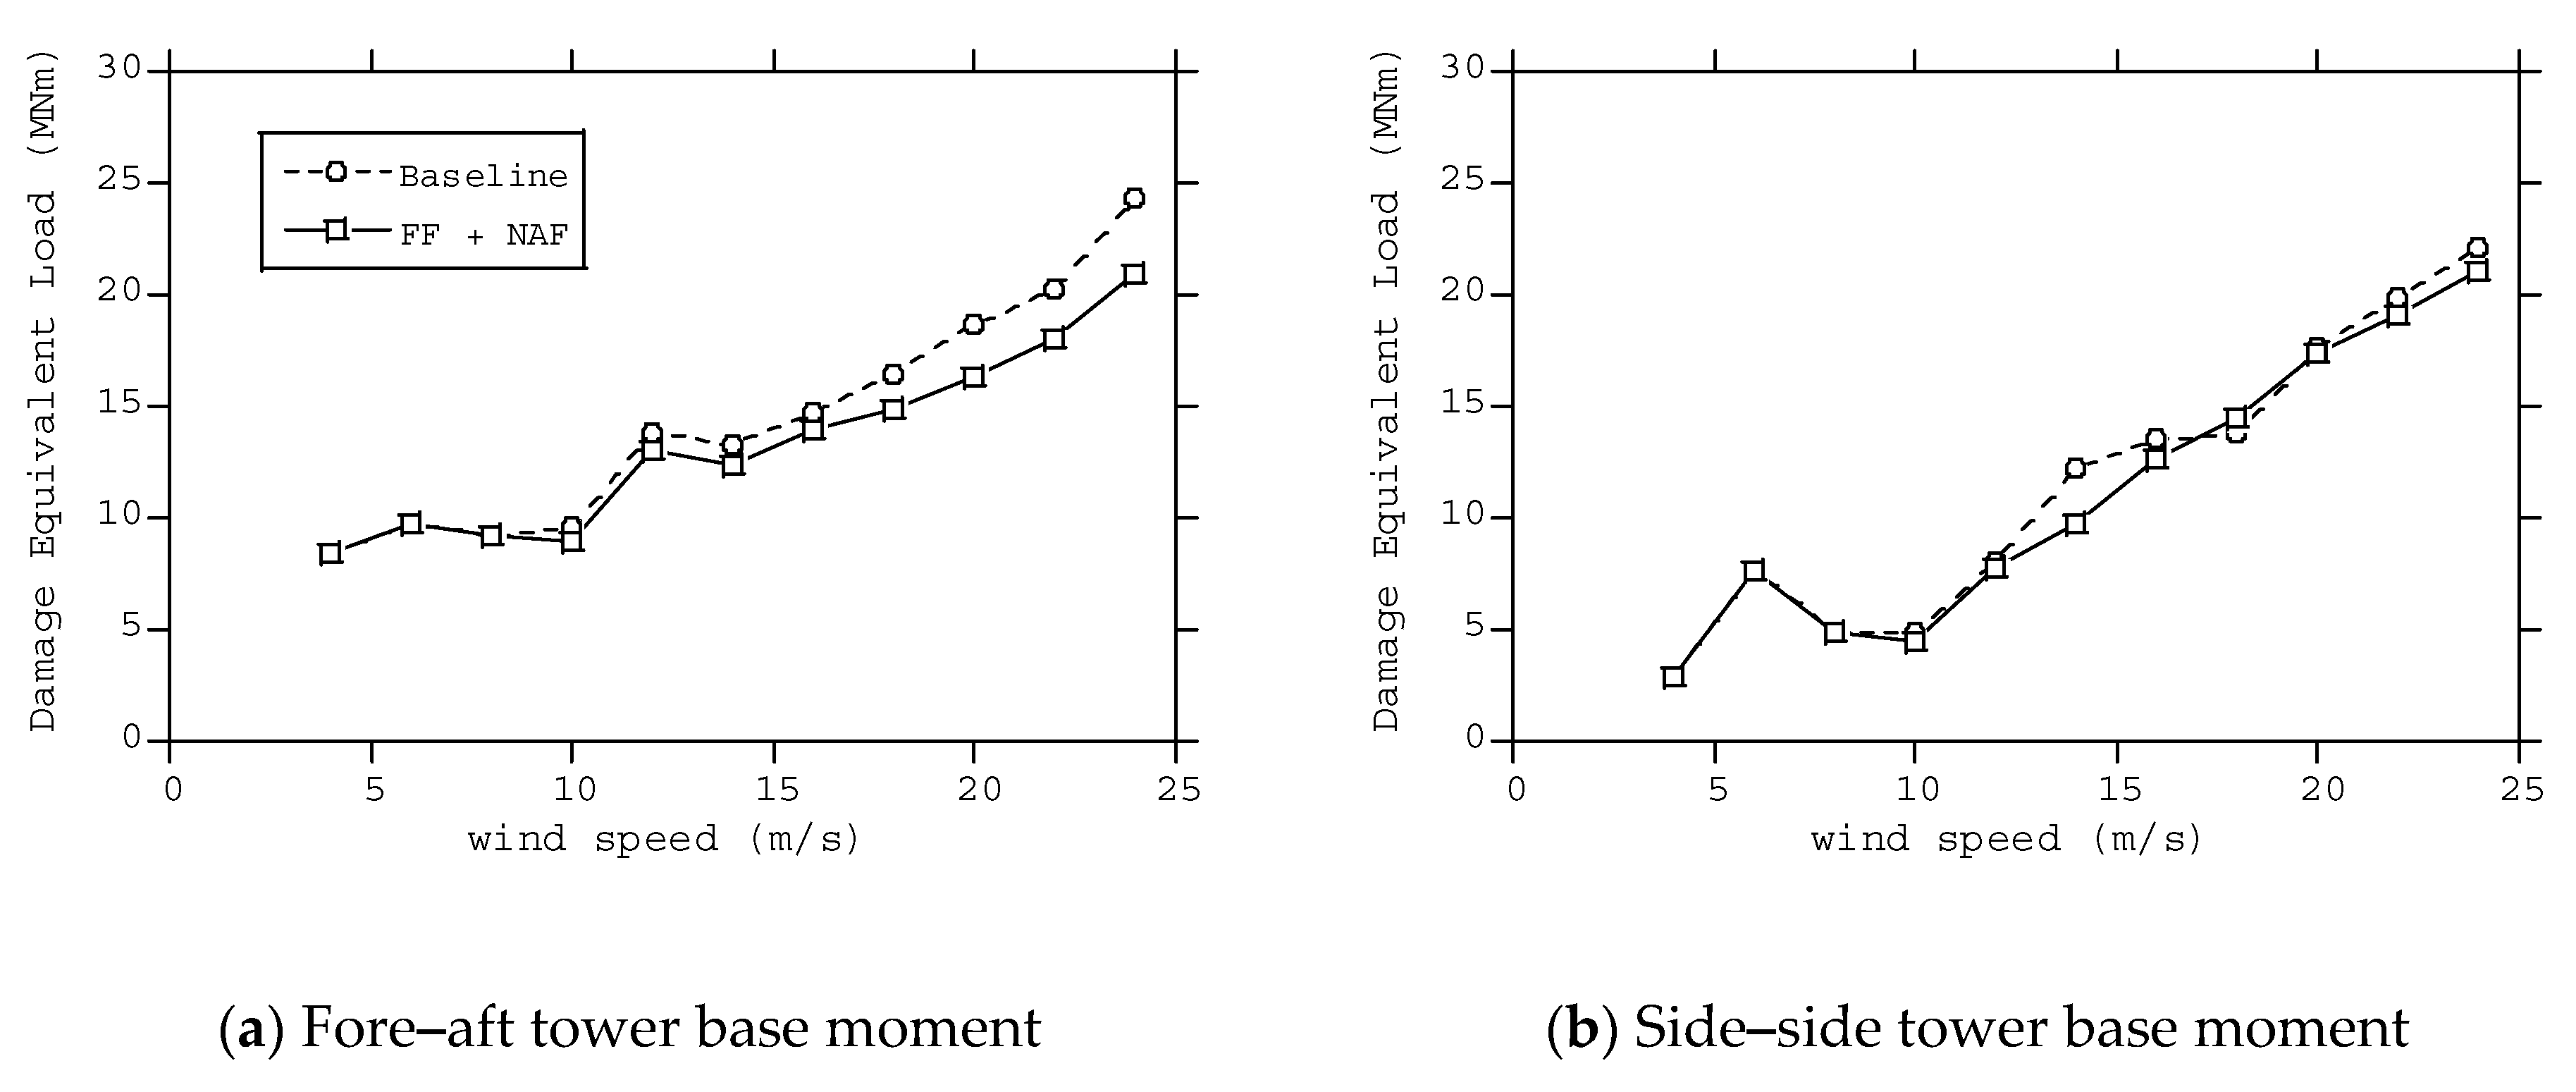
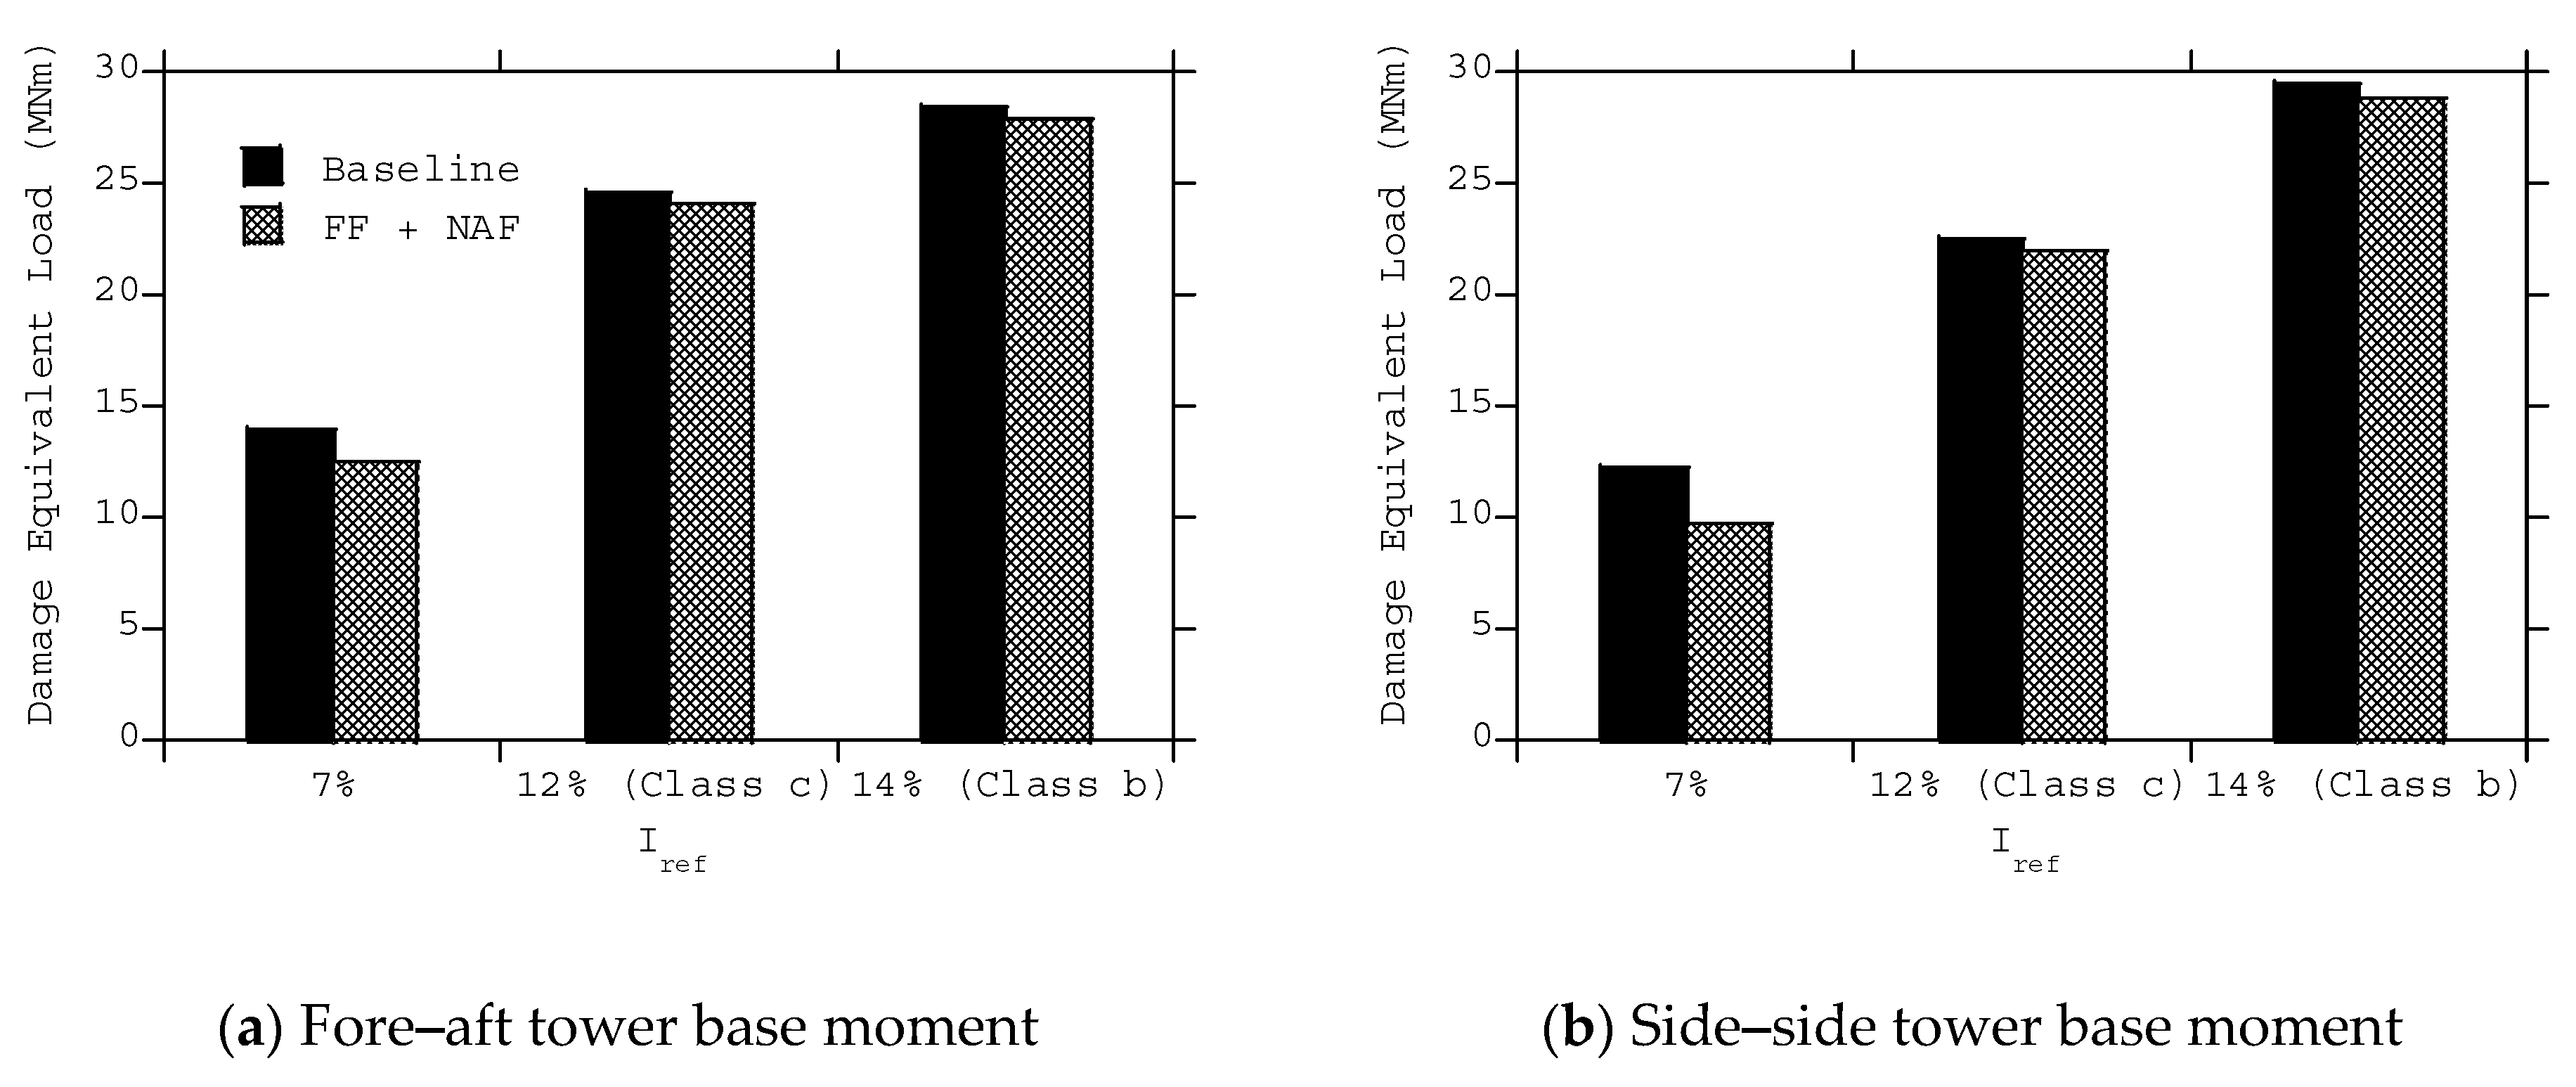
3.3. Effect of a Combined Feedback and Feedforward Controller

As discussed in Section 3.2, the lidar-based feedforward control increases the fluctuating load at the tower first mode frequency. On the other hand, the nacelle acceleration feedback control can mitigate the fluctuating load at the tower first modal frequency. In this study, the performance of the combined nacelle acceleration feedback and lidar-based feedforward control is investigated. The responses of the wind turbine under turbulent wind fields with a mean wind speed of 14 m/s are calculated by using the baseline controller and the combined nacelle acceleration feedback and lidar-based feedforward controller. Figure 15 shows the comparison of the power spectrum density of the rotor speed and fore–aft tower base moment. The combined controller shows similar characteristics as the feedforward controller shown in Figure 11, but the fluctuating tower base fore–aft moment at the tower first modal frequency is significantly reduced when compared to the feedforward controller. It is shown that the nacelle acceleration feedback control and the lidar-based feedforward control work at different frequency ranges, and a simple combination of these two types of controller gives the best performance.
The reduction in the fluctuations in the tower base moment and rotor speed for different wind speeds is also investigated. Figure 16 shows the fluctuating component of the rotor speed, fore–aft tower base moment and side–side tower base moment at mean wind speeds of 14 m/s and 22 m/s. It is noted that for any wind speed above rated, the combined lidar-based feedforward control and nacelle acceleration feedback control reduces the fluctuation in the rotor speed and loads at the tower base. These results show the effectiveness of the gain values of the nacelle acceleration feedback and lidar-based feedforward controller, although they are based on the linearized system around the design point.
Damage equivalent loads (DEL) [39] for different wind speeds are also calculated. Figure 17 shows the comparison of the DEL at the tower base by using the baseline controller and the combined feedforward and feedback controller (FF + NAF). In region 3, the damage equivalent load can be reduced by using the proposed combined nacelle acceleration feedback and lidar-based feedforward control, where pitch control is activated.
The effects of different turbulent intensities are also investigated. Figure 18 shows the damage equivalent load of the fore–aft and side–side tower base moments by the baseline and combined nacelle acceleration feedback and lidar-based feedforward controllers at a wind speed of 14 m/s. The damage equivalent load increases when the turbulence intensity increases. The proposed combined controller successfully reduces the damage equivalent load of the fore–aft tower base moment for all cases.

4. Conclusions

In this study, different pitch control algorithms are implemented in a wind turbine model, and the effects of the pitch control algorithm on the fluctuating rotor speeds and wind turbine loads are investigated. The following results are obtained:
  • The nacelle acceleration feedback control increases the damping ratio of the first mode of wind turbines, but it also increases the fluctuation in the rotor speed and thrust force, which results in the existence of the optimum gain value.
  • The lidar-based feedforward control reduces the fluctuation in the rotor speed and the thrust force by decreasing the fluctuating wind load on the rotor, which results in less fluctuating load on the tower.
  • The combination of the nacelle acceleration feedback control and the lidar-based feedforward control successfully reduces both the response of the tower first mode and the fluctuation in the rotor speed at the same time.

Author Contributions

Conceptualization, T.I.; formal analysis, I.Y. and A.Y.; investigation, A.Y. and I.Y.; visualization, A.Y. and I.Y.; writing—original draft preparation, A.Y.; writing—review and editing, T.I.; project administration, T.I. funding acquisition, T.I. All authors have read and agreed to the published version of the manuscript.

Funding

This research received no external funding.

Acknowledgments

A part of this research is supported by New Energy and Industrial Technology Development Organization (NEDO), Japan. The authors wish to express their deepest gratitude to the concerned parties for their assistance during this study.

Conflicts of Interest

The authors declare no conflict of interest.

References

  1. Bossanyi, E.A. The design of closed loop controllers for wind turbines. Wind Energy 2000, 3, 149–163. [Google Scholar] [CrossRef]
  2. Jonkman, J.; Butterfield, S.; Musial, W.; Scott, G. Definition of a 5-MW Reference Wind Turbine for Offshore system Development; Technical Report NREL/TP-500-38060; National Renewable Energy Laboratory: Golden, CO, USA, 2009.
  3. Hansen, M.H.; Hansen, A.; Larsen, T.J.; Sorensen, S.O.; Fuglsang, P. Control Design for a Pitch-Regulated, Variable-Speed Wind Turbine; Risø-R-1500(EN); Risø National Laboratory: Roskilde, Denmark, 2005.
  4. Yoshida, S. Variable speed-variable pitch controllers for aero-servo-elastic simulations of wind turbine support structures. J. Fluid Sci. Technol. 2011, 6, 300–312. [Google Scholar] [CrossRef] [Green Version]
  5. Yousefi, I.; Yamaguchi, A.; Ishihara, T. The effect of control on the responses of an offshore wind turbine. In Proceedings of the Grand Renewable Energy 2018, Yokohama, Japan, 17–22 June 2018. [Google Scholar]
  6. Stol, K.A.; Zhao, W.; Wright, A.D. Individual blade pitch control for the controls advanced research turbine (CART). J. Solar Energy Eng. 2006, 128, 498–505. [Google Scholar] [CrossRef]
  7. Zhao, W.; Stol, K. Individual blade pitch for active yaw control of a horizontal-axis wind turbine. In Proceedings of the 45th AIAA Aerospace Sciences Meeting and Exhibit, Reno, NV, USA, 8–11 January 2007; p. 1022. [Google Scholar]
  8. Sarkar, S.; Chen, L.; Fitzgerald, B.; Basu, B. Multi-resolution wavelet pitch controller for spar-type floating offshore wind turbines including wave-current interactions. J. Sound Vib. 2020, 470, 115170. [Google Scholar] [CrossRef]
  9. Kristalny, M.; Madjidian, D.; Knudsen, T. On using wind speed preview to reduce wind turbine tower oscillations. IEEE Trans. Control Syst. Technol. 2013, 21, 1191–1198. [Google Scholar] [CrossRef] [Green Version]
  10. Nam, Y.; Kien, P.T.; La, Y.H. Alleviating the tower, mechanical load of multi-MW wind turbines with LQR control. J. Power Electron. 2013, 13, 1024–1031. [Google Scholar] [CrossRef] [Green Version]
  11. De Battista, H.; Ricardo, J.M.; Christiansen, C.F. Dynamical sliding mode power control of wind driven induction generators. IEEE Trans. Energy Convers. 2000, 15, 451–457. [Google Scholar] [CrossRef]
  12. Fleming, P.; Wingerden, J.W.; Wright, A. Comparing state-space multivariable controls to multi-siso controls for load reduction of drivetrain-coupled modes on wind turbines through field-testing. In Proceedings of the 50th AIAA Aerospace Sciences Meeting including the New Horizons Forum and Aerospace Exposition, Nashville, TN, USA, 9–12 January 2012; p. 1152. [Google Scholar]
  13. Gao, R.; Gao, Z. Pitch control for wind turbine systems using optimization, estimation and compensation. Renew. Energy 2016, 91, 501–515. [Google Scholar] [CrossRef]
  14. Kong, X.; Ma, L.; Liu, X.; Abdelbaky, M.A.; Wu, Q. Wind Turbine Control Using Nonlinear Economic Model Predictive Control over All Operating Regions. Energies 2020, 13, 184. [Google Scholar] [CrossRef] [Green Version]
  15. Bossanyi, E.A. Wind turbine control for load reduction. Wind Energy 2003, 6, 229–244. [Google Scholar] [CrossRef]
  16. Leithead, W.E.; Dominguez, S.; Spruce, C. Analysis of tower/blade interaction in the cancellation of the tower fore-aft mode via control. In Proceedings of the European Wind Energy Conference, London, UK, 22–25 November 2004. [Google Scholar]
  17. Jonkman, J.M. Influence of control on pitch damping of a floating wind turbine. In Proceedings of the ASME Wind Energy Symposium, Reno, NV, USA, 7–10 January 2008. [Google Scholar]
  18. Murtagh, P.J.; Ghosh, A.; Basu, B.; Broderick, B.M. Passive control of wind turbine vibrations including blade/tower interaction and rotationally sampled turbulence. Wind Energy 2008, 11, 305–317. [Google Scholar] [CrossRef]
  19. Dinh, V.N.; Basu, B. Passive control of floating offshore wind turbine nacelle and spar vibrations by multiple tuned mass dampers. Struct. Control Health Monit. 2015, 22, 152–176. [Google Scholar] [CrossRef]
  20. Fitzgerald, B.; Sarkar, S.; Staino, A. Improved reliability of wind turbine towers with active tuned mass dampers (ATMDs). J. Sound Vib. 2018, 419, 103–122. [Google Scholar] [CrossRef]
  21. Scholbrock, A.; Fleming, P.; Schilpf, D.; Wright, A.; Johnson, K.; Wang, N. Lidar-enhanced wind turbine control: Past, Present and Future. In Proceedings of the 2016 American Control Conference, Boston, MA, USA, 6–8 July 2016. [Google Scholar]
  22. Wright, A.D.; Fingersh, L.J. Advanced Control Design for Wind Turbines Part I: Control Design, Implementation, and Initial Tests; Technical Report NREL/TP-500-42437; National Renewable Energy Laboratory: Golden, CO, USA, 2008.
  23. Dunne, F.; Pao, L.C.; Wright, A.D.; Jonkman, B.; Kelley, N.; Smiley, E. Adding feedforward blade pitch control for load mitigation in wind turbines: Non-Causal Series Expansion, Preview Control, and Optimized FIR Filter Methods. In Proceedings of the 49th AIAA Aerospace Sciences Meeting including the New Horizons Forum and Aerospace Exposition, Orlando, FL, USA, 2–7 January 2011. [Google Scholar]
  24. Dunne, F.; Smiley, E.; Pao, L.C. LIDAR Wind Speed Measurement Analysis and Feed-Forward Blade Pitch Control for Load Mitigation in Wind Turbines; NREL/SR-5000-52098; National Renewable Energy Laboratory: Golden, CO, USA, 2011.
  25. Dunne, F.; Pao, L.C. Optimal blade pitch control with realistic preview wind measurements. Wind Energy 2016, 19, 2153–2169. [Google Scholar] [CrossRef]
  26. Holger, F.; Schlipf, D.; Latour, M.I.; Cheng, P.W. Design and evaluation of a Lidar-based feedforward controller for the INNWIND. EU 10 MW wind turbine. In Proceedings of the Science & Research Abstract for EWEA 2015 Annual Event, Paris, France, 17–20 November 2015. [Google Scholar]
  27. Schlipf, D.; Schlipf, D.J.; Kühn, M. Nonlinear model predictive control of wind turbines using LIDAR. Wind Energy 2013, 16, 1107–1129. [Google Scholar] [CrossRef]
  28. Ungurán, R.; Petrović, V.; Boersma, S.; van Wingerden, J.W.; Pao, L.Y.; Kühn, M. Feedback-feedforward individual pitch control design for wind turbines with uncertain measurements. In Proceedings of the 2019 American Control Conference (ACC), Philadelphia, PA, USA, 29 August 2019. [Google Scholar]
  29. Selvam, K.; Kanev, S.; van Wingerden, J.W.; van Engelen, T.; Verhaegen, M. Feedback–feedforward individual pitch control for wind turbine load reduction. Robust Nonlinear Control 2009, 19, 72–91. [Google Scholar] [CrossRef] [Green Version]
  30. Verwaal, N.W.; van der Veen, G.J.; van Wingerden, J.W. Predictive control of an experimental wind turbine using preview wind speed measurements. Wind Energy 2015, 18, 385–398. [Google Scholar] [CrossRef]
  31. Koerber, A.; King, R. Combined feedback–feedforward control of wind turbines using state- constrained model predictive control. IEEE Trans. Control Syst. Technol. 2013, 21, 1117–1128. [Google Scholar] [CrossRef]
  32. Schlipf, D.; Pao, L.Y.; Cheng, W. Comparison of feed-forward and model predictive control of wind turbines using Lidar. In Proceedings of the 51st IEEE conference on decision and control, Maui, HI, USA, 10–13 December 2012. [Google Scholar]
  33. Wang, N.; Johnson, K.E.; Wright, A.D. FX-RLS-based feedforward control for LIDAR-enabled wind turbine load mitigation. IEEE Trans. Control Syst. Technol. 2012, 20, 1212–1222. [Google Scholar] [CrossRef]
  34. Evans, M.E.; Cannon, M.; Kouvaritakis, B. Robust MPC tower damping for variable speed wind turbines. IEEE Trans. Control Syst. Technol. 2015, 23, 290–296. [Google Scholar] [CrossRef]
  35. Yamaguchi, A.; Sarli, P.W.; Ishihara, T. Extreme load estimation of the wind turbine tower during power production. Wind Eng. 2019. Prepublished. [Google Scholar] [CrossRef]
  36. Jonkman, J.M.; Buhl, M.L., Jr. FAST User’s Guide; NREL/TP-500-38230; National Renewable Energy Laboratory: Golden, CO, USA, 2005.
  37. Jonkman, J.M.; Buhl, M.L., Jr. TurbSim User’s Guide; NREL/TP-500-39797; National Renewable Energy Laboratory: Golden, CO, USA, 2006.
  38. IEC61400-1. Wind Turbines-Part 1: Design Requirements, 3rd ed.; International Electrotechnical Commission: Geneva, Switzerland, 2008. [Google Scholar]
  39. Freebury, G.; Musial, W. Determining Equivalent Damage Loading for Full-Scale Wind Turbine Blade Fatigue Tests. In Proceedings of the 19th American Society of Mechanical Engineers (ASME) Wind Energy Symposium, Reno, NV, USA, 10–13 January 2000. [Google Scholar]
Figure 1. The wind turbine used in this study.
Energies 13 04558 g001
Figure 2. Measured turbulence intensity at hub height.
Energies 13 04558 g002
Figure 3. Definition of the regions.
Energies 13 04558 g003
Figure 4. Block diagram of the baseline pitch controller used in this study.
Energies 13 04558 g004
Figure 5. Block diagram of the nacelle acceleration feedback control.
Energies 13 04558 g005
Figure 6. Block diagram of the lidar-based feedforward control.
Energies 13 04558 g006
Figure 7. Variation of the feed forward gain q f f = q ( s ) / P ( s ) with the reference wind speed u 0
Energies 13 04558 g007
Figure 8. Free decay test by using the nacelle acceleration feedback controller.
Energies 13 04558 g008
Figure 9. Comparison of theoretical and actual damping ratios of the nacelle acceleration feedback controller for different gain values G t o w .
Energies 13 04558 g009
Figure 10. The standard deviation of fore–aft tower base moments for the baseline controller and the nacelle acceleration feedback (NAF) controller with different gain values under turbulent wind fields with a mean wind speed of 14 m/s.
Energies 13 04558 g010
Figure 11. The power spectrum of (a) rotor speeds and (b) tower base moments for the baseline controller and the nacelle acceleration feedback (NAF) controller with different gain values under turbulent wind fields with a mean wind speed of 14 m/s.
Energies 13 04558 g011
Figure 12. Comparison of the power spectrum of (a) rotor speeds and (b) tower base moments obtained by the baseline controller and the lidar-based feedforward controller.
Energies 13 04558 g012
Figure 13. Comparison of the standard deviation of the rotor speed and fore–aft tower base moment for different wind measurement strategies when the mean wind speed is 14 m/s.
Energies 13 04558 g013
Figure 14. Comparison of standard deviation of (a) rotor speed, (b) fore–aft tower base moment and (c) side–side tower base moment for different feedforward gain values when the mean wind speed is 22 m/s.
Energies 13 04558 g014
Figure 15. Comparison of the power spectrum of (a) rotor speeds and (b) tower base moments obtained by the baseline controller and the combined feedforward and feedback controller (FF + NAF).
Energies 13 04558 g015
Figure 16. Comparison of standard deviation of the (a) rotor speed, (b) fore–aft tower base moment and (c) side–side tower base moment for different wind speeds obtained by the baseline controller and the combined feedforward and feedback controller (FF + NAF).
Energies 13 04558 g016
Figure 17. Comparison of damage equivalent load of the (a) fore–aft tower base moment and (b) side–side tower base moment for different mean wind speeds obtained by the baseline controller and the combined feedforward and feedback controller (FF + NAF).
Energies 13 04558 g017
Figure 18. Comparison of damage equivalent load of the (a) fore–aft tower base moment and (b) side–side tower base moment for different turbulent intensities at a mean wind speed of 14 m/s obtained by the baseline controller and the combined feedforward and feedback controller (FF + NAF).
Energies 13 04558 g018
Table 1. Specifications of the Choshi 2.4 MW wind turbine.
Rated capacity2.4 MW
Hub height80 m
Rotor diameter ( 2 R )92 m
Pitch controlPitch to feather
Rotor speedVariable speed (9–15 rpm)
Rated wind speed13 m/s
Optimum tip speed ratio8.2
Cp at the optimum tip speed ratio0.47
Cut-in wind speed4 m/s
Cut-out wind speed25 m/s

