Abstract
Various pulse decay methods are proposed to test tight cores. These methods can be divided into three types. This study compares the performance of these methods to test the permeability of unconventional cores in terms of homogeneous cores, dual-medium cores, and gas adsorption, including the pressure equilibrium time, possible errors caused by conventional analysis methods, and reflections on the characteristics of dual-media. Studies shows that the two test methods with an antisymmetric relationship in the boundary conditions have basically identical test performance. When testing homogeneous cores, regardless of whether the gas is adsorptive or not, the pressure equilibrium time of the first type of method is approximately half of that of the second type of method. The dual-medium parameters seriously affect the pressure equilibrium time of different methods, which may cause the difference of order of magnitude. For homogeneous cores, the permeability errors of the first and second types of methods caused by porosity errors are similar and larger than that of the third type of method. For dual media, the fracture permeability obtained by the third type of method using the conventional analysis method may differ from the actual value by tens of times. No method can significantly eliminate the sorption effect. When the core is a dual-medium, only the pressure curves of the upstream positive-pulse method, downstream negative-pulse method and one-chamber method can reflect the characteristics of dual media. The pressure derivative of the one-chamber method cannot reflect the characteristics of dual media at the early time. The pressure derivative of the second type and the upstream positive-pulse downstream negative-pulse method can reflect the complete characteristics of dual media, but their pressure derivative of the constant-slope segment is small, and the interporosity flow parameter may not be identified.
1. Introduction
Permeability is the key parameter that characterizes the ability of the formation to pass fluids, and it is of great significance to the development of oil and gas reservoirs. The conventional method of measuring permeability of underground formations is via taking core samples. For low-permeability cores, the test time of the conventional steady-state is too long, and the accuracy required for the flowrate measurement is too high. It is difficult to satisfy the requirements of permeability measurement for low-permeability cores. At present, the measurement of the permeability of low-permeable cores mainly uses the pulse decay method proposed by Brace [1]. Unlike the steady-state method, this method does not need to measure the flow rate, but it measures the pressure with time and analyzes the transient change in pressure to evaluate the core permeability. The device of this method is simple, and the test time is short. It has good adaptability to low-permeability cores. The analysis method of the pulse decay test proposed by Brace [1] ignored compressive storage. Later, Hsieh et al. [2] proposed a general analytical solution for pulse decay tests. When their solutions tend to extreme situations, they can obtain the results of the corresponding special cases. Jones [3] obtained a practical analysis method by simplifying the analytical solution of Hsieh et al. [2]. This method is currently widely used. However, these methods are based on a homogeneous model.
In the past two decades, unconventional oil and gas such as coalbed methane, shale gas, and tight oil and gas have been rapidly developed, which makes the measurement of tight core permeability increasingly important [4,5,6]. Experiments of Chen and Liu [7] and Alnoaimi et al. [8,9] have found that unconventional cores show strong heterogeneity, and the flow-back phenomenon has been encountered in pulse decay tests. Therefore, the conventional analysis method is not always suitable for analyzing the pulse decay test data of unconventional cores. As early as in the 1990s, Kamath et al. [10] and Ning et al. [11] studied the pulse decay test of cores with a penetrating fracture and established a simplified analysis method. Jia et al. [12,13,14] studied the pulse decay test of cores with cracks and holes through experiments and numerical simulations. Liu et al. [15] and Cronin et al. [16] proposed simplified methods to analyze the results of the pulse decay test of shale cores from the dual-medium model and dual-permeability model, respectively. Han et al. [17,18] systematically analyzed the pulse decay test of heterogeneous cores with dual-medium models and proposed a method using pressure derivatives to identify dual-medium cores. In addition, coal rock, shale, etc. have strong adsorption to methane, carbon dioxide, nitrogen, etc. [19,20,21], and conventional analysis methods do not consider the effect of gas adsorption. Cui et al. [22] first considered the gas adsorption effect by modifying the porosity and extended the conventional analysis method to the case of gas adsorption. Han et al. [23] considered the effect of the adsorbed phase volume based on Cui’s method and proposed the pressure derivative method to analyze the pulse decay test of nonequilibrium adsorption situations.
The key of the Brace [1] method is to obtain the core permeability by analyzing the transient pressure. The transient pressure can be formed under different conditions, so different pulse decay test methods can be proposed. The method used by Brace [1] is to connect two vessels of similar volumes to two ends of the core and apply pressure pulses in the upstream vessel. Akkutlu and Fathi [24] generated pressure pulses in the upstream pressure vessel by reducing the downstream pressure to a constant value. Zoback and Byerlee [25], Metwallly and Sondergeld [26], Tinni et al. [27], Heller et al. [28], etc. adopted the opposite method to Akkutlu and Fathi [24], where they applied a constant-pressure pulse in an upstream vessel. However, Yang et al. [29] only used one vessel, which was thought to be able to obtain more accurate results based on the permeability errors caused by the errors of the vessel volume and pore volume. Feng et al. [30] used vessels of equal volume in upstream and downstream and applied positive and negative pulses of equal amplitude to the upstream and downstream, respectively. They believed that this method could eliminate the effects of gas adsorption. However, there is currently no comparison of the performance of different pulse decay methods. In particular, for unconventional cores, the advantages and disadvantages of various methods are unknown.
We have summarized various pulse decay methods currently used for cylindrical cores and compared these methods in three cases. When the core is a homogeneous medium, the pressure equilibrium time and effect of the porosity error on the accuracy of the permeability measurement by different test methods are compared. When the core is a dual-medium core, the pressure equilibrium time, ability of different methods to reflect the characteristics of the dual media, and errors introduced by the conventional analysis method are compared. For the case of strong gas adsorption, the effects of gas adsorption on the pressure equilibrium time and permeability test results are also compared.
2. Testing Methods
Most of the device for the pressure pulse decay test is generally composed of upstream and downstream vessels and a core holder, but a few devices only use one vessel (Figure 1).
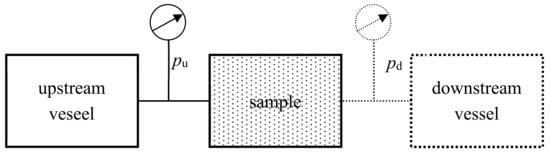
Figure 1.
Schematic diagram of devices for the pulse decay tests.
The method of the experiment is to first seal the cylindrical core in the core holder, inject the fluid into the test system and wait for the pressure of the experiment system to reach equilibrium. At the beginning of the test, a pressure pulse is applied to the vessel, and the permeability of the core is evaluated by measuring the pressure in the vessel over time. Usually, the upstream and downstream vessels have similar volumes. However, some researchers make the volume of one vessel much larger than the volume of another vessel, so the pressure of the larger vessel can be kept approximately constant during the test. According to the pulse application schemes and number of vessels, there are eight pulse decay methods (Figure 2):
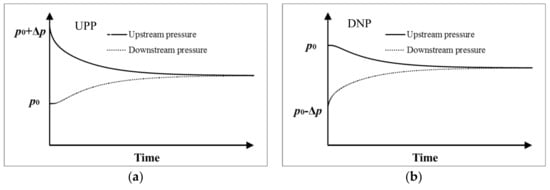
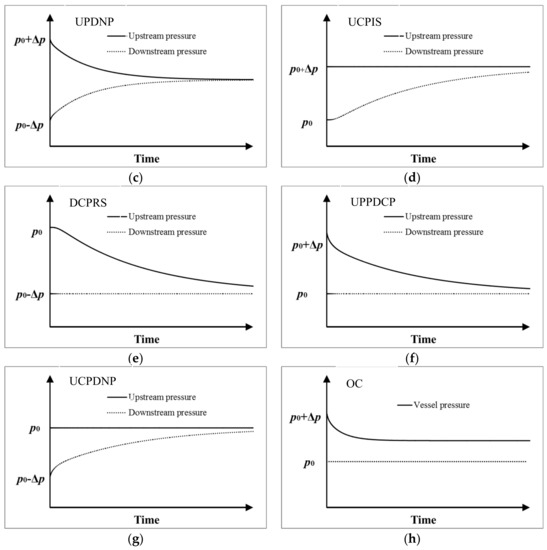
Figure 2.
Schematic diagram of different test methods: (a) upstream positive-pulse (UPP); (b) downstream negative-pulse (DNP); (c) upstream positive- and downstream negative-pulse (UPDNP); (d) upstream constant-pressure increase step (UCPIS); (e) downstream constant-pressure reduction step (DCPRS); (f) upstream positive-pulse and downstream constant-pressure (UPPDCP); (g) upstream constant-pressure and downstream negative-pulse (UCPDNP); (h) one-chamber (OC). (p0 is the initial equilibrium pressure, and Δp is the pressure pulse applied in the upstream or downstream vessel).
- upstream positive-pulse (UPP);
- downstream negative-pulse (DNP);
- upstream positive- and downstream negative-pulse (UPDNP);
- upstream constant-pressure increase step (UCPIS);
- downstream constant-pressure reduction step (DCPRS);
- upstream positive-pulse and downstream constant-pressure (UPPDCP);
- upstream constant-pressure and downstream negative-pulse (UCPDNP);
- one-chamber (OC).
Since the OC method uses only one vessel, there is only upstream pressure in Figure 2h. Among them, the boundary conditions of UPP and DNP, UCPIS and DCPRS, UPPDCP and UCPDNP have antisymmetric relations. According to the boundary conditions, these methods can be divided into three types. The first type of method uses two vessels, and the upstream and downstream pressures change with time, including UPP, DNP, UPDNP; the second type of method has one vessel with constant pressure and another vessel with changing pressure, including UCPIS, DCPRS, UPPDCP, PUCPDNP; the third type of method is OC.
3. Test Performance on Homogeneous Media
3.1. Model of the Pulse Decay Test for Homogeneous Cores and Its Analytical Solution
The mathematical models of the pulse decay methods for homogeneous medium cores are linear. Based on the analytical solution of Hsieh et al. [2], the analytical solution of pressure dynamics of different test methods can be given through the superposition principle. The exponential factors in the pressure dynamic analytical solutions of these methods are consistent with the three types of test methods. This feature affects the performance of these methods.
3.1.1. Upstream Positive-Pulse Method
The dimensionless governing equation of the pulse decay test for homogeneous cores is as follows [31]:
where pD is the dimensionless pressure; tD is the dimensionless time; xD is the dimensionless coordinate along the sample, which takes the upstream vessel as the origin. For the upstream positive-pulse method, the initial conditions and boundary conditions are as follows:
where puD and pdD are the dimensionless pressures of the upstream and downstream vessels, respectively; Au and Ad are the storativity ratios of the pore volume to the upstream and downstream vessels, respectively. The dimensionless quantities in these equations are defined as follows:
where pu and pd are the pressures of the upstream and downstream vessels, respectively (Pa); t is the time (s); x is the coordinate along the sample, which takes the upstream vessel as the origin (m); L is the length of the sample (m); Vu, Vd and Vp are the volumes of the upstream vessel, downstream vessel and the sample pore, respectively (m3); ct and cL are the sample total compressibility and compressibility of the testing fluids (Pa−1); cVd and cVu are the compressibilities of the upstream and downstream vessels, respectively (Pa−1); k is the permeability (m2); φ is the porosity; μ is the viscosity (Pa∙s).
Through Laplace transformation, the analytical solution of the pressure dynamics of the model can be obtained as [2]:
where θm is the m-th positive root of the following equation about θ [2].
The pressures of the upstream and downstream vessels can be obtained as follows [2]:
3.1.2. Downstream Negative-Pulse Method
The governing equations and boundary conditions of various pulse decay methods are linear, so the principle of superposition can be used. By exchanging the pressure of the upstream and downstream vessels and subtracting the exchanged pressure from the unit pressure, we can obtain the pressure of the downstream negative-pulse method as follows:
3.1.3. Upstream Positive- and Downstream Negative-Pulse Method
The pressure of the UPDNP method is equivalent to the average value of the pressure of the UPP method and DNP method. Therefore, the upstream and downstream pressures are:
3.1.4. Upstream Constant-Pressure Increase Step Method
When Ad/Au = ∞, the upstream vessel is infinite, which implies that the upstream pressure is constant. Therefore, from the pressure dynamics solution of the UPP method, the downstream pressure solution of the UCPIS method can be obtained as:
where θm is the m-th positive root of the following equation about θ.
3.1.5. Downstream Constant-Pressure Reduction Step Method
By exchanging the upstream and downstream vessels of the UCPIS method and subtracting the exchanged pressure from the unit pressure, we can obtain the upstream pressure solution of the DCPRS method as follows [2]:
where θm is the m-th positive root of the following equation about θ.
3.1.6. Upstream Positive-Pulse and Downstream Constant-Pressure Method
When Au/Ad = ∞, the downstream vessel is infinite, which implies that the downstream pressure is constant. Therefore, the upstream pressure of the UPPDCP method can be obtained from the pressure dynamics analytical solution of the UPP method as follows [2]:
where θm is the m-th positive root of the following equation about θ.
3.1.7. Upstream Constant-Pressure and Downstream Negative-Pulse Method
By exchanging the upstream and downstream vessels of the UPPDCP method and subtracting the exchanged pressure from the unit pressure, the analytical solution of the downstream pressure of the UCPDNP method can be obtained as follows:
where θm is the m-th positive root of the following equation about θ.
3.1.8. One-Chamber Method
When Au/Ad = 0, it is equivalent to only a single upstream vessel. Therefore, the upstream pressure solution of the OC method can be obtained from the analytical pressure solution of the UPP method as follows [2,29]:
where θm is the m-th positive root of the following equation about θ.
3.2. Pressure Equilibrium Time
Assume that when the difference between upstream and downstream dimensionless pressures is 10−4, the upstream and downstream pressures reach equilibrium. The required dimensionless equilibrium time for homogeneous cores is shown in Figure 3, which increases when the vessel volume increases (Au and Ad decrease). The pressure equilibrium time can be divided into three types according to the same method of dynamic pressure analytical solution. The methods of the same type have similar pressure equilibrium time. The second type of method has the longest equilibrium time, followed by the equilibrium time of the first type of method, which is approximately half of that of the second type of method. The pressure equilibrium time of the first and second types of methods is greatly affected by the size of the vessels, which can change the order of magnitude. The OC method requires the shortest test time. Its pressure equilibrium time is less affected by the size of the vessels. When the vessel is large, the equilibrium time of the OC method is much shorter than other methods. When the volume of the vessel decreases, the testing time of the OC method is similar to that of the first type of method.
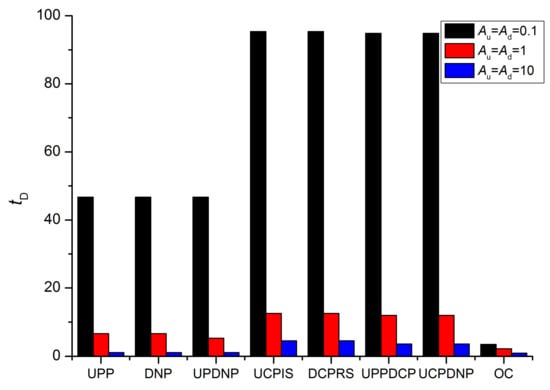
Figure 3.
Pressure equilibrium times for homogeneous cores.
3.3. Effect of the Porosity Error on the Permeability Precision
The sample size can be very accurately measured by vernier caliper or liquid drainage method. The vessel volume and pore volume can be measured using helium gas based on the Boyle principle. However, for tight cores such as unconventional cores, it is difficult to accurately measure the porosity. As a result that the core is tight and the pore size is very small, it is difficult to ensure complete gas pressure equilibrium, so the measurement error of the pore volume is generally large. This may cause errors that cannot be ignored. According to the classification of analytical solutions of the pressure dynamic for different methods, the effect of the porosity error on permeability can be correspondingly divided into three types. Figure 4 shows the permeability error caused by the measurement error of porosity. The error is defined as follows:
where kerror is the permeability determined based on the porosity with errors (m2), and kr is the true permeability (m2). In each type of method, one method is selected as a representative and shown in the figure. The permeability error increases when the porosity error increases. The error of the OC method is always smaller than that of the methods with two vessels. The first and second types of methods have relatively similar errors, and the error of the UPP method is slightly larger than that of the UCPIS method. If the error of porosity does not exceed 50%, the error of permeability is generally less than 100%. If the vessel volume is much smaller than the pore volume of the sample, all methods have similar errors.
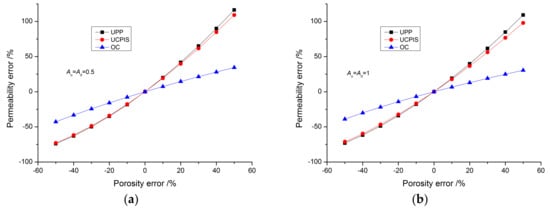
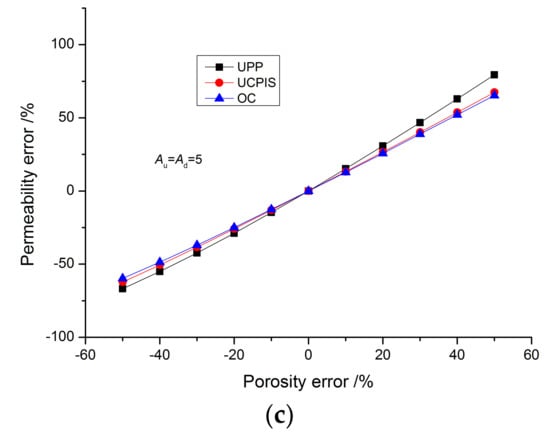
Figure 4.
Effect of the porosity error on the permeability precision: (a) Au = Ad = 0.5; (b) Au = Ad = 1; (c) Au = Ad = 5.
4. Identification of Dual Media
4.1. Characteristics of Pressure Curves
Han et al. [17,18] studied the difference between pressure and pressure derivative of the pulse decay test for dual-permeability media and dual-porosity media, and found that they have only a small difference. Therefore, the dual-porosity medium is selected as the representative for analysis here. We used the numerical simulation method of Han et al. [17,18]. The pressure curve of the dual-medium core with different test methods is shown in Figure 5, where λ is the interporosity flow coefficient and ω is the storativity ratio. The pressure curves of the UPP, DNP and OC methods have two plateaus (as shown in Figure 5, when Au = Ad = 10, 0.2 < tD < 10, and tD > 2 × 10⁴), which reflects the dual-medium characteristics. Moreover, for a smaller vessel volume (larger Au and Ad), this feature is more significant. The pressure curves of other methods do not have obvious dual-medium characteristics. In another word, the shape of their pressure curve is similar to that of a homogeneous medium.
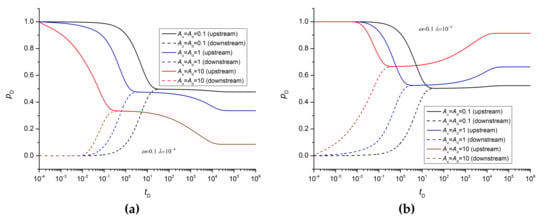
Figure 5.
Pressure curves of dual-medium cores for different pulse decay methods: (a) UPP; (b) DNP; (c) UPDNP; (d) UCPIS; (e) DCPRS; (f) UPPDCP; (g) UCPDNP; (h) OC.
4.2. Characteristics of Pressure Derivative Curves
The pressure derivative method proposed by Han et al. [17] was used to analyze the pulse decay test of dual-medium cores. The pressure derivative here actually refers to the absolute value of the pressure derivative, which can help identify the dual-medium and facilitate the fitting of model parameters. As a result that the upstream and downstream pressure derivative curves of the UPP, DNP and UPDNP methods generally coincide, other methods have only upstream or downstream pressure derivatives, so only one pressure derivative curve is selected for later analysis. The boundary conditions of the three pairs of methods (UPP and DNP, UCPIS and DCPRS, UCPDNP and UPPDCP) are antisymmetric. In Figure 6, the pressure derivatives of each pair coincide with each other. Therefore, the subsequent analysis must only select one of the methods from each pair. The pressure curves of the UCPIS, DCPRS, UPPDCP, and UCPDNP methods do not have obvious dual-medium characteristics. However, their pressure derivative curves is similar to that of the UPP method, which have the characteristics of pressure derivative plateaus (for the DCPRS method, Au = Ad = 10, 0.1 < tD < 10) and constant-slope straight line sections (for the DCPRS method, Au = Ad = 10, 300 < tD < 10,000) for dual media. The duration of the early pressure derivative plateau increases with the increase of the vessel volume (increase of Au and Ad). However, the value of the derivative pressure decreases with the increase of the vessel volume.
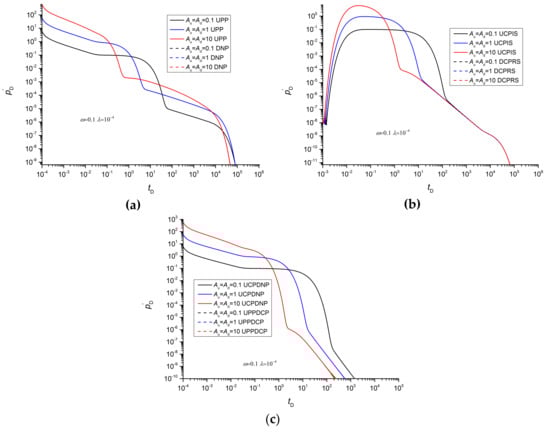
Figure 6.
Coincident pressure derivative curves of different methods: (a) UPP vs. DNP; (b) UCPIS vs. DCPRS; (c) UCPDNP vs. UPPDCP.
Figure 7 shows a comparison of the pressure derivative curves of the UPP and UPDNP methods. The effects of the vessel volume, interporosity flow coefficient, and storativity ratio on the pressure derivatives of the UPP and UPDNP methods have the same law. In the early stage (Figure 7a, tD < 0.1), the pressure derivative of the UPDNP method was slightly smaller than that of the UPP method. The early pressure is only affected by the upstream boundary conditions. However, the definition of dimensionless pressure uses the pressure difference between upstream and downstream vessels, resulting in the upstream dimensionless pressure pulse of the UPDNP method is only half of that of the UPP method. These two curves coincide in the plateau period (Figure 7a, when Au = Ad = 10, 0.1 < tD < 10) and transition period (Figure 7a, when Au = Ad = 10, 10 < tD < 100). In the later period, the slope of the constant-slope straight line segment of the UPDNP method is larger than that of the UPP method, but the UPDNP method has a much smaller pressure derivative than the UPP method. This difference may make the pressure derivative in the later stage of the UPDNP method too small to be identified, which is not conducive to obtaining dual-medium parameters. The storativity ratio has little effect on the pressure derivative in the later period.
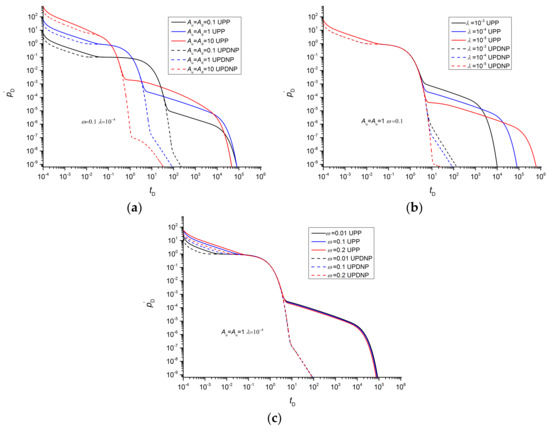
Figure 7.
Comparison of pressure derivative curves between the UPP method and UPDNP method: (a) Au and Ad; (b) interporosity flow coefficient; (c) storativity ratio.
Figure 8 is a comparison of the pressure derivative curves of the UCPIS and UCPDNP methods. The vessel volume, interporosity flow coefficient and storativity ratio have identical effects on the pressure derivatives of the UPP, UCPIS and UCPPD methods. The two methods have consistent pressure derivatives in the plateau period (Figure 8a, when Au = Ad = 10, 0.1 < tD < 10) and transition period (Figure 8a, when Au = Ad = 10, 10 < tD <100). In the later period, the UCPIS method has a larger pressure derivative and a smaller slope of the straight-line segment with constant slope than the UCPDNP method. For the UCPIS method, the pressure derivatives of different vessel volumes coincide at the straight-line segment with constant slope, and the vessel volume only affects the initial time of this segment. However, the initial time and value of the straight-line segment with constant slope of the UCPDNP method are affected by the volume of the vessel.
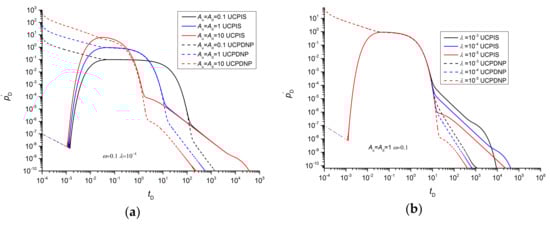
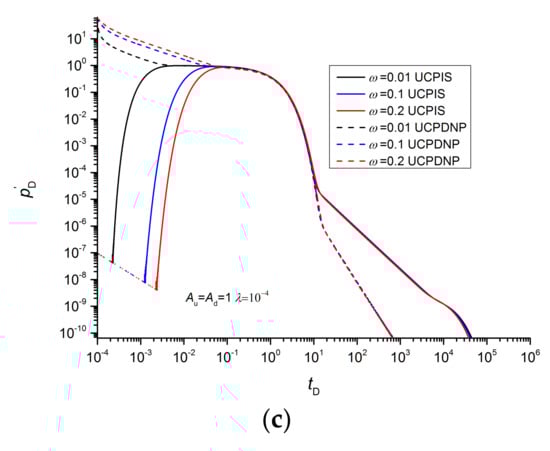
Figure 8.
Comparison of pressure derivative curves between the UCPIS method and UCPDNP method: (a) Au and Ad; (b) interporosity flow coefficient; (c) storativity ratio.
Figure 9a is a comparison of the pressure derivative curves of the UPP and UCPIS methods. These two methods coincide in the plateau period. However, under identical conditions, the UCPIS method has a longer plateau period. Figure 9b is a comparison of the pressure derivative curves of UPP and UCPDNP methods. Their pressure derivative curves coincide in the early stage and plateau period. The plateau period of the UCPDNP method is longer. This is because, compared with the UPP method, the UCPDNP and UCPIS methods have a constant pressure vessel, which is easier to maintain the pressure difference between the upstream and downstream vessels and slow down the time of entering the interporosity flow stage. The UPP method has a larger pressure derivative at the later stage and a smaller slope of the straight-line segment than the UCPIS and UCPDNP methods. However, compared with Figure 7, it can be found that the later pressure derivatives of UCPIS and UCPDNP methods are larger than that of the UPDNP method. Therefore, they can better identify the interporosity coefficient than the UPDNP method but not as well as the UPP method.
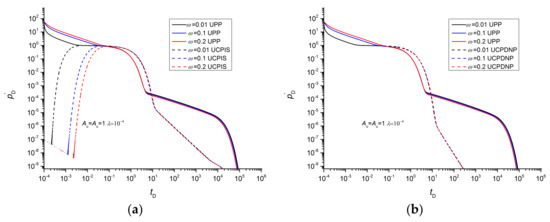
Figure 9.
Comparison of pressure derivative curves of the UPP method, UCPIS method, and UCPDNP method: (a) UPP vs. UCPIS; (b) UPP vs. UCPDNP.
Figure 10 is a comparison of the pressure derivative curve of the UPP method and OC method. The effects of the vessel volume, interporosity flow coefficient, and storativity ratio on the pressure derivative of the OC method and UPP method follow the same law. The pressure derivative curve of the OC method does not have an early plateau segment, which is not conducive to the use of the pressure derivative method to identify dual-medium features in advance. The two methods have relatively similar pressure derivatives, but there is a clear difference between the transition section and the straight-line section with constant slope (0.03 < tD < 104 in Figure 10a). This is because the pressure derivative curve in the early stage is only affected by the upstream vessel, while the OC method is not affected by the downstream vessel in the later stage. The slope of the constant-slope section of OC (Au = Ad = 10, 10 < tD < 104 in Figure 10a) is basically equal to that of UPP, but its value is larger than that of UPP, and its duration is relatively long.
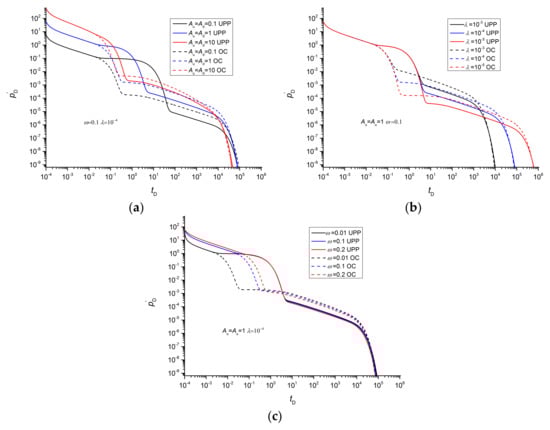
Figure 10.
Comparison of pressure derivative curves between the UPP method and OC method: (a) Au and Ad; (b) interporosity flow coefficient; (c) storativity ratio.
4.3. Effect on the Test Results of the Fracture Permeability
At present, the mainstream analysis method of the pulse decay test uses the homogeneous model. Han et al. [17] shows that for the UPP method, the use of a homogeneous model to analyze dual-medium cores may introduce nonnegligible errors. The error is defined as follows:
where kh is the core permeability obtained by the conventional analysis method based on homogeneous model (m2); kf is the fracture permeability (m2). Firstly, given a permeability and related parameters, the pressure curves of different pulse decay methods are simulated. Then, the conventional analysis method is used to analyze the simulated pressure curve and to determine a permeability. Comparing this permeability with the value set in the simulation, the corresponding error is obtained. Table 1 compares the fracture permeability error of different test methods using a homogeneous model to analyze dual-porosity cores under the conditions of different storativity ratios and interporosity flow coefficients when Au = Ad = 1. The three types of test methods for homogeneous cores remain applicable, and the methods of the same type have basically equal errors. The error of the second type is approximately twice that of the first type. The OC method has a much higher error than the first and second types. The error of the fracture permeability obtained by the OC method is too large and makes the results totally unacceptable. As a result that the OC method has no downstream vessel, its stage dominated by fracture flow is relatively short. Compared with other methods, the semi-logarithmic linear segment of the pressure curve for the OC method is more severely affected by the matrix-fracture interporosity flow.

Table 1.
Fracture permeability error caused by using the homogeneous model for dual-porosity cores (Au = Ad = 1).
4.4. Pressure Equilibrium Time
For dual-porosity cores, the upstream and downstream pressures are considered equilibrated when their dimensionless pressure difference is less than 10−4. When the vessels and core have balanced pressure, it is the final pressure equilibrium. Since only the pressure of upstream and downstream vessels can be measured, taking the dimensionless pressure derivative of 10−9 as the final pressure equilibrium, Figure 11 shows the upstream and downstream pressure equilibrium time of various methods. Unlike homogeneous cores, the upstream and downstream equilibrium time of the dual-medium core can be divided into four groups: UPP, DNP, and UPDNP are the first group; UCPIS and DCPRS are the second group, UPPDCP and UCPDNP are the third group; OC is the fourth group. The upstream and downstream equilibrium times of different methods in each group are basically equal. The upstream and downstream pressure equilibrium times of the second group may be three orders of magnitude higher than that of the first and third groups. The fourth group has slightly lower upstream and downstream equilibrium times than the second group. The third group has approximately twice as long upstream and downstream equilibrium times as the first group. The upstream and downstream pressure equilibrium times slightly decrease with the increase in storativity ratio and sharply increase with the increase in interporosity flow coefficient. When the interporosity flow coefficient is less than 10−5, various methods have similar equilibrium time.
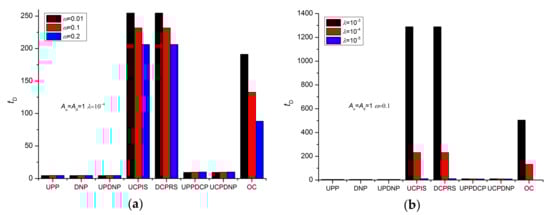
Figure 11.
Upstream and downstream pressure equilibrium times: (a) storativity ratio; (b) interporosity flow coefficient.
The final equilibrium time of different methods is shown in Figure 12, where the dimensionless equilibrium time is a logarithmic coordinate. The final equilibrium time of various methods varies with the interporosity flow coefficient and storativity ratio. In general, except for the OC method, the storativity ratio has a slight effect on the final equilibrium time. From the point of view of the final pressure equilibrium time, these methods can be approximately divided into four groups (Table 2). If the interporosity flow coefficient is small, there may be three orders of magnitude difference in the final equilibrium time of different groups. This result is very different from the law for homogeneous cores. It should be pointed out that the shorter the pressure equilibrium time is, the more difficult it is to determine the interporosity flow coefficient. The pressure equilibrium time of the fourth group is the shortest, but the pressure derivative of its interporosity flow section is the smallest. When the storativity ratio tends to 1 or the interporosity flow coefficient tends to infinity, the dual media tend to become a homogeneous medium. Therefore, the order of the pressure equilibrium time of various methods changes with the dual-medium parameters.
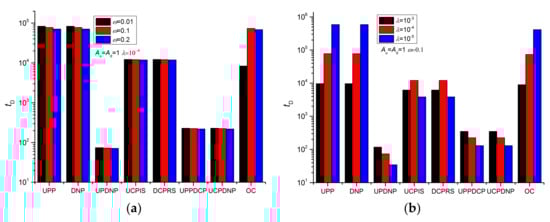
Figure 12.
Final pressure equilibrium time: (a) storativity ratio; (b) interporosity flow coefficient.
Table 2.
Groups of the final equilibrium time.
5. Effect of Gas Adsorption
5.1. Effect on the Pressure Equilibrium Time
To study the performance of the pulse decay test in the presence of gas adsorption, the numerical simulation method of Han et al. [23] was used in this study. Figure 13 shows the pressure equilibrium time considering the gas adsorption effect, where VL is the Langmuir volume [m3/kg] and PL is the pressure, respectively [Pa]. The law of duration order for different test methods is consistent with the homogeneous model. When Au = Ad = 1, the equilibrium time of the first type of method is approximately half of that of the second type of method, while that of the third type of method is about half of that of the first type of method. According to Han et al. [23], the effect of the gas adsorption can be considered by defining an equivalent total compressibility instead of the total compressibility of the homogeneous model. Compared with Figure 3, it can be found that Langmuir pressure and Langmuir volume slightly affect the pressure equilibrium time. The pressure equilibrium time of different test methods does not have consistent variation rules with the change of Langmuir pressure and Langmuir volume.
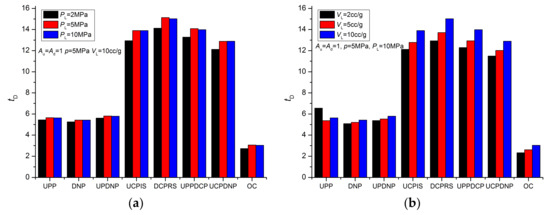
Figure 13.
Effect of gas adsorption on pressure equilibrium time: (a) Langmuir pressure; (b) Langmuir volume.
5.2. Effect on the Test Results of Permeability
When the core is strongly adsorptive to the test gas, if the homogeneous model is used to analyze the test data, it will introduce errors to the permeability. Since Han et al. [23] have analyzed the effects of gas adsorption parameters and test parameters on the analysis results of the permeability, this study only compares the effects of gas adsorption on various test methods. Figure 14 shows that the effect of gas adsorption on the permeability of different test methods. The influence of gas adsorption on different test methods conforms to the three-type classification method of the homogeneous model. The error of each type of methods is relatively similar. The error increases in the order of the first to third type of methods. When the pore volume is close to the vessel volume, the error of the first type of method is less than 10%; the error of the second type of method is less than 20%, and the error of the third type of method is generally less than 30%. The error increases when the Langmuir volume increases. The effect of Langmuir pressure on the error is not monotonous, because the relationship between Langmuir pressure and the adsorption amount is nonlinear. The UPDNP method cannot eliminate the effects of gas adsorption as reported by Feng et al. [30].
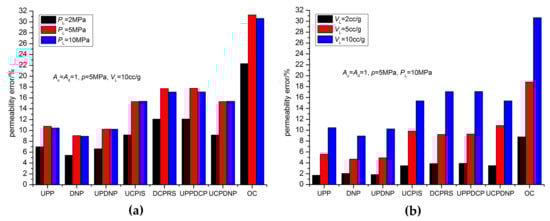
Figure 14.
Permeability error caused by gas adsorption: (a) Langmuir pressure; (b) Langmuir volume.
6. Discussion
Reports on the comparison of experimental results of different methods are very scarce. Almost all studies choose a single method for testing. Yang et al. [29] simultaneously used the OC method and the UPP method to test the same tight cores under different pressure conditions, and the difference in permeability between these two methods was less than 10%. Through theoretical analysis, the same conclusion as this study is obtained, that is, for homogeneous cores, the result of the OC method is the most accurate.
Metwally and Sondergel [26] conducted a comparative test between the UCPIS method and the UPP method. The experimental results show that the pressure equilibrium time of the UCPIS method is approximately twice that of the UPP method, which is consistent with the theoretical analysis in this study. The difference in permeability obtained by these two methods is almost below 30%. They believe that the UCPIS method can make the pressure distribution more uniform, so it can eliminate the effect of gas sorption. However, the analysis in this study shows that, in fact, the UCPIS method cannot eliminate this effect.
Tinni et al. [27] and Heller et al. [28] used the UCPIS method, Akkutlu and Fathi, [24] used the DCPRS method to test the permeability of shale cores. The shape of the pressure curves shown in their articles is consistent with the prediction in this study, and none of them can show the characteristics of dual media.
Feng and Pandey [6] conducted a comparative simulation analysis of the UPP, DNP, UPDNP and UCPIS methods. For the pressure equilibrium time of the homogeneous cores, the same conclusion as this study is obtained. Both experiments and theories prove that the equilibrium pressure of the UPDNP method is basically equal to the initial pressure. Therefore, Feng and Pandey [6] believe that the UPDNP method can eliminate the gas sorption effect. However, our study shows that the sorption effect cannot be eliminated in the UPDNP method.
Alnoaimi et al. [8,9], Aljamaan et al. [19], and Cronin [16] used the UPP method to carry out the pulse decay test of shale cores, and the pressure curves of the experiments all showed dual-medium characteristics. Han et al. [17,18] used the dual-medium model to fit the pressure and pressure derivative data of these experiments, and the fitting results are very good. These experiments and theoretical studies are consistent with the conclusions of this study.
A comprehensive experimental work is required to thoroughly compare these methods. In order for this work to be carried out successfully and effectively, many parameters need to be studied and a proper experimental design is required. Although we have used the method of theoretical analysis to compare these methods, experimental comparison is our follow-up research work.
For homogeneous cores, regardless of whether the test gas is adsorptive, the OC method is the best in terms of test accuracy and test time. For dual-medium cores, the UPP method and DNP method are the best in terms of facilitating the identification of dual-medium characteristics, and the UCPIS method and DCPRS method are slightly inferior to them. These methods make it easier to obtain complete dual-medium parameters through a longer test time. If it is difficult to determine the core properties in advance, the UPP method and DNP method are the best choices.
7. Conclusions
Various pulse decay test methods for tight cores can be divided into three types according to boundary conditions. This study compares the influence of relevant parameters on these methods in determining the unconventional core permeability. The study found that the method pairs with boundary conditions of the antisymmetric relation have basically identical test performance.
When the core is a homogeneous medium or adsorptive to the testing gas, the pressure equilibrium time of the third type of method is the shortest, and the pressure equilibrium time of the first type of method is approximately half of that of the second type of method. When the core is a dual-medium core, the pressure equilibrium time will be seriously affected by the parameters of the dual-medium model. The pressure equilibrium time of different methods is different in order of magnitude. The sequence of pressure equilibrium time of different methods changes with the change in dual-medium parameters, and the pressure equilibrium time of the same type of methods also varies.
When using a homogeneous model to analyze unconventional cores, for the same type of method, the porosity error, dual-medium characteristics, and gas adsorption affect the permeability accuracy approximately the same. The error of porosity has almost the same effect on the permeability accuracy of the first and second types of methods and has a smaller effect on that of the third type of method, and the permeability error is generally within 100%. The permeability accuracy of these three types of methods sequentially increases due to the effects of the dual-medium characteristics and gas adsorption. For dual media, the third type of method cannot obtain acceptable fracture permeability, and may cause errors of tens of times. Unlike the conclusions in the literature, no methods can eliminate the effects of gas adsorption. When the pore volume is close to the vessel volume, the error of the first type of method caused by gas adsorption is within 10%, the second type of method is within 20%, and the third type of method is basically less than 30%.
When the core is dual media, only the pressure curves of the UPP, DNP, and OC methods can reflect the characteristics of dual media. The pressure derivative curves coincide for method pairs whose boundary conditions are antisymmetric. The pressure derivatives of the same type of methods coincide in the plateau and transition periods. The second type of method has a longer pressure derivative plateau, which is helpful for the early identification of dual-media using the pressure derivative method; however, the third type of method lacks a pressure derivative plateau. The pressure derivatives of the third type and the UPDNP method coincide at the early and late stages, and they have parallel and similar constant-slope straight line segments. The pressure derivative of this segment is large, which is helpful for fitting the interporosity flow coefficient. The second type of method and the UPDNP method have small constant-slope straight line segments of pressure derivative, especially the UPDNP method. Their interporosity flow coefficients may not be identified.
Author Contributions
Conceptualization, G.H. and X.L.; methodology, G.H. and X.L.; formal analysis, G.H.; investigation, G.H. and J.H.; writing—original draft preparation, G.H.; writing—review and editing, X.L.; visualization, J.H.; funding acquisition, G.H. and X.L. All authors have read and agreed to the published version of the manuscript.
Funding
This research was funded by the National Natural Science Foundation of China, grant number 11602276 and the National Key R&D Program of China, grant number 2018YFC1504801, 2018YFC1504902.
Conflicts of Interest
The authors declare no conflict of interest.
References
- Brace, W.F.; Walsh, J.B.; Frangos, W.T. Permeability of granite under high pressure. J. Geophys. Res. 1968, 73, 2225–2236. [Google Scholar] [CrossRef]
- Hsieh, P.A.; Tracy, J.V.; Neuzil, C.E.; Bredehoeft, J.D.; Silliman, S.E. A transient laboratory method for determining the hydraulic properties of ‘tight’ rocks-I. Theory. Int. J. Rock Mech. Min. Sci. Geomechnics Abstr. 1981, 18, 245–252. [Google Scholar] [CrossRef]
- Jones, S.C. A technique for faster pulse-decay permeability measurements in tight rocks. SPE Form. Eval. 1997, 12, 19–25. [Google Scholar] [CrossRef]
- Civan, F.; Rai, C.S.; Sondergeld, C.H. Shale-gas permeability and diffusivity inferred by improved formulation of relevant retention and transprot mechanisms. Transp. Porous Media 2011, 86, 925–944. [Google Scholar] [CrossRef]
- Civan, F.; Rai, C.S.; Sondergeld, C.H. Determining shale permeability to gas by simultaneous analysis of various pressure tests. SPE J. 2012, 17, 717–726. [Google Scholar] [CrossRef]
- Feng, R.; Pandey, R. Invetigation of various pressure transient techniques on permeability measurement of unconventional gas reservoirs. Transp. Porous Media 2017, 120, 495–514. [Google Scholar] [CrossRef]
- Chen, H.; Liu, H.H. Pressure pulse-decay tests in a dual-continuum medium: An improved technique to estimate flow parameters. J. Nat. Gas Sci. Eng. 2019, 65, 16–24. [Google Scholar] [CrossRef]
- Alnoaimi, K.R.; Duchateau, C.; Kovscek, A.R. Characterization and measurement of multiscale gas transport in shale-core samples. SPE J. 2016, 21, 573–588. [Google Scholar] [CrossRef]
- Alnoaimi, K.R.; Kovscek, A.R. Influence of microcracks on flow and storage capacities of gas shales at core scale. Transp. Porous Media 2019, 127, 53–84. [Google Scholar] [CrossRef]
- Kamath, J.; Boyer, R.E.; Nakagawa, F.M. Characterization of core-scale heterogeneities using laboratory pressure transients. SPE Form. Eval. 1992, 7, 219–227. [Google Scholar] [CrossRef]
- Ning, X.; Fan, J.; Holditch, S.A.; Lee, W.J. The measurement of matrix and fracture properties in naturally fractured cores. In Proceedings of the Low Permeability Reservoirs Symposium, Denver, CO, USA, 26–28 April 1993. [Google Scholar] [CrossRef]
- Jia, B.; Tsau, J.S.; Barati, R. Evaluation of core heterogeneity effect on pulse-decay experiment. In Proceedings of the International Symposium of the Society of Core Analysts, Vienna, Austria, 27 August–1 September 2017. [Google Scholar]
- Jia, B.; Tsau, J.; Barati, R. Experimental and numerical investigations of permeability in heterogeneous fractured tight porous media. J. Nat. Gas Sci. Eng. 2018, 58, 216–233. [Google Scholar] [CrossRef]
- Jia, B.; Tsau, J.; Barati, R.; Zhang, F. Impact of Heterogeneity on the transient gas flow process in tight rock. Energies 2019, 12, 3559. [Google Scholar] [CrossRef]
- Liu, H.; Lai, B.; Chen, J.; Georgi, D. Pressure pulse-decay tests in a dual-continuum medium: Late-time behavior. J. Petrol. Sci. Eng. 2016, 147, 292–301. [Google Scholar] [CrossRef]
- Cronin, M.B. Core-scale Heterogeneity and Dual-Permeability Pore Structure in the Barnett Shale. Ph.D. Thesis, The University of Texas, Austin, TX, USA, 2014. [Google Scholar]
- Han, G.; Sun, L.; Liu, Y.; Zhou, S. Analysis method of pulse decay tests for dual-porosity cores. J. Nat. Gas Sci. Eng. 2018, 59, 274–286. [Google Scholar] [CrossRef]
- Han, G.; Chen, Y.; Liu, M.; Liu, X. Differences in performance of models for heterogeneous cores during pulse decay tests. Appl. Sci. 2019, 9, 3206. [Google Scholar] [CrossRef]
- Aljamaan, H.; Al Ismail, M.; Kovscek, A.R. Experimental investigation and Grand Canonical Monte Carlo simulation of gas shale adsorption from the macro to the nano scale. J. Nat. Gas Sci. Eng. 2017, 48, 119–137. [Google Scholar] [CrossRef]
- Lin, K.; Huang, X.F.; Zhao, Y.P. Combining image recognition and simulation to reproduce the adsorption/desorption behaviors of shale gas. Energy Fuels 2020, 34, 258–269. [Google Scholar] [CrossRef]
- Zhou, S.; Ning, Y.; Wang, H.; Liu, H.; Xue, H. Investigation of methane adsorption mechanism on Longmaxi shale by combining the micropore filling and monolayer coverage theories. Adv. Geo-Energy Res. 2018, 2, 269–281. [Google Scholar] [CrossRef]
- Cui, X.; Bustion, A.M.M.; Bustion, R.M. Measurements of gas permeability and diffusivity of tight reservoir rocks: Different approaches and their applications. Geofluids 2009, 9, 208–223. [Google Scholar] [CrossRef]
- Han, G.; Chen, Y.; Liu, X. Investigation of analysis methods for pulse decay tests considering gas adsorption. Energies 2019, 12, 2562. [Google Scholar] [CrossRef]
- Akkutlu, I.Y.; Fathi, E. Multiscale gas transport in shales with local kergen heterogeneities. SPE J. 2012, 1002–1011. [Google Scholar] [CrossRef]
- Zoback, M.D.; Byerlee, J.D. Permeability and effective stress. AAPG Bull. 1975, 59, 154–158. [Google Scholar] [CrossRef]
- Metwally, Y.M.; Sondergeld, C.H. Measuring low permeabilities of gas-sands and shales using a pressure transmission technique. Int. J. Rock Mech. Min. 2011, 48, 1135–1144. [Google Scholar] [CrossRef]
- Tinni, A.; Fathi, E.; Agarwal, R.; Sondergeld, C.; Akkutlu, Y.; Rai, C. Shale permebaility measurements on plugs and crushed samples. In Proceedings of the SPE Canadian Unconventional Resources Conference, Calgary, AB, Canada, 30 October–1 November 2012. [Google Scholar] [CrossRef]
- Heller, R.; Vermylen, J.; Zoback, M. Experimental investigation of matrix permeability of gas shales. AAPG Bull. 2014, 98, 975–995. [Google Scholar] [CrossRef]
- Yang, Z.; Sang, Q.; Dong, M.; Zhang, S.; Li, Y.; Gong, H. A modified pressure-pulse decay method for determining permeabilities of tight reservoir cores. J. Nat. Gas Sci. Eng. 2015, 27, 236–246. [Google Scholar] [CrossRef]
- Feng, R.; Liu, J.; Harpalani, S. Optimized pressure pulse-decay method for laboratory estimation of gas permeability of sorptive reservoirs: Part 1-background and numerical analysis. Fuel 2017, 191, 555–564. [Google Scholar] [CrossRef]
- Dicker, A.I.; Smits, R.M. A practical approach for determining permeability from laboratory pressure-pulse decay measurements. In Proceedings of the 1988 SPE International Meeting on Petroleum Engineering, Tianjin, China, 1–4 November 1988. [Google Scholar] [CrossRef]


© 2020 by the authors. Licensee MDPI, Basel, Switzerland. This article is an open access article distributed under the terms and conditions of the Creative Commons Attribution (CC BY) license (http://creativecommons.org/licenses/by/4.0/).