Article

Application of Optimal Energy Management Strategies for a Building Powered by PV/Battery System in Corsica Island

by
Sarah Ouédraogo
,
Ghjuvan Antone Faggianelli
*,
Guillaume Pigelet
,
Jean Laurent Duchaud
and
Gilles Notton
Science for the Environment, University of Corsica, UMR CNRS 6134, 20000 Ajaccio, France
*
Author to whom correspondence should be addressed.
Energies 2020, 13(17), 4510; https://doi.org/10.3390/en13174510
Submission received: 29 July 2020 / Revised: 24 August 2020 / Accepted: 28 August 2020 / Published: 1 September 2020
(This article belongs to the Special Issue Assessment of Photovoltaic-Battery Systems)

Abstract

:
The use of renewable energy sources, and in particular photovoltaics, can effectively reduce the supply of household energy from the main grid, contributing to a more sustainable community. In this paper, several energy management strategies were applied to an existing microgrid with photovoltaic (PV) production and battery storage in view to supply in electricity a building and an electric vehicle located in Ajaccio, France. The purpose was to determine how the choice of a management strategy can impact the cost and the energy share in the microgrid, using the actual electricity tariff in France as well as an over-cost due to the island situation. For some strategies, a forecasting tool was introduced and its influence on the performances of the microgrid was discussed. It appears that the performance of the strategy increased with its complexity and the use of PV forecasting.

1. Introduction

The photovoltaic (PV) market is continuing to increase with, at the end of 2019, a world capacity in DC of 627 GWp [1]. The PV energy produced is considered between 2.6% and 3% of global electricity output today at the world level [1]. As for 2019, the PV solar cell production has increased of around 16% compared to 2018, which led to an estimate of 131 GW [2].
The variable and random character of the solar resource (which is added to the uncertainties on the load side) makes the PV production difficult to manage and requires specific actions to balance the system. The integration of PV systems into an electrical network intensifies the complexity of the grid management [3,4,5,6], and today, it is recognized that this main drawback could be offset by the simultaneous development of:
  • Energy storage systems;
  • Smart electrical grid with an optimization of the energy and power management;
  • Forecasting methods for renewable production and user consumption.
On the other hand, using renewable energies, and particularly, PV, can effectively reduce the residential power supply from the main grid [7] and allows the production of onsite energy vectors using renewable power, contributing to a more sustainable community [8,9]. However, energy generation intermittency and load variability can cause unstable power supply and high peak load [10]. Moreover, the expected massive adoption of Electric Vehicles (EVs) can lead to a considerable increase of the peak load of the electricity demand [11], but can also be considered as fundamental parts of a smart grid, being capable of providing valuable services to power systems [12].
One solution consists in synchronizing the need in electrical consumption with the solar production, as the consumption of the residential sector is less synchronized with the PV production. Energy Storage (ES) can also be envisaged in view to make the consumption and production out of phase [13]. It can be a good opportunity to economize electricity coming from the grid when the electricity price is the highest (if the electricity tariff varies during the day) or to inject the electricity produced to the grid when the community has the highest needs with a higher selling price. The decrease of storage prices can make its utilization attractive. In non-interconnected areas, such as islands [6], from a community point of view, the self-consumption with storage is already a cheaper alternative than the fuel local production (the electricity production cost in islands can sometimes reach more than 10-times the selling price).
Such homes using their own electrical grid integrating PV system, storage, and optimal energy management are called “home microgrids” [14] or “smart-households” [15]. Thus, it appears that increasing the photovoltaic energy share in the electrical microgrid has several advantages in terms of energy reduction and self-production, as well as environmental impact. However, the development of new strategies of energy management is needed to reach the objective of cost reduction and security of energy supply.
The following bibliography, a non-exhaustive one, provides an overview on these optimal managements in microgrids using photovoltaic production, energy storage, and, in some studies, EV charge/discharge utilization.
Some energy management systems (EMS) schedule the operation of household appliances without storage [16] or with a battery storage [17] under a real-time electricity pricing depending on the power demand, which is forecasted and reported to the utility [18]. A schedule of household appliances in smart homes can be applied depending on price variations as well as consumer usage [19] or external conditions [20]. More complex management systems use a two-stage algorithm. The first stage consists in optimally scheduling the battery charging/discharging based on the forecasted solar power, and the second stage consists of managing the actual battery charging/discharging based on actual solar power output [14,21]. Erdinc [22] studied a mixed-integer linear programming (MILP) for a smart household with EVs with bidirectional power charging/discharging and V2H (Vehicle to Home) operating modes, ESSs, and a small-scale distributed generation (DG). Wu et al. [23,24] studied a similar system, taking into account different time horizons for the optimization, the battery prices, types, and control modes of EVs. For a microgrid with PV, battery, and hydrogen storage, the authors of [25] used an evolutionary algorithm for sizing and a MILP one for scheduling. They applied advanced energy management strategies, which anticipated decisions with respect to storage and compared them to classical rule-based approaches. On the same type of microgrid, Deterministic and Stochastic Model Predictive Control was tested and compared to both Model Predictive Control (MPC) and to a standard Rule Based Control (RBC). The results indicated that the Stochastic MPC showed a good improvement in term of energy savings [26].
An MPC control was implemented in a microgrid in Samso (Denmark) in the frame of a H2020 project [27]. Its utilization conduced to an improvement of 1.6% of the self-supply compared to a naïve control and to an annual energy saving cost reaching 8.2%. A recent review study [28] presented such predictive control methods as a very promising control scheme with several advantages for microgrid applications of different control levels: For each DG, ESS, and load (primary control); for the whole system from a power quality point of view (secondary microgrid control); and for the technical and economic aspects in the electrical market context (tertiary control). In a comprehensive and critical review on microgrid energy management strategies, Zia et al. also presented them as a multiobjective topic dealing with technical, economical, and environmental issues [29].
An operational energy dispatch strategy was applied to a microgrid with PV, battery, and diesel generator in India in order to maximize the local resources and to reduce the peak demand under market energy pricing dynamics [30]. With this strategy, the utilization of the battery increased up to 10%, and the diesel generator part decreased up to 7% with a 10% reduction in levelized cost of energy.
An optimization model based on Demand Response mechanism was presented by the authors of [31] for microgrid energy scheduling with response loads and CCHP (combined cooling, heating and power), PV system, and storage. The objective was to use the highest part of clean energy and to minimize the cost for different electricity price policies.
The consideration of energy market in such models has become an important outcome. In this context, a novel approach for energy management and trading, the so-called transactive energy, was presented by the authors of [32] and has been applied in the Monash Microgrid as a real-world implementation.
An analysis of this short state-of-art on microgrid optimization with PV and storage showed that the objective function or the optimization criteria is the cost of electricity or the energy saving cost, which takes into account the price of the electricity sold by the electricity distributor (and its variation over time, very dependent on countries and energy policy [33]), the capital expense (CAPEX) and operating expense (OPEX) of the microgrid, and the cost of the electricity in excess sent to the electrical grid.
In some recent papers, the cost calculation also integrated the battery lifetime influenced by the operating conditions and thus by the optimal management of energy. Some renewable microgrids have integrated electric vehicles with charge/discharge connected systems. On the two last points, some references are presented below.
An important criterion of optimization of the smart management is the battery lifespan, which depends on the charge/discharge regime and maximum authorized depth of discharge (DoD). It influences the degradation, the operation cost, and the replacement frequency. A control optimization method incorporating a convex battery capacity loss model was developed by Cai et al. [34] to determine the battery ageing cost. The ageing effect of a Li-ion battery (generalizable to other battery type) was also introduced in the optimization strategy based on the minimization of the DC microgrid operating cost [35]. It appears that taking into account the battery degradation cost and islanding responsive demand response incentives influences significantly the operating cost.
The utilization of EVs is increasing, and more and more studies are being conducted on their integration into smart grids. A review on EV technologies, their connectivity, and impacts on the grid, as well as the standards required for their efficient and profitable operation in microgrids, was presented by the authors of [36]. EVs have the potential to provide valuable services to power systems by consuming power or even acting as energy sources [12,37]. Several papers have analyzed different aspects of the integration of EVs in the power grid, focusing on services, optimization, and control aspects [38], computational scheduling methods for the intelligent integration with power systems [39], and issues related to driving patterns and charging behavior [40], as well as forecasting methods [41] to promote the smart managing of the EVs charging operation [42] and its use as mobile storage units via Vehicle-to-Grid (V2G) technologies [43].
It appears clearly that the optimal management of microgrids incorporating photovoltaic production and energy storage is a major topic for researchers and engineers today. More or less complex optimization methods have been used in the literature and continue to be developed.

2. Materials and Methods

2.1. Objectives

The main objective of this paper was to compare different management strategies applied to an existing R&D photovoltaic microgrid supplying in electricity an accommodation building for researchers and students. As the system already exists, the purpose of this paper was not to determine the economical profitability (taking into account CAPEX and OPEX costs) but to determine how the choice of a management strategy can impact the energy share from PV, main grid, etc., and consequently, how it can impact the grid electricity saving and the cost. The introduction in the Energy Management Strategy (EMS) of a production forecasting was discussed, as well as its influence on the performances. The electricity tariff and its variation over a day plays a crucial role in such an optimization, and specific hypothesis based on the French rules were used for the first time. Then, the real cost of electricity production in the Corsica island, partially connected to the mainland grid and using a high share of diesel generators, were taken into account to observe the impact on the optimization.
The paper is structured as follows:
  • A presentation of the existing microgrid with PV generation and storage in the R&D platform PAGLIA ORBA in Ajaccio, Corsica (FRANCE) and of the load to supply;
  • The electricity tariffs in France and the specific assumptions for the Corsican situation;
  • The various EMS strategies with or without a forecasting of production;
  • The results and a comparison in term of energy and cost savings;
  • The perspectives for future works.

2.2. Presentation of the Microgrid

The Sciences for Environment (SPE) laboratory (University of Corsica, France) operates a solar microgrid called PAGLIA ORBA at the neighborhood scale. The platform allows the allocation of Distributed Generation systems (DG), Energy Storage systems (ES), and loads among different microgrids. A typical three-phase microgrid uses a common AC bus and can operate in connected grid or islanded modes. In this paper, we focused on one microgrid with the following systems:
  • 3 DGs: 3 × 17 kW (AC) of PV;
  • 1 ES: 24 × 2 V lead–acid batteries for a total capacity of 70 kWh (DC);
  • 2 loads: An accommodation and an electric vehicle.
The PV modules were integrated on a solar shade structure (Figure 1). This structure supported 3 × 56 monocrystalline silicon modules (SUNPOWER E20), and each module had a peak power of 327 Wp. Each group of 56 modules was connected to an inverter (SMA SUNNY TRIPOWER 17000TL-10) with a maximum efficiency of 98.2% and a maximum AC power of 17 kW.
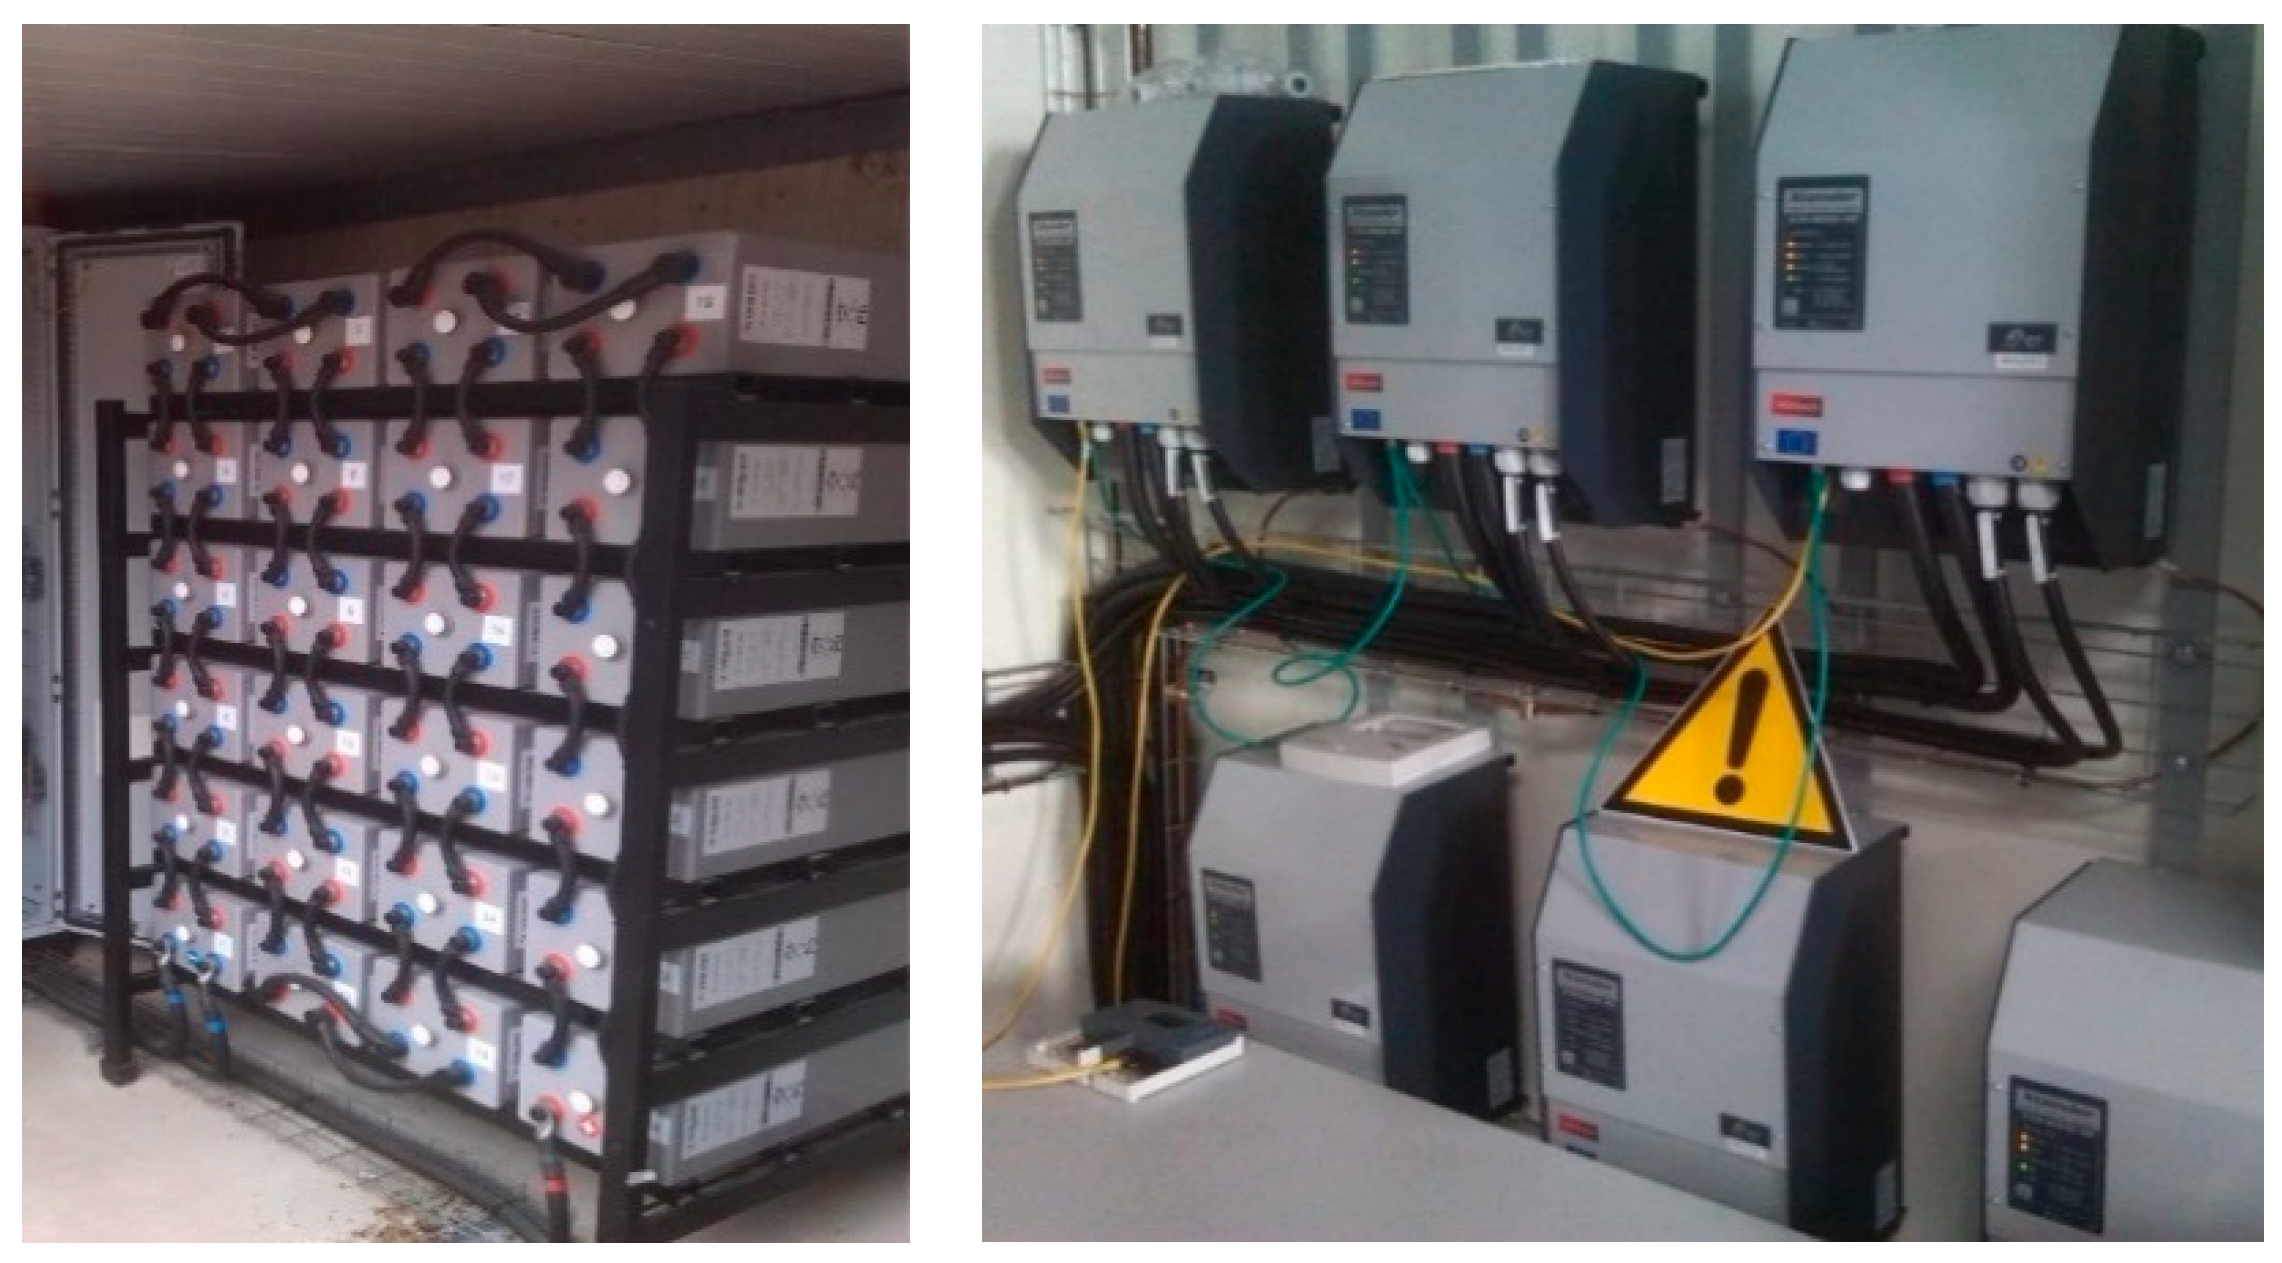
The ES was composed of 24 × 2 V lead–acid batteries (OPzV) connected in series and operated by 6 Xtender inverters/chargers (Figure 2). When fully charged, it represented a total capacity of 70 kWh.
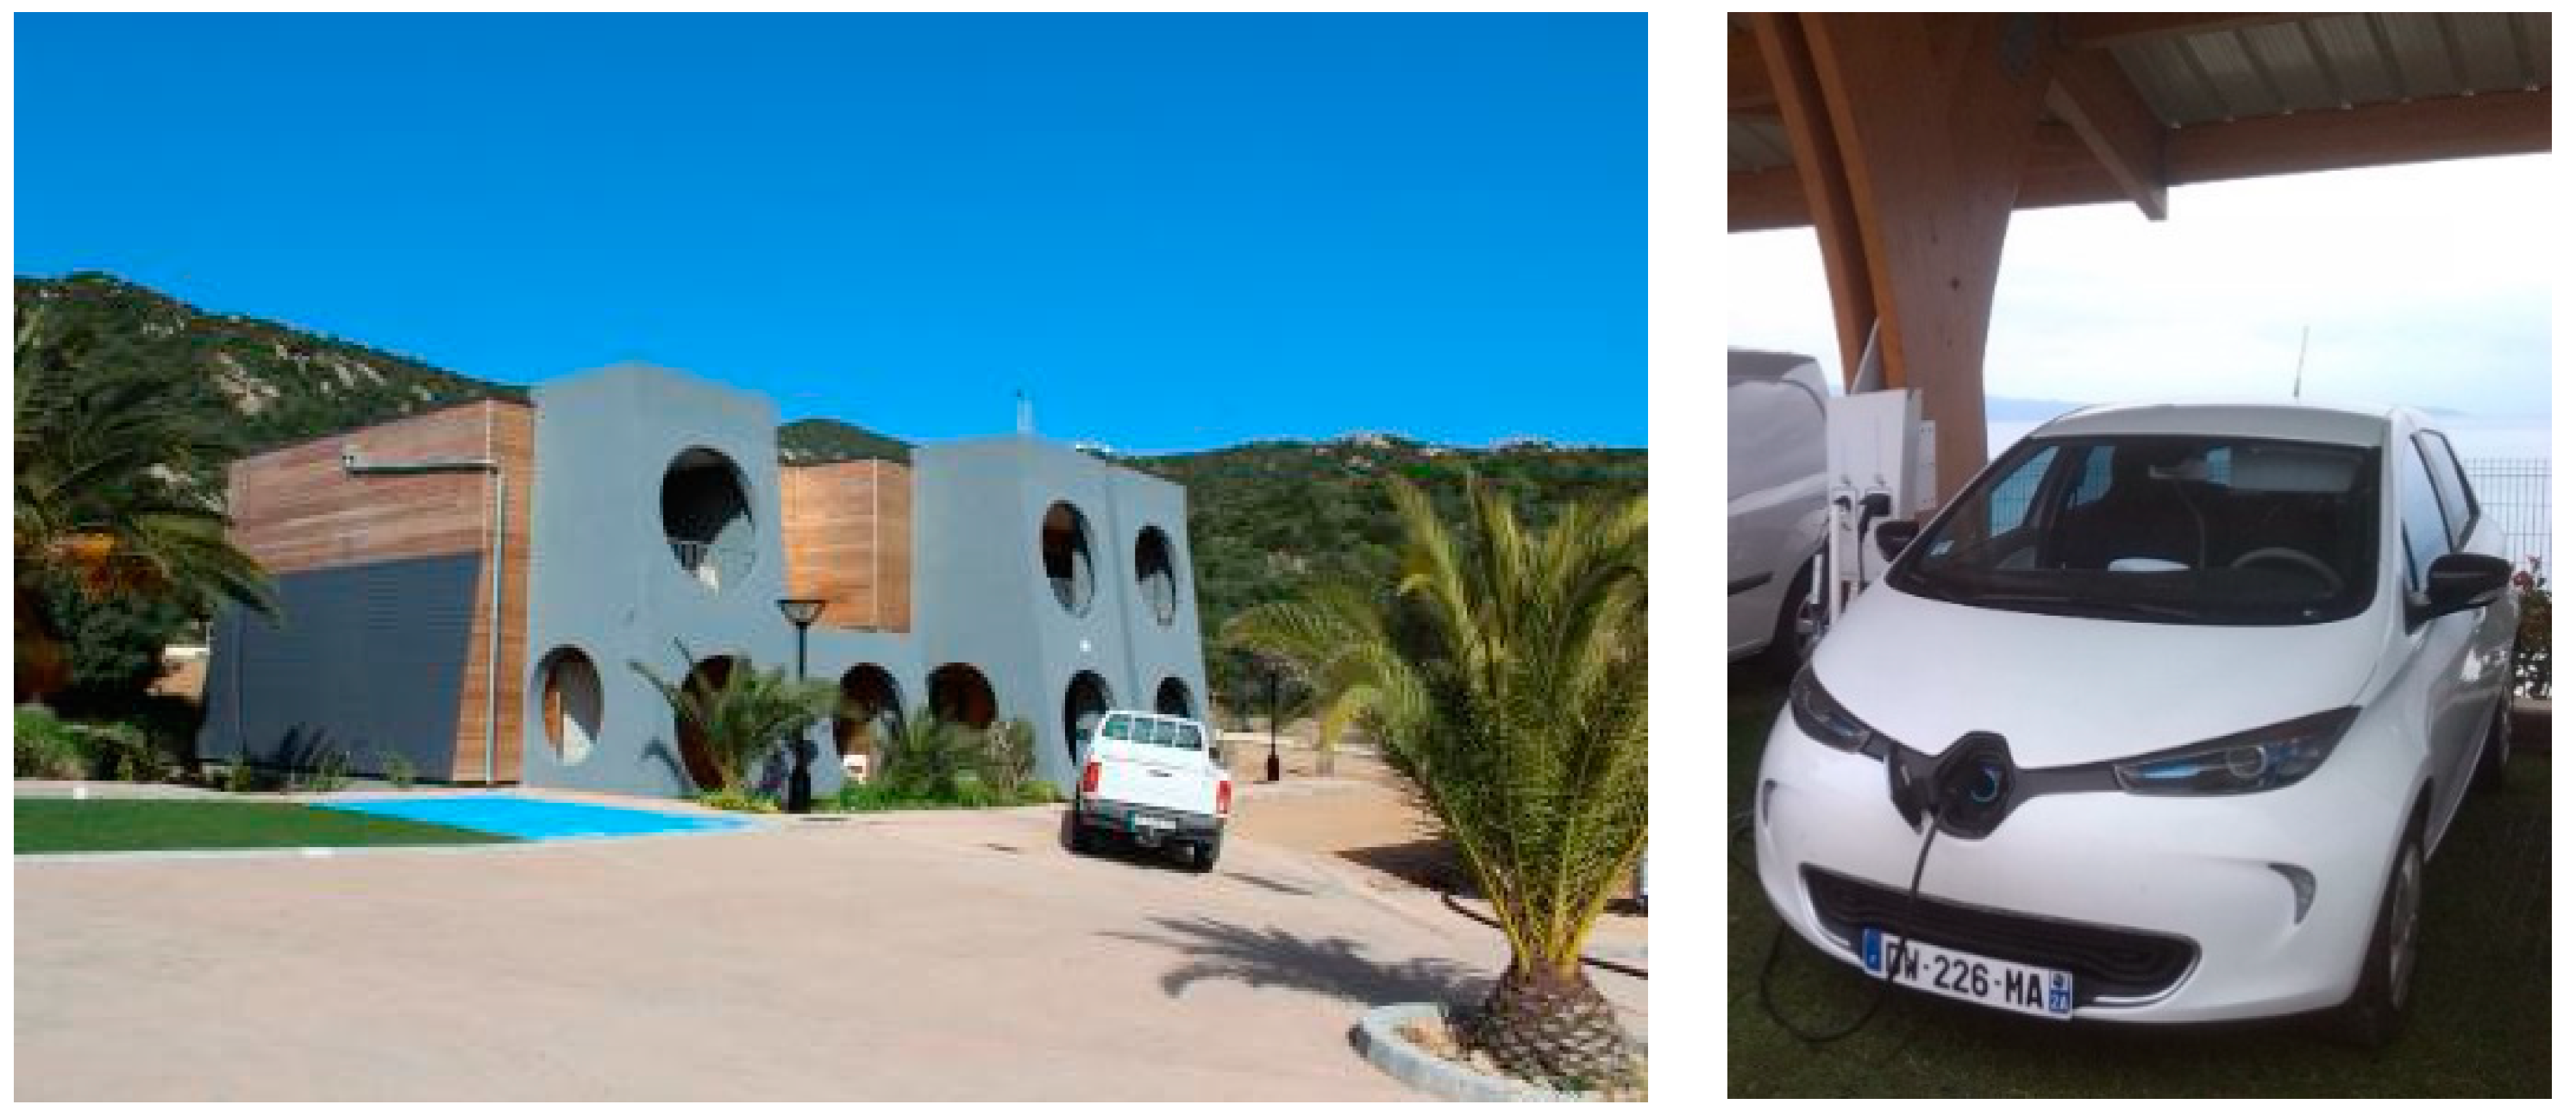
The loads powered by this microgrid are presented in Figure 3. The consumption of the accommodation varied depending on the period and occupation. As it was mainly used to receive students and guest researchers, we could have important variation from one week to another. In addition, the EV had a capacity of 22 kWh and was used every day from 9:00 to 16:00 for staff travel. In this study, we considered the EV as fully discharged at 16:00. Its charging period was set from 16:00 to 18:00 with a maximum power of 22.0 kW and a mean power of 11.0 kW. The data used in this paper showed a maximum power of 32.1 kW and a mean power of 6.1 kW.

2.3. Profiles Presentation and Electricity Price Variation

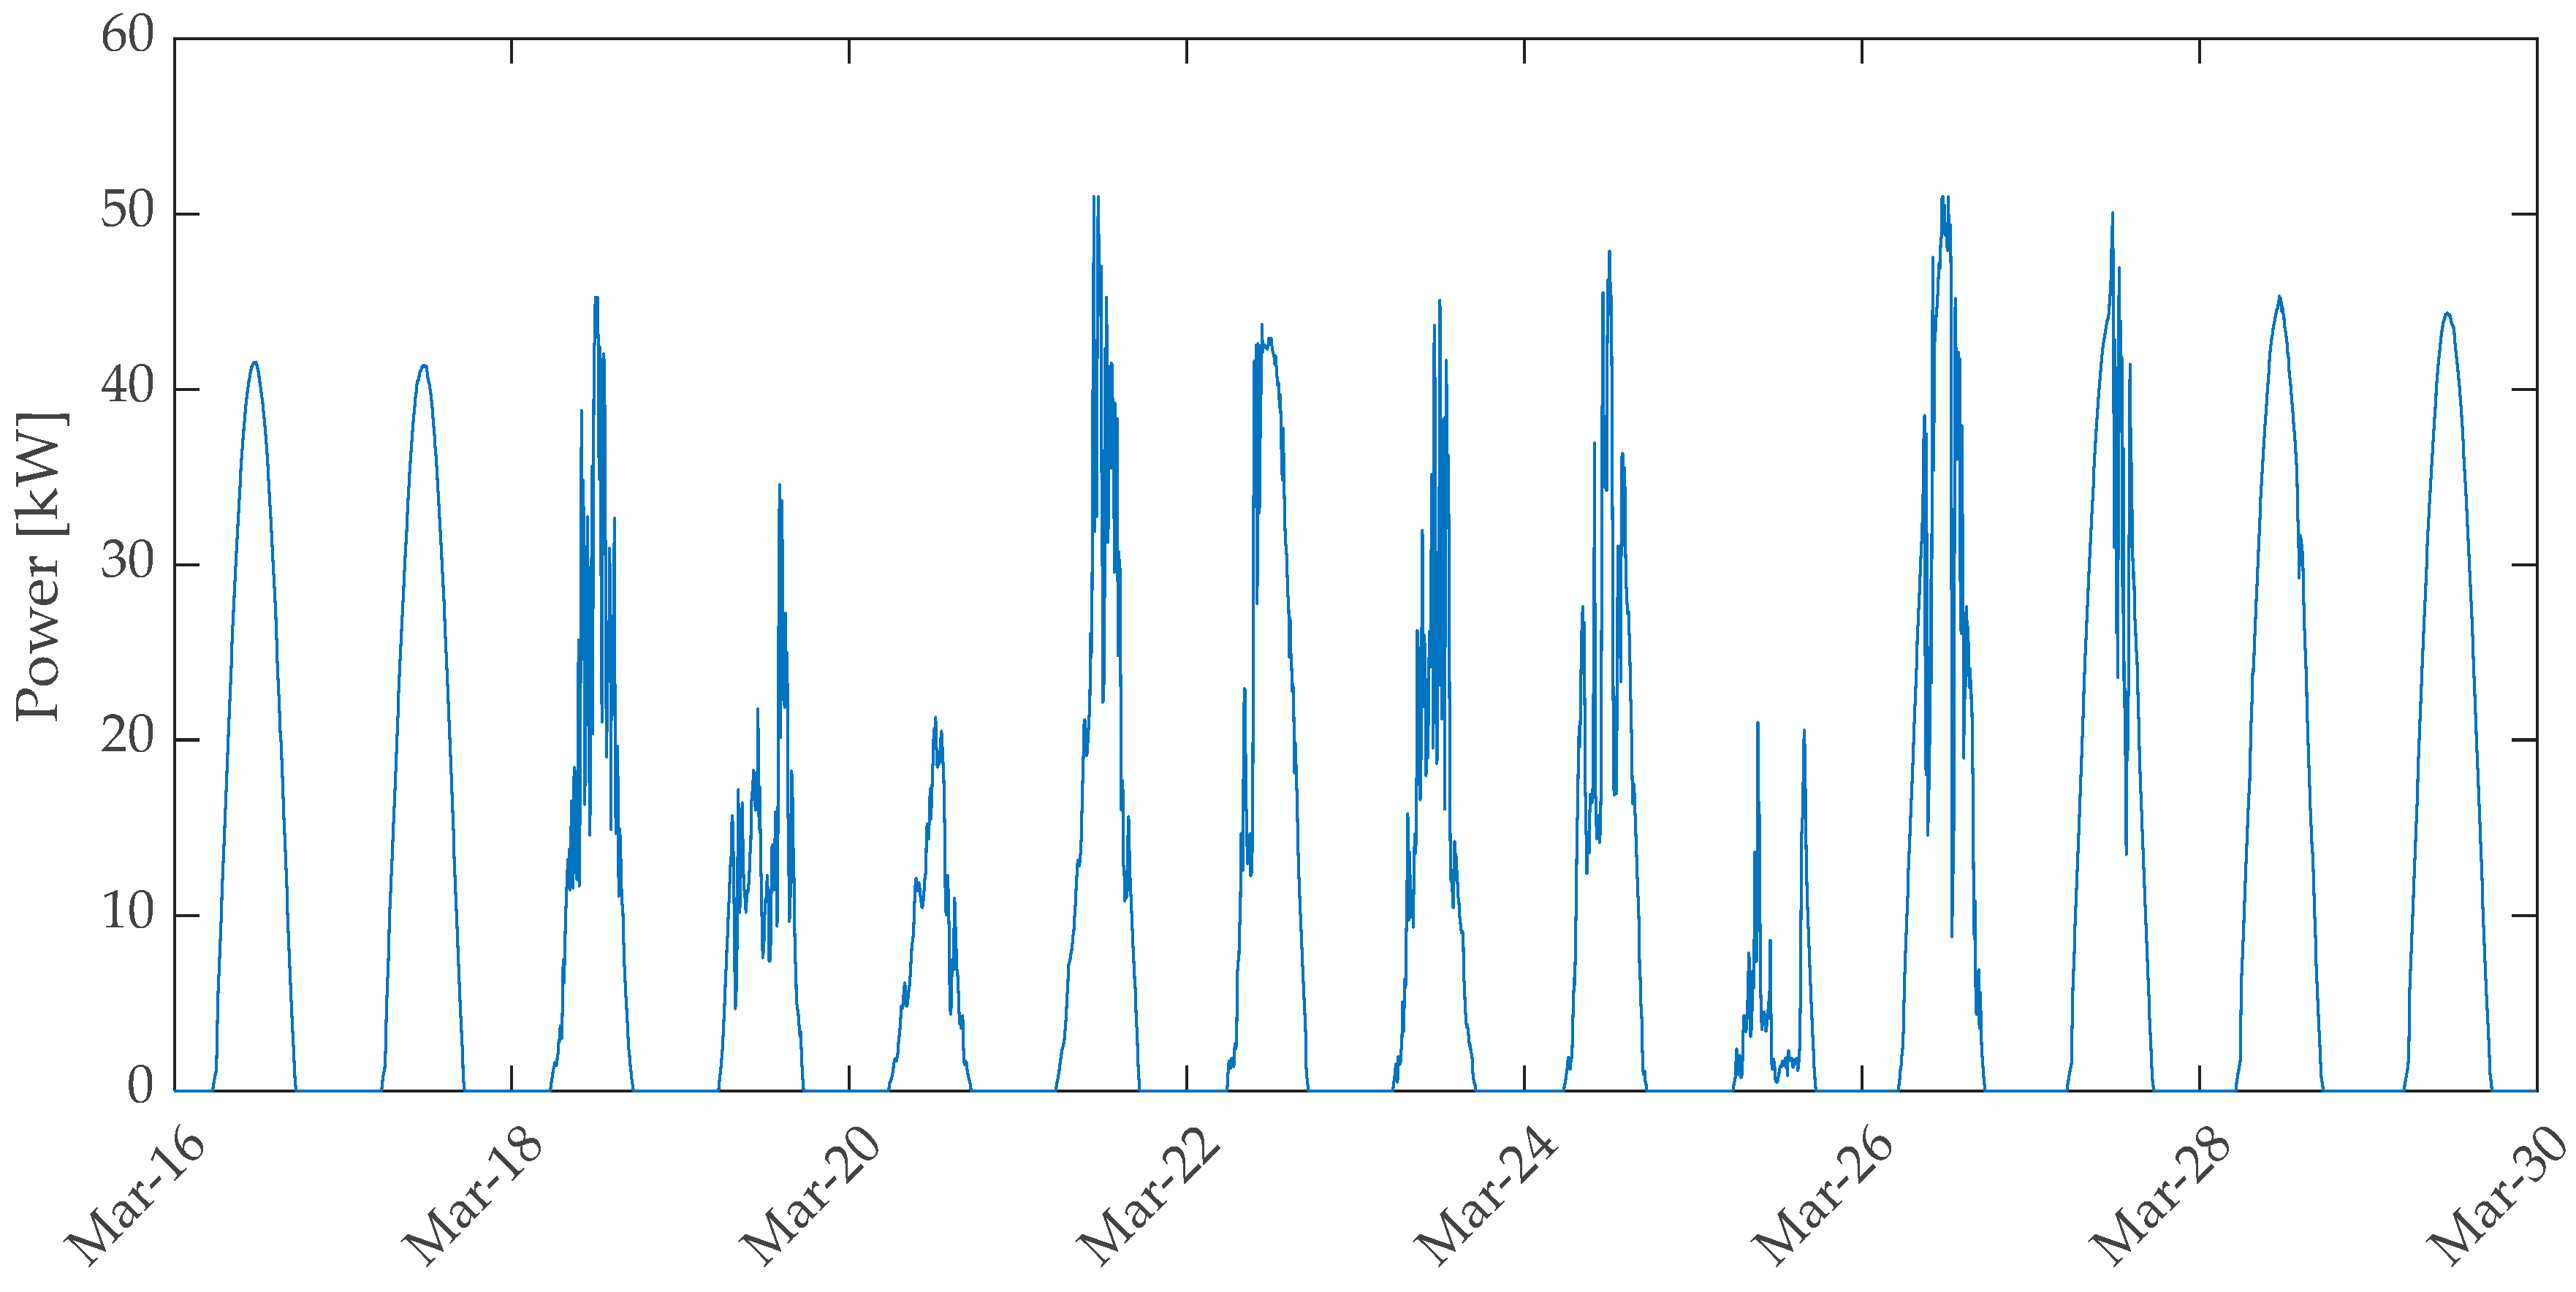
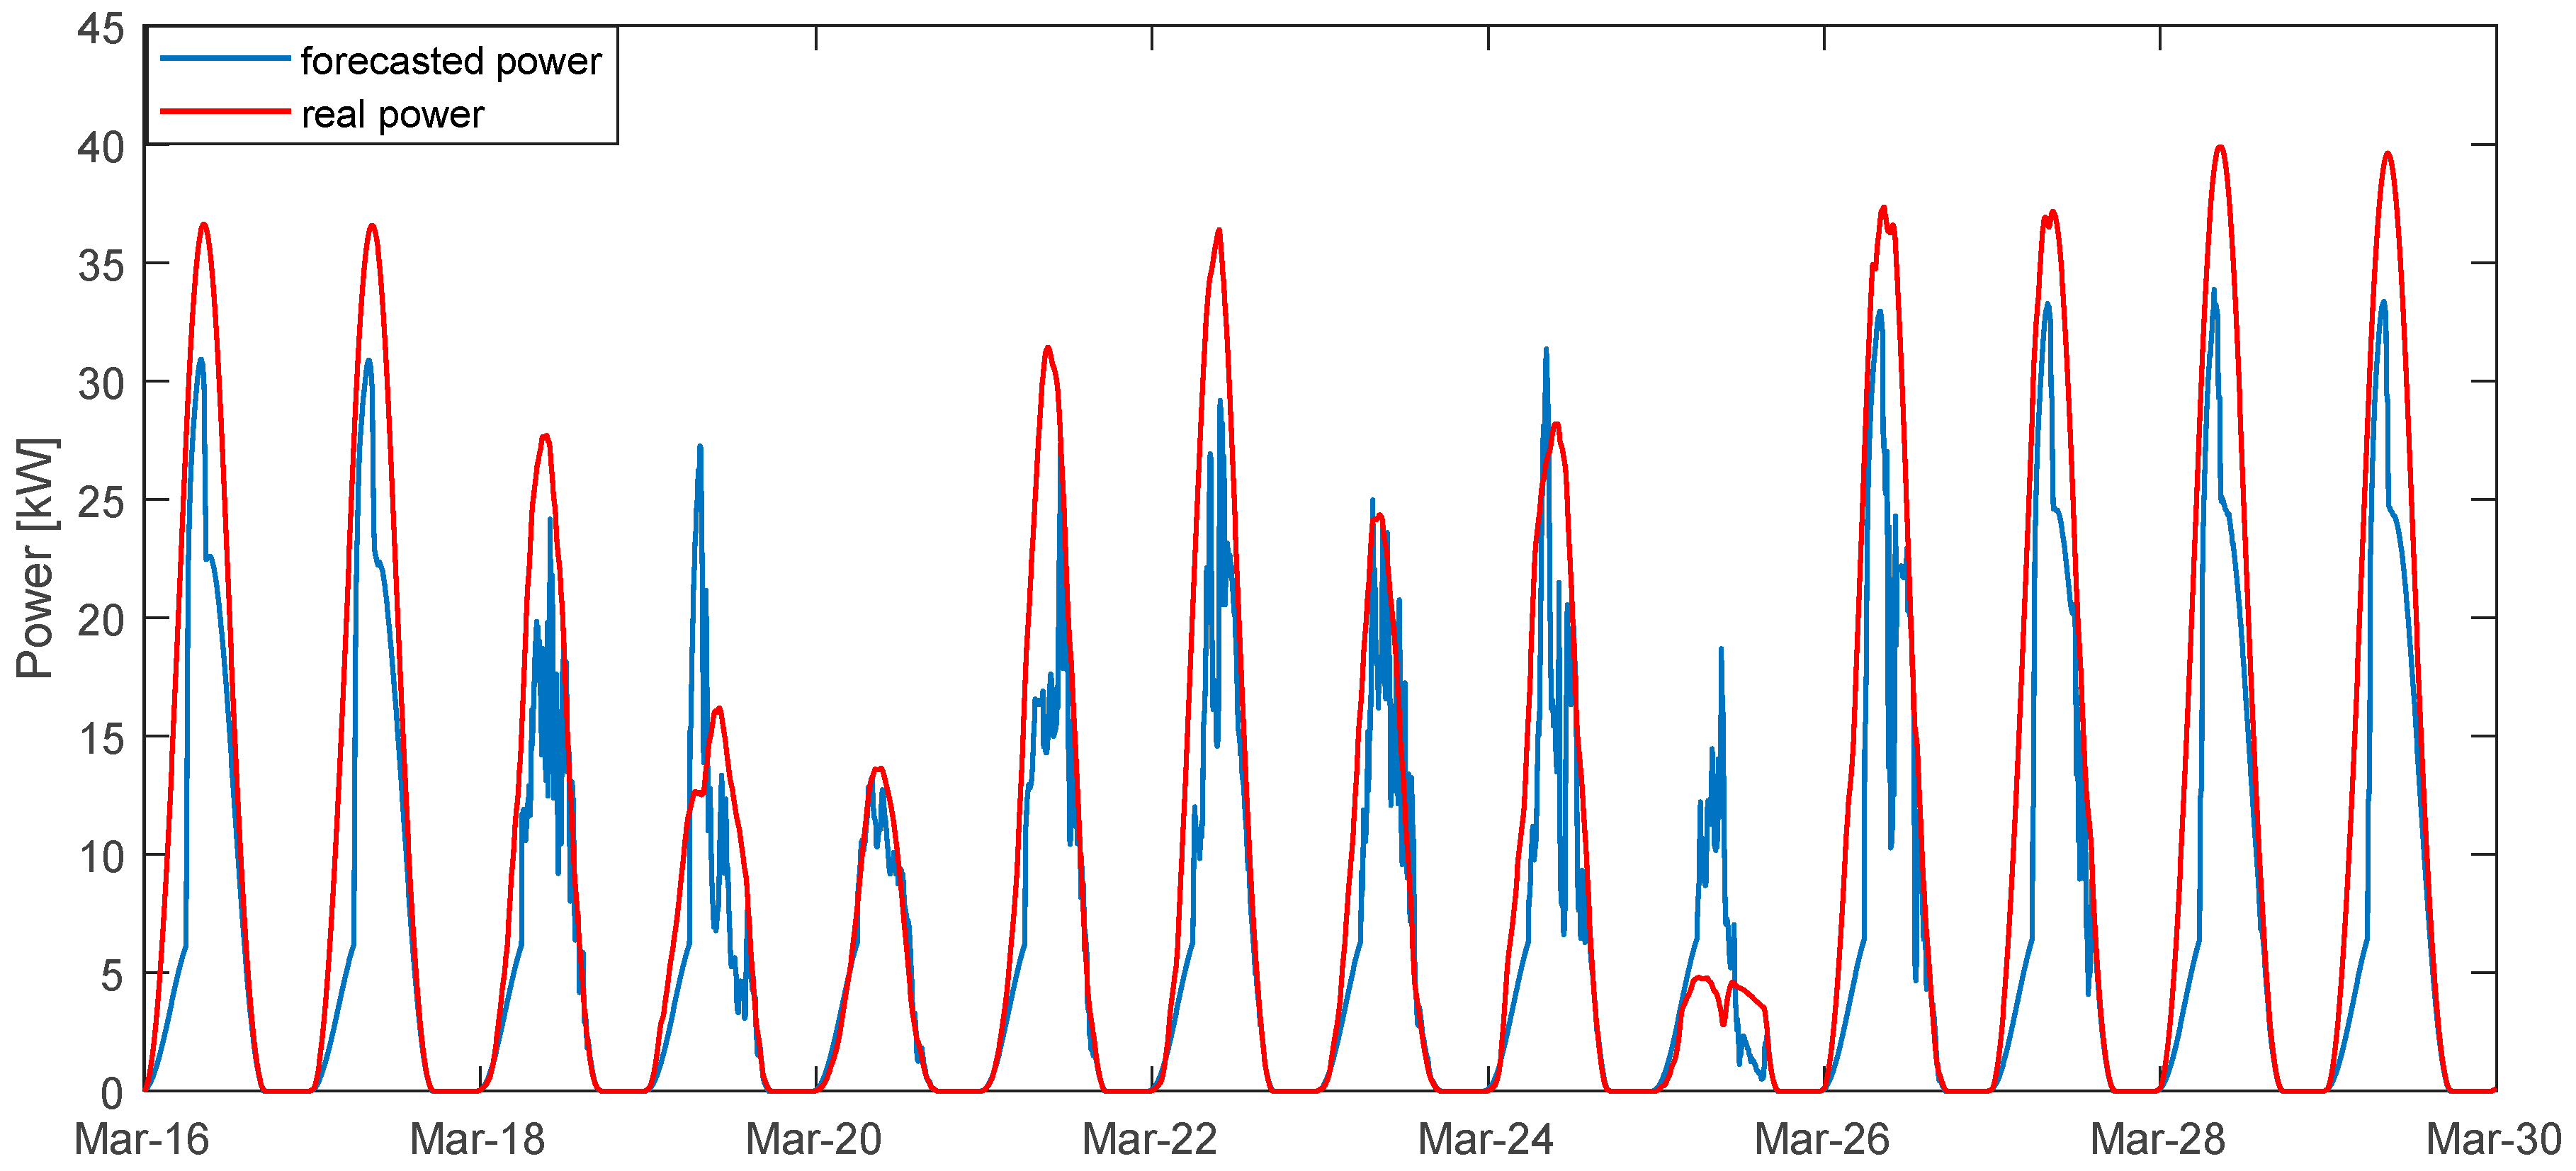
This study focused on two weeks of data from March 16 to 29. The total PV power from the three inverters (AC) is presented in Figure 4. It shows various types of days with different irradiance conditions. The load demand is presented in Figure 5. An increase of the number of occupants can be observed from March 27.
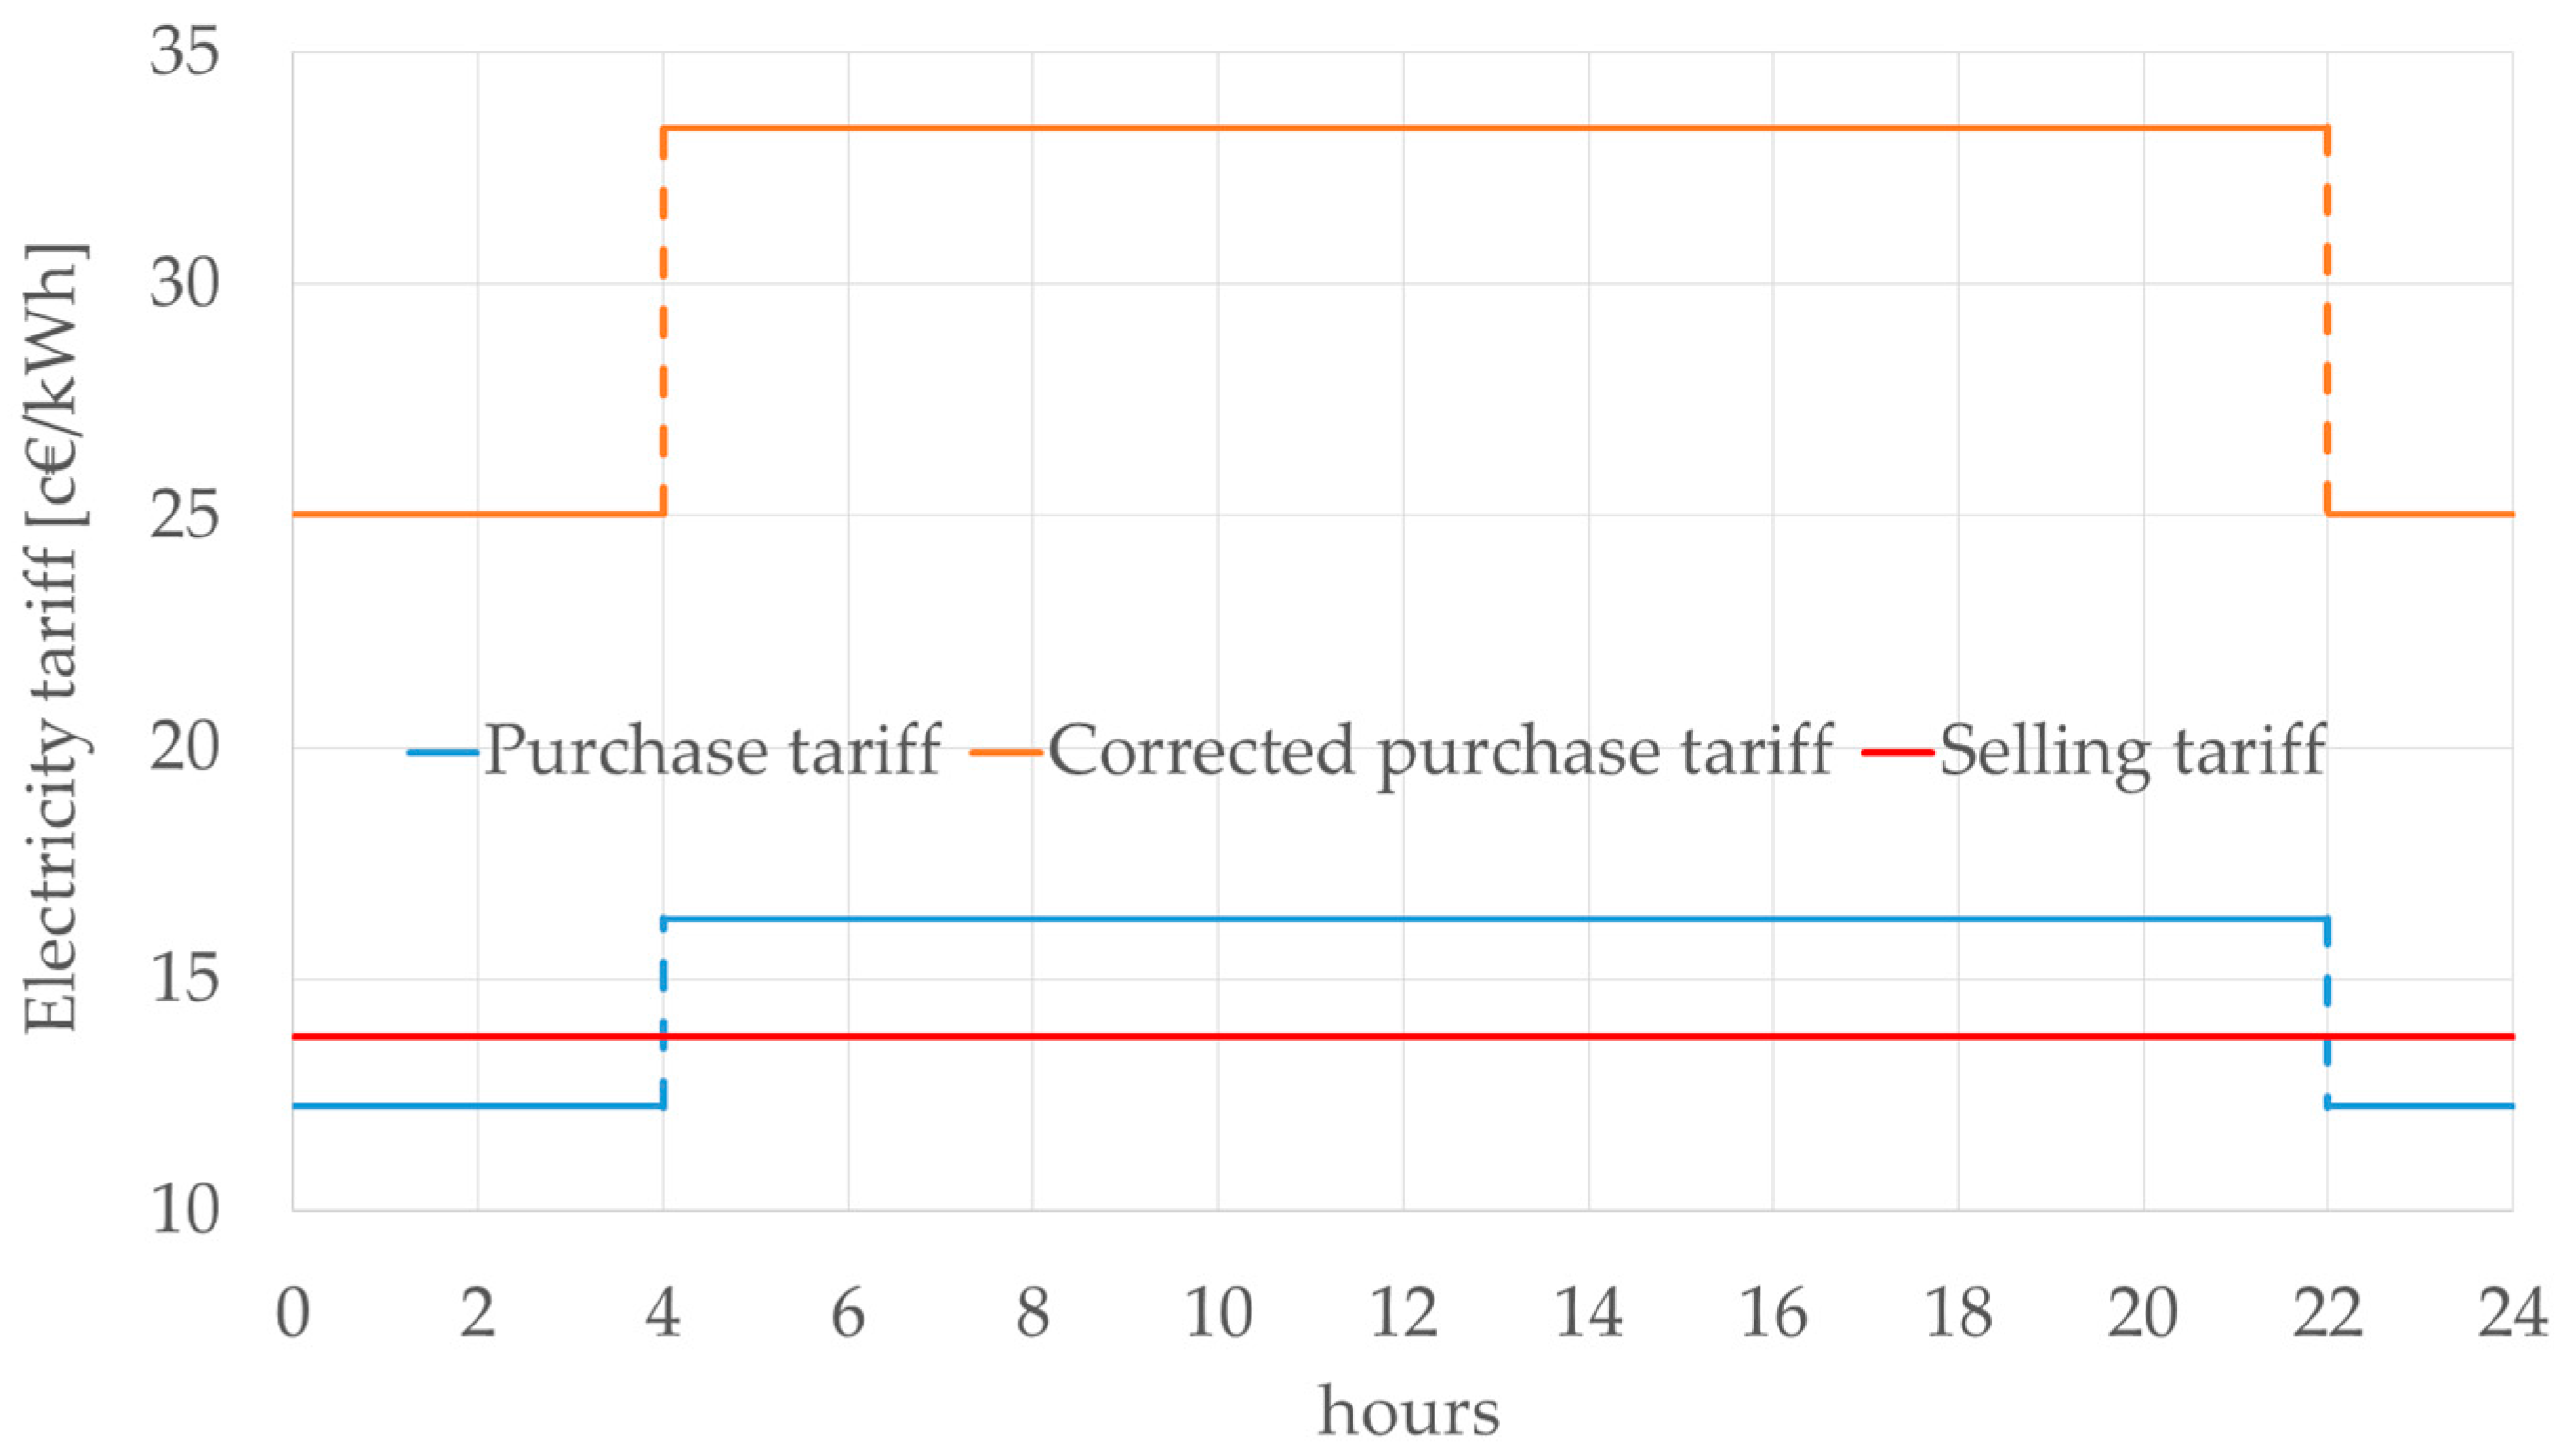
Currently, two electricity tariffs are available in France: One with a constant price over the day, and one with two prices according to the period—during consumption peak or off-peak. In this work, for the electricity purchased from the power grid, an electricity tariff “peak/off-peak” type was considered with a purchase price equal to 122.4 €/MWh during low consumptions hours and 163.1 €/MWh during peak hours, i.e., a difference of 33%.
The principles of purchase obligation for electricity produced by PV are fixed by the law n° 2000-108 of the 10 February 2000. Some regular calls for tender are launched and some private agreements are signed on the basis of the methodology written by the Energy Regulatory Commission. In France, for individual installations, the selling price of PV electricity changes every three months, and its value depends on the contract signing date. Then, it stays constant during the contractual period. A constant price of 137.7 €/MWh, sales price for the current date (June 2020) was taken, and this price was the same over the day. It is further expected that in the near future, the PV energy cost will vary over time, favoring the production during peak hours and the utilization of a short-time storage.
It is obvious that the selling or purchase electricity tariffs play a crucial role in the optimization results and in the benefit of solar microgrids. Currently, the electricity tariff in France are not well adapted to the photovoltaic production and to a smart utilization of microgrids. The development of smart electricity meters should aim to important changes in variation of electricity cost with the time (giving advantages for a smart energy management).
In addition, islands are generally not connected to mainland electrical grids and must achieve their production/consumption electrical balance alone, making energy supply security a challenging issue [44,45]. One of the most important consequences of this particular situation is an important utilization of fossil fuel generators for technical reasons (the fossil fuel part can reach 100% for some islands). It results two main impacts: The high level of greenhouse gas emissions and the high production cost of electricity. Due to the equalization of electricity tariffs in all the French territories, this over cost is compensated by all the French consumers in their electricity bill. The French Energy Regulation Commission gave an average production cost per MWh for 2013 for the French islands equal to 225 € (from 172 € in Corsica which is partially connected to 259 € in Martinique) for a production price in mainland France around 51.7 € [46].
To take into account this Corsican situation, it seems important to introduce the cost calculation for this particular island. From the EDF open data source, the annual average cost of MWh for Corsica was 200.62 € in 2016, 231.65 € in 2017, and 186.30 € in 2018, with the average cost over the three years equal to 206.26 €.
The average selling price for one MWh of electricity was decomposed in three parts. In France, for an average price of 146 € including VAT [47], this represents:
  • Electricity supply with production cost and commercialization: 42.0 + 11.5 = 53.5 €;
  • Electricity transmission: 44.0 €;
  • Taxes: Various French taxes: 48.5 €.
If we consider that the costs of electricity transmission and taxes are constant per MWh and that only the production cost changes, the average selling cost in Corsica should be around 298.7 €/MWh compared with 146 €/MWh in France, i.e., about two-times more.
Thus, this particularity of the electricity production cost in Corsica was taken into account in the tariff called “corrected” tariff. The utilization of this over-cost should influence the results of the optimization procedure in limiting the electricity part purchased to the electrical grid. For this “corrected” tariff, the purchase price is taken equal to 122.4 × ( 298.7 / 146 )   =   250.4   / MWh during off-peak hours and 163.1 × ( 298.7 / 146 )   =   333.7   / MWh during peak hours.
The purchase and selling tariffs over a day are shown in Figure 6.

2.4. Energy Management Strategies

Before presenting the different strategies, we introduce some important characteristics of the microgrid components in Table 1. These parameters remain the same for all simulations presented in this paper.
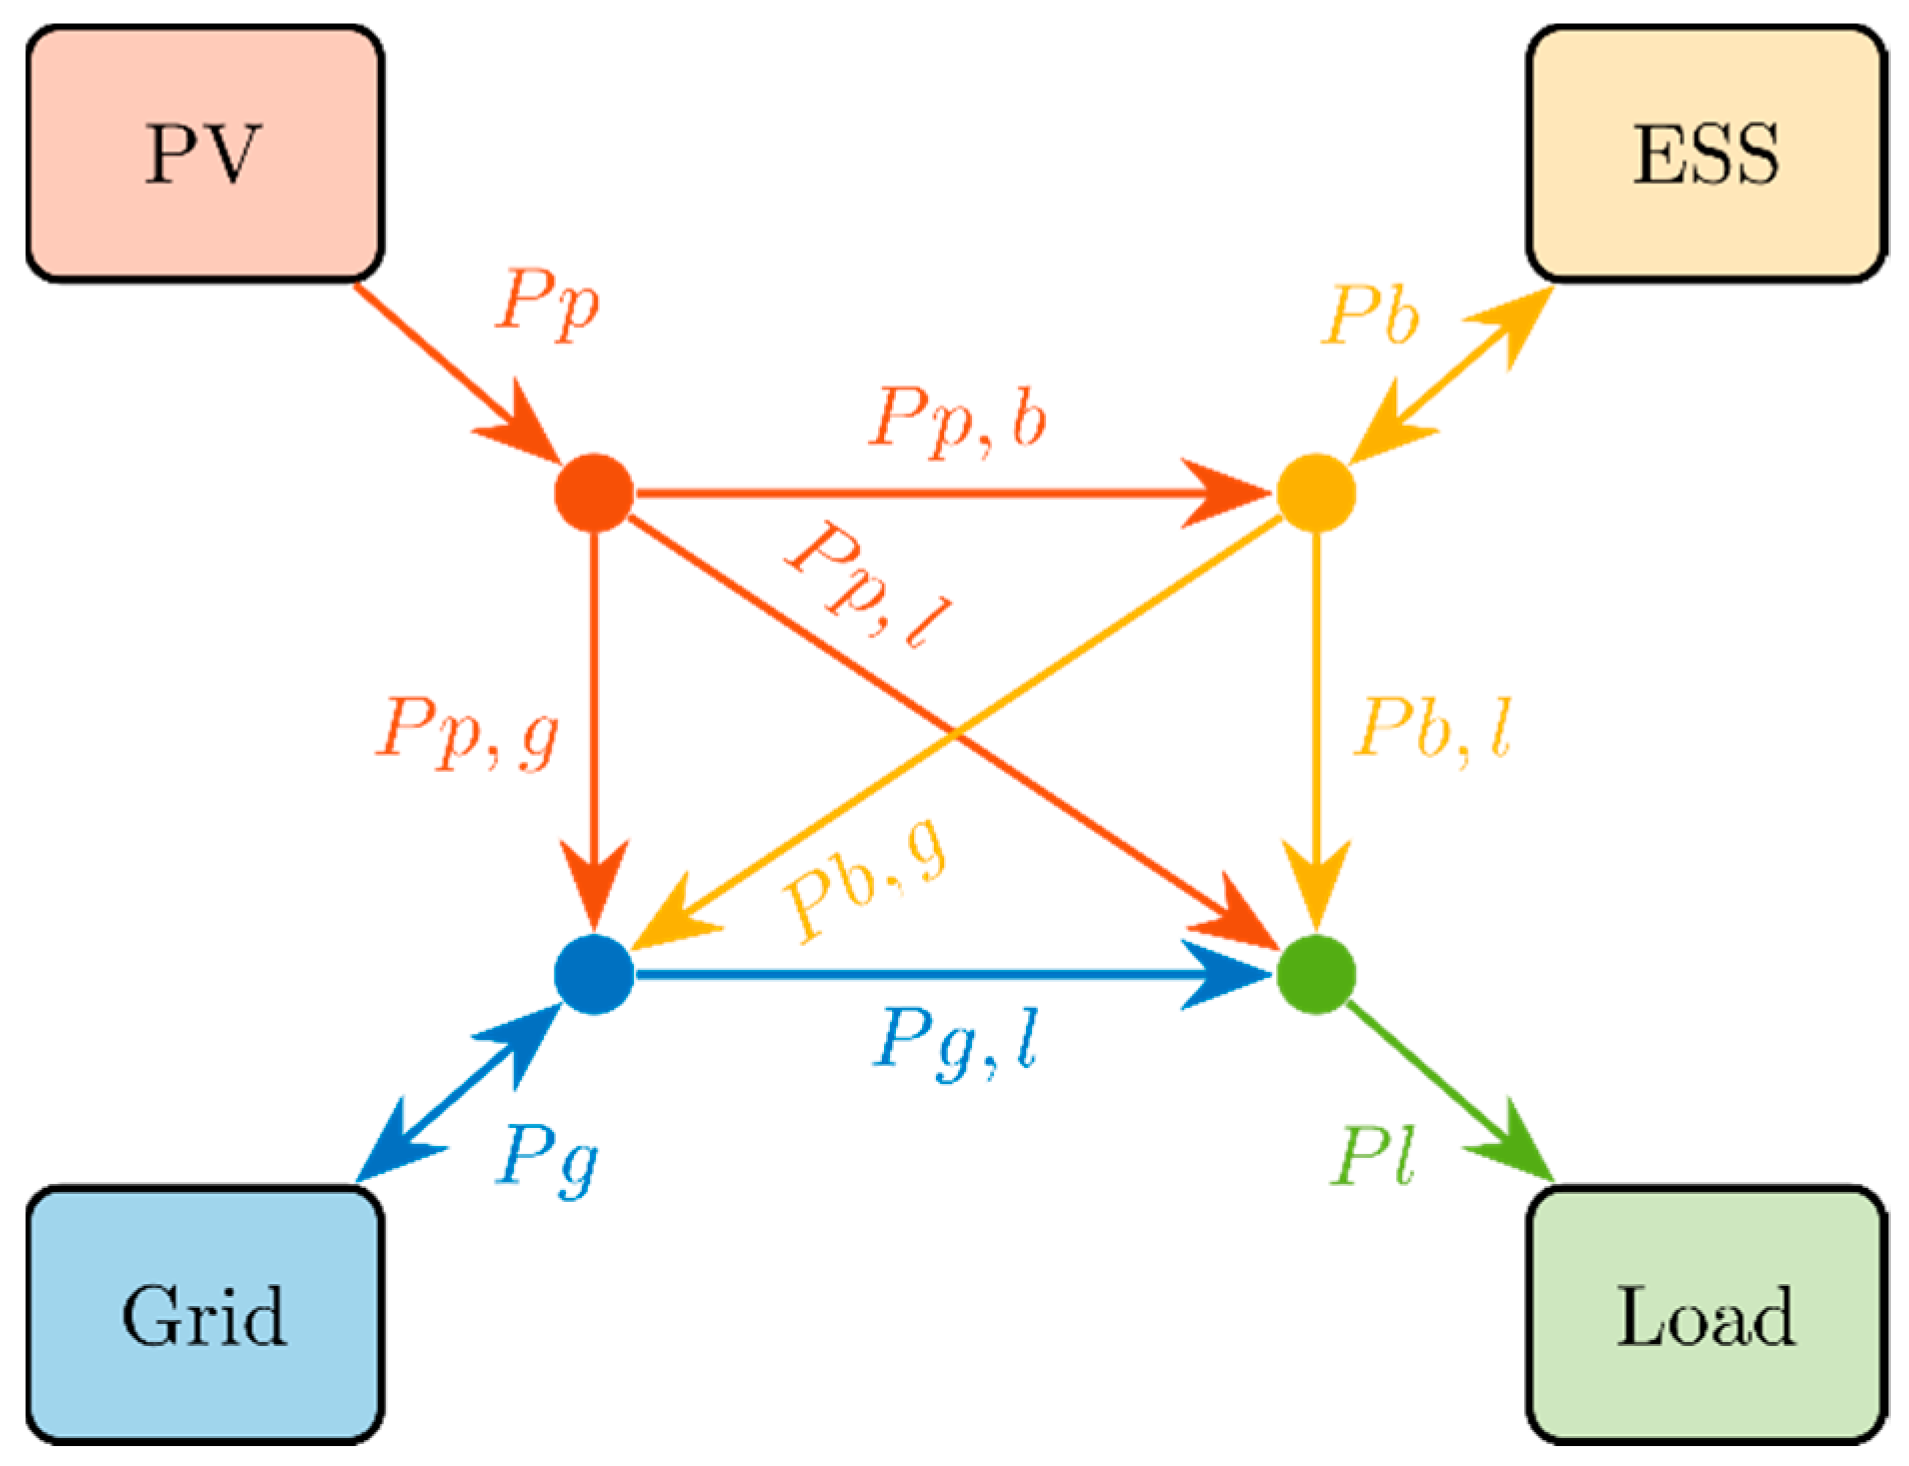
Figure 7 groups the different power flows among the different microgrid components.
This type of problem is subject to several constraints, presented as equalities and inequalities. It can be discretized in N time steps, with   t [ 1 , N ] :
S o C m i n   S o C ( t )   S o C m a x  
P p , l ( t ) + P b , l ( t ) + P g , l ( t ) + P m ( t )   =   P l ( t )
P p , g ( t ) + P b , g ( t ) P g , l ( t )   =   P g ( t )
P p , g ( t ) + P p , b ( t ) + P p , l ( t ) + P d ( t )   =   P p ( t )
At any time, the battery state of charge (SoC) must be between SoCmin and SoCmax (1). The power supplied to the load by the PV array, the storage, and the grid must meet the power demanded (2). If not possible, a missing power ( P m ) is added, meaning a failure of the system. The power from or to the grid is defined in (3). The power from the PV array (4) can be split to the load ( P p , l ), the storage ( P p , b ), or the grid ( P p , g ). It can also be degraded ( P d ) when PV exceeds the load, storage, and grid maximum power.
A second set of inequalities is used as boundaries for the parameters.   t [ 1 , N ] :
0     P p , l ( t )   P i n v m a x
0     P p , g ( t )   min ( P g o u t m a x , P i n v m a x )
0 P p , b ( t )   min ( P b i n m a x η i n , P i n v m a x )
0 P b , l ( t ) P b o u t m a x   η o u t
0 P b , g ( t ) min ( P b o u t m a x η o u t ,   P g o u t m a x )
0 P g , l ( t ) P g i n m a x
0 P d ( t )
0 P m ( t )
A last constraint is that the SoC was set at 50% at the beginning of the simulation and must end at 0% of the battery useful capacity. This ensures all the results of the different strategies to be comparable. It also has to be noted that charging the battery from the grid is not allowed.

2.4.1. Linear Programing Optimization

Linear programing (LP) optimization is a mathematical optimization method for maximizing or minimizing a linear function of several variables. LP optimization respects equalities and inequalities constraints, as well as boundaries for all the parameters. As the microgrid can buy or sell energy to the grid, the optimization aims to minimize the cost in the time range. A negative cost thus means a profit for the system. The selling price ( C s e l l ( t ) ) is constant over the day and the buying price ( C b u y ( t ) ) varies over the day (see Figure 6). The price paid by the microgrid operator is thus:
C t o t = t = 1 N [ P g , l ( t )   C b u y ( t ) ( P p , g ( t ) +   P b , g ( t ) )   C s e l l ( t ) ] d t
The result of this optimization gives the optimal solution of the problem. Indeed, this cannot be view as a proper strategy, as it requires a perfect knowledge of all future power flows (loads and production) for the whole period. This optimization was only used as a reference in order to confront the actual strategies with the optimal solution.

2.4.2. Rule-Based Control Strategies

The rule-based control (RBC) is a strategy for managing the energy of the system. At each time, the system makes a decision based on predefined rules. This optimization respects same constraints and limits as the LP.
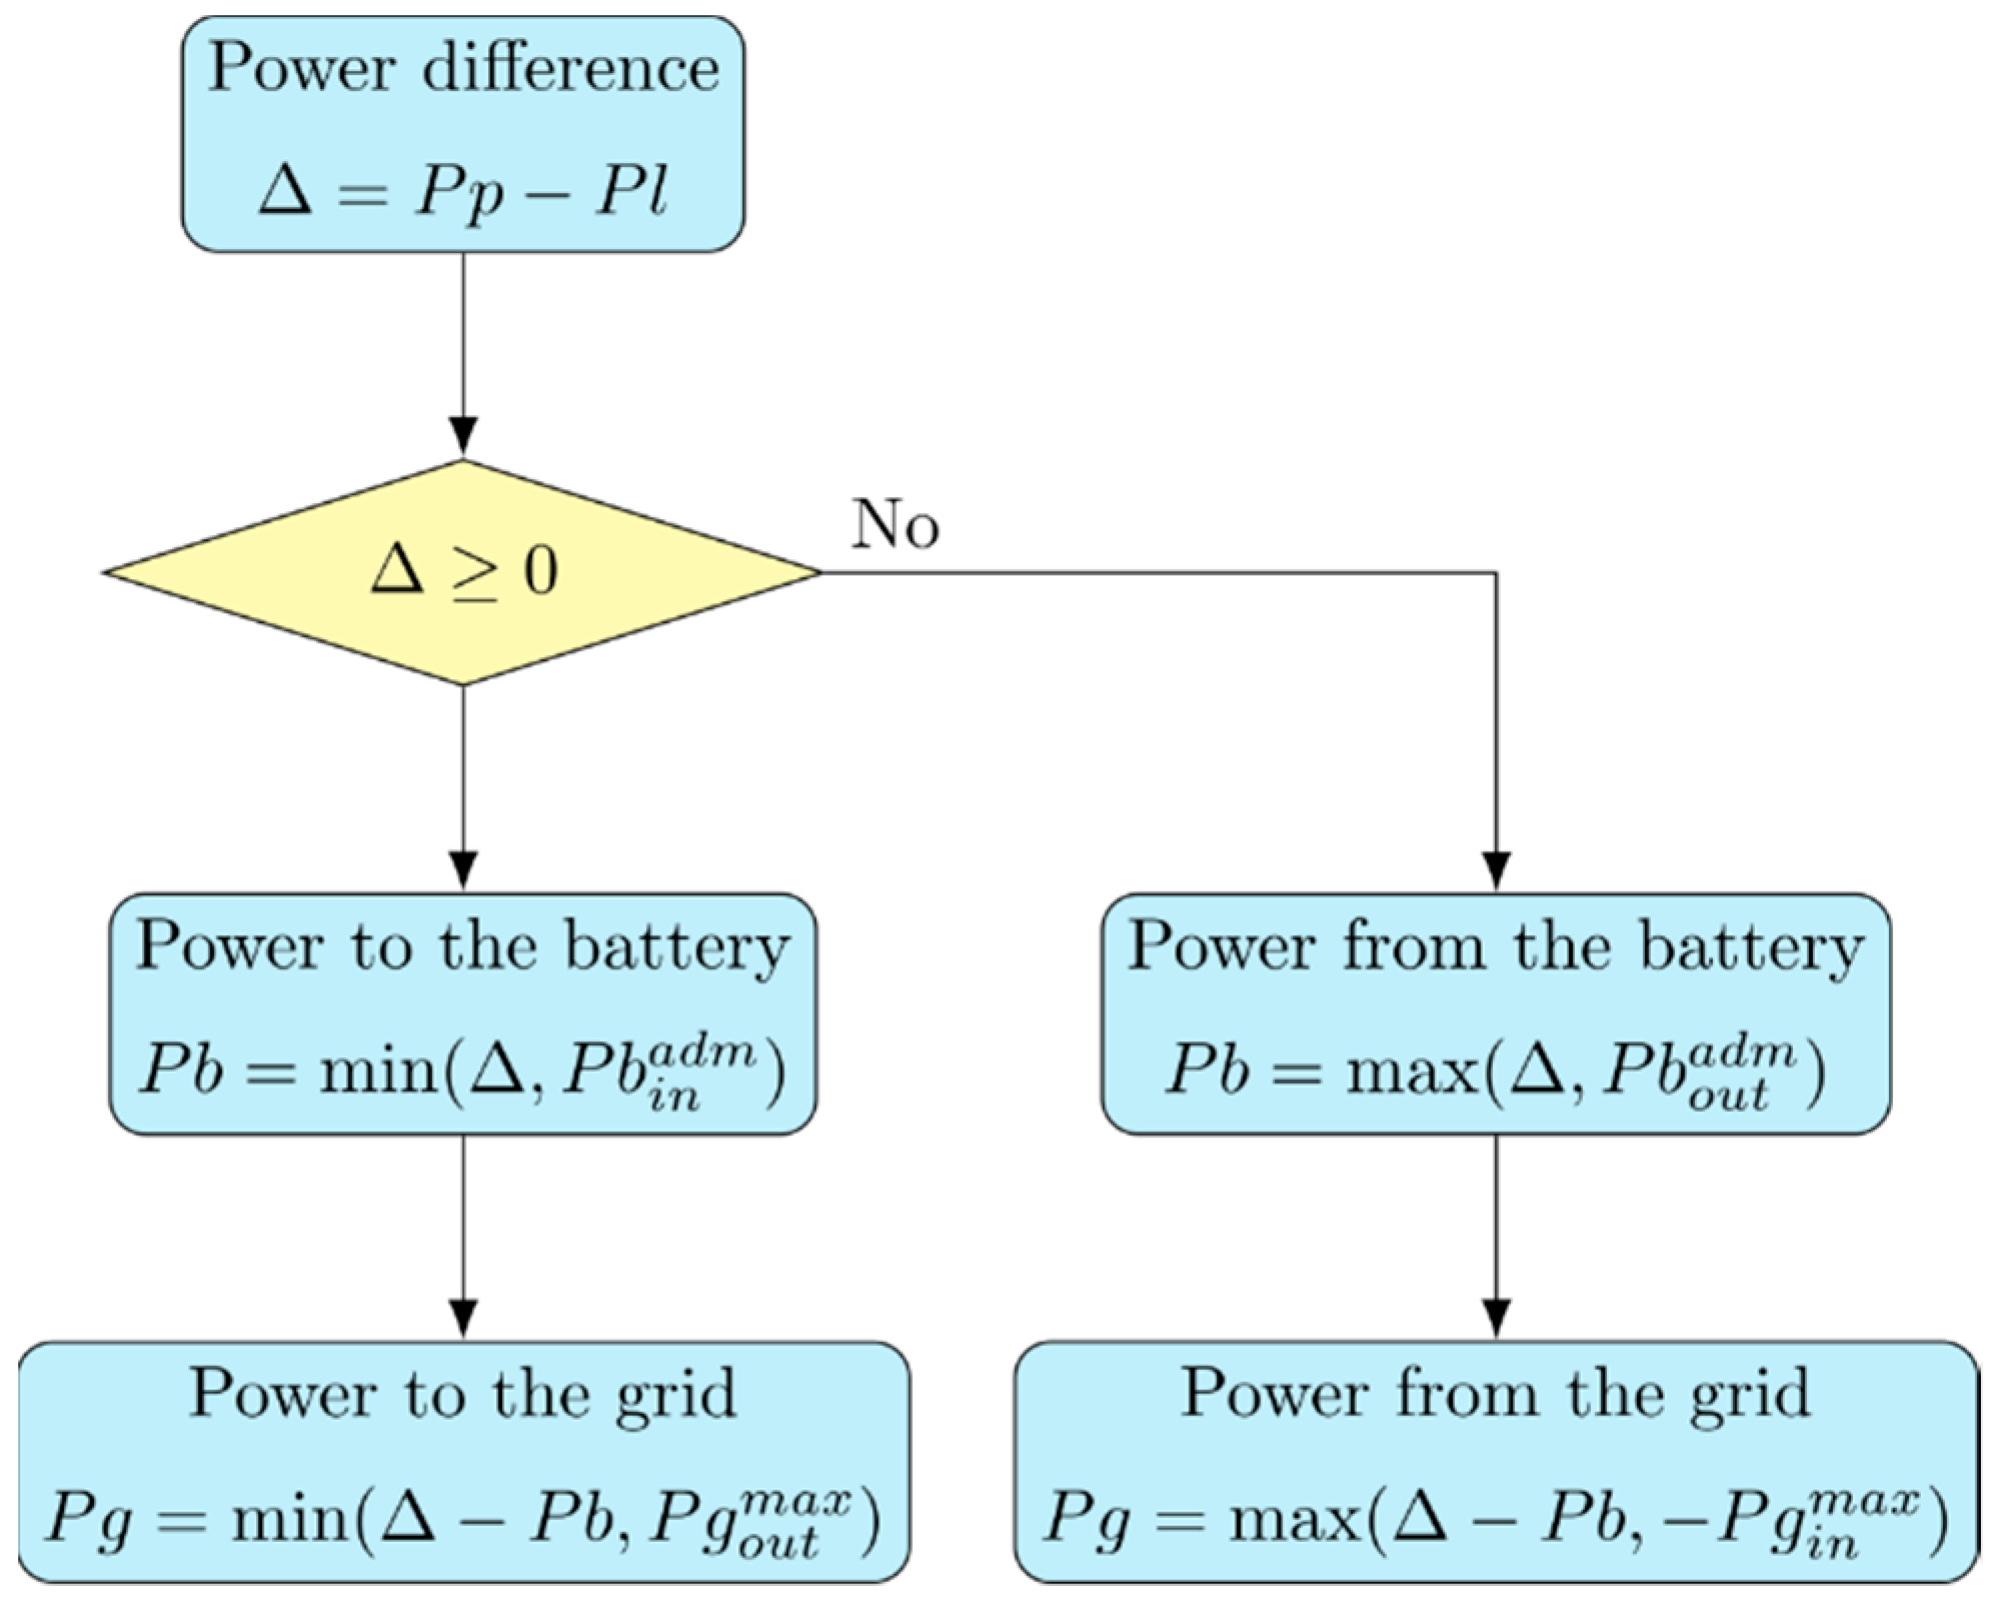
For this study, three types of RBC were proposed. All of them prioritize PV to supply the load. Each RBC begins by checking the difference between PV and load:
Δ   = P p   P l
Then, the power is distributed depending on the strategy.
The admissible powers from and to the battery are also defined at each time step by the following equations:
P b i n a d m = min ( P b i n m a x , ( 1 S o C )   C E S S   d t   η i n )
P b o u t a d m = max ( P b o u t m a x , S o C   C E S S   η o u t dt )
Here, we briefly describe the three strategies and provide a flowchart for each one:

A. RBC1

This strategy (Figure 8) is the most basic and only maximizes the system self-consumption. Only two possibilities were considered:
  • Δ     0 : The load is supplied by PV power. After satisfying the load requirement, the surplus is used to charge the battery up to its SoC maximum level. When the battery is fully charged, surplus is sold in the grid. If Δ is zero, PV only supplies the load, while the battery and grid are not used.
  • Δ   <   0 :   The PV power does not meet the load. As far as possible, the missing power is supplied by the battery. When the battery power is not sufficient to supply the load, the grid is used to add the remaining power.

B. RBC2

In this RBC, the decision is made by observing energy costs and PV level (Figure 9). It favors the use of the main grid during off peak hours and the battery during peak hours. Also, it prevents the battery to be full too quickly by allowing PV selling if it reaches a certain level. This strategy operates in this way:
  • 0 Δ <   P g o u i m a x : PV supplies the load and surplus is used to charge the battery. When the battery is fully charged, the surplus is sold in the grid. If Δ is zero, PV only supplies the load, while the battery and grid are not used.
  • Δ     P g o u i m a x : After supplying the load, P g o u i m a x is sold in the grid and the surplus is used to charge the battery.
  • Δ < 0 and t ∊ [22:00–4:00]: The load is only supplied by the grid because at this time, and the energy cost is low (off-peak hours).
  • Δ <   0 and t ∊ [4:00–5:00] and (SoC 1 / 2 ): The battery is discharged at P b o u t m a x until its SoC reaches 50% to supply the load and the surplus is sold in the grid. This allows the battery to store more PV during the day.
  • Δ < 0 and t ∊ [4:00–5:00] and (SoC < 1 / 2 ): If the battery SoC is low at the beginning of peak hours, the case is the same as next bullet.
  • Δ < 0 and t ∊ [5:00–22:00]: PV power does not have the capacity to fully supply the load. The remaining power is provided in priority by the battery and then by the grid.

C. RBC3

This strategy is similar to the RBC2 but takes into account a new indicator based on PV forecasting (Figure 10). This indicator represents the average of the PV production for the next six hours ( m e a n 6 h ( P p ) ) . Its use can be observed on the left part of the flowchart ( Δ   0 ) :
  • 0 Δ < P g o u t m a x and ( m e a n 6 h ( P p )   P g o u t m a x : The load is only supplied by PV and the surplus is sold in the grid.
  • 0 Δ < P g o u t m a x   and   ( m e a n 6 h ( P p ) <   P g o u t m a x : The load is only supplied by PV and the surplus is used to charge the battery. When the battery is fully charged, the surplus is sold in the grid.
  • Δ P g o u i m a x : After supplying the load, P g o u i m a x is sold in the grid and the surplus is used to charge the battery.
As this strategy requires forecasting PV data, we proposed two versions: One with perfect forecasting which was used as a reference (RBC3r), and one with real forecasting model (RBC3).
The real forecast of PV power was realized using an Auto Regressive Mobile Average (ARMA) method [48], which was tested and validated on the site. Compared with 10 others statistical and machine learning tools in a benchmarking work, the ARMA method showed that it is the most reliable model to predict solar irradiance for Ajaccio [49], with an accuracy in term of nRMSE between 18.35% and 33.69% for a temporal horizon from h+1 to h+6.
The performance of the ARMA model used in this paper and applied to six hours of averaged PV power are shown in Figure 11. For the 14 days of data, its nRMSE reached 51.99%. This result should not be directly compared with the previous ones because the period was short and presented high variability of the solar irradiance. It is thus interesting to check what improvement a not well optimized model could bring to the strategy.

3. Results

3.1. LP Optimization and RBC Strategies Results

In this section, we present the main results obtained from the different methods. For LP optimization, the whole period is presented. For the RBC strategies, graphics only focus on the first six days of data for better clarity. Tables are proposed at the end of the section to summarize the main results.
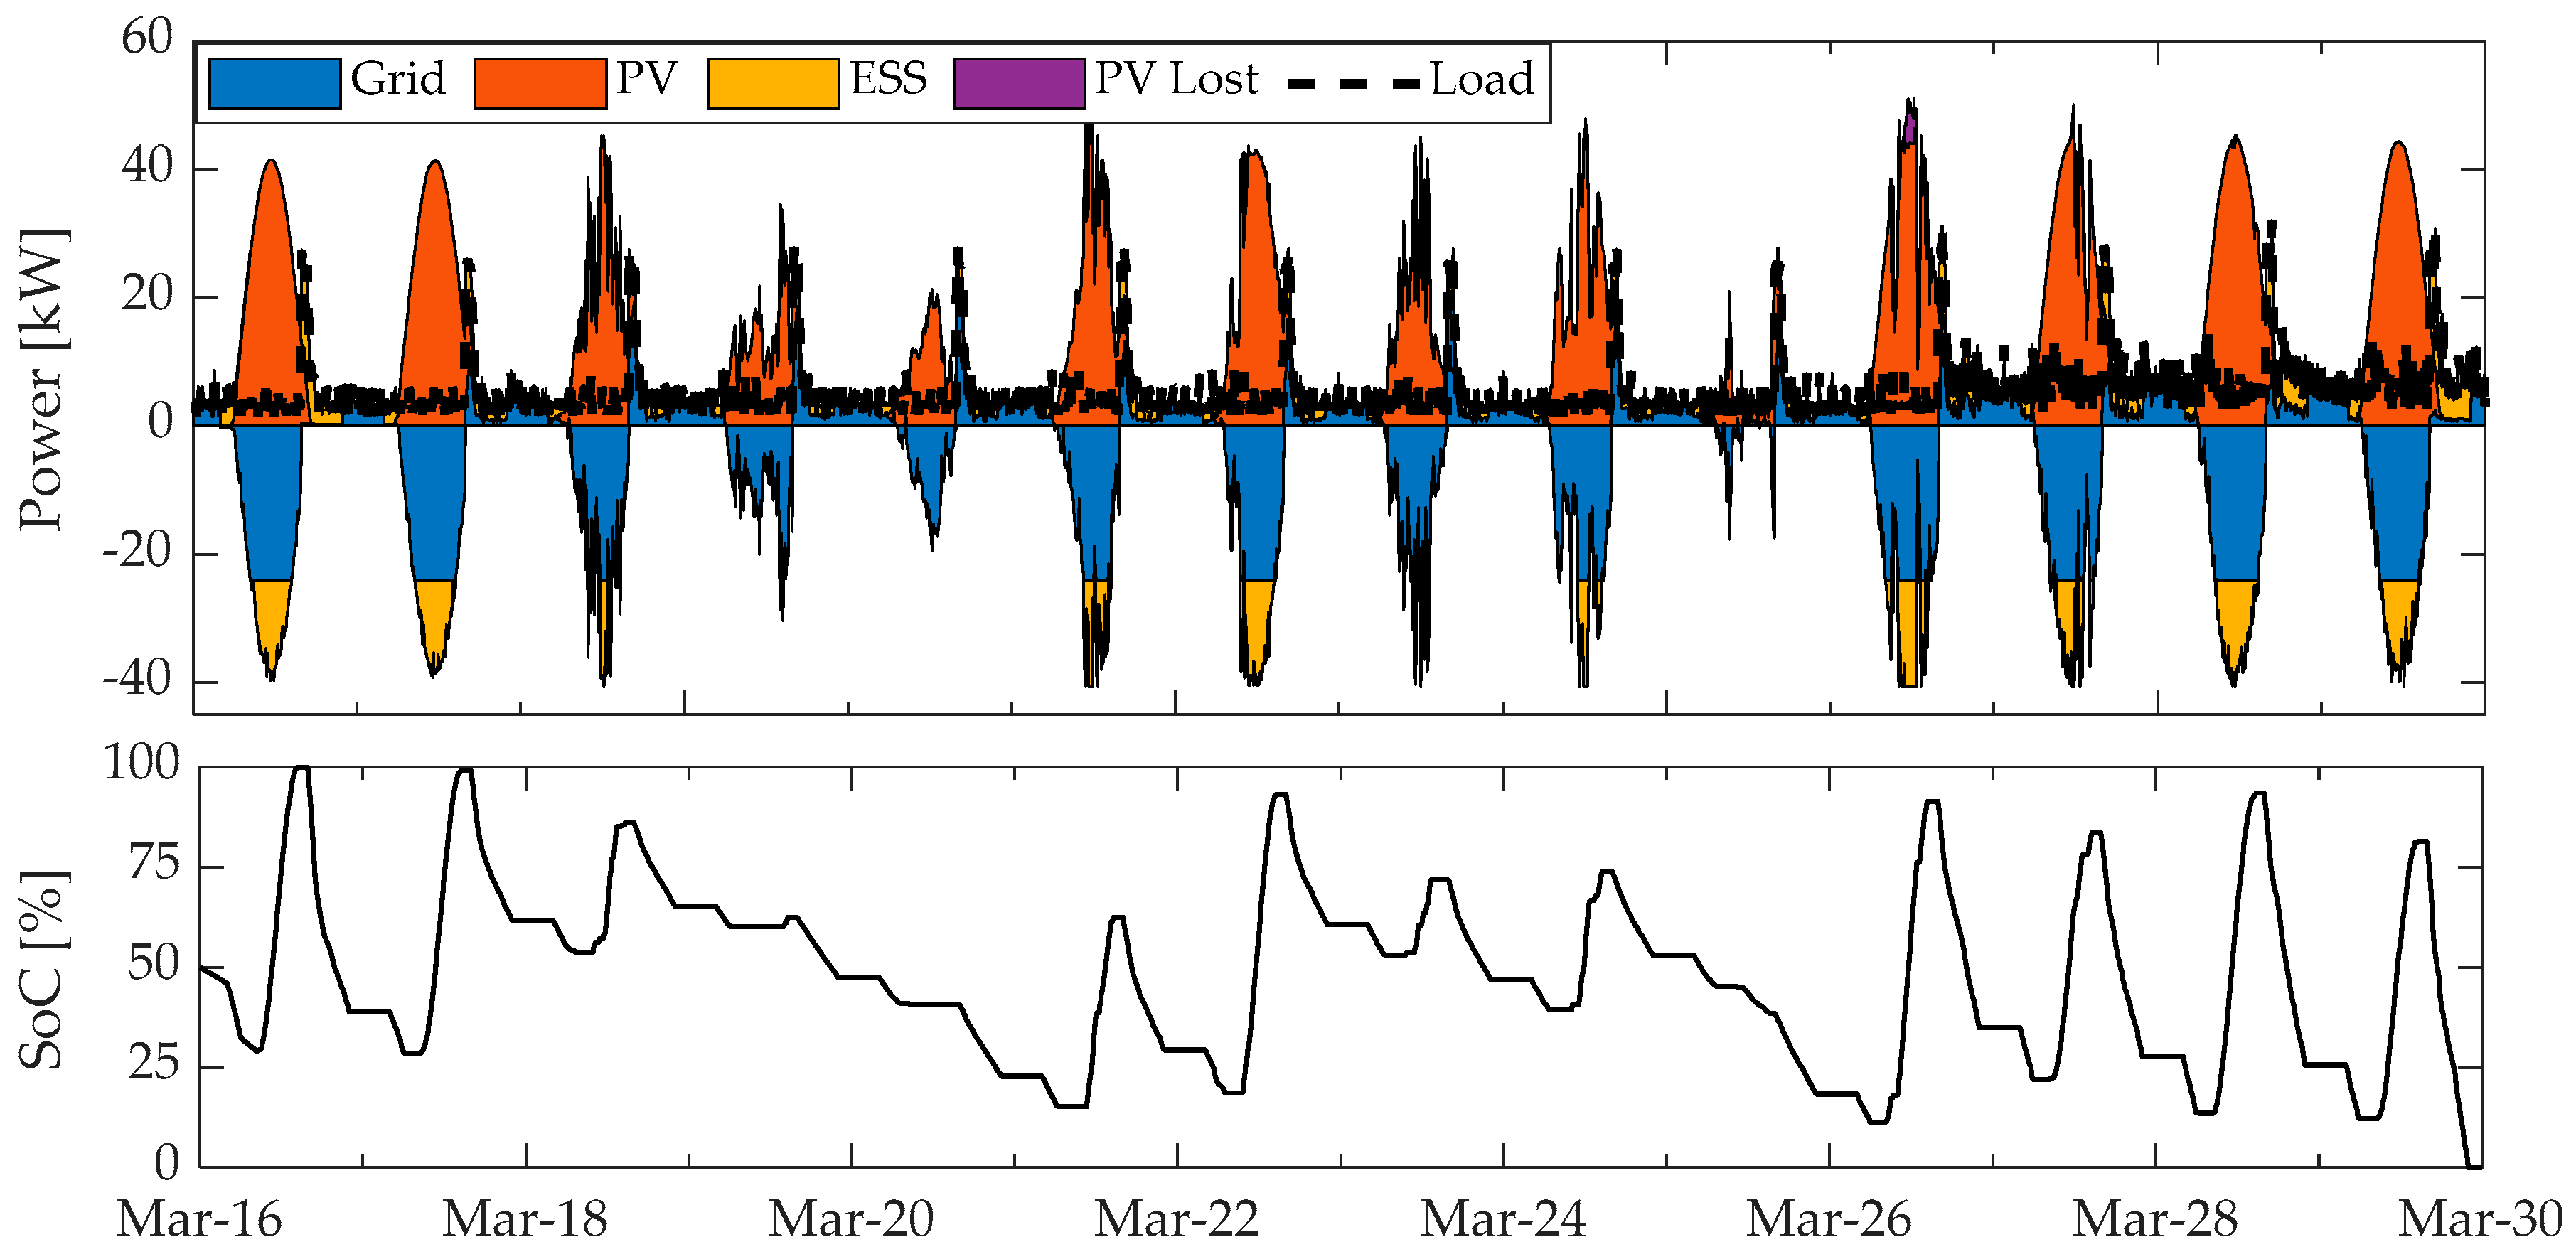
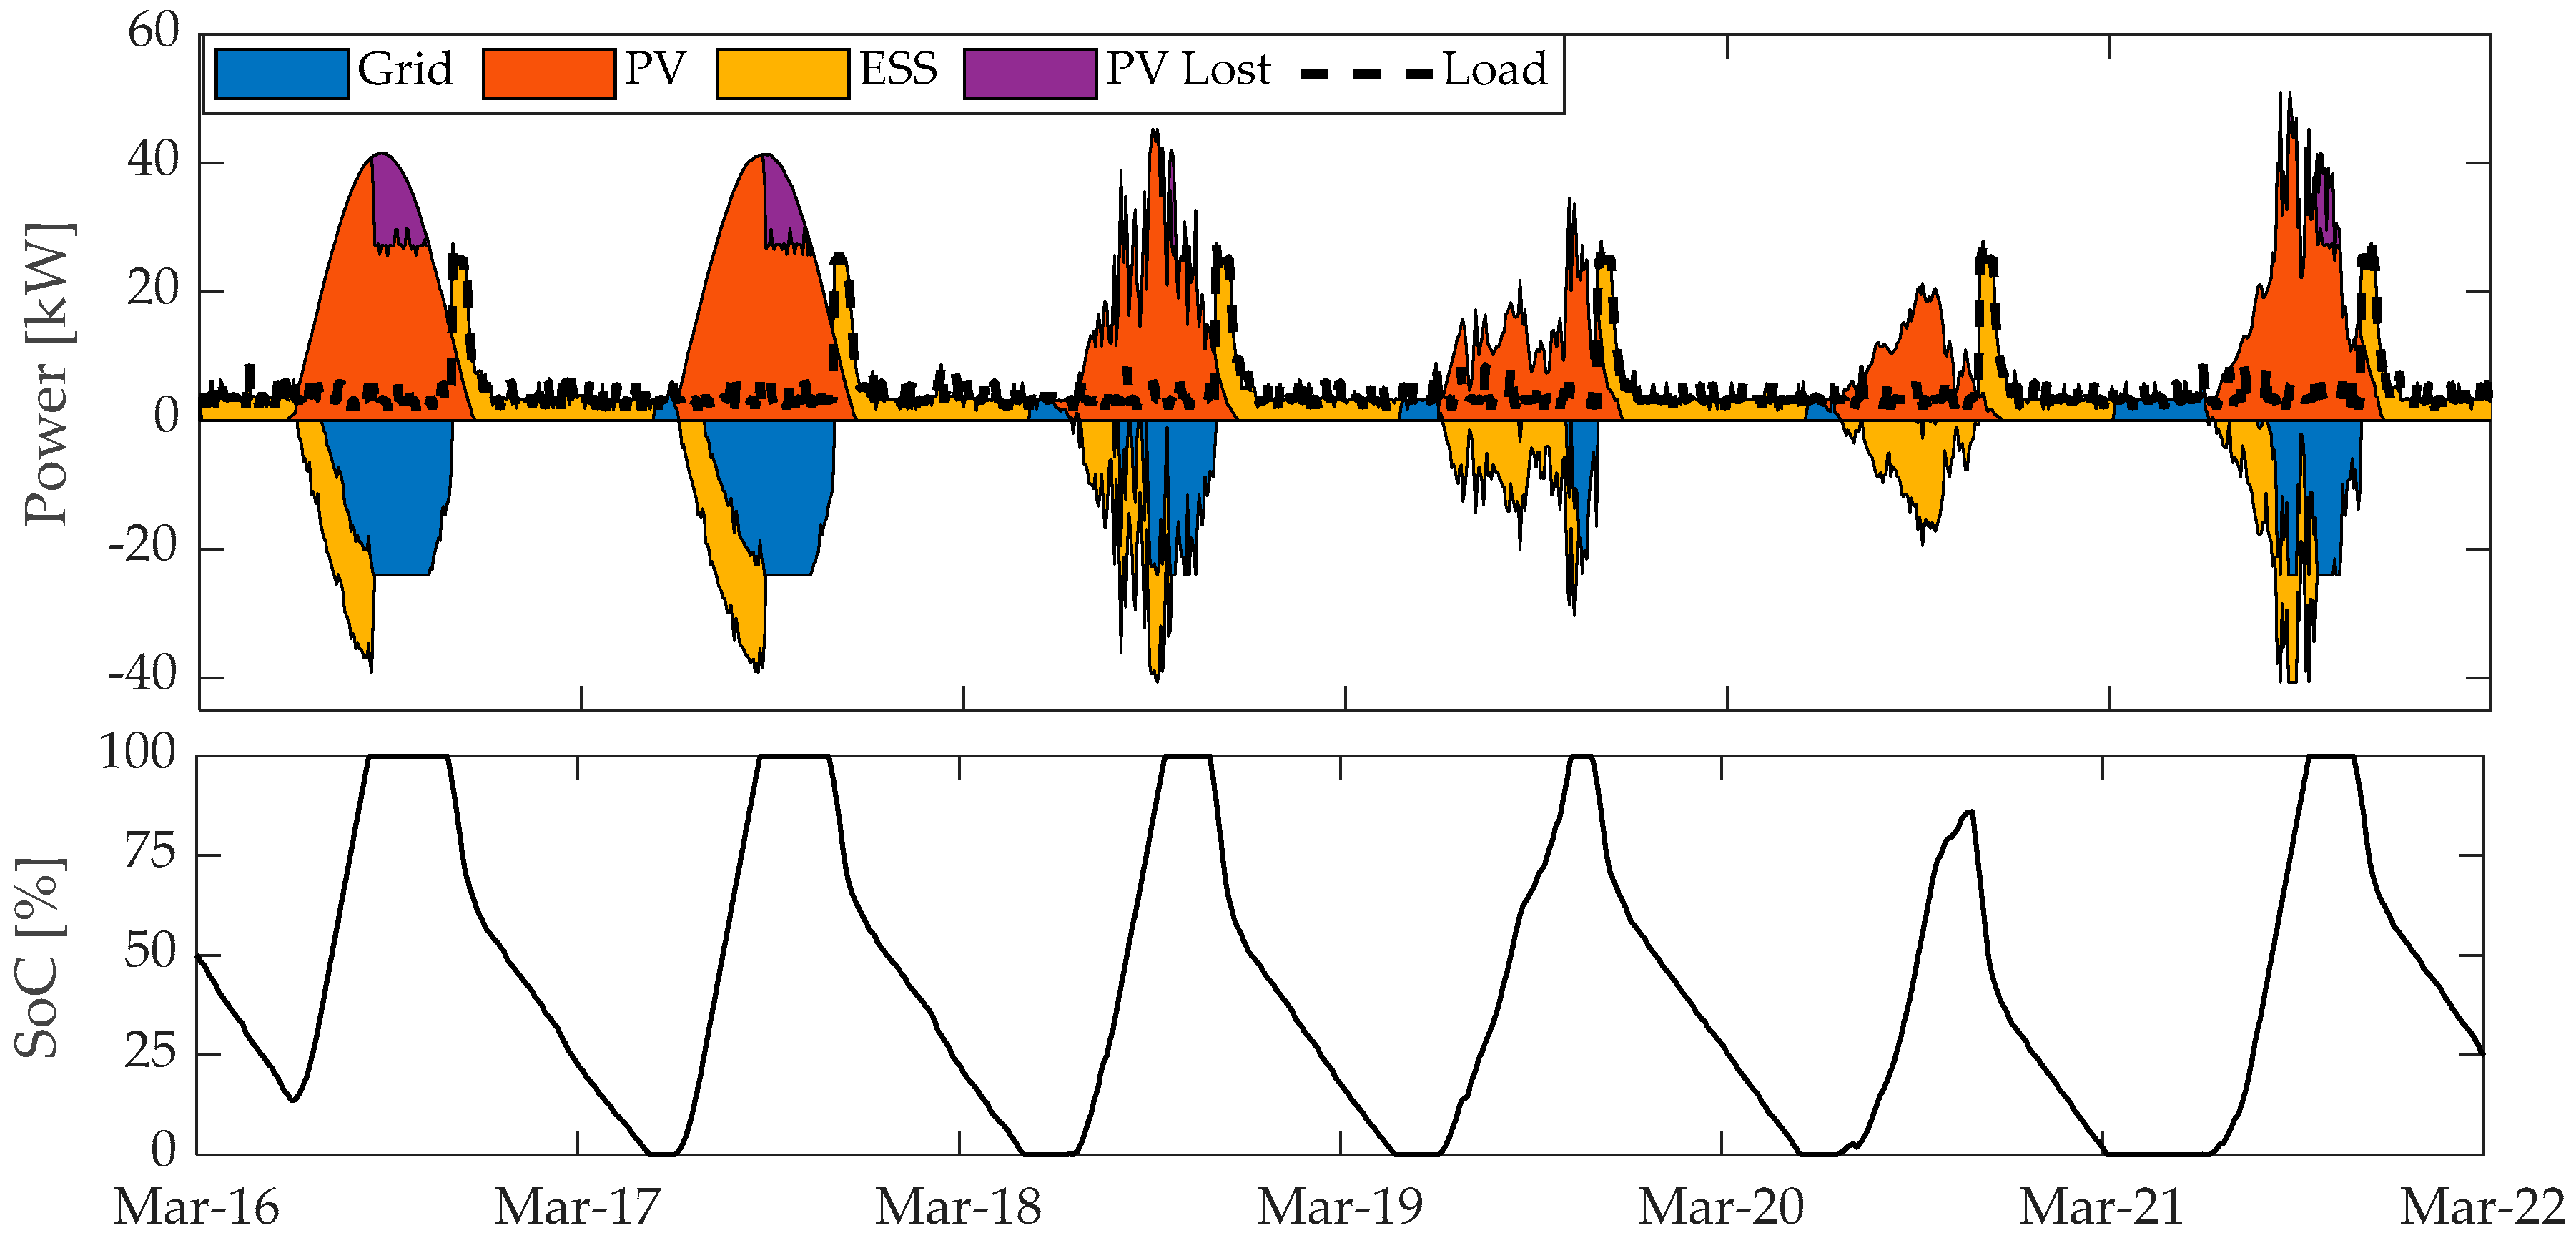
Figure 12 presents the reference LP optimization over 14 days-ahead forecasting. The evolution of the various powers (from or to the grid, from PV, and from or to the battery) are represented as a stacked area plot. The load is simply added on this graph and the SoC of the battery is presented as a subplot. By convention, the PV injected to the grid and the storage are represented as negative. The notion of PV lost represents the PV power which cannot be used due to microgrid limitation such as grid power limitation, battery charging power limitation, or full battery SoC. As this mainly impacts RBC strategies, it will be addressed further.
Several remarks can be made about Figure 12:
  • The battery never reached its minimum capacity during this period;
  • A period of three successive days of battery discharge appears;
  • The power limitation of 24 kW from and to the grid is reached several times during this period, showing the importance of the battery to provide or absorb the complementary power;
  • The battery SoC behavior has a very similar profile during the days with important PV production (clear sky days);
  • The plateau which appears every day on the SoC curve after 22:00 and until 4:00 comes from the electricity tariff change due to the transition from off-peak and peak hours. At this moment, it is more “cost-effective” to use the electricity provided by the electrical grid rather than from the battery;
  • Similarly, when the tariff changes from off-peak to peak hours (at 4:00) the SoC decreases because the utilization of the battery becomes more interesting.

3.1.1. RBC1

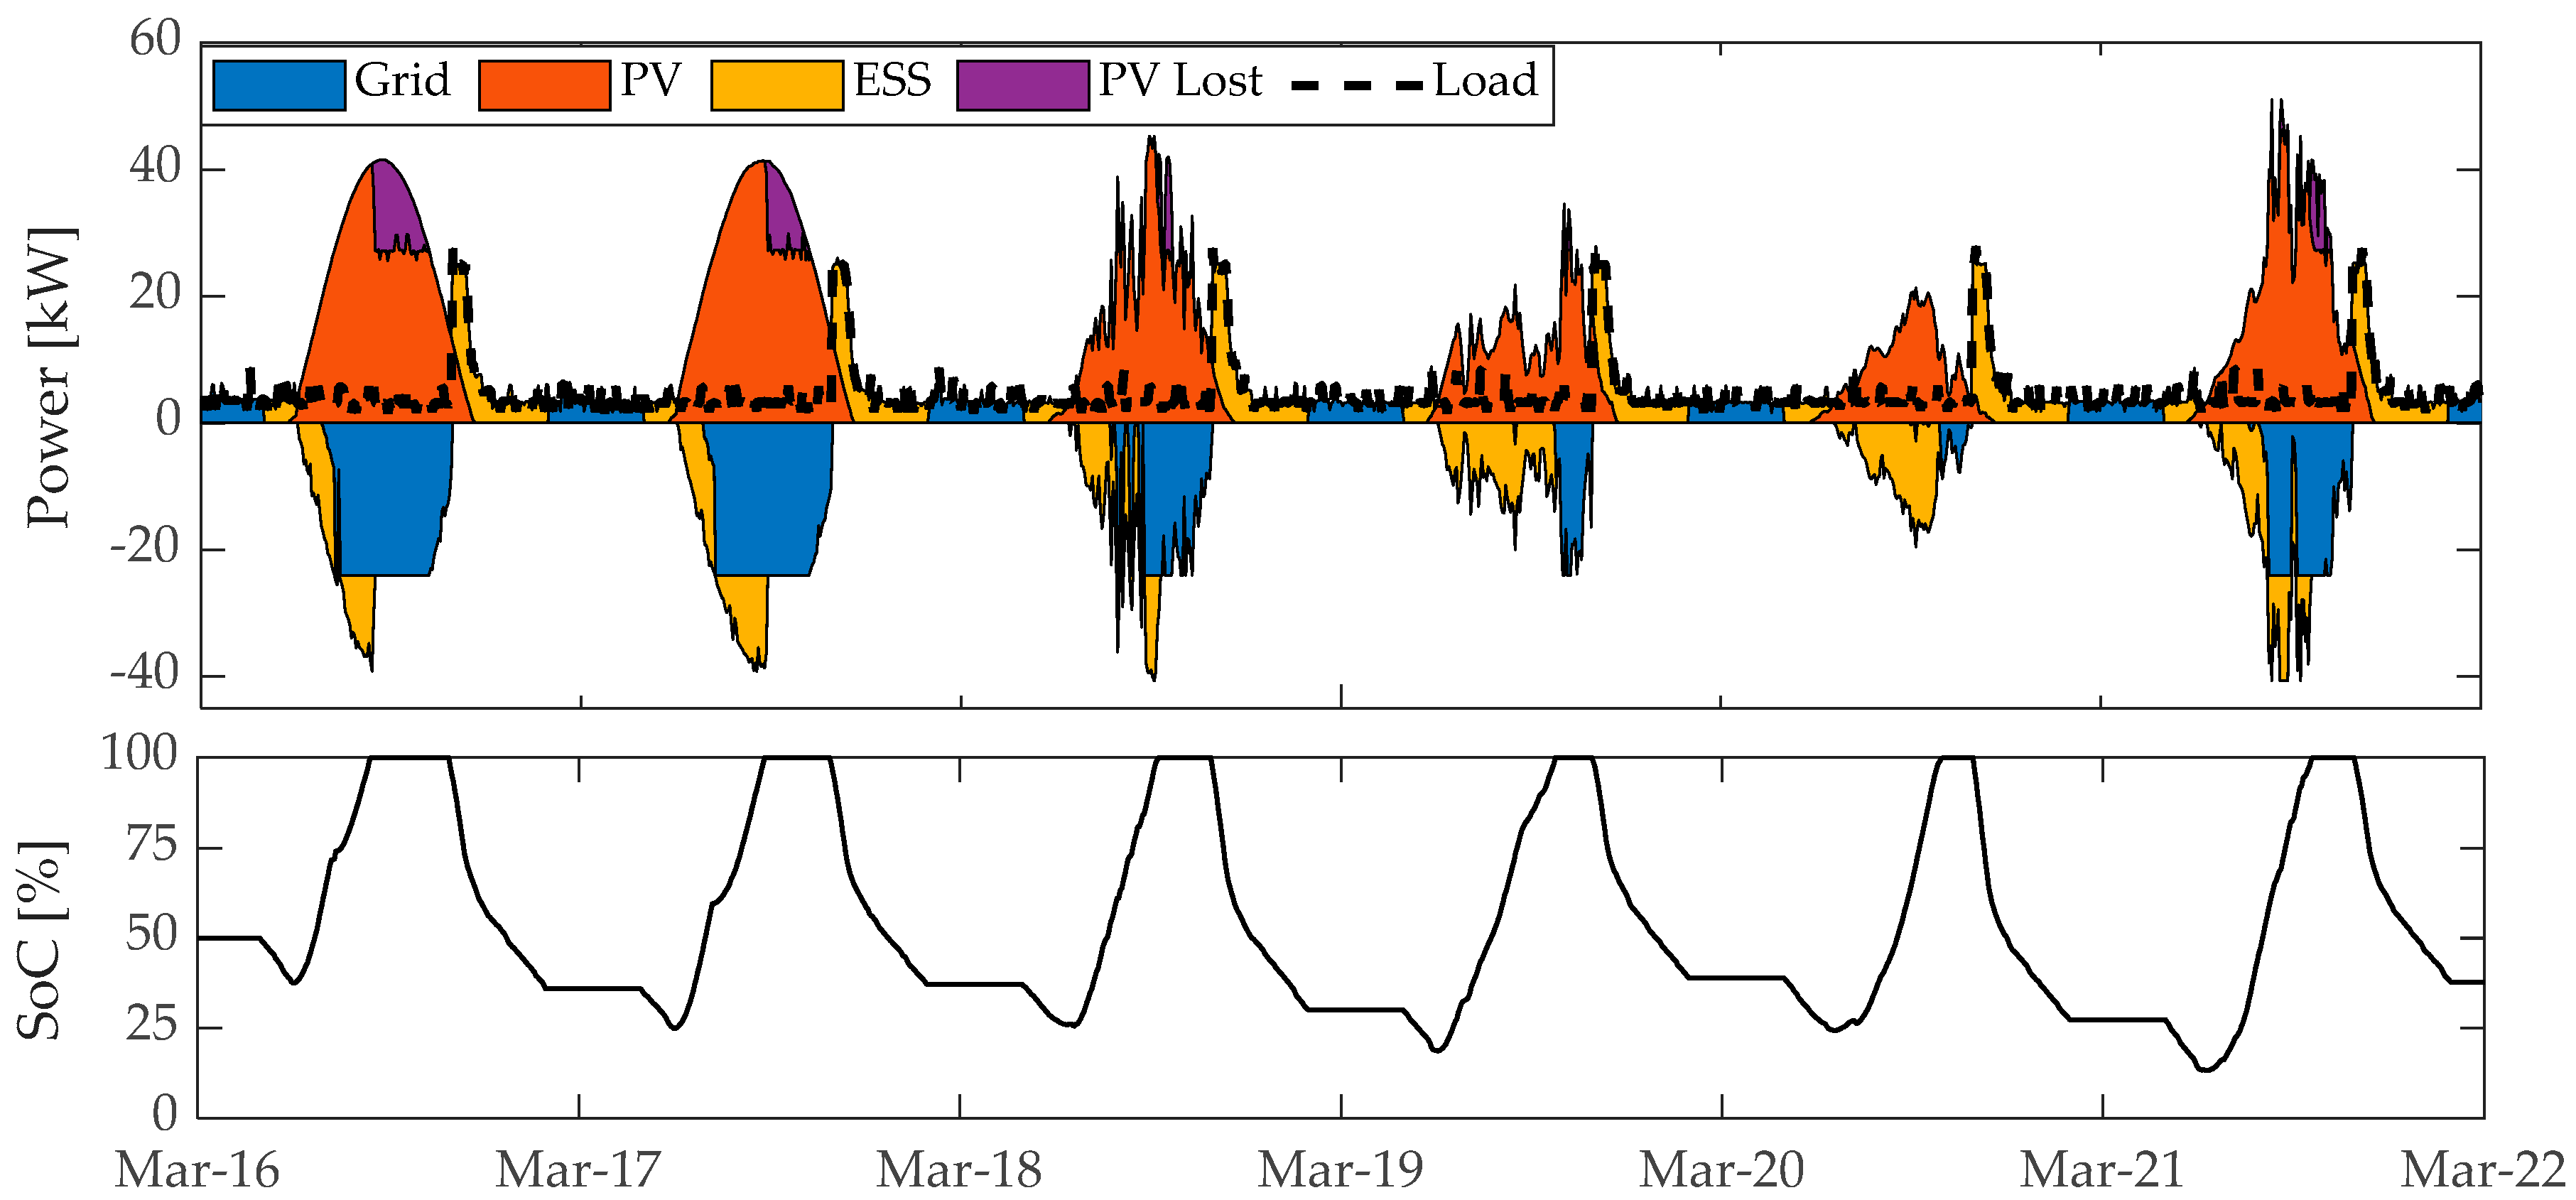
The results from the first six days of data with the RBC1 strategy are presented in Figure 13.
As a reminder, RBC1 is representative of a simple PV/battery system aiming to optimize self-consumption. This is an extremely simplistic strategy which does not take into account the electricity tariff and does not anticipate battery SoC, and thus leads to a poor result in the context of a microgrid which has not been sized for this specific application. Unlike the LP optimization, we can observe that the battery SoC reached its minimum and maximum values regularly. The battery was used significantly more frequently, with almost one full cycle each day. Due to the lack of optimization, the battery SoC reached 100% too early during the day. As the grid power limitation of 24 kW prevented the PV to sell the remaining power, this led to the apparition of PV lost. This phenomenon can always be observed during clear sky days.

3.1.2. RBC2

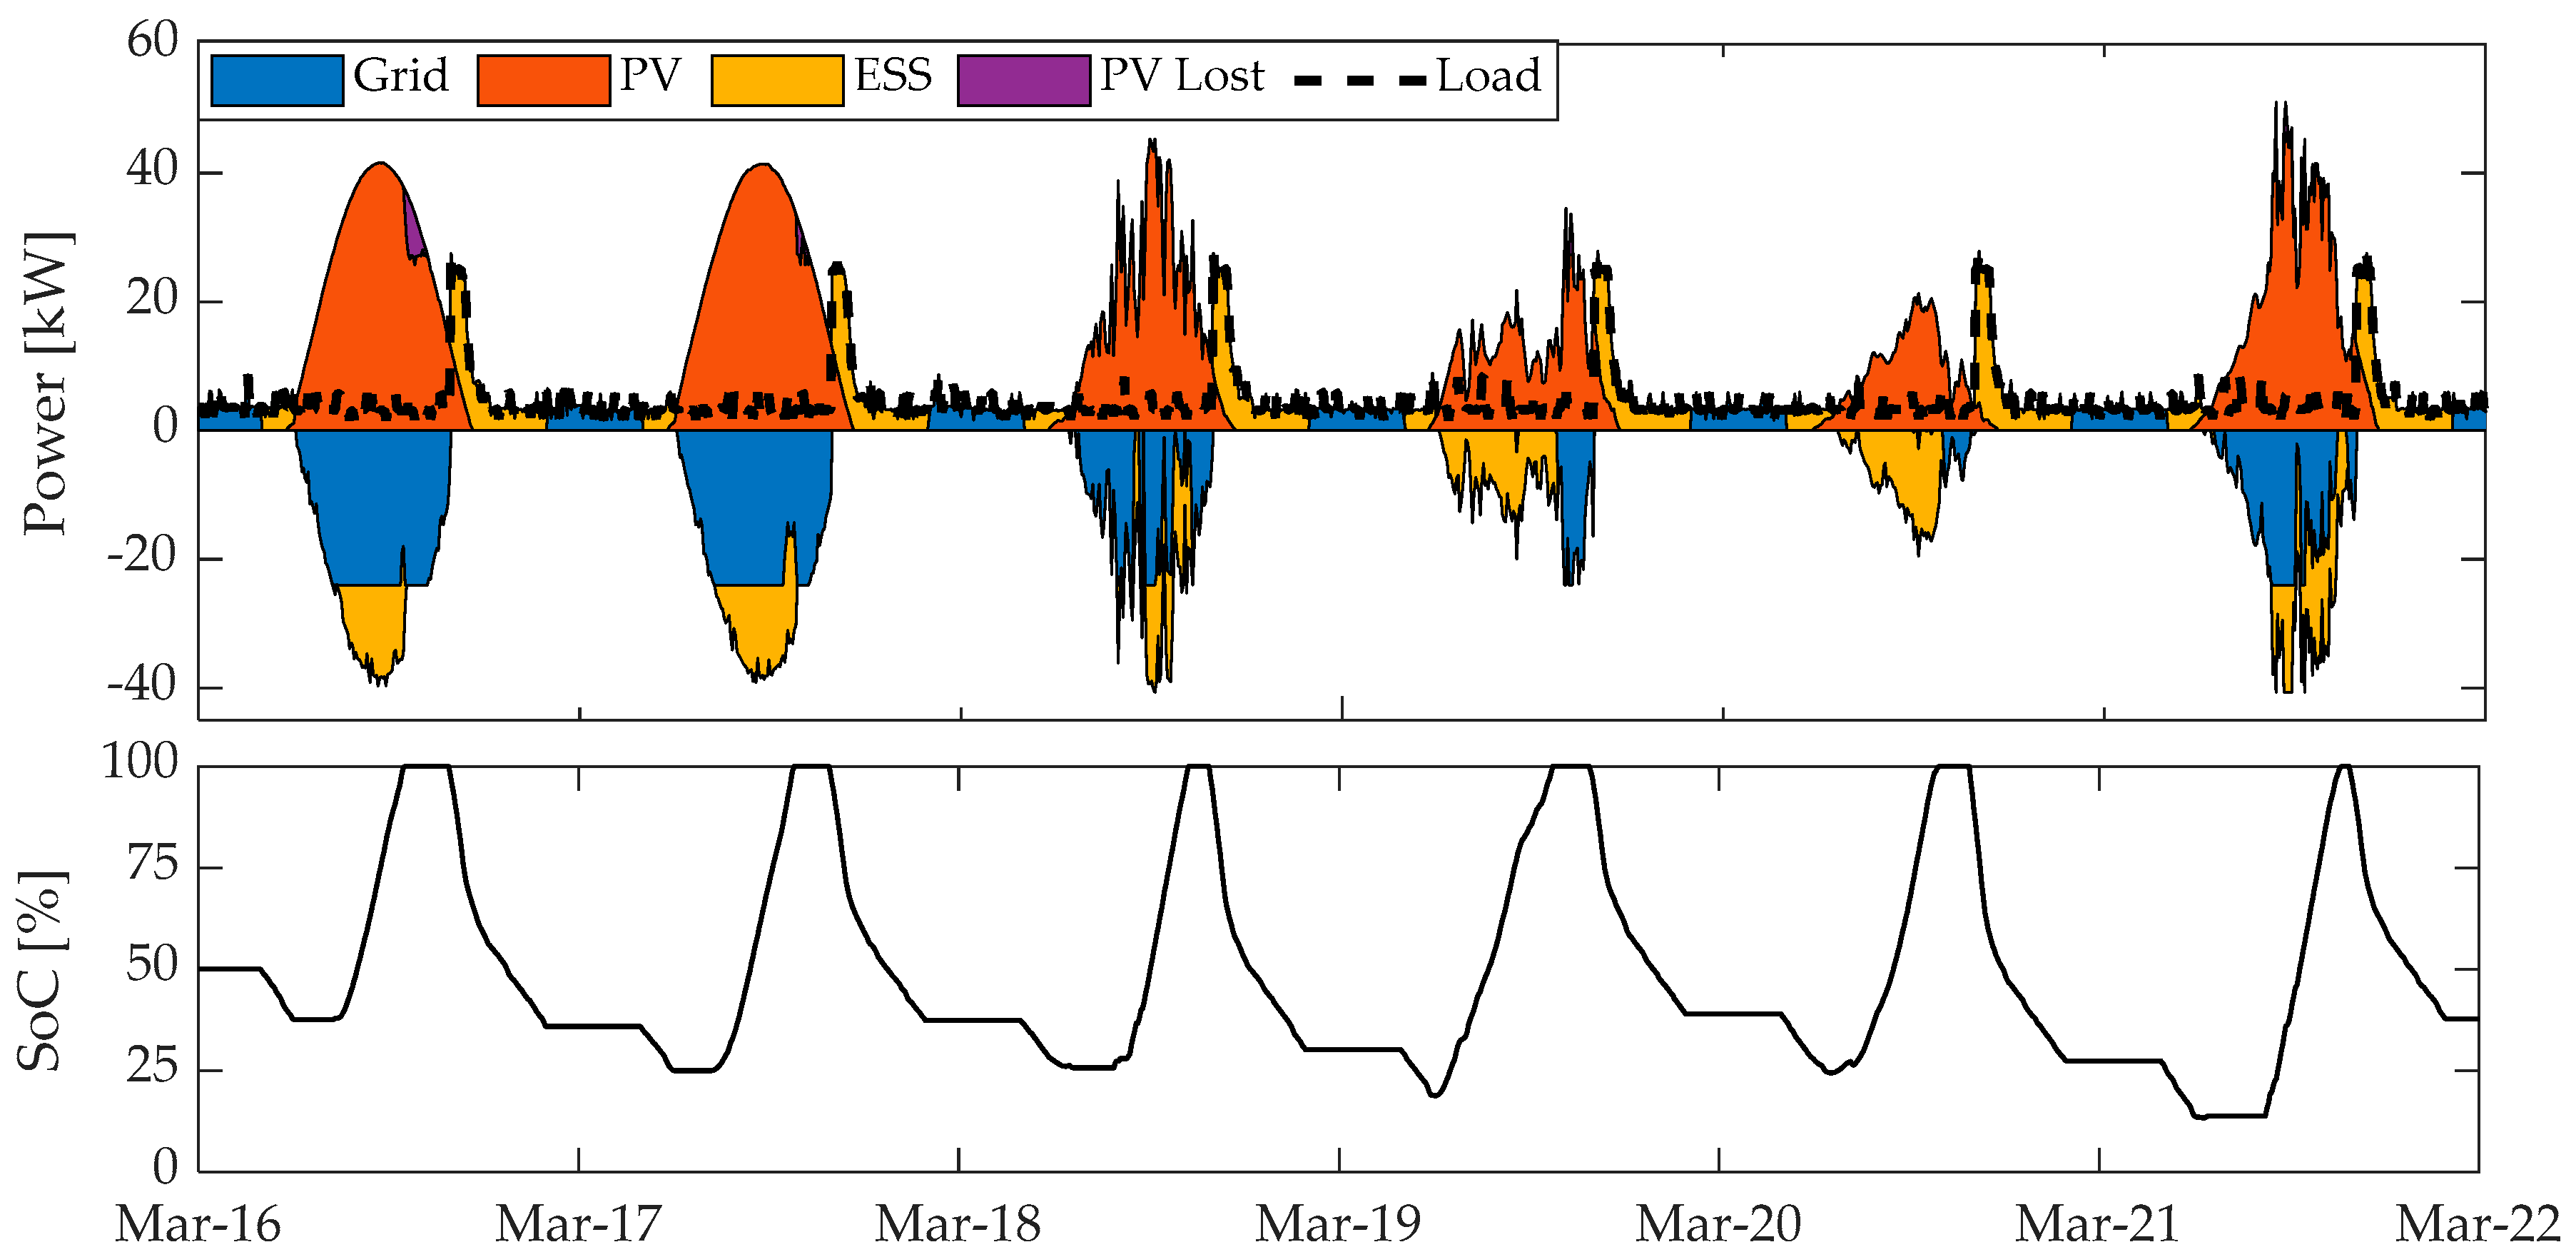
The results from the first six days of data with the RBC2 strategy are presented in Figure 14.
In this strategy, we observed the effect of peak and off-peak hours with the apparition of a plateau in the SoC curve before 4:00. This behavior was closer to the LP optimization. However, the lack of anticipation still led to an important quantity of PV lost during clear sky days. In terms of energy management, this strategy did not provide significant improvement, but it allowed an increase of the benefit, which is discussed later.

3.1.3. RBC3

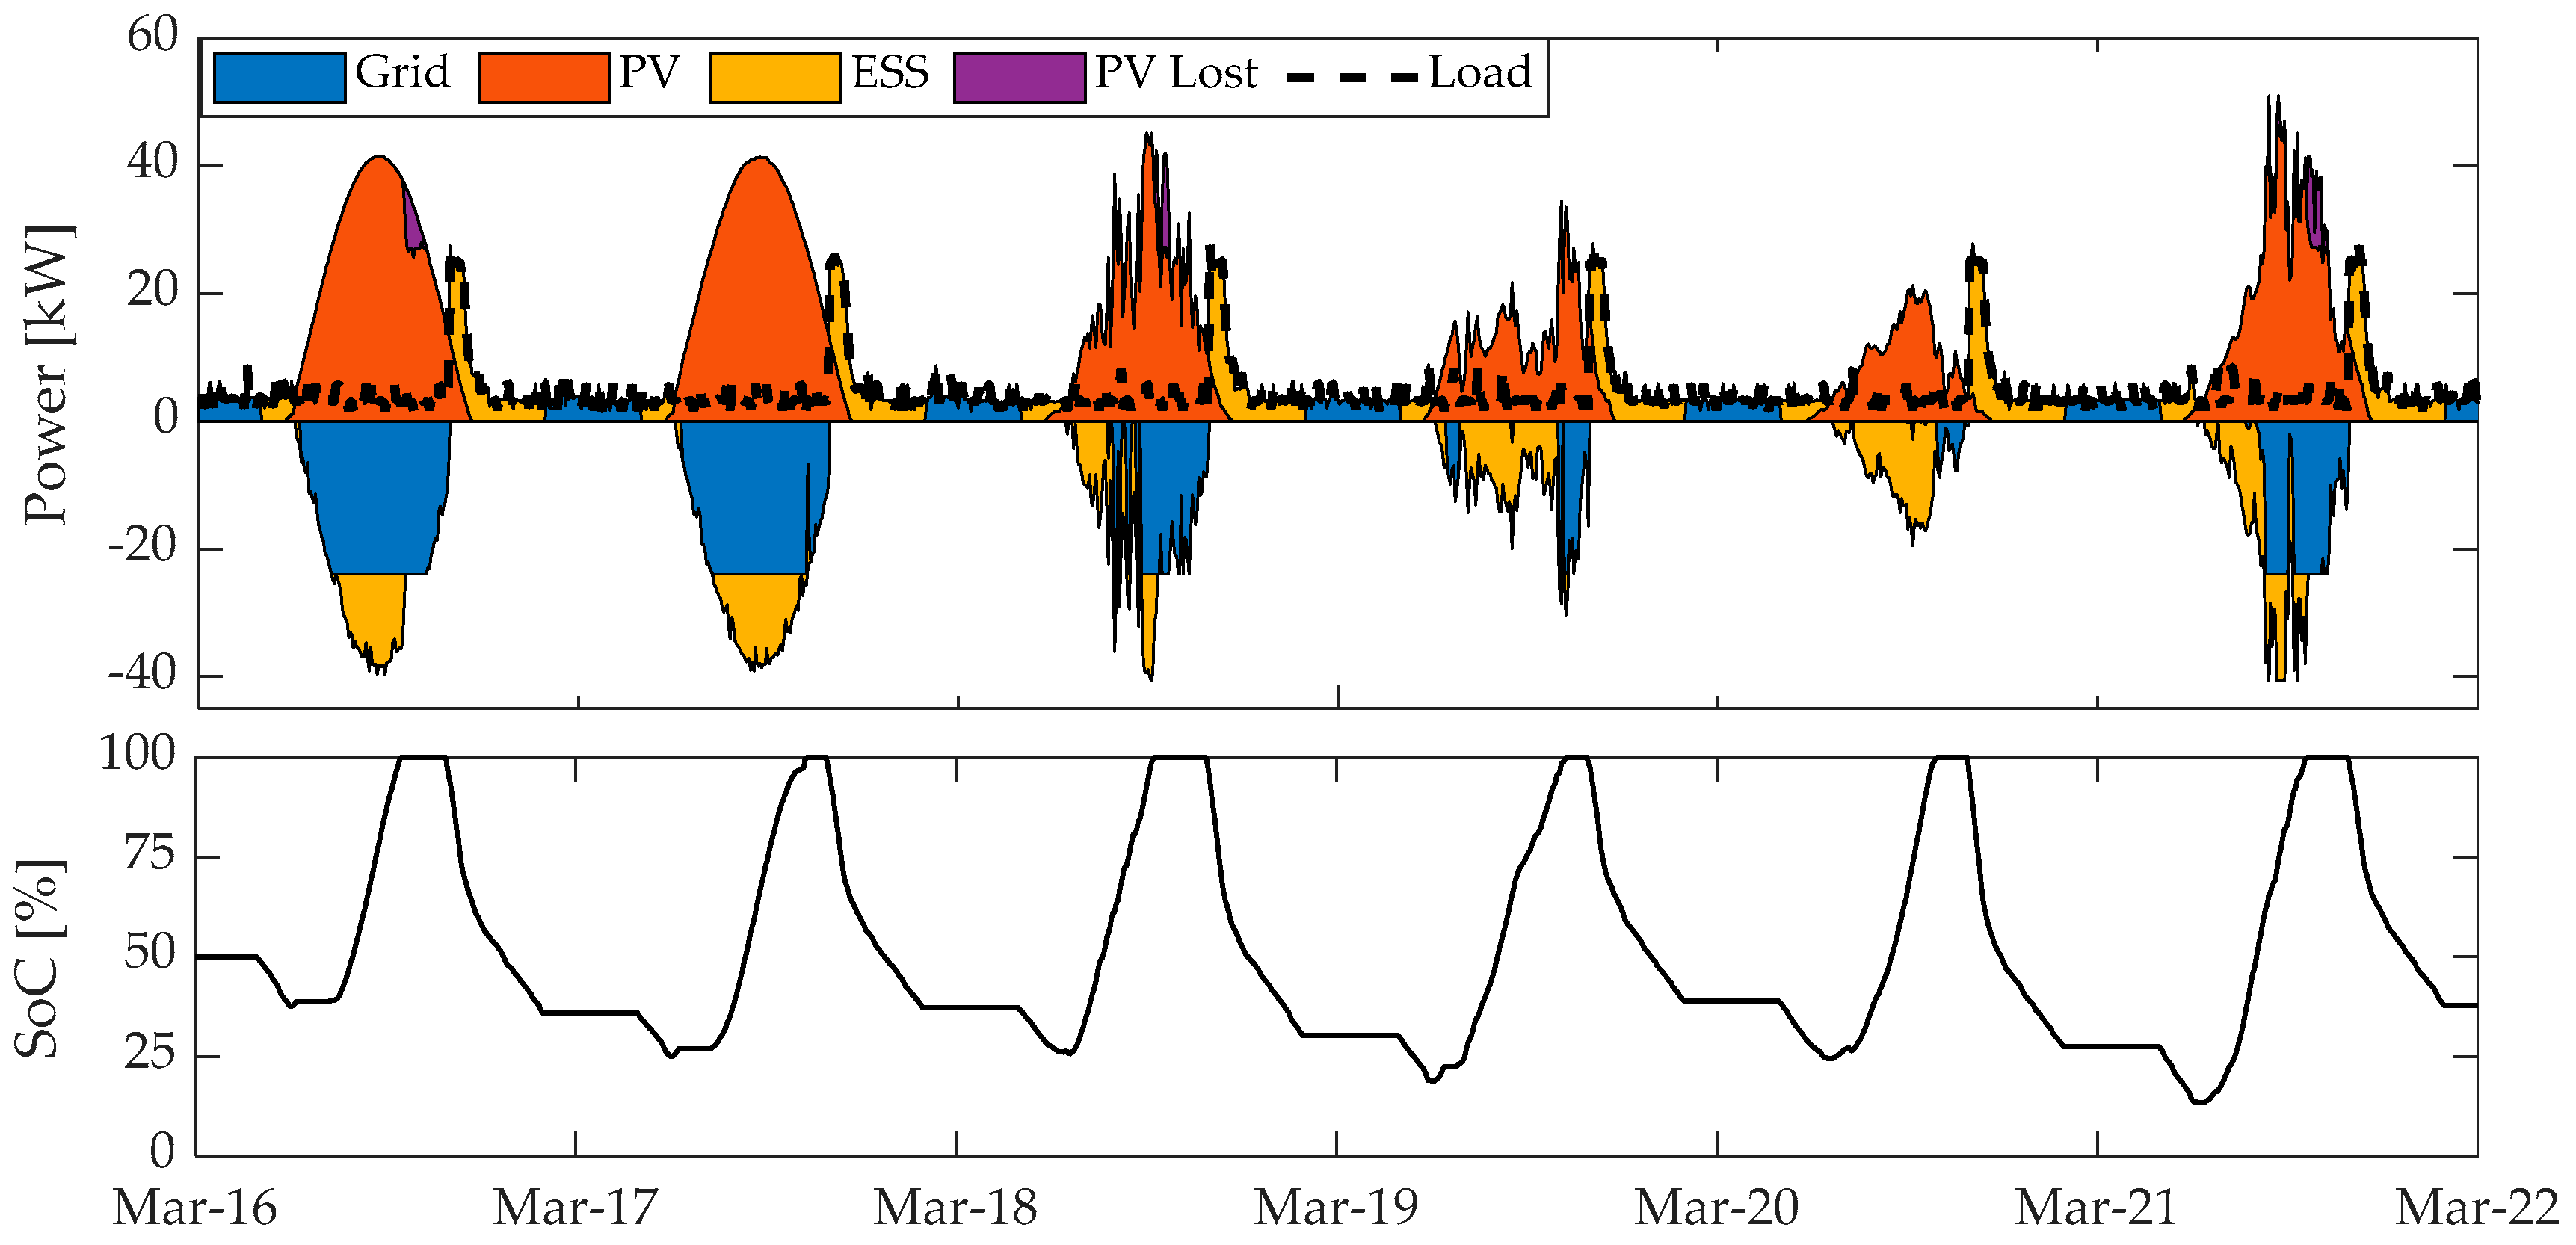
The next improvement was the addition of PV power forecasting in the form of mean power representative of the next six hours. In order to assess the potential of such improvement, we first present the results obtained with perfect forecasted data, RBC3r (Figure 15).
This strategy conserved the benefit of taking into account peak and off-peak hours but also anticipated the PV power variation. Such information was used to improve the battery management and reduce the PV lost. It can be observed that the battery SoC reached its maximum later in the day and for a shorter period. Thanks to the forecast, it was possible to anticipate clear sky days and start the battery charging slightly later than RBC2 strategy.
The same strategy was applied with real forecasted data from ARMA model (Figure 16).
Here, the forecast errors slightly degraded the overall performance of the strategy. The effects of under-forecasting can be observed during the third and sixth days. For these two days, the behavior was closer to RBC2. On day 4, the difference with RBC3r was due to an over-forecast of the PV power.

3.2. Main Results Discussion

Table 2 summarizes the results of the simulations in terms of gain and battery use. To point out the interest of the microgrid, the cost without storage (“w/o ESS”) has been added in this table. This should not be viewed as a proper strategy. Instead, it prefigures a more complete study, including CAPEX and OPEX. As the linear programing optimization (LP) is the optimal solution, we chose to also present the results as differences between each RBC strategy and LP. The relative performance represents the cost-wise performance of the RBC strategy compared to the LP optimization.
These results highlight the advantages of improving battery management strategies. With the most basic strategy, RBC1, the gain reached 79.2% of the LP optimization. By taking into account the peak and off-peak hours and with a slightly better battery management strategy, it increased to 87.8%. The addition of forecasting PV power averaged over a six-hour period was an important improvement, as it allowed the gain to reach 94.9%. We can note that ARMA model was sufficient for this application, as the use of perfect forecasted data only brought an improvement of 2.4%.
The number of battery cycles varied according to the strategy. It is observed that the optimization (LP) used fewer cycles than all other strategies, which is explained by the different energy tariffs and the battery efficiency, making battery use more expensive than using the public grid during off-peak hours.
To study the effect of each strategy on the energy use in the microgrid, Figure 17 presents the energy balances from the PV side and from the load side.
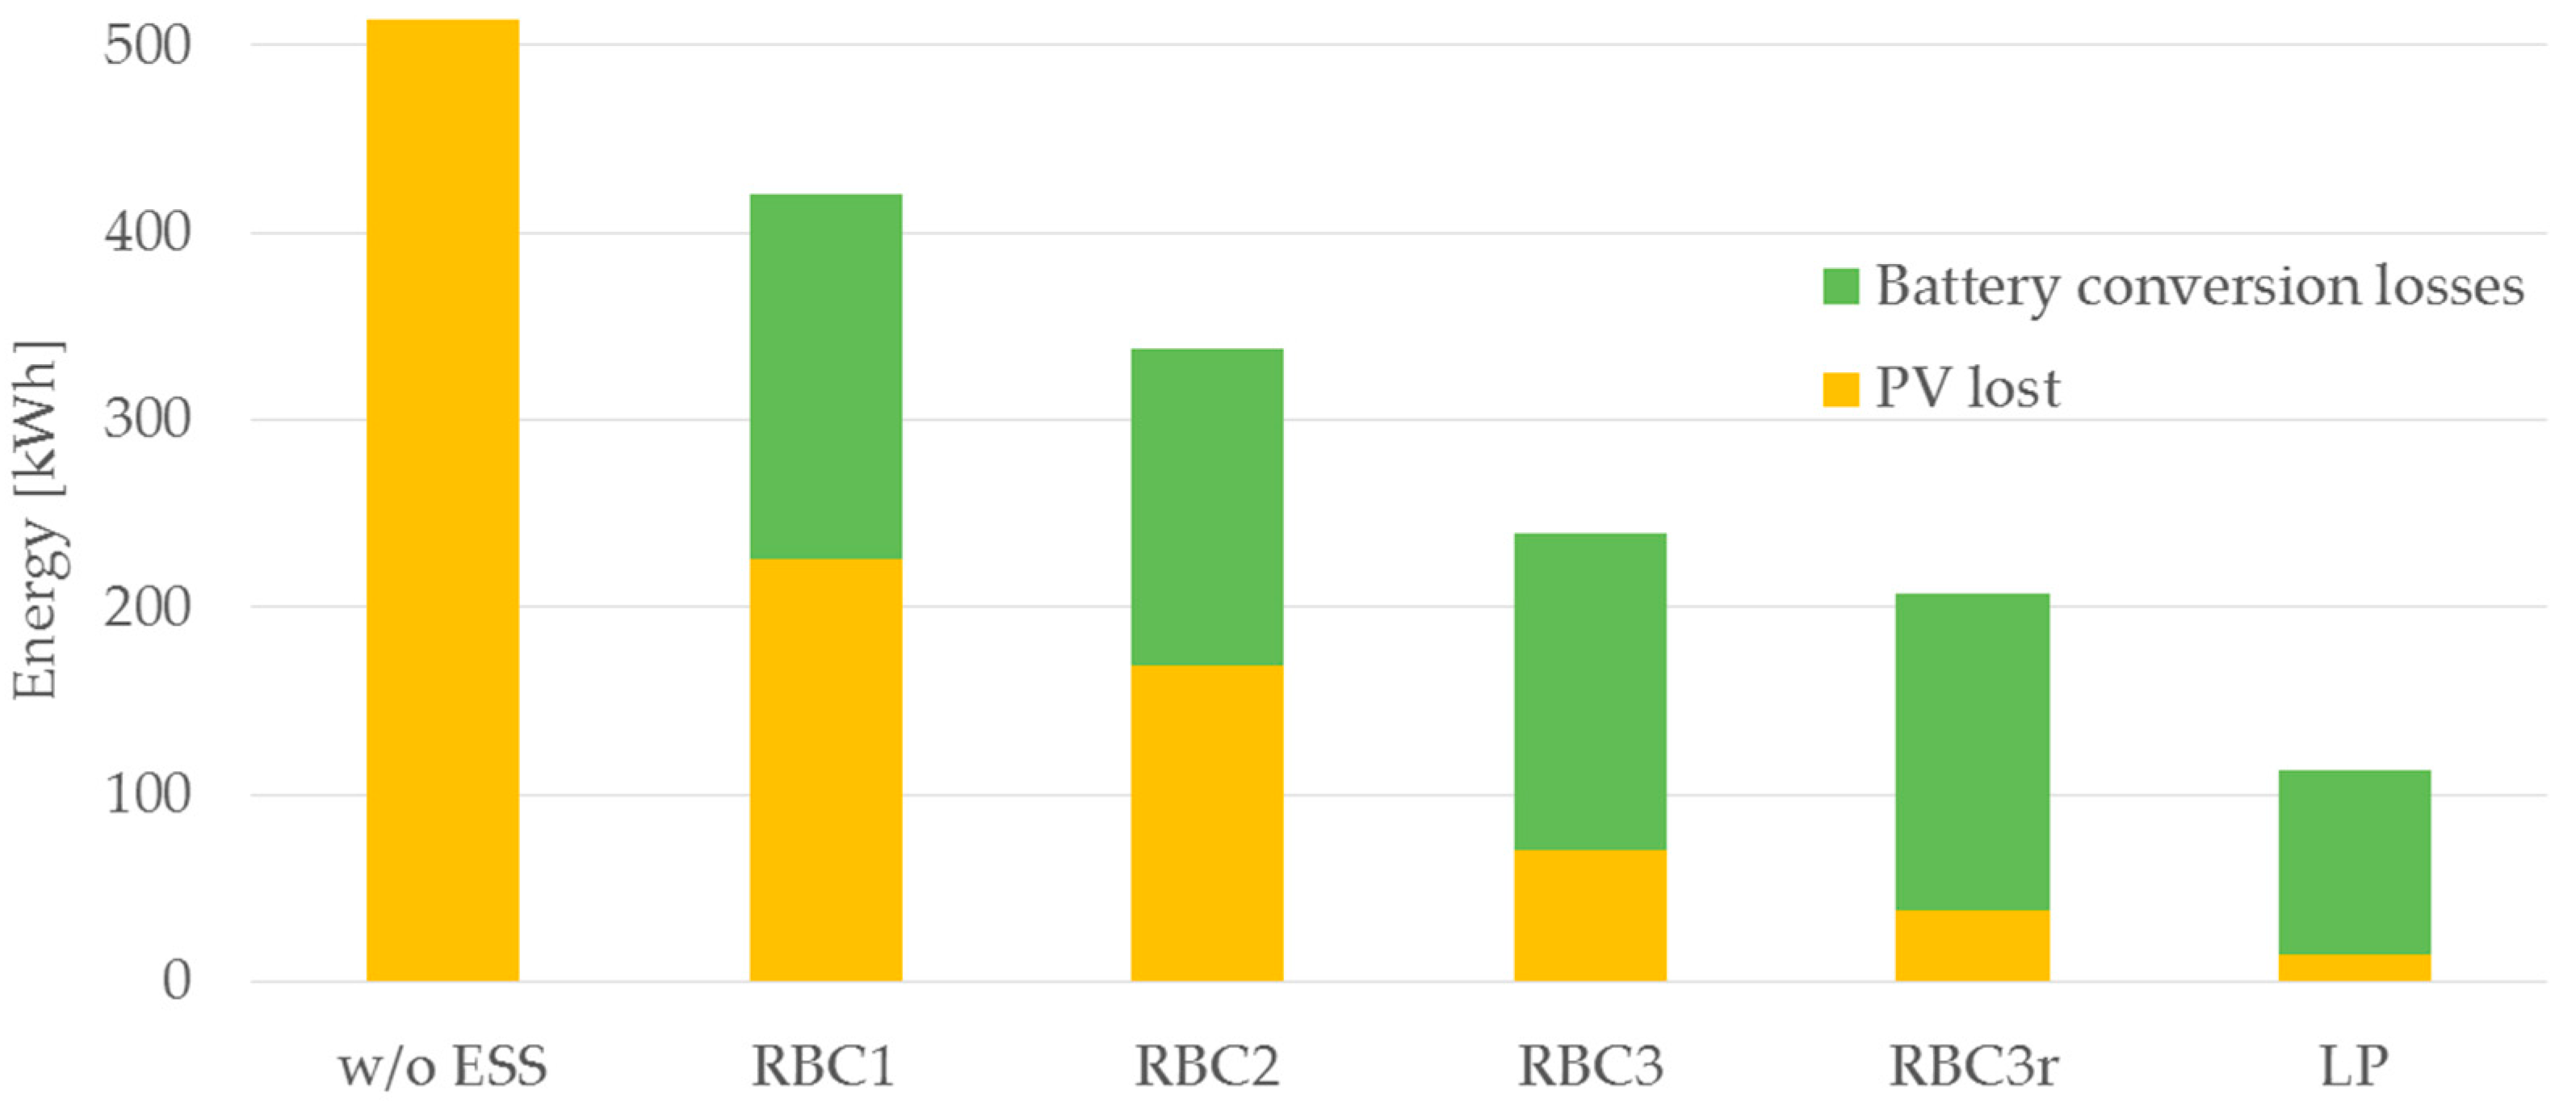
As all the RBC strategies prioritize the use of PV to supply the load, we found the same value of PV energy used for the load (blue). By maximizing the self-consumption, RBC1 offered the highest value (30.7%) of the solar energy fraction used to charge the battery. This fraction was minimal in the LP optimization, which only used it to minimize the PV lost. Concerning the PV lost, the improvement of the RBC strategies showed a decrease from one strategy to another. For this period, it is shown that it was possible to only lose a negligible part of PV (0.4%) with an optimized management. Without energy storage, this part would reach 15.6% of the total PV power.
On the right part of the Figure 17, we can observe the energy distribution to supply the load. It shows the importance of using the main grid at the right time to optimize the cost: The optimal solution (LP) is the one that used the most grid power to supply the load.
Figure 18 groups the PV lost and the battery losses for each case. In this study, the battery losses were only considered due to the charge and discharge efficiency. Without battery (w/o ESS), the PV lost was maximal due to the grid power limitation. For each RBC improvement, a decrease of the total losses was observed. It should be noted that even with the best RBC, we obtained twice the losses than the LP. Due to the current cost of electricity in France, the impact of these losses remains moderate.
The main conclusions of this section are:
  • An important improvement in terms of saved cost is obtained by switching from RBC2 to RBC3 (87.8% to 94.9%) thanks to the implementation of PV forecasting.
  • Comparison between RBC3 and RBC3r shows that the gain obtained with perfect forecasting is not significant (94.9% to 97.3%) compared to a standard ARMA model and considering that PV data have been averaged on a 6 h period.
  • The share of the PV production which is lost (due to full storage, PV power limitation sent to the grid or charge power limitation) decreases with each strategy improvement.

3.3. Corrected Tariffs Results

Table 3 presents the results with corrected energy purchase prices, considering the Corsican Island specificity.
When using correcting tariffs which could reflect the real cost in Corsica, we observed the importance of the energy storage system. With such high prices, the battery use should be maximized in order to rely as less as possible on the main grid. LP optimization now uses twice the number of cycles and converges to the RBC1. However, cost optimization is still a complex task, and we showed that the proposed RBC strategies were not well optimized with these new tariffs. A better consideration of these new tariffs should would provide results closer to the mathematical optimization, which can be done in a future work.

4. Conclusions

An electrical microgrid using a photovoltaic production and a battery storage supplied an accommodation building and an electric vehicle. It was connected to the main grid with a limited power both for sending and receiving electricity. The objectives of this paper were to test and compare some energy management strategies using rules-based control, including PV forecasting for the last one. These strategies were confronted to a linear programming optimization with “perfect forecasting.”
It appears that the performance of the strategy increases with its complexity. The implementation of PV forecasting using a standard ARMA model allows to increase the saved cost; the utilization of a “perfect forecasting” does not improve significantly the performance compared to our forecasting ARMA model and considering that PV data have been averaged on a 6 h period. The share of the PV production which is lost (due to full storage, PV power limitation sent to the grid or charge power limitation) decreases with each strategy improvement.
The optimization was implemented considering the real purchase tariff of electricity (and taking into account a peak and off-peak periods) and the actual selling price of PV electricity. In view to observe the influence of these costs on the performances of the energy management methods, special cost hypotheses were also introduced in this study. They considered the over-costs of electricity production in Corsican Island due to the limited interconnection with the mainland electrical grid. The use of corrected tariffs shows the importance of the storage system: the number of cycles should be maximized when the purchase costs are high.
The perspectives of this first approach may be:
  • Assessment of the grid power limitation for network service (peak power shaving, guaranteed power, etc.).
  • Development of new energy management strategies such as MILP to take into account more constraints (load management).
  • Implementation and test of selected strategies in real operating conditions on PAGLIA ORBA microgrid.
  • Improvements of the cost calculation by including CAPEX and OPEX of the system.

Author Contributions

Conceptualization, G.A.F. and G.P.; software, S.O. and J.L.D.; investigation, S.O.; resources, J.L.D.; data curation, G.P.; writing—original draft preparation, S.O., G.N. and G.A.F.; supervision, G.N. All authors have read and agreed to the published version of the manuscript.

Funding

This research received no external funding.

Conflicts of Interest

The authors declare no conflict of interest.

Nomenclature

ARMAAuto Regressive Mobile Average
CAPEXCapital Expense
DGDistributed Generation
DoDDepth of Discharge
ESEnergy Storage
EMSEnergy Management System
EVElectric Vehicle
LPLinear Programing
MILPMixed Integer Linear Programing
MPCModel Predictive Control
nRMSEnormalized Root Mean Squared Error
OPEXOperating Expense
PVPhotovoltaic
RBCRule Based Control
SoCState of Charge
V2GVehicle to Grid
V2HVehicle to Home
P p PV power
P l Load power
P g Grid power
P d Degraded PV power
P m Missing power
P p , l PV power to load
P p , b PV power to battery
P p , g PV power to grid
P b , l Battery power to load
P b , g Battery power to grid
P g , l Grid power to load
C b u y Energy buying price
C s e l l Energy selling price
P p n o m PV array nominal power
P i n v m a x Inverter maximum power
P g o u t m a x Grid maximum power output
P g i n m a x Grid maximum power input
P b i n m a x Battery maximum power input
P b o u t m a x Battery maximum power output
P b i n a d m Battery admissible power input
P b o u t a d m Battery admissible power output
C E S S Battery useful capacity
η i n Battery charge efficiency
η o u t Battery discharge efficiency

References

  1. IEA PVPS Task 1 Strategic PV Analysis and Outreach. Available online: https://www.comitesolar.cl/wp-content/uploads/2020/04/IEA_PVPS_Snapshot_2020-2.pdf (accessed on 28 August 2020).
  2. Jäger-Waldau, A. Snapshot of Photovoltaics—February 2020. Energies 2020, 13, 930. [Google Scholar] [CrossRef] [Green Version]
  3. Lara-Fanego, V.; Ruiz-Arias, J.A.; Pozo-Vázquez, D.; Santos-Alamillos, F.J.; Tovar-Pescador, J. Evaluation of the WRF model solar irradiance forecasts in Andalusia (southern Spain). Solar Energy 2012, 86, 2200–2217. [Google Scholar] [CrossRef]
  4. Espinar, B.; Aznarte, J.-L.; Girard, R.; Moussa, A.M.; Kariniotakis, G. Photovoltaic Forecasting: A State of the Art; OTTI—Ostbayerisches Technologie-Transfer-Institut: Tarragona, Spain, 2010; pp. 250–255. ISBN 978-3-941785-15-1. [Google Scholar]
  5. Robert, G.; Philip, H.; Dennis, A.; Tim, G.; Matthew, L.; Jim, S. The Costs and Impacts of Intermittency: An Assessment of the Evidence on the Costs and Impacts of Intermittent Generation on the British Electricity Network; UK Energy Research Centre: London, UK, 2006. [Google Scholar]
  6. Notton, G. Importance of islands in renewable energy production and storage: The situation of the French islands. Renew. Sustain. Energy Rev. 2015, 47, 260–269. [Google Scholar] [CrossRef]
  7. Destro, N.; Benato, A.; Stoppato, A.; Mirandola, A. Components design and daily operation optimization of a hybrid system with energy storages. Energy 2016, 117, 569–577. [Google Scholar] [CrossRef]
  8. Cooper, M. Renewable and distributed resources in a post-Paris low carbon future: The key role and political economy of sustainable electricity. Energy Res. Soc. Sci. 2016, 19, 66–93. [Google Scholar] [CrossRef]
  9. Yeatts, D.E.; Auden, D.; Cooksey, C.; Chen, C.-F. A systematic review of strategies for overcoming the barriers to energy-efficient technologies in buildings. Energy Res. Soc. Sci. 2017, 32, 76–85. [Google Scholar] [CrossRef]
  10. Sartori, I.; Napolitano, A.; Voss, K. Net zero energy buildings: A consistent definition framework. Energy Build. 2012, 48, 220–232. [Google Scholar] [CrossRef] [Green Version]
  11. Langbroek, J.H.M.; Franklin, J.P.; Susilo, Y.O. When do you charge your electric vehicle? A stated adaptation approach. Energy Policy 2017, 108, 565–573. [Google Scholar] [CrossRef]
  12. Cao, C.; Wu, Z.; Chen, B. Electric Vehicle—Grid Integration with Voltage Regulation in Radial Distribution Networks. Energies 2020, 13, 1802. [Google Scholar] [CrossRef] [Green Version]
  13. Marczinkowski, H.M.; Østergaard, P.A. Residential versus communal combination of photovoltaic and battery in smart energy systems. Energy 2018, 152, 466–475. [Google Scholar] [CrossRef] [Green Version]
  14. Luo, F.; Ranzi, G.; Wang, S.; Dong, Z.Y. Hierarchical Energy Management System for Home Microgrids. IEEE Trans. Smart Grid 2019, 10, 5536–5546. [Google Scholar] [CrossRef]
  15. Zheng, M. Smart Households: Economics and Emission Impacts of Distributed Energy Storage for Residential Sector Demand Response; Columbia University: New York, NY, USA, 2015. [Google Scholar]
  16. Zhao, Z.; Lee, W.C.; Shin, Y.; Song, K. An Optimal Power Scheduling Method for Demand Response in Home Energy Management System. IEEE Trans. Smart Grid 2013, 4, 1391–1400. [Google Scholar] [CrossRef]
  17. Pedrasa, M.A.A.; Spooner, T.D.; MacGill, I.F. Coordinated Scheduling of Residential Distributed Energy Resources to Optimize Smart Home Energy Services. IEEE Trans. Smart Grid 2010, 1, 134–143. [Google Scholar] [CrossRef]
  18. Ozturk, Y.; Senthilkumar, D.; Kumar, S.; Lee, G. An Intelligent Home Energy Management System to Improve Demand Response. IEEE Trans. Smart Grid 2013, 4, 694–701. [Google Scholar] [CrossRef]
  19. Chen, X.; Wei, T.; Hu, S. Uncertainty-Aware Household Appliance Scheduling Considering Dynamic Electricity Pricing in Smart Home. IEEE Trans. Smart Grid 2013, 4, 932–941. [Google Scholar] [CrossRef]
  20. Missaoui, R.; Joumaa, H.; Ploix, S.; Bacha, S. Managing energy Smart Homes according to energy prices: Analysis of a Building Energy Management System. Energy Build. 2014, 71, 155–167. [Google Scholar] [CrossRef]
  21. Iwafune, Y.; Ikegami, T.; Fonseca, J.G.d.S.; Oozeki, T.; Ogimoto, K. Cooperative home energy management using batteries for a photovoltaic system considering the diversity of households. Energy Convers. Manag. 2015, 96, 322–329. [Google Scholar] [CrossRef]
  22. Erdinc, O. Economic impacts of small-scale own generating and storage units, and electric vehicles under different demand response strategies for smart households. Appl. Energy 2014, 126, 142–150. [Google Scholar] [CrossRef]
  23. Wu, X.; Hu, X.; Moura, S.; Yin, X.; Pickert, V. Stochastic control of smart home energy management with plug-in electric vehicle battery energy storage and photovoltaic array. J. Power Sources 2016, 333, 203–212. [Google Scholar] [CrossRef] [Green Version]
  24. Wu, X.; Hu, X.; Teng, Y.; Qian, S.; Cheng, R. Optimal integration of a hybrid solar-battery power source into smart home nanogrid with plug-in electric vehicle. J. Power Sources 2017, 363, 277–283. [Google Scholar] [CrossRef] [Green Version]
  25. Li, B.; Roche, R.; Miraoui, A. Microgrid sizing with combined evolutionary algorithm and MILP unit commitment. Appl. Energy 2017, 188, 547–562. [Google Scholar] [CrossRef] [Green Version]
  26. Bruni, G.; Cordiner, S.; Mulone, V.; Sinisi, V.; Spagnolo, F. Energy management in a domestic microgrid by means of model predictive controllers. Energy 2016, 108, 119–131. [Google Scholar] [CrossRef]
  27. Carli, R.; Dotoli, M.; Jantzen, J.; Kristensen, M.; Ben Othman, S. Energy scheduling of a smart microgrid with shared photovoltaic panels and storage: The case of the Ballen marina in Samsø. Energy 2020, 198, 117188. [Google Scholar] [CrossRef]
  28. Villalón, A.; Rivera, M.; Salgueiro, Y.; Muñoz, J.; Dragičević, T.; Blaabjerg, F. Predictive Control for Microgrid Applications: A Review Study. Energies 2020, 13, 2454. [Google Scholar] [CrossRef]
  29. Zia, M.F.; Elbouchikhi, E.; Benbouzid, M. Microgrids energy management systems: A critical review on methods, solutions, and prospects. Appl. Energy 2018, 222, 1033–1055. [Google Scholar] [CrossRef]
  30. Sharma, A.; Kolhe, M. Techno-economic evaluation of PV based institutional smart micro-grid under energy pricing dynamics. J. Clean. Prod. 2020, 264, 121486. [Google Scholar] [CrossRef]
  31. Wang, Y.; Huang, Y.; Wang, Y.; Zeng, M.; Li, F.; Wang, Y.; Zhang, Y. Energy management of smart micro-grid with response loads and distributed generation considering demand response. J. Clean. Prod. 2018, 197, 1069–1083. [Google Scholar] [CrossRef]
  32. Khorasany, M.; Azuatalam, D.; Glasgow, R.; Liebman, A.; Razzaghi, R. Transactive Energy Market for Energy Management in Microgrids: The Monash Microgrid Case Study. Energies 2020, 13, 2010. [Google Scholar] [CrossRef]
  33. Zethmayr, J.; Kolata, D. The costs and benefits of real-time pricing: An empirical investigation into consumer bills using hourly energy data and prices. Electr. J. 2018, 31, 50–57. [Google Scholar] [CrossRef]
  34. Cai, J.; Zhang, H.; Jin, X. Aging-aware predictive control of PV-battery assets in buildings. Appl. Energy 2019, 236, 478–488. [Google Scholar] [CrossRef]
  35. Zia, M.F.; Elbouchikhi, E.; Benbouzid, M. Optimal operational planning of scalable DC microgrid with demand response, islanding, and battery degradation cost considerations. Appl. Energy 2019, 237, 695–707. [Google Scholar] [CrossRef]
  36. Mahmud, K.; Town, G.E.; Morsalin, S.; Hossain, M.J. Integration of electric vehicles and management in the internet of energy. Renew. Sustain. Energy Rev. 2018, 82, 4179–4203. [Google Scholar] [CrossRef]
  37. Onishi, V.C.; Antunes, C.H.; Trovão, J.P.F. Optimal Energy and Reserve Market Management in Renewable Microgrid-PEVs Parking Lot Systems: V2G, Demand Response and Sustainability Costs. Energies 2020, 13, 1884. [Google Scholar] [CrossRef] [Green Version]
  38. Hu, J.; Morais, H.; Sousa, T.; Lind, M. Electric vehicle fleet management in smart grids: A review of services, optimization and control aspects. Renew. Sustain. Energy Rev. 2016, 56, 1207–1226. [Google Scholar] [CrossRef] [Green Version]
  39. Yang, Z.; Li, K.; Foley, A. Computational scheduling methods for integrating plug-in electric vehicles with power systems: A review. Renew. Sustain. Energy Rev. 2015, 51, 396–416. [Google Scholar] [CrossRef]
  40. Azadfar, E.; Sreeram, V.; Harries, D. The investigation of the major factors influencing plug-in electric vehicle driving patterns and charging behaviour. Renew. Sustain. Energy Rev. 2015, 42, 1065–1076. [Google Scholar] [CrossRef]
  41. Tascikaraoglu, A. Evaluation of spatio-temporal forecasting methods in various smart city applications. Renew. Sustain. Energy Rev. 2018, 82, 424–435. [Google Scholar] [CrossRef]
  42. García-Villalobos, J.; Zamora, I.; San Martín, J.I.; Asensio, F.J.; Aperribay, V. Plug-in electric vehicles in electric distribution networks: A review of smart charging approaches. Renew. Sustain. Energy Rev. 2014, 38, 717–731. [Google Scholar] [CrossRef]
  43. Kyriakopoulos, G.L.; Arabatzis, G. Electrical energy storage systems in electricity generation: Energy policies, innovative technologies, and regulatory regimes. Renew. Sustain. Energy Rev. 2016, 56, 1044–1067. [Google Scholar] [CrossRef]
  44. Ioannidis, A.; Chalvatzis, K.J.; Li, X.; Notton, G.; Stephanides, P. The case for islands’ energy vulnerability: Electricity supply diversity in 44 global islands. Renew. Energy 2019, 143, 440–452. [Google Scholar] [CrossRef]
  45. Notton, G.; Duchaud, J.L.; Nivet, M.L.; Voyant, C.; Chalvatzis, K.; Fouilloy, A. The electrical energy situation of French islands and focus on the Corsican situation. Renew. Energy 2019, 135, 1157–1165. [Google Scholar] [CrossRef] [Green Version]
  46. CRE. The Contribution of the Public Service of Electricity (CSPE): Mechanism, Historic and Prospective. Available online: https://www.cre.fr/ (accessed on 23 July 2020).
  47. OIE. Les Prix de l’électricité en France: Évolutions Passées et Perspectives. Available online: https://observatoire-electricite.fr/ (accessed on 22 July 2020).
  48. De Gooijer, J.G.; Hyndman, R.J. 25 years of time series forecasting. Int. J. Forecast. 2006, 22, 443–473. [Google Scholar] [CrossRef] [Green Version]
  49. Fouilloy, A.; Voyant, C.; Notton, G.; Motte, F.; Paoli, C.; Nivet, M.-L.; Guillot, E.; Duchaud, J.-L. Solar irradiation prediction with machine learning: Forecasting models selection method depending on weather variability. Energy 2018, 165, 620–629. [Google Scholar] [CrossRef]
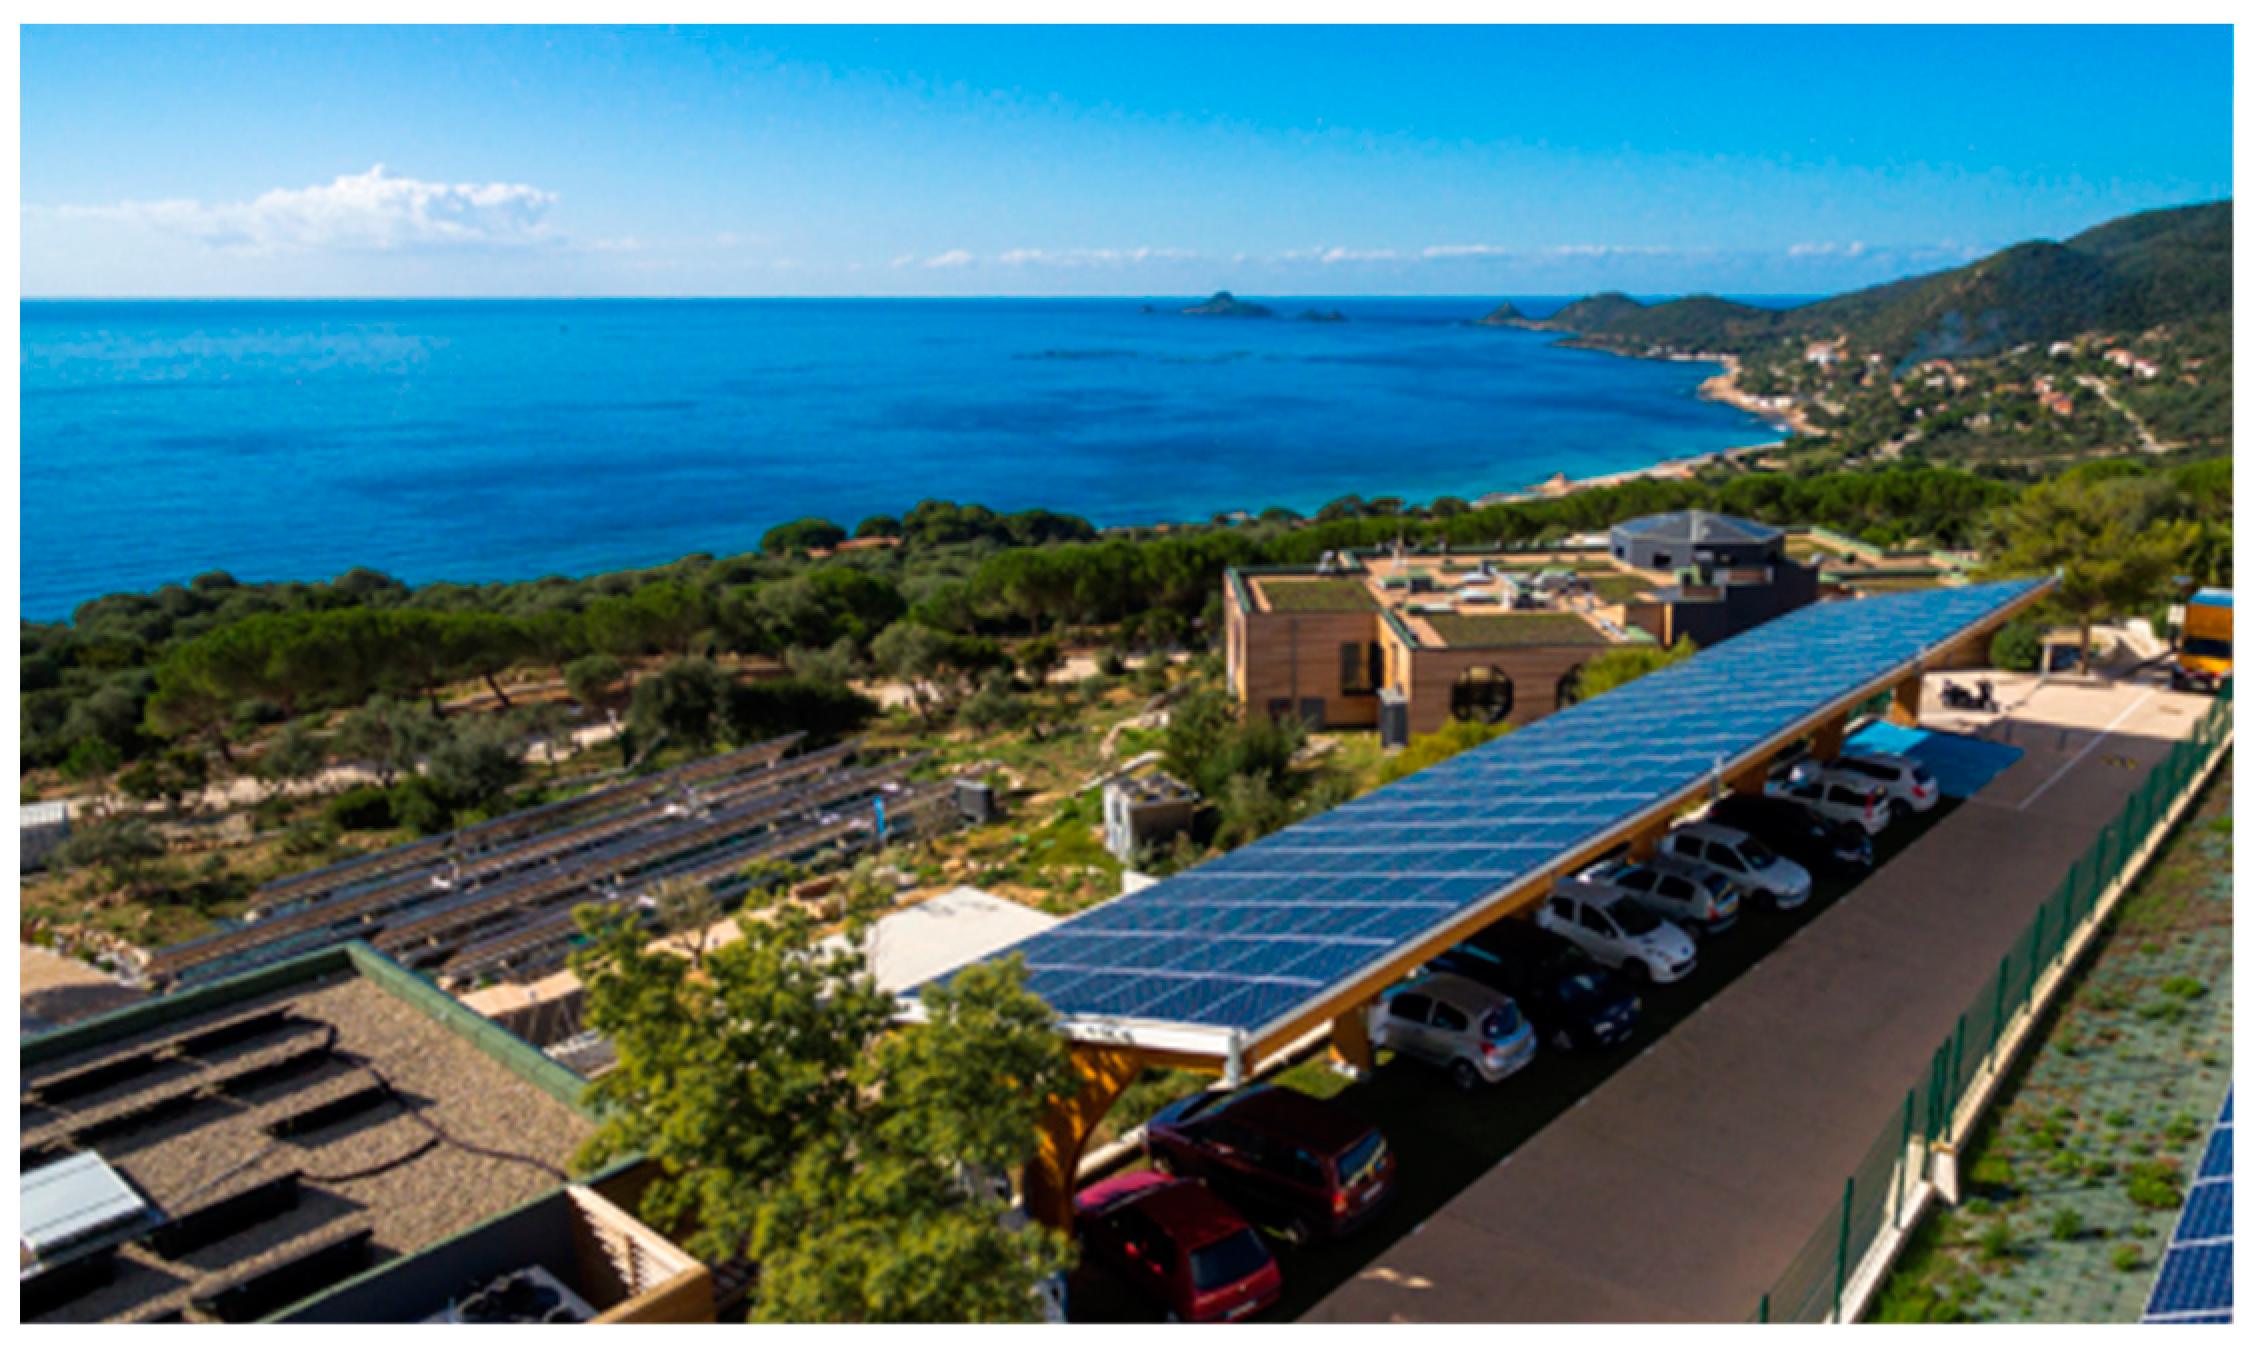
Figure 1. Distributed Generation systems (DG): Photovoltaic (PV) solar shade structure.
Energies 13 04510 g001
Figure 2. Energy Storage systems (ES): Batteries and inverters/chargers.
Energies 13 04510 g002
Figure 3. Loads: Accommodation and electric vehicle.
Energies 13 04510 g003
Figure 4. Total PV power from inverters.
Energies 13 04510 g004
Figure 5. Demand from the load.
Energies 13 04510 g005
Figure 6. Electricity purchase and selling tariffs over a day.
Energies 13 04510 g006
Figure 7. Power exchanged in the microgrid.
Energies 13 04510 g007
Figure 8. Flowchart of RBC1.
Energies 13 04510 g008
Figure 9. Flowchart of RBC2.
Energies 13 04510 g009
Figure 10. Flowchart of RBC3.
Energies 13 04510 g010
Figure 11. Six hours averaged forecasted PV power with Auto Regressive Mobile Average (ARMA) model.
Energies 13 04510 g011
Figure 12. Linear programing optimization (LP) optimization (reference).
Energies 13 04510 g012
Figure 13. RBC1 strategy.
Energies 13 04510 g013
Figure 14. RBC2 strategy.
Energies 13 04510 g014
Figure 15. RBC3r strategy (reference).
Energies 13 04510 g015
Figure 16. RBC3 strategy.
Energies 13 04510 g016
Figure 17. Energy balance on the PV side (left) and load side (right).
Energies 13 04510 g017
Figure 18. PV lost and battery losses.
Energies 13 04510 g018
Table 1. Components size.
ParameterValueDescription
P p n o m [kW]53PV array nominal power (DC)
P i n v m a x [kW]51Inverter maximum power (AC)
P g o u t m a x [kW]24Grid maximum power output (AC)
P g i n m a x [kW]24Grid maximum power input (AC)
C E S S [kWh]70Battery useful capacity (DC)
P b i n m a x [kW]14Battery maximum power input at 0.2 C (DC)
P b o u t m a x [kW]35Battery maximum power output at 0.5 C (DC)
η i n [-]0.9Battery charge efficiency
η o u t [-]0.9Battery discharge efficiency
Table 2. Main results: Total gain and battery use.
w/o ESSRBC1RBC2RBC3RBC3rLP
Total gain [€]120.97152.01168.49182.14186.56191.83
Difference from LP [€]−70.86−39.82−23.34−9.69−5.270.00
Relative performance63.1%79.2%87.8%94.9%97.3%100%
Battery cyclesNA13.311.511.411.56.7
Table 3. Corrected tariff results: Total gain and battery use.
w/o ESSRBC1RBC2RBC3RBC3rLP
Total gain [€]−56.18111.41116.89130.39134.96147.22
Difference from LP [€]−203.40−35.81−30.33−16.83−12.260.00
Relative performance−38.2%75.7%79.4%88.6%91.7%100%
Battery cyclesNA13.311.511.411.513.3