Article

Solution to the Economic Emission Dispatch Problem Using Numerical Polynomial Homotopy Continuation

by
Oracio I. Barbosa-Ayala
1,
Jhon A. Montañez-Barrera
1,
Cesar E. Damian-Ascencio
1,
Adriana Saldaña-Robles
2,
J. Arturo Alfaro-Ayala
3,
Jose Alfredo Padilla-Medina
4 and
Sergio Cano-Andrade
1,*
1
Department of Mechanical Engineering, Universidad de Guanajuato, Salamanca, GTO 36885, Mexico
2
Department of Agricultural Mechanical Engineering, Universidad de Guanajuato, Irapuato, GTO 36500, Mexico
3
Department of Chemical Engineering, Universidad de Guanajuato, Guanajuato, GTO 36050, Mexico
4
Department of Electronics Engineering, Technological Institute of Celaya, Celaya, GTO 38010, Mexico
*
Author to whom correspondence should be addressed.
Energies 2020, 13(17), 4281; https://doi.org/10.3390/en13174281
Submission received: 14 July 2020 / Revised: 30 July 2020 / Accepted: 6 August 2020 / Published: 19 August 2020
(This article belongs to the Section F: Electrical Engineering)

Abstract

:
The economic emission dispatch (EED) is a highly constrained nonlinear multiobjective optimization problem with a convex (or nonconvex) solution space. These characteristics and constraints make the EED a difficult problem to solve. Several approaches for a solution have been proposed, such as deterministic techniques, stochastic techniques, or a combination of both. This work presents the use of an algebraic (deterministic) technique, the numerical polynomial homotopy continuation (NPHC) method, to solve the EED problem. A comparison with the sequential quadratic programming (SQP) algorithm and the nondominated sorting genetic algorithm II (NSGA-II) is also presented. Results show that the NPHC algorithm finds all the roots (solutions) of the problem starting from any initial point and assures an accurate solution with a good convergence time. In addition, the NPHC algorithm provides a more accurate solution than the SQP algorithm and the NSGA-II.

1. Introduction

Power dispatch is a complicated task for the energy industry because a highly variable and unpredictable load demand from the customers needs to be satisfied using the most suitable (less expensive) mix of producers [1,2]. The available producers use different types of fuel (including fossil and renewable energy sources), have different capacities, have different efficiencies, and there is the need to decide whether to operate them at full- or part-load [3,4]. In addition, the highest percentage of electricity is generated using fossil fuels, which increases the problem of pollutant emissions to the environment, of which CO2, SO2, and NOx are of most concern [5,6]. Thus, the goal of the energy production industry is to simultaneously minimize both, fuel costs and emissions to the environment [7].
Fuel costs and emissions to the environment are objectives competing with each other; that is, the use of a cheap coal-fired power plant produces high amounts of emissions to the environment, and the use of a clean natural gas power plant is expensive to operate [8,9]. Thus, the optimization problem is formulated to be multiobjective with competing and non-commensurable objectives, in which a set of optimum producer configurations is obtained [10]. The problem can be solved using a fixed load demand (static economic emission dispatch, SEED) [11], or using a variable load demand (dynamic economic emission dispatch DEED) [12]. The SEED has the limitation that it does not consider the look ahead variations of the load demand as well as the dynamic behavior of the producers, something which is fully considered in the DEED. The characteristics of the producers are modeled by considering linear/nonlinear [11,13] or smooth/nonsmooth [11,14,15] objective functions, and by including valve point effects [12], ramp rate limits [16], generation limits [17], prohibited operating zones [18], spinning reserve [13], among others. These characteristics may turn the problem convex or nonconvex [11,18,19].
Three main different approaches are commonly used to solve the economic emission dispatch problem, i.e., deterministic techniques, stochastic techniques, and combinations of these two techniques. Deterministic techniques [3,4,11,15,20] have the advantage that can solve large scale systems with good accuracy [15,20] in a short convergence time [12,15]. However, these techniques can get stuck at local optimum points easily, are very sensitive to the starting point [21,22], and have difficulties with solving nonconvex problems as well as those with nonsmooth objective functions [21,23]. Stochastic techniques have the advantage that can solve nonconvex problems and those with nonsmooth objective functions [14,16,17,18,24,25,26,27,28,29,30]. However, these techniques find a solution close to the Pareto set only [31], as opposed to the exact solution [14,16], and require a very long time of computation, especially when dealing with large problems [1,15,24], and the control parameters and diversity of the population introduce several degrees of freedom to the solution approach [14,15]. Methods that use a combination of mathematical programming and artificial intelligent techniques use the best features of both, and have proven to be good methods for the solution of complex problems [23,32]; however, the number of operations and its associated computational burden are still areas of improvement.
The Numerical Polynomial Homotopy Continuation (NPHC) method is an analytical (deterministic) approach based on a combination of the Homotopy Analysis (HA) method and the fundamental theorem of algebra. The NPHC method finds all possible solutions, even the isolated ones [33], of a system of non-linear equations, i.e., algebraic, differential, partial differential, etc., or a combination of them [34]. This method assures convergence and the finding of the exact solution independently of the initial point and the constraints associated with a variety of parameters that affect the system [35,36]. The NPHC method has been applied to solve problems in physics and mathematics such as in industrial robotics [37], experimental dynamics [38], topology [39], high energy physics [40,41], among others [42,43,44].
To the best knowledge of the authors, the NPHC method has been used in power engineering to solve voltage instabilities [45] and power flow problems [46] only. The novelty of the work presented here is the use of the NPHC method to solve the economic emission dispatch problem, which deals with the combined economic and environmental dispatch of a power network. In addition, the solution of the NPHC algorithm is compared with the solutions of a Sequential Quadratic Programming (SQP) algorithm [47] and a Nondominated Sorting Genetic Algorithm II (NSGA-II) [48].
The remainder of this paper is organized as follows: Section 2 presents a description of the problem; Section 3 presents a description of the NPHC method; Section 4 presents the results and discussion of the findings; and finally Section 5 concludes the paper.

2. Problem Description

2.1. Principle of Multiobjective Optimization

The multiobjective optimization problem is formulated as [24]
Minimize:
F ( X ) = { f 1 ( X ) , f 2 ( X ) , , f M ( X ) }
with respect to nonnegative X, and subject to:
g l ( X ) = 0 for all l
h k ( X ) 0 for all k
where F = { f m } is the set of objective functions and M Z + , X = { x i } is the set of decision variables, g l are the equality constraints, and h k are the inequality constraints.

2.2. Economic Emission Dispatch Problem

The economic emission dispatch (EED) problem is expressed as a nonlinear constrained multiobjective optimization problem with competing and non-commensurable objectives. Mathematically the problem is formulated as [24,49];
Minimize:
f m = i = 1 3 a i , m + b i , m x i + c i , m x i 2 , m = 1 , , 3
with respect to nonnegative x i , and subject to
i = 1 3 x i D L = 0
x i min x i x i max , i = 1 , , 3
Equation (4) represents the objective functions, where the first objective function ( m = 1 ) corresponds to the total fuel cost ($/hr), the second objective function ( m = 2 ) corresponds to the total SO2 emissions (ton/hr), and the third objective function ( m = 3 ) corresponds to the total NOx emissions (ton/hr); x i is the real power generated by each producer; and a i , m , b i , m , and c i , m are real non-negative constants particular to each producer which allow the model to account for the part-load behavior of the producers and to maintain the convexity of the objective functions. Equation (5) is the equality constraint which represents the real power balance, where D is the fixed load demand and L the real power flow losses in the transmission lines given as
L = X B X T
where B is the transmission loss matrix and X = [ x 1 x 2 x 3 ] is the row vector formed by the real power generated by the producers. Equation (6) is the inequality constraint, which represents the generation limits of the producers.
The values of the characteristics of the producers, the load demand, and the transmission loss matrix are obtained from [49].

3. Numerical Polynomial Homotopy Continuation Formulation

3.1. Description of the NPHC Method

The NPHC method [50,51] aims to find all the roots (real and imaginary) of a system of N multivariate polynomial equations P ( X ) = { p n ( X ) } in N variables X = { x n } , which has isolated solutions.
For the solution of the problem, an upper bound on the number of solutions of this system is established using the Classical Bézout Theorem. Then, the homotopy is constructed as
H ( X , θ ) = σ ( 1 θ ) Q ( X ) + θ P ( X ) = 0
where σ is a convergence parameter, θ [ 0 , 1 ) is the tracking parameter, and Q ( X ) is a system of polynomial equations (start system) from which the roots (solutions) are known and selected using the Classical Bézout Bound (CBB) at H ( X , 0 ) = Q ( X ) = 0 , such as
Q ( X ) = x 1 q 1 1 x 2 q 2 1 x N q N 1 = 0
which has a maximum number of n = 1 N q n solutions in C N , where q n is the degree of the n-th polynomial of P ( X ) [46]. Finally, the paths corresponding to all the solutions of the system are tracked through all the solution space starting from H ( X , 0 ) = Q ( X ) = 0 when θ = 0 , and finishing at H ( X , 1 ) = P ( X ) = 0 when θ = 1 . The tracking of the solutions is developed using the corrector-predictor method.

3.2. Computational Flow

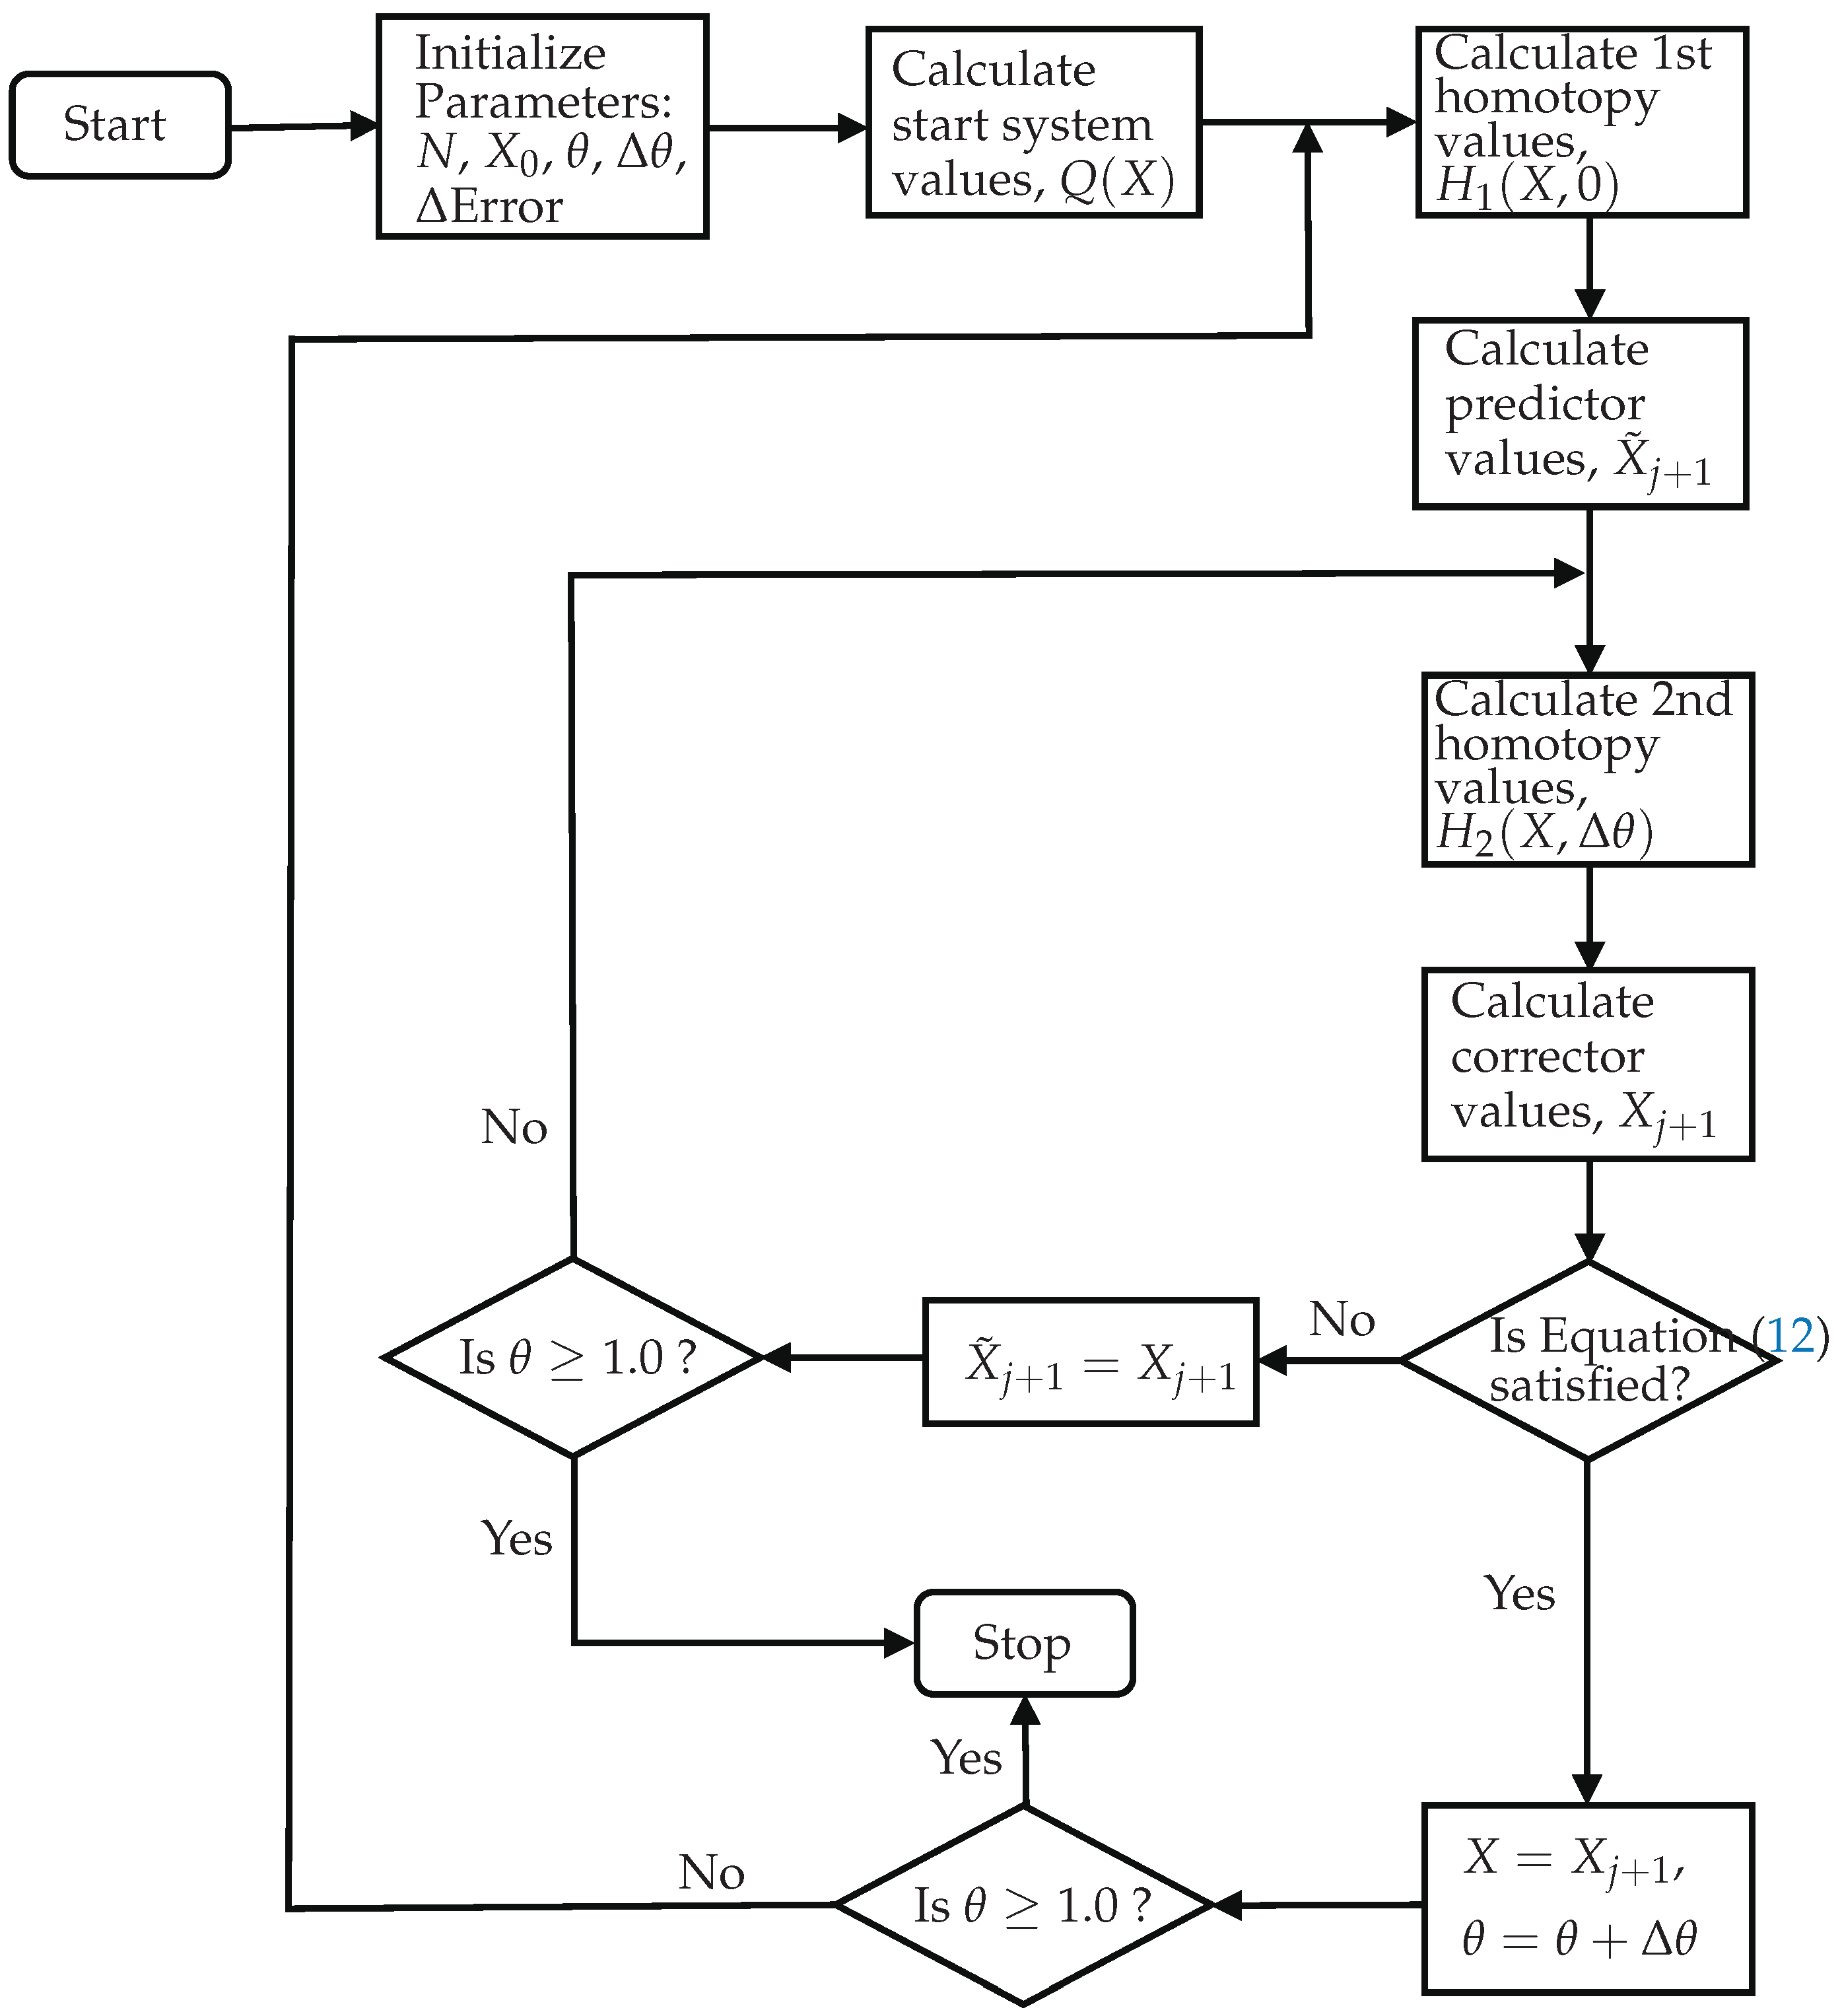
The NPHC optimization algorithm is shown in Figure 1 and is described in the following steps:
Step 1: Initialize the model parameters.
Step 2: Obtain the start system using Equation (9).
Step 3: Develop a first evaluation of the homotopy, H 1 ( X ) , using the value of X 0 from Step 1.
Step 4: Calculate the values of Newton’s predictor, X ˜ j + 1 , using the values of H 1 ( X ) from Step 3, such as [52]
X ˜ j + 1 = x j + Δ z P ( X j )
where j is the corresponding iteration and Δ z is the increment step.
Step 5: Develop a second evaluation of the homotopy, H 2 ( X ) , using the values of the predictor, X ˜ j + 1 , from Step 4.
Step 6: Adjust the predictor set by means of a corrector. The values of Newton’s corrector, X j + 1 , are calculated using the values of H 2 ( X ) from Step 5, such as [52]
X j + 1 = X ˜ j + 1 P ( X ˜ j + 1 ) J X 1
where J X is the Jacobian matrix of Equation (8).
Step 7: Evaluate the converge criteria, given as [52]
| X j + 1 X ˜ j + 1 | Δ Error
where Δ Error is a constant decimal value that defines the precision of the solution.
Step 8: If the converge criteria is not satisfied, the value of the corrector is given to the predictor, and (i) if the value of θ is smaller than 1.0, the cycle continues at Step 5 using the new value of the predictor X ˜ j + 1 ; (ii) if the value of θ is equal or bigger than 1.0 the cycle is considered to be completed, and the final result is the value of the corrector, X j + 1 .
Step 9: If the converge criteria is satisfied, the values of the start system, X, are substituted by the values of the corrector, X j + 1 , the value of θ is increased by Δ θ , and (i) if the value of θ is smaller than 1.0, the cycle continues at Step 3 using the new value of X; (ii) if the value of θ is equal or bigger than 1.0, the cycle is considered to be completed, and the final result is the value of the corrector, X j + 1 .

3.3. Application of the Algorithms to the EED Problem

The NPHC method works with closed systems of equations only. That is, the number of equations of the system must equal to the number of unknown variables. Thus, for the EED problem, the objective functions and equality constraints are grouped in a linear combination form, such as [21]
f = ϕ 1 f 1 + ( 1 ϕ 1 ) ( ϕ 2 ω 2 f 2 + ϕ 3 ω 3 f 3 ) λ g
where f m are the objective functions; ϕ m are weights of the linear combination corresponding to each of the objective functions, where 0 ϕ m 1 ; ω 2 = 600 and ω 3 = 50 , 000 are scaling factors to convert SO2 and NOx emission units to cost units, respectively, selected to have the result of the three objective functions at the same order of magnitude to avoid numerical instabilities during the computational process; g is the equality constraint which represents the real power balance; λ is the Lagrange multiplier of the problem associated with the equality constraint [31], i.e., Equation (5).
For the SQP algorithm, the multiobjective optimization is developed in a constrained manner; that is, the first objective function is used as a constrain to obtain the minimum of a second objective function, and the results of the first and second objective functions are used as constraints to minimize a third objective function.
For the NSGA-II algorithm, the objective functions are evaluated at the same time, as a true multiobjective optimization, obtaining the solution of all the objective functions in a single run of the algorithm. The crossover and mutation probabilities are 0.99 and 0.01, respectively; the distribution index for crossover and mutation are 5 and 50, respectively; the algorithm is run for 20,000 generations, as suggested in [49].
The simulations are run in a computer with 16 GB of RAM and 8 cores Intel i7 6700-K at 4 GHz.

4. Results and Discussion

For the present work, the NPHC searching space is reduced to real positive roots only, which are related to the physical aspect of the power generated by the producers. This physical assumption helps to reduce considerably the computational effort.
An independence analysis for the homotopy parameters, Δ Error and Δ θ , is developed based on the criteria [53]
X j ˜ 1 X j ˜ X j ˜ 1 < 5 × 10 3
where X j ˜ is the result of the current optimization and X j ˜ 1 the result of the previous optimization, finding that the values of Δ Error = 0.01 and Δ θ = 0.1 do not alter the final result of the NPHC optimizations.

4.1. Using 25 Elements to Construct the Pareto Set

The results of the optimization of a single objective function using 25 elements or individuals to construct the Pareto set are given in Table 1 for the fuel cost, Table 2 for the SO2 emissions, and Table 3 for the NOx emissions. It is observed that the NPHC and the SQP algorithms provide the best result for the minimization of fuel cost and SO2 emissions, and the NSGA-II algorithm provides the worst result. For the minimization of NOx emissions, the NPHC algorithm provides the best result, followed by the SQP algorithm, and the NSGA-II algorithm provides the worst result.
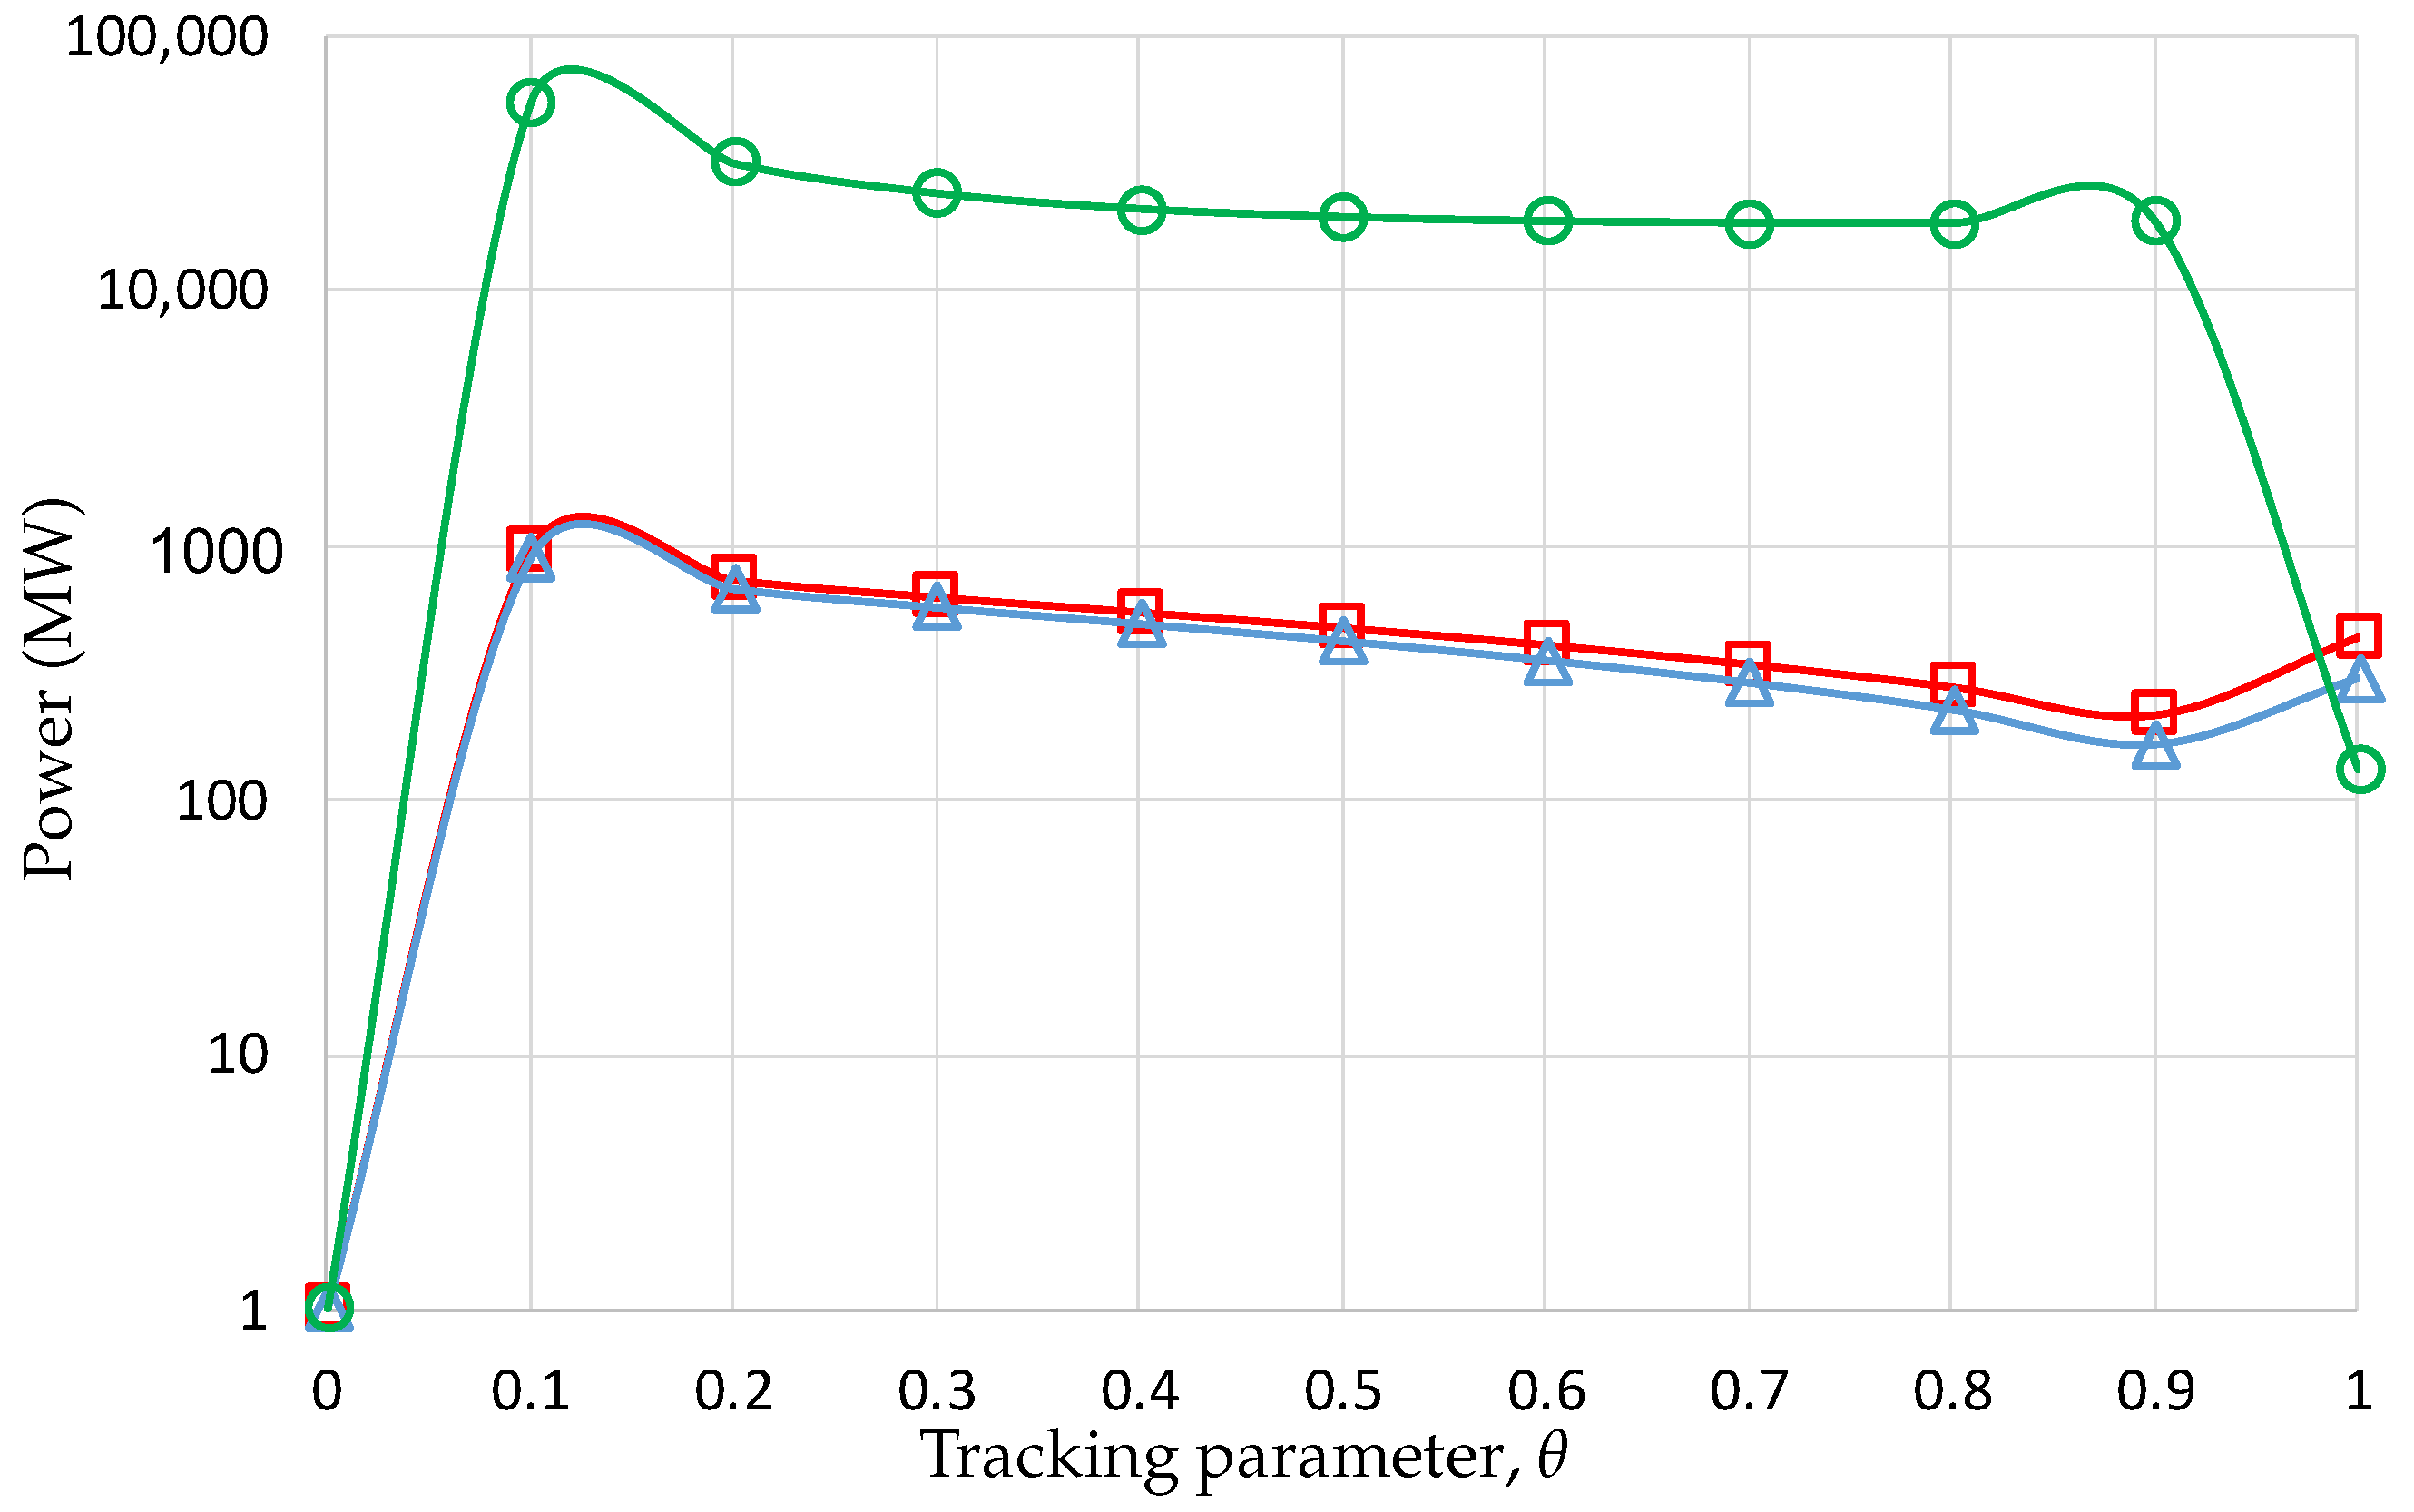
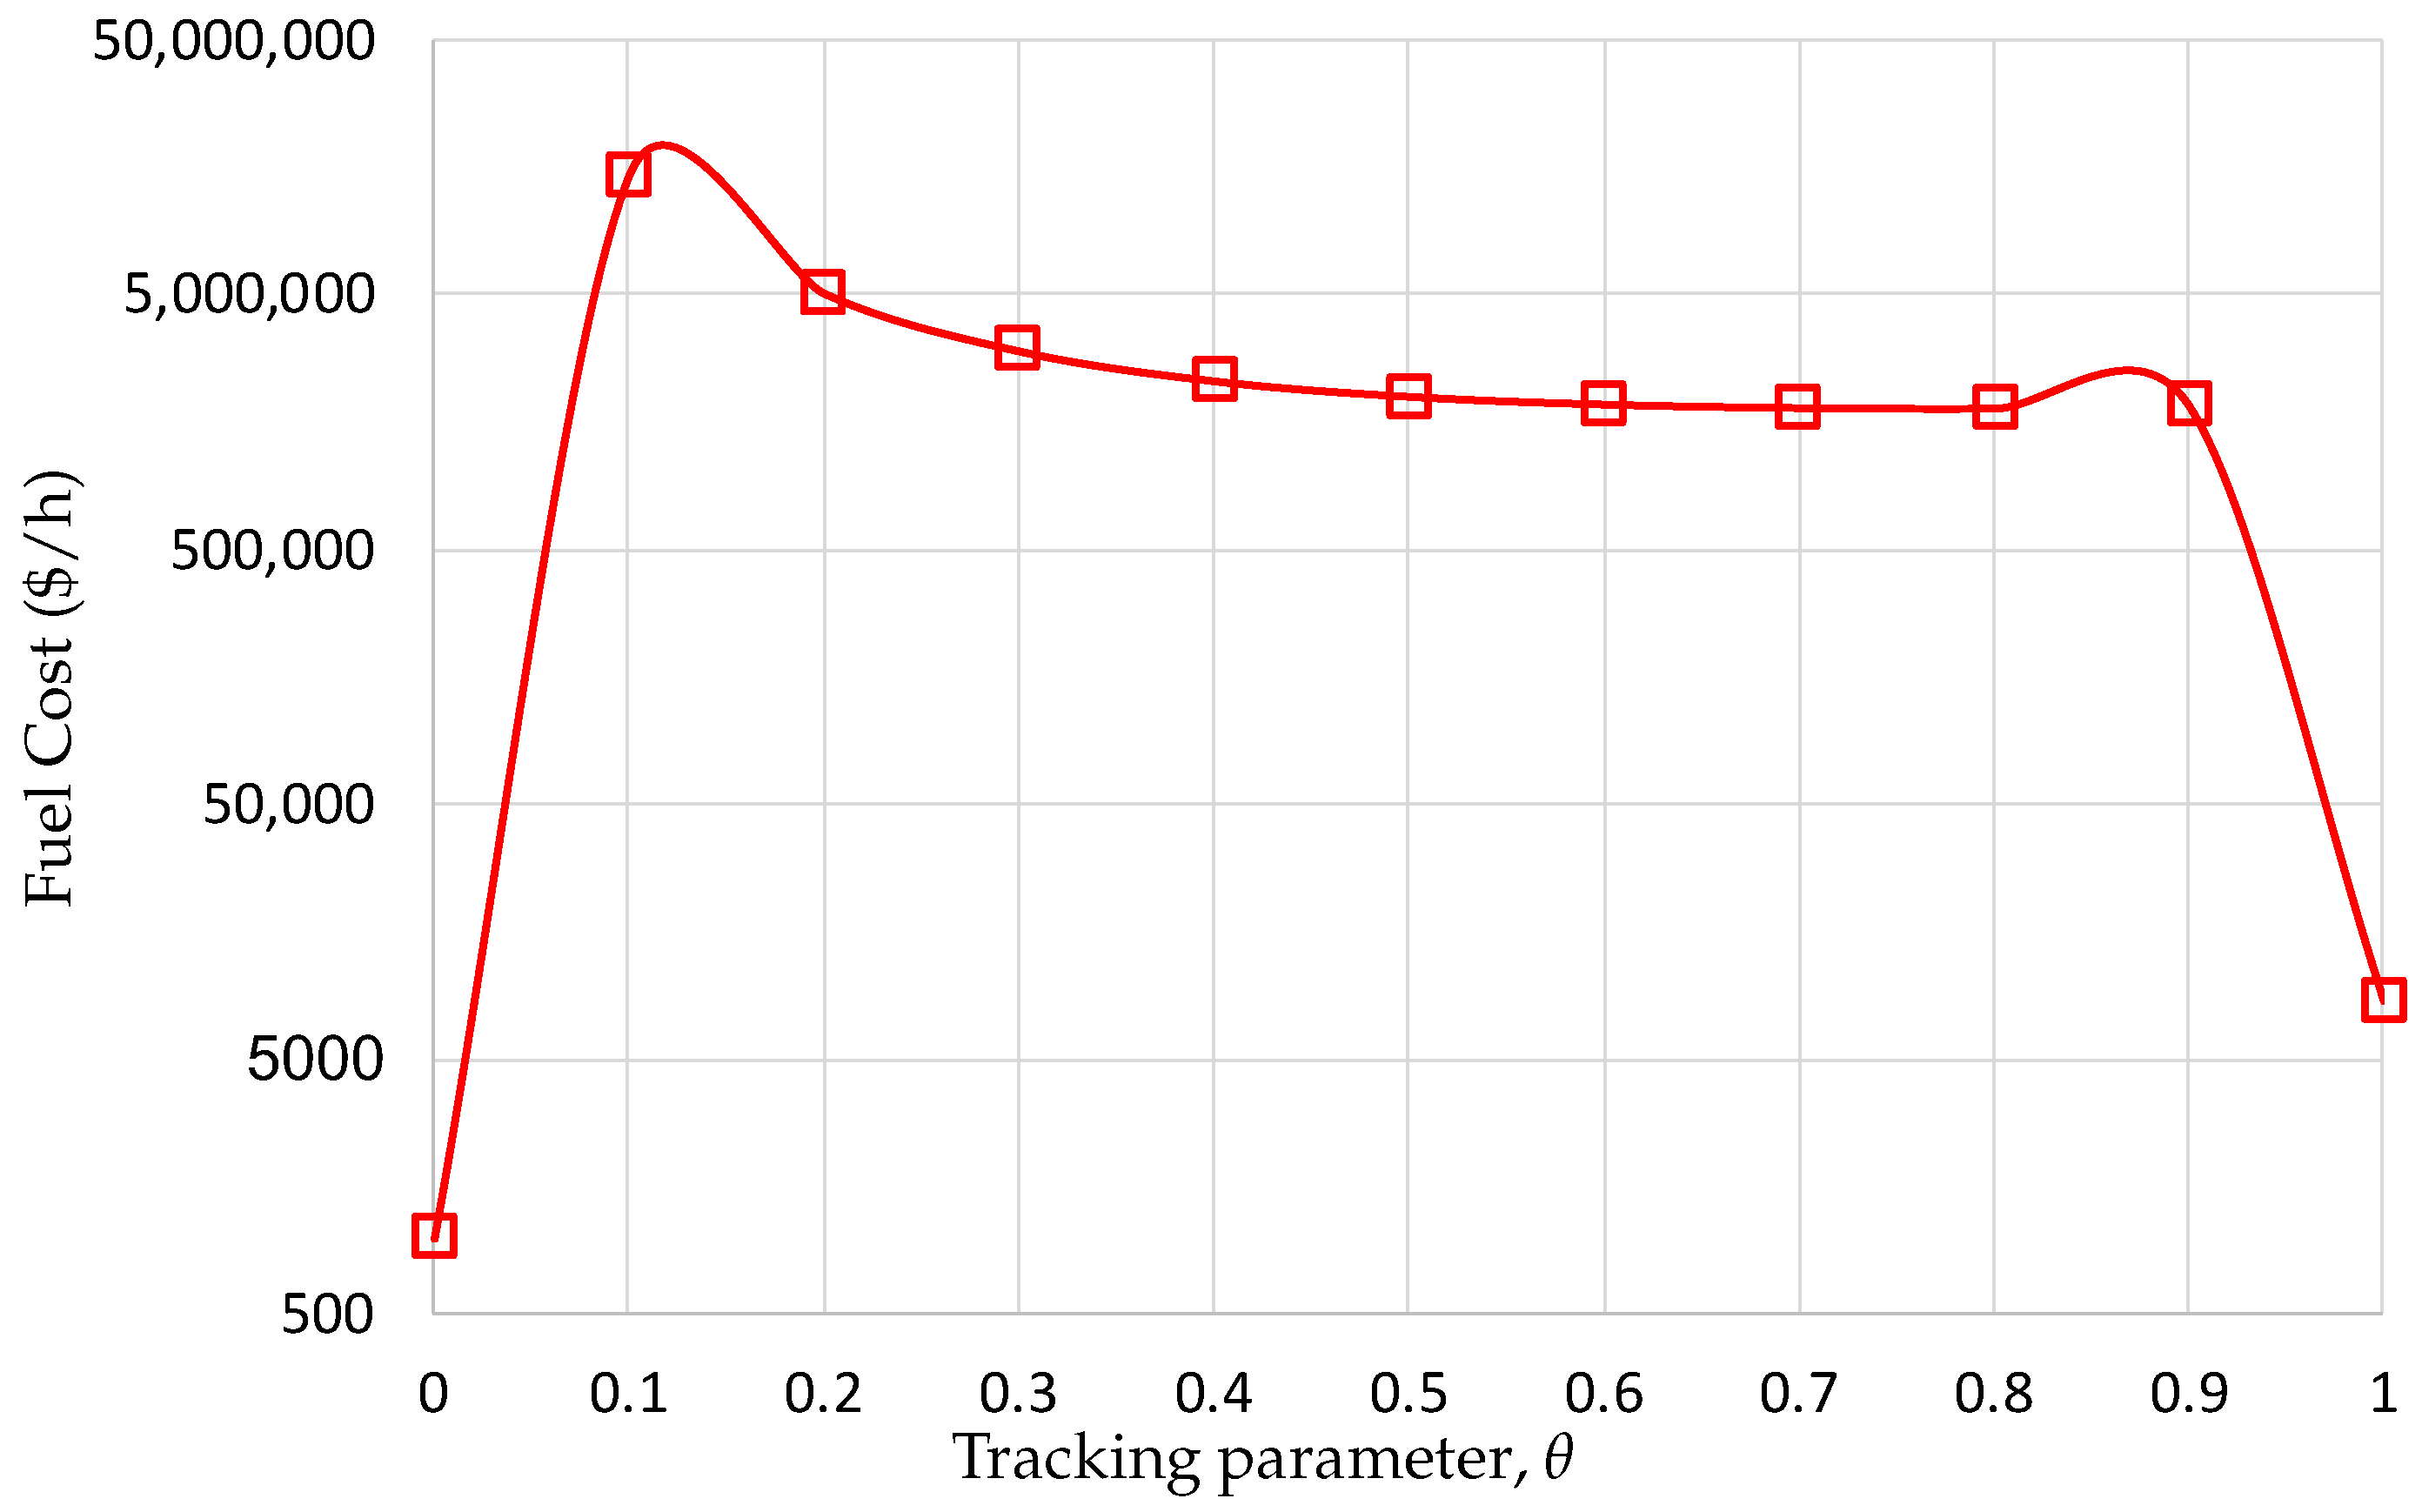
Figure 2 shows the trajectory of the minimization of the fuel cost objective function using the NPHC algorithm with respect to the tracking parameter. It is observed that the trajectory of the solution is very smooth, which helps to reduce the time of computation. It is observed that the solution is always reached at θ = 1 . Figure 3 shows the trajectory of the roots (solutions) corresponding to the three producers, for the minimization of the fuel cost objective function. It is observed that the trajectory of the roots is also very smooth, following a similar shape than the objective function towards the solution at θ = 1 . This smoothness is a characteristic of the NPHC method to avoid getting stuck at local optimums, assuring the finding of the global optimum.
In terms of the time of computation, the NPHC algorithm provides the shortest time for the individual minimization of the three objective functions. Compared with the SQP algorithm, the response of the NPHC algorithm is one order of magnitude faster for the minimization of fuel cost, and SO2 emissions, and two orders of magnitude faster for the minimization of NOx emissions. Compared with the NSGA-II algorithm, the response of the NPHC algorithm is four orders of magnitude faster for the individual minimization of the three objective functions.
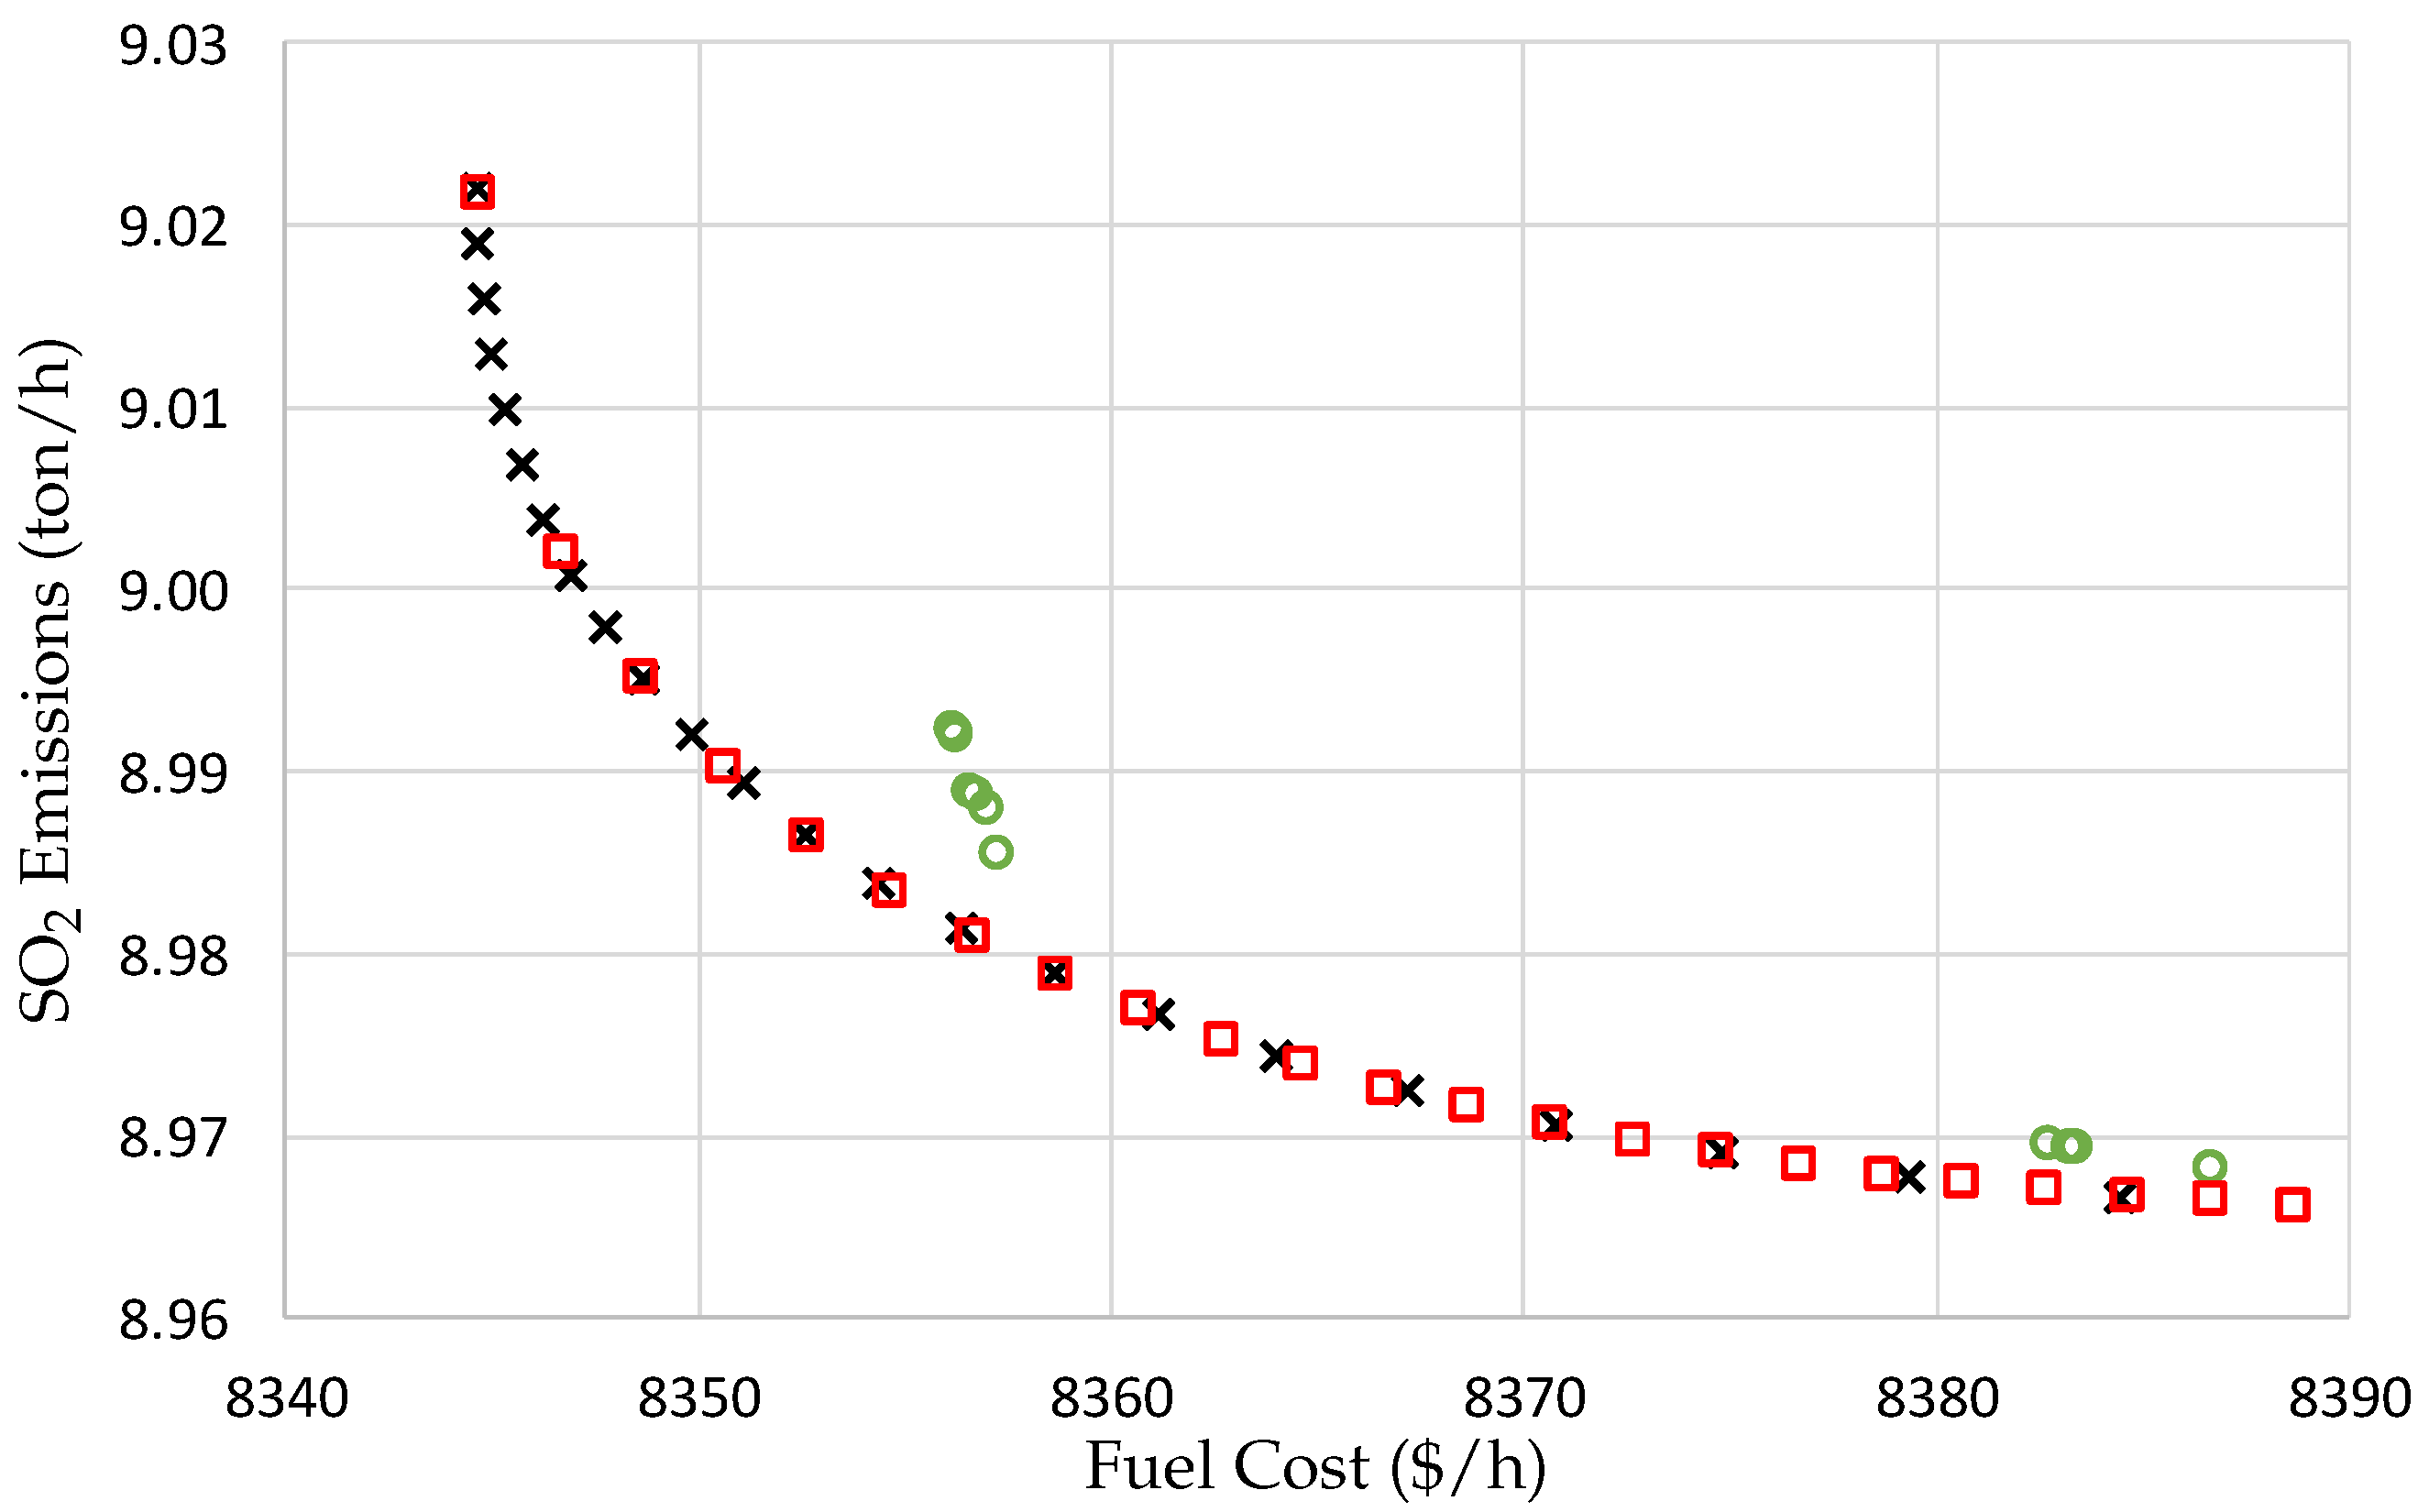
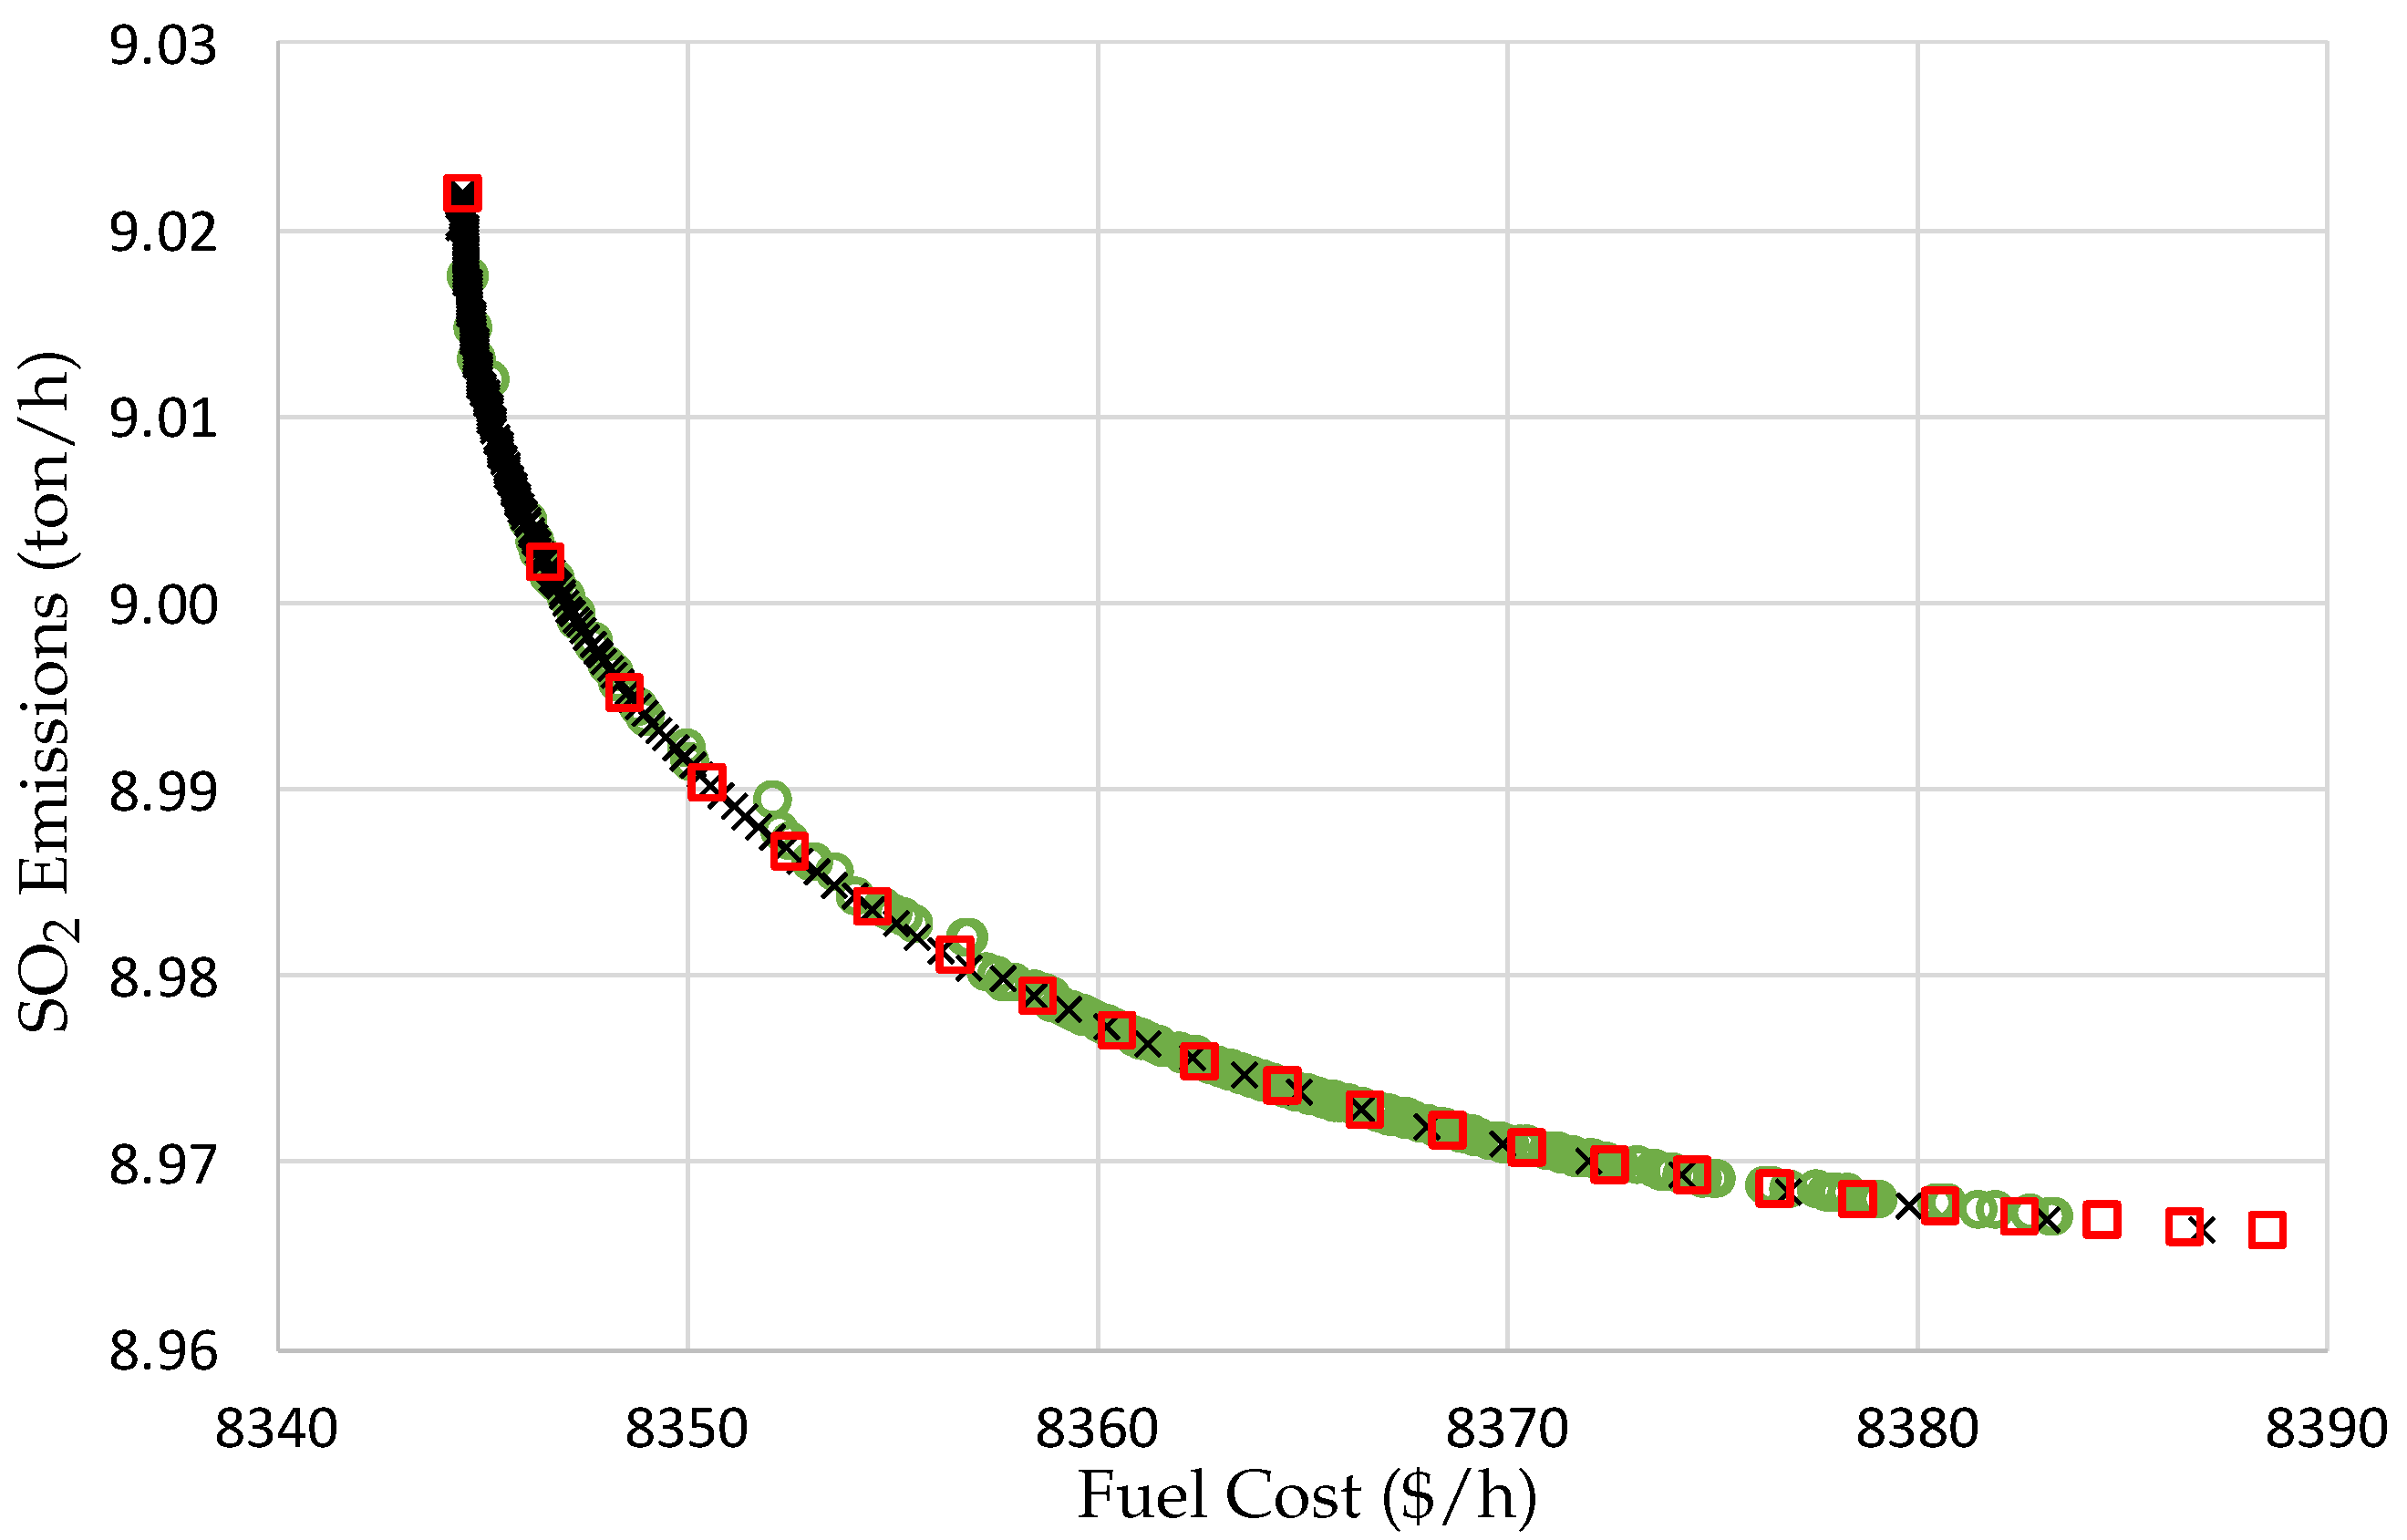
Figure 4 shows the Pareto set for fuel cost and SO2 emissions. It is observed that the NPHC and SQP algorithms provide an accurate solution, as well as a good distribution of the elements on the solution space. Also, the figure shows that the NSGA-II algorithm has problems in obtaining both, a good solution and a good distribution of the results on the solution space. In terms of the time of computation, the SQP algorithm needs 14.229 s to obtain the Pareto set, the NSGA-II algorithm needs 58.212 s to obtain the Pareto set, and the NPHC algorithm needs 0.150 s only to obtain the Pareto set.
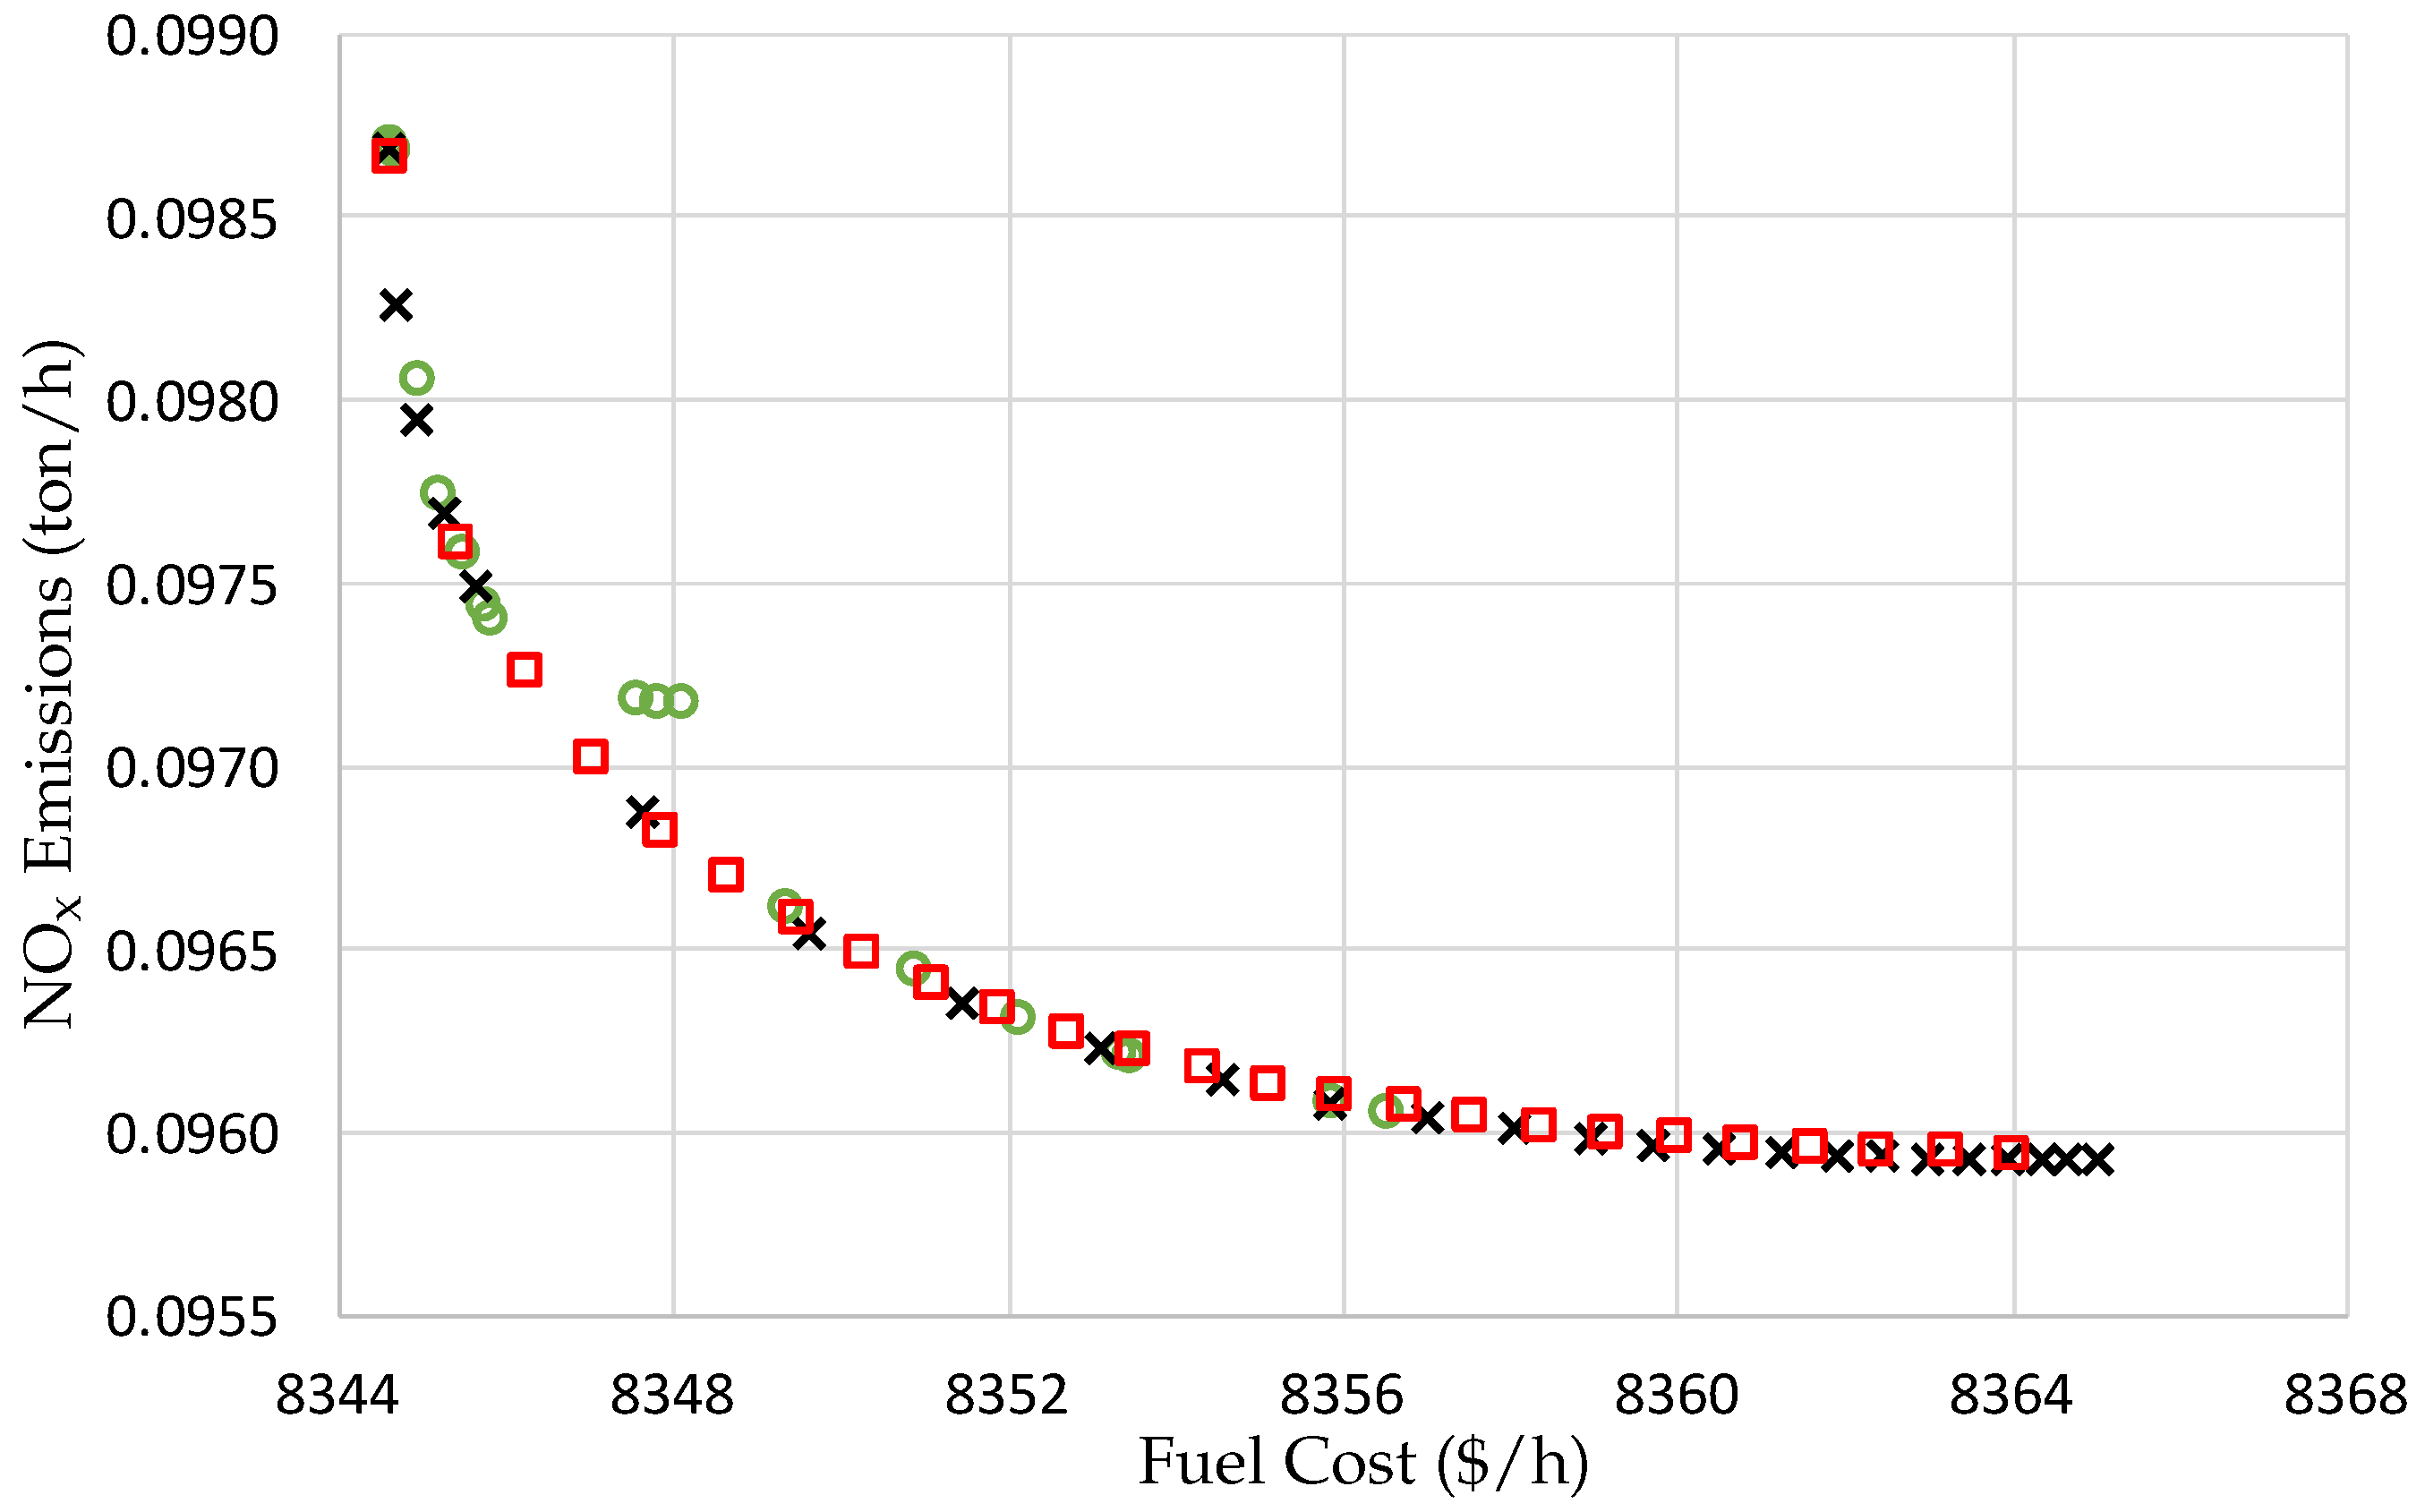
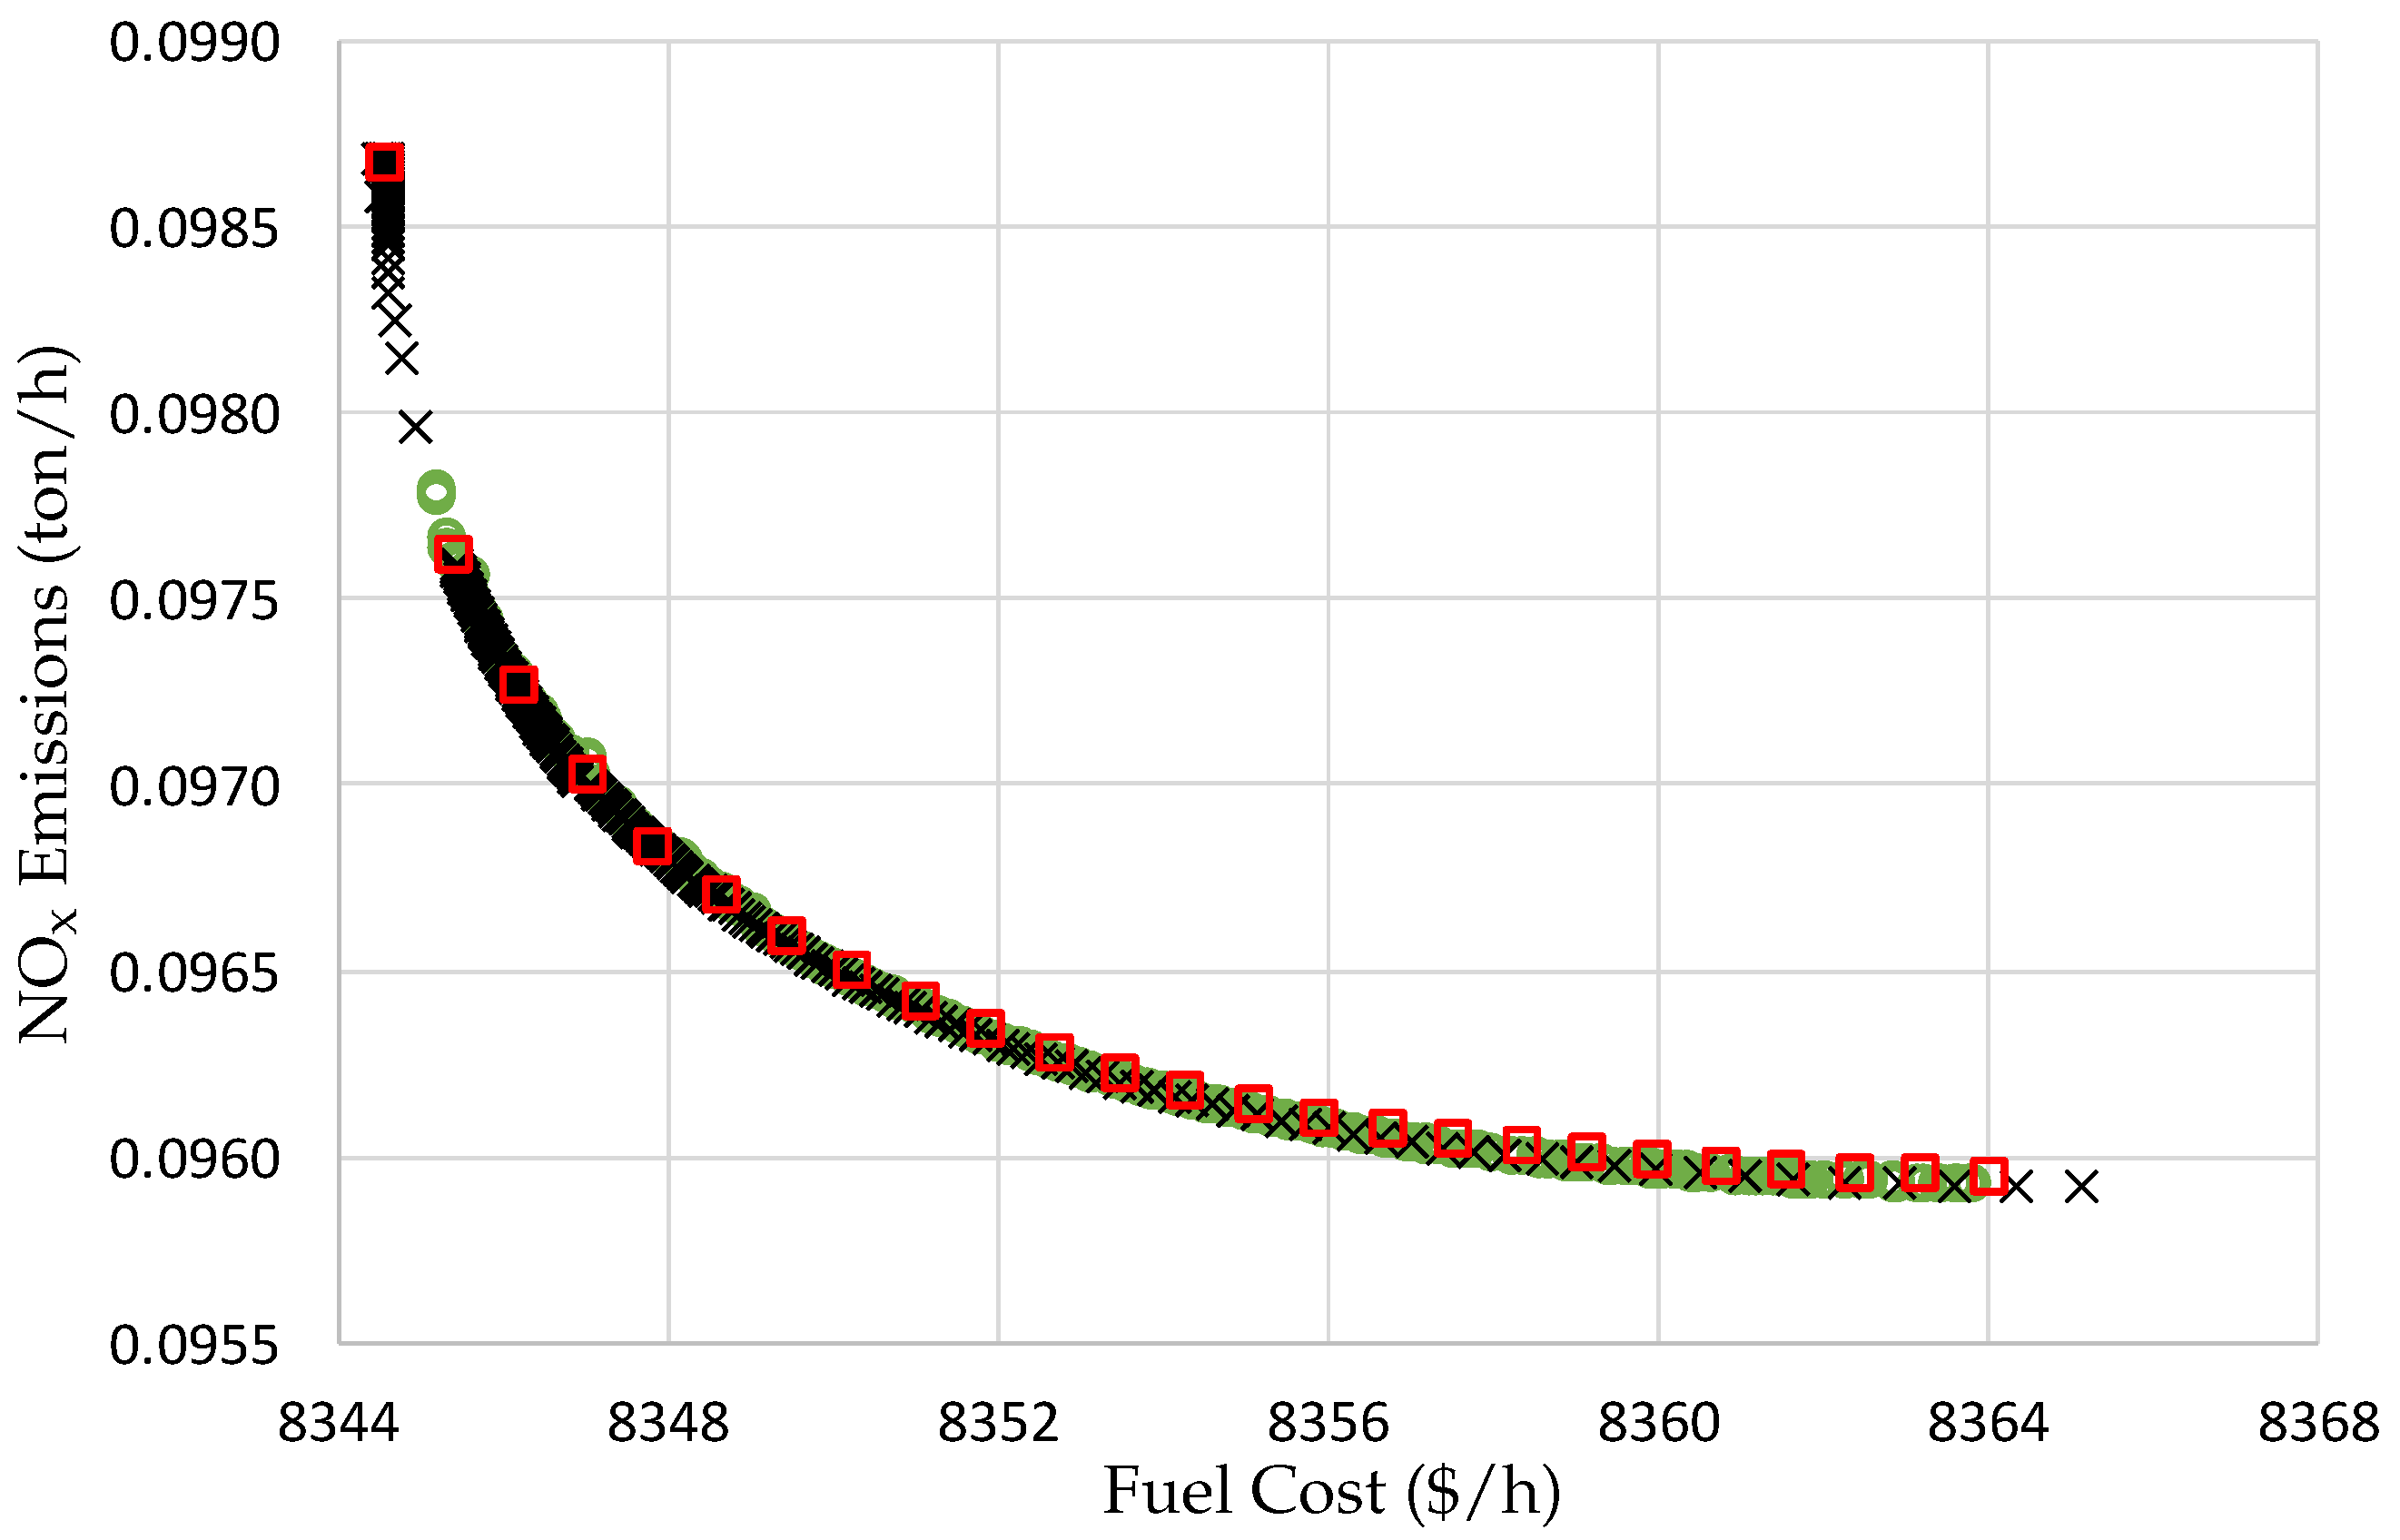
Figure 5 shows the Pareto set for fuel cost and NOx emissions. The figure shows that the NPHC and SQP algorithms provide an accurate solution, as well as a good distribution of the elements on the solution space. The figure shows that the NSGA-II algorithm provides a good solution, although some individuals are still far from the Pareto set. It is also observed that the NSGA-II algorithm does not populate the solution space for values of fuel cost higher than 8357. In terms of the time of computation, the SQP algorithm needs 25.711 s to obtain the Pareto set, the NSGA-II algorithm needs 57.679 s to obtain the Pareto set, and the NPHC algorithm needs 0.156 s only to obtain the Pareto set.
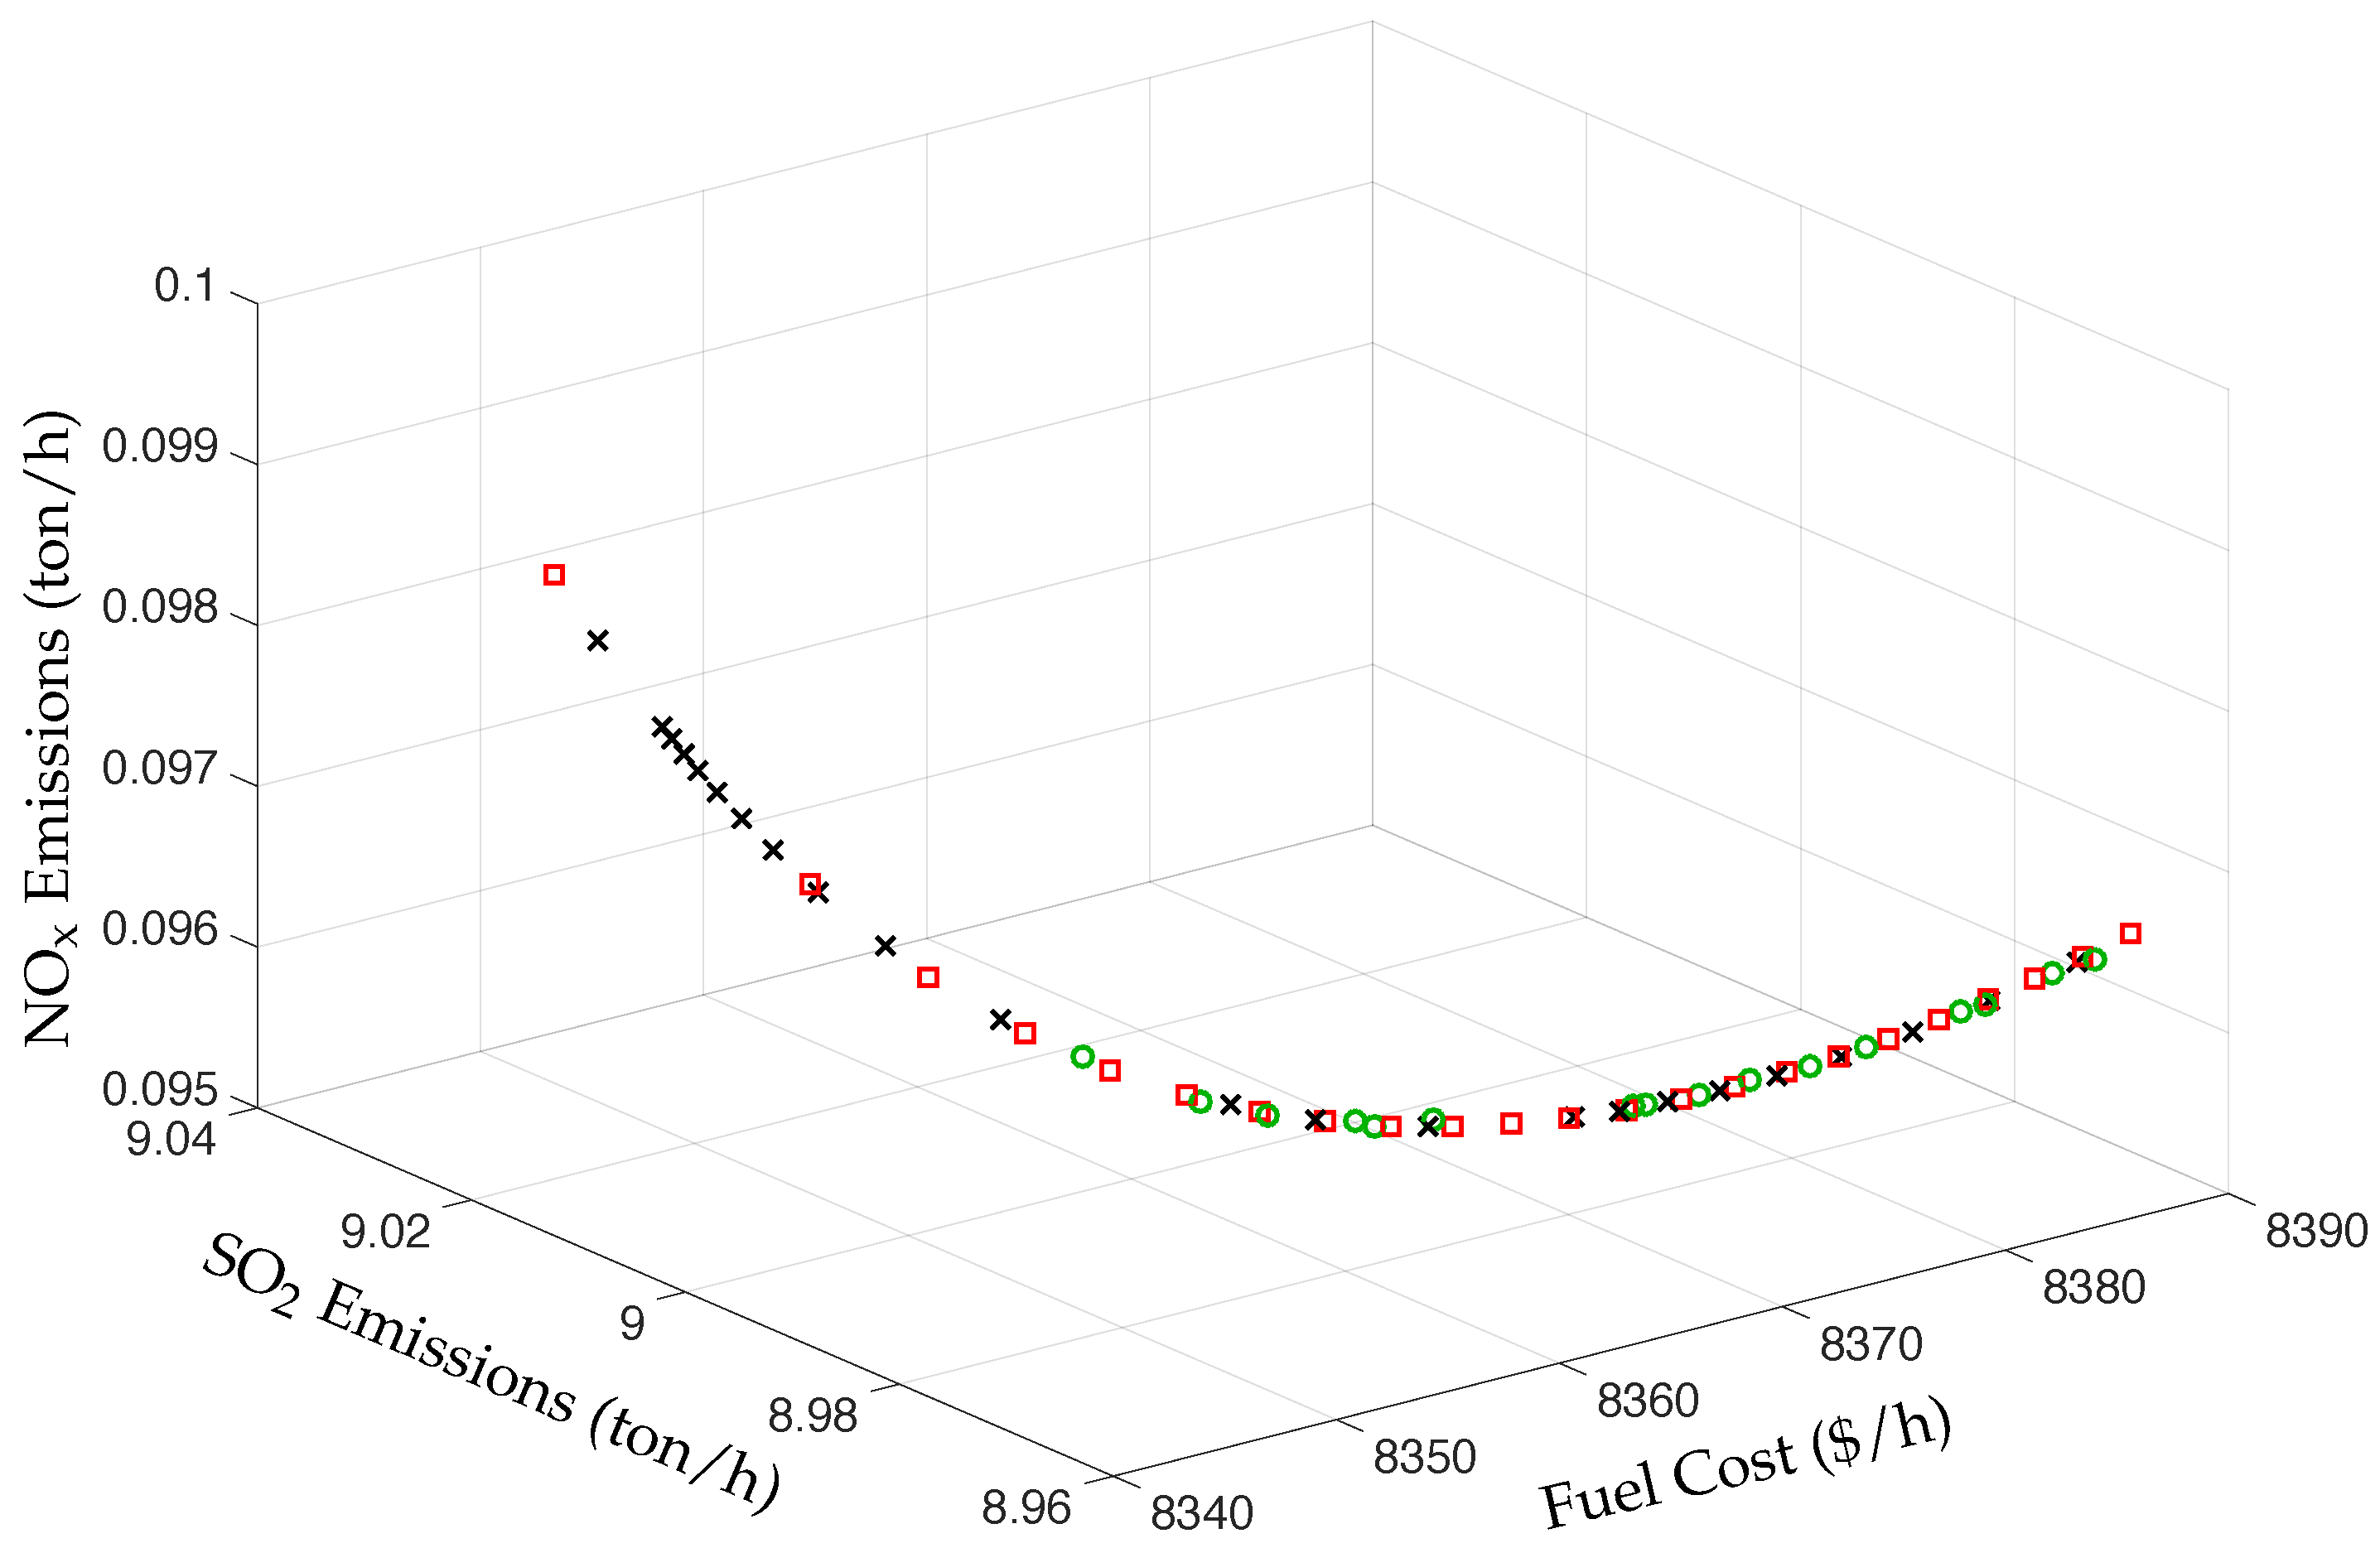
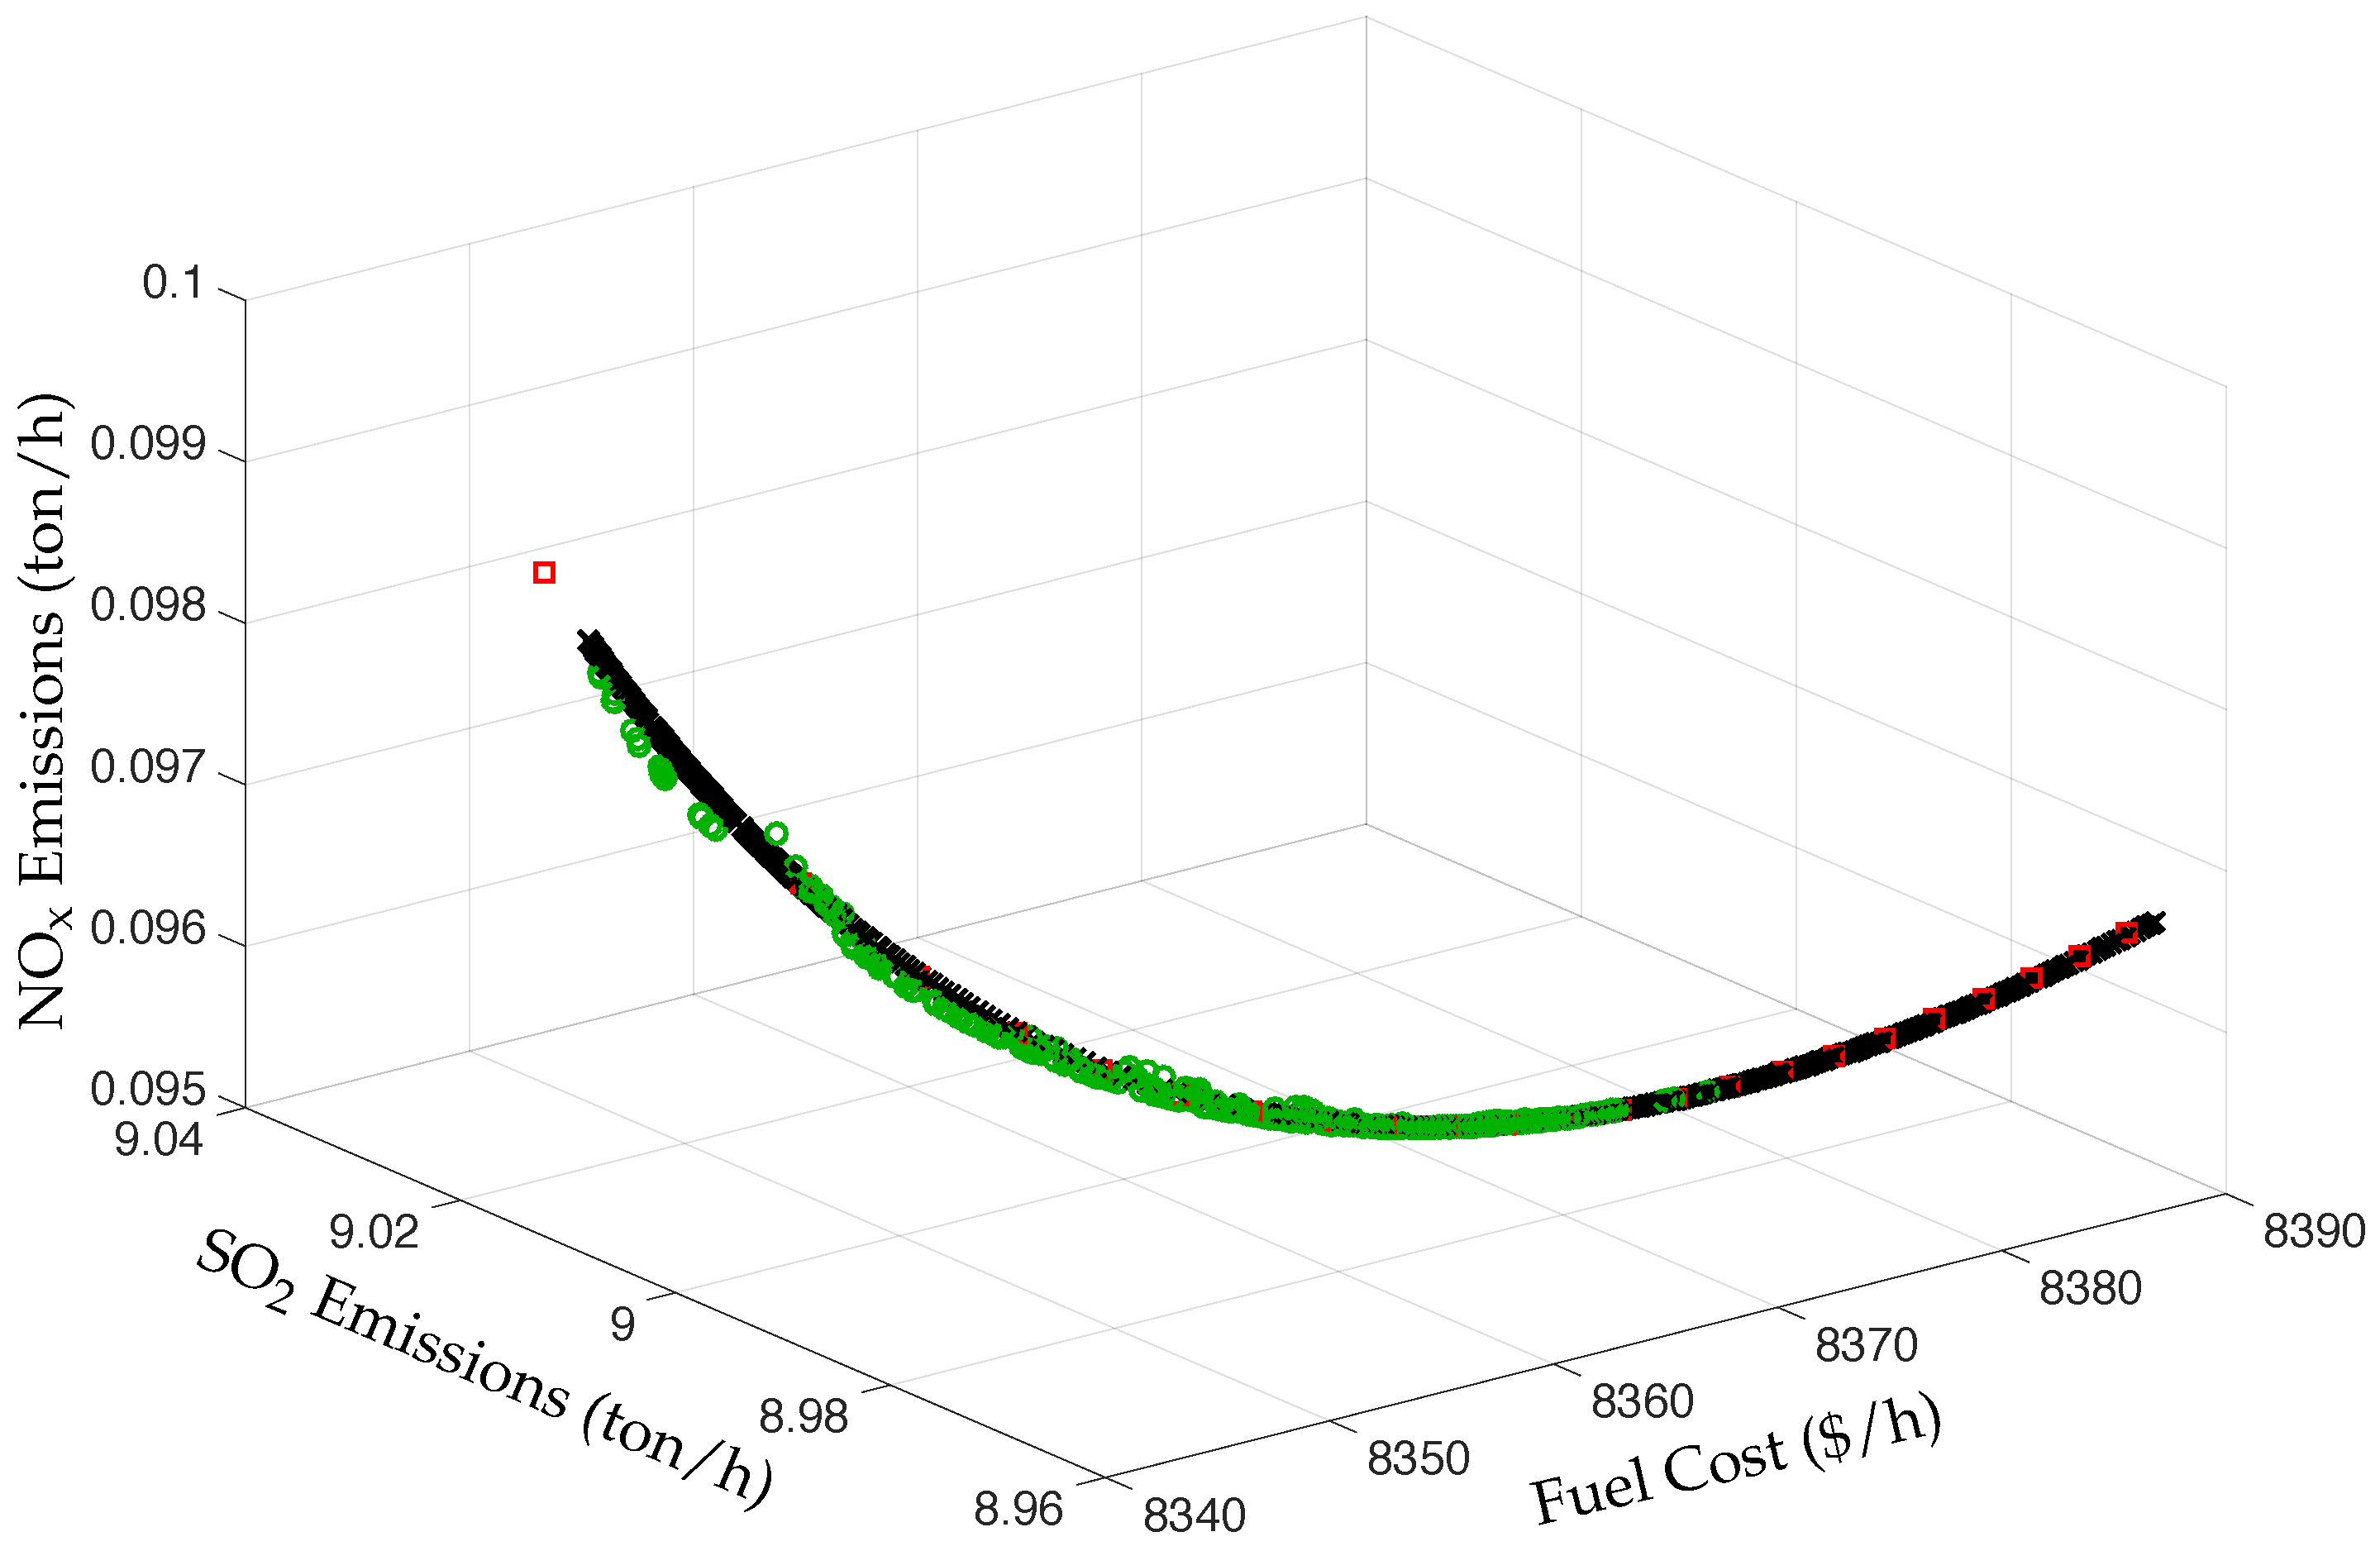
Figure 6 shows the Pareto set for fuel cost, SO2 emissions, and NOx emissions. The figure shows that the NPHC and SQP algorithms provide an accurate solution as well as a good distribution of the elements on the solution space. It is also observed that the NSGA-II algorithm populates well the Pareto set for high fuel cost only, but leaves unpopulated the other part of the Pareto set. In terms of the time of computation, the SQP algorithm needs 17.580 s to obtain the Pareto set, the NSGA-II algorithm needs 59.063 s to obtain the Pareto set, and the NPHC algorithm needs 0.174 s only to obtain the Pareto set.

4.2. Using 500 Elements to Construct the Pareto Set

The results of the optimization of a single objective function using 500 elements or individuals to construct the Pareto set are given in Table 4 for the fuel cost, Table 5 for the SO2 emissions, and Table 6 for the NOx emissions. It is observed that the result of the NPHC and the SQP algorithms are as accurate as those obtained using 25 elements or individuals, with the only difference that the solution space is more populated because of the increase in the number of elements used. Also, the NSGA-II algorithm obtains a very close solution to those provided by the NPHC and SQP algorithms, increasing the accuracy when compared with the results obtained using 25 individuals only. However, this increase in accuracy of the NSGA-II algorithm comes with the price of a longer time of computation, increasing it from about 57 s to more than 400 s for each of the optimizations. The time needed by the NPHC and the SQP algorithms is the same as the case when 25 elements are used.
Figure 7 shows the Pareto set for fuel cost and SO2 emissions. As for the case of 25 elements, the NPHC and SQP algorithms provide an accurate solution as well as a good distribution of the elements on the solution space. The figure also shows that the NSGA-II algorithm provides a very close solution to those of the NPHC and SQP algorithms, and covers well the solution space except for fuel cost values higher than 8391. In terms of the time of computation, the SQP algorithm needs an average of 0.569 s to obtain a single point, thus it needs 284.580 s to obtain the 500 elements of the Pareto set; the NSGA-II algorithm needs 379.879 s to obtain the Pareto set using 500 individuals; the NPHC algorithm needs 2.844 s only to obtain the Pareto set using 500 elements.
Figure 8 shows the Pareto set for fuel cost and NOx emissions. As for the case of 25 elements, the NPHC and SQP algorithms provide an accurate solution as well as a good distribution of the elements on the solution space. The figure also shows that the NSGA-II algorithm provides a very close solution to those of the NPHC and SQP algorithms, and covers well the solution space except for fuel cost values smaller than 8345. In terms of the time of computation, the SQP algorithm needs an average of 1.0284 s to obtain a single point; thus, it needs 514.220 s to obtain the 500 elements of the Pareto set; the NSGA-II algorithm needs 385.152 s to obtain the Pareto set using 500 individuals; the NPHC algorithm needs 2.877 s only to obtain the Pareto set using 500 elements.
Figure 9 shows the Pareto set for fuel cost, SO2 emissions, and NOx emissions. It is observed that the NPHC and SQP algorithms provide an accurate solution as well as a good distribution of the elements on the solution space. It is observed that again the NSGA-II algorithm covers well the solution space, although it has problems to reach the exact solution for small fuel cost values. In terms of the time of computation, the SQP algorithm needs an average of 0.703 s to obtain a single point; thus, it needs 351.6 to obtain the 500 elements of the Pareto set; the NSGA-II algorithm needs 474.36 s to obtain the Pareto set using 500 individuals; the NPHC algorithm needs 3.206 s only to obtain the Pareto set using 500 elements.

4.3. Time of Computation Required by the NPHC Algorithm

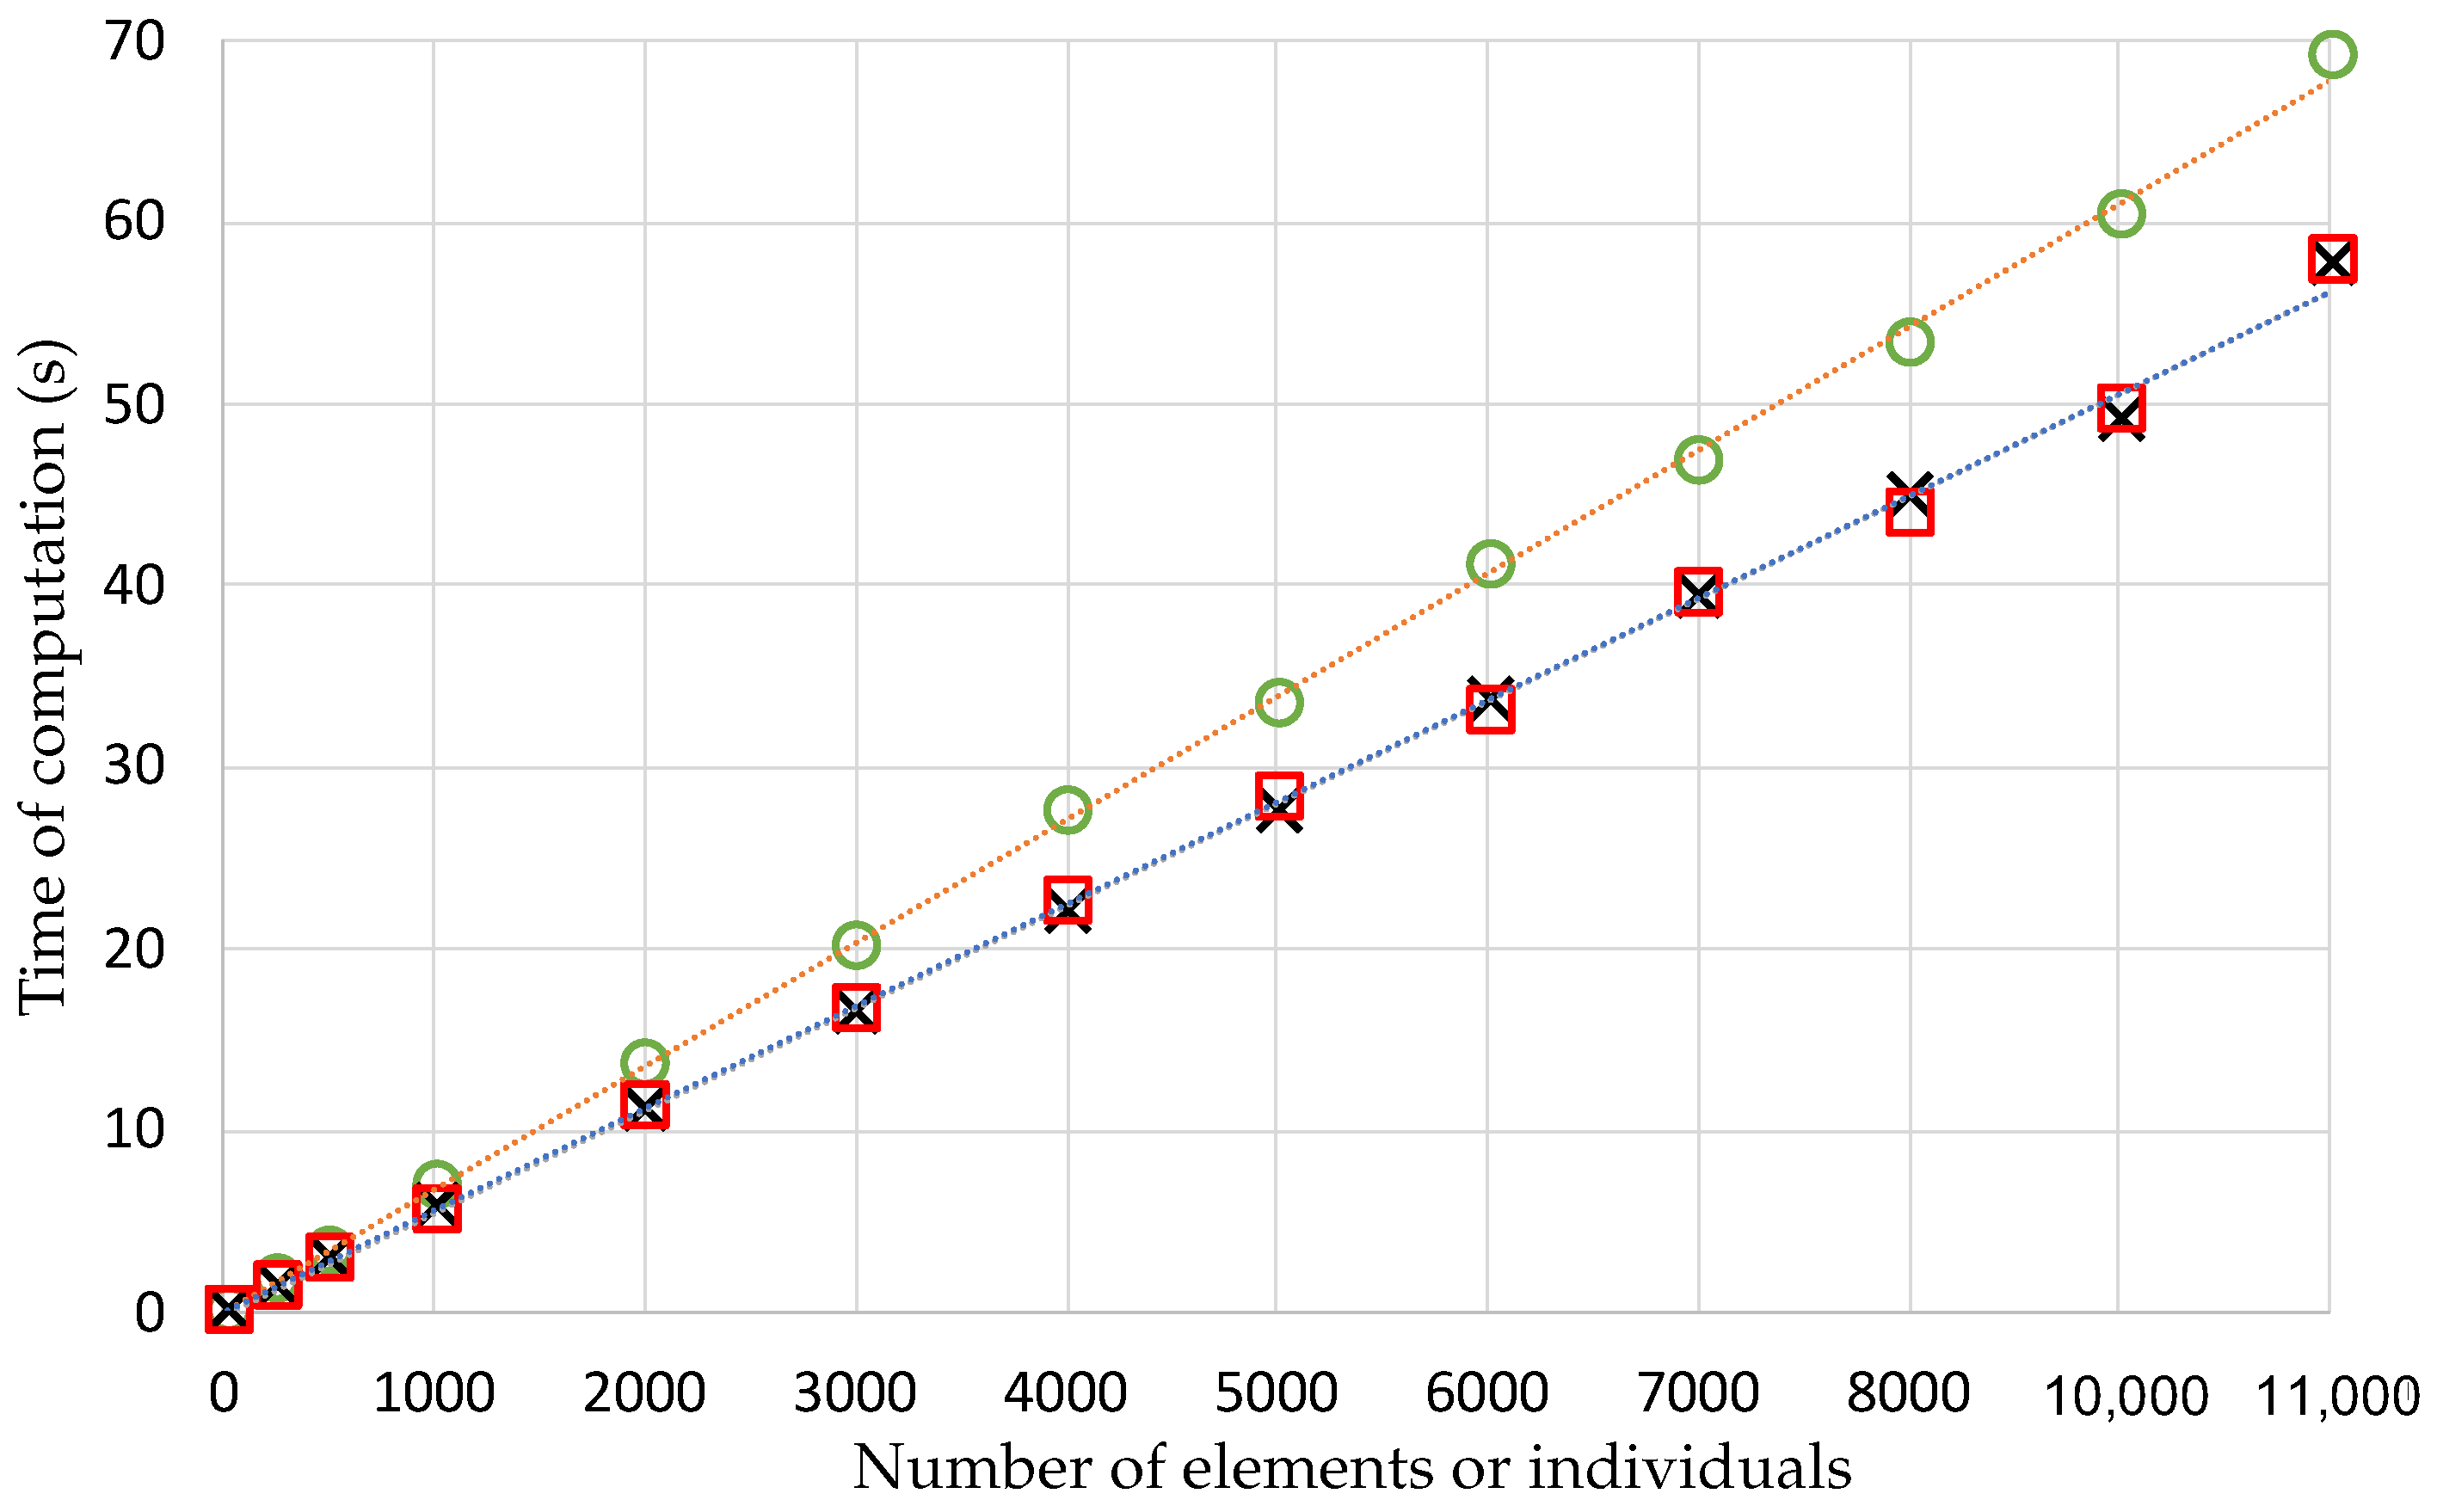
Figure 10 shows the time of computation used by the NPHC algorithm to obtain a simultaneous solution of two and three objective functions with respect to the number of elements or individuals used. For the three cases, i.e., fuel cost–SO2, fuel cost–NOx, and fuel cost–SO2–NOx, the time of computation increases as a linear function of the number of elements used. It is also observed that the optimizations are obtained very fast, even when a large number of elements or individuals are used. This result shows that the NPHC is a very efficient algorithm.

5. Conclusions

In this work, the Numerical Polynomial Homotopy Continuation (NPHC) method has been successfully applied to solve the Economic Emission Dispatch problem. The NPHC algorithm is compared with the SQP algorithm, which is based on a deterministic approach, and the NSGA-II algorithm, which is based on a stochastic approach.
The work shows that the NPHC algorithm performs well at obtaining an accurate solution of the multiobjective optimization problem by guaranteeing to find all the roots (solutions) of the problem by searching through all the solution space. The NPHC algorithm is very easy to implement because it is constructed based on the Homotopy Analysis method and the fundamental theorem of algebra. The NPHC algorithm obtains the solution of the problem in a very short period of time when compared to other deterministic and probabilistic algorithms. For the minimization of a single objective function, the time of computation required by the NPHC algorithm is independent of the number of elements used because the trajectory of a single objective function is followed through the optimization process. For the simultaneous minimization of two and three objective functions, the time of computation required by the NPHC algorithm varies linearly with respect to the number of elements used to construct the Pareto set, suggesting that the NPHC is a very efficient algorithm.
These findings show that the NPHC method is a good alternative to solve multiobjective optimization models to help the power industry to deal with the dispatch of electricity considering the reduction of both, fuel cost and emissions to the environment.
Author Contributions

O.I.B.-A. and J.A.M.-B. developed the work and wrote the paper; C.E.D.-A. and S.C.-A. conceived the idea of the research and supervised the development of the project; A.S.-R., J.A.A.-A., and J.A.P.-M. contributed on the optimization model and wrote the paper. All authors have read and agreed to the published version of the manuscript.

Funding

This research received no external funding.

Acknowledgments

S. Cano-Andrade, C. E. Damian-Ascencio, A. Saldaña-Robles, J. A. Alfaro-Ayala, and J. A. Padilla-Medina gratefully acknowledge to the National Council of Science and Technology (CONACyT), Mexico, for its financial support under the SNI program. J. A. Montañez-Barrera thanks to CONACyT, for his Assistantship No. CVU- 736083.

Conflicts of Interest

The authors declare no conflict of interest.

Abbreviations

EEDEconomic emission dispatch
SEEDStatic economic emission dispatch
DEEDDynamic economic emission dispatch
NPHCNumerical polynomial homotopy continuation
HAHomotopy Analysis
SQPSequential quadratic programming
NSGA-IINondominated sorting genetic algorithm II
CBBClassical Bézout Bound

References

  1. Raza, M.Q.; Khosravi, A. A review on artificial intelligence based load demand forecasting techniques for smart grid and buildings. Renew. Sustain. Energy Rev. 2015, 50, 1352–1372. [Google Scholar] [CrossRef]
  2. Xing, H.; Lin, Z.; Fu, M.; Hobbs, B.F. Distributed algorithm for dynamic economic power dispatch with energy storage in smart grids. IET Control. Theory Appl. 2017, 11, 1813–1821. [Google Scholar] [CrossRef]
  3. Cano-Andrade, S.; von Spakovsky, M.R.; Fuentes, A.; Lo Prete, C.; Mili, L. Upper Level of a Sustainability Assessment Framework for Power System Planning. J. Energy Resour. Technol. 2015, 137, 041601. [Google Scholar] [CrossRef]
  4. Vargas-Jaramillo, J.R.; Montanez-Barrera, J.A.; von Spakovsky, M.R.; Mili, L.; Cano-Andrade, S. Effects of producer and transmission reliability on the sustainability assessment of power system networks. Energies 2019, 12, 546. [Google Scholar] [CrossRef] [Green Version]
  5. De Gouw, J.A.; Parrish, D.D.; Frost, G.J.; Trainer, M. Reduced emissions of CO2, NOx, and SO2 from US power plants owing to switch from coal to natural gas with combined cycle technology. Earth’s Future 2014, 2, 75–82. [Google Scholar] [CrossRef]
  6. Lee, C.Y.; Zhou, P. Directional shadow price estimation of CO2, SO2 and NOx in the United States coal power industry 1990–2010. Energy Econ. 2015, 51, 493–502. [Google Scholar] [CrossRef]
  7. Nwulu, N.I.; Xia, X. Multi-objective dynamic economic emission dispatch of electric power generation integrated with game theory based demand response programs. Energy Convers. Manag. 2015, 89, 963–974. [Google Scholar] [CrossRef]
  8. Pfenninger, S.; Keirstead, J. Renewables, nuclear, or fossil fuels? Scenarios for Great Britain’s power system considering costs, emissions and energy security. Appl. Energy 2015, 152, 83–93. [Google Scholar] [CrossRef] [Green Version]
  9. Covert, T.; Greenstone, M.; Knittel, C.R. Will we ever stop using fossil fuels? J. Econ. Perspect. 2016, 30, 117–138. [Google Scholar] [CrossRef] [Green Version]
  10. Florios, K.; Mavrotas, G. Generation of the exact Pareto set in Multi-Objective Traveling Salesman and Set Covering Problems. Appl. Math. Comput. 2014, 237, 1–19. [Google Scholar] [CrossRef]
  11. Bayon, L.; Grau, J.M.; Ruiz, M.M.; Suarez, P.M. The exact solution of the environmental/economic dispatch problem. IEEE Trans. Power Syst. 2012, 27, 723–731. [Google Scholar] [CrossRef]
  12. Wang, M.Q.; Gooi, H.B.; Chen, S.X.; Lu, S. A mixed integer quadratic programming for dynamic economic dispatch with valve point effect. IEEE Trans. Power Syst. 2014, 29, 2097–2106. [Google Scholar] [CrossRef]
  13. Han, X.S.; Gooi, H.B. Effective economic dispatch model and algorithm. Int. J. Electr. Power Energy Syst. 2007, 29, 113–120. [Google Scholar] [CrossRef]
  14. Basu, M. Dynamic economic emission dispatch using nondominated sorting genetic algorithm-II. Int. J. Electr. Power Energy Syst. 2008, 30, 140–149. [Google Scholar] [CrossRef]
  15. Xia, X.; Elaiw, A.M. Optimal dynamic economic dispatch of generation: A review. Electr. Power Syst. Res. 2010, 80, 975–986. [Google Scholar] [CrossRef]
  16. Zaman, M.F.; Elsayed, S.M.; Ray, T.; Sarker, R.A. Evolutionary Algorithms for Dynamic Economic Dispatch Problems. IEEE Trans. Power Syst. 2016, 31, 1486–1495. [Google Scholar] [CrossRef]
  17. Mason, K.; Duggan, J.; Howley, E. Multi-objective dynamic economic emission dispatch using particle swarm optimisation variants. Neurocomputing 2017, 270, 188–197. [Google Scholar] [CrossRef]
  18. Hooshmand, R.A.; Parastegari, M.; Morshed, M.J. Emission, reserve and economic load dispatch problem with non-smooth and non-convex cost functions using the hybrid bacterial foraging-Nelder-Mead algorithm. Appl. Energy 2012, 89, 443–453. [Google Scholar] [CrossRef]
  19. Binetti, G.; Davoudi, A.; Naso, D.; Turchiano, B.; Lewis, F.L. A distributed auction-based algorithm for the nonconvex economic dispatch problem. IEEE Trans. Ind. Inform. 2014, 10, 1124–1132. [Google Scholar] [CrossRef]
  20. Bansal, R.C. Optimization methods for electric power systems: An overview. Int. J. Emerg. Electr. Power Syst. 2005, 2, 1–23. [Google Scholar] [CrossRef]
  21. Nanda, J.; Hari, L.; Kothari, M.L. Economic emission load dispatch with line flow constraints using a classical technique. IEEE Proc. Gener. Transm. Distrib. 1994, 141, 1–10. [Google Scholar] [CrossRef]
  22. Noman, N.; Iba, H. Differential evolution for economic load dispatch problems. Electr. Power Syst. Res. 2008, 78, 1322–1331. [Google Scholar] [CrossRef]
  23. Victoire, T.A.A.; Jeyakumar, A.E. Deterministically guided PSO for dynamic dispatch considering valve-point effect. Electr. Power Syst. Res. 2005, 73, 313–322. [Google Scholar] [CrossRef]
  24. Qu, B.Y.; Zhu, Y.S.; Jiao, Y.C.; Wu, M.Y.; Suganthan, P.N.; Liang, J.J. A survey on multi-objective evolutionary algorithms for the solution of the environmental/economic dispatch problems. Swarm Evol. Comput. 2018, 38, 1–11. [Google Scholar] [CrossRef]
  25. Rezaie, H.; Abedi, M.; Rastegar, S.; Rastegar, H. Economic emission dispatch using an advanced particle swarm optimization technique. World J. Eng. 2019, 16, 23–32. [Google Scholar] [CrossRef]
  26. Rezaie, H.; Kazemi-Rahbar, M.H.; Vahidi, B.; Rastegar, H. Solution of combined economic and emission dispatch problem using a novel chaotic improved harmony search algorithm. J. Comput. Des. Eng. 2019, 6, 447–467. [Google Scholar] [CrossRef]
  27. Hussain, S.; Al-Hitmi, M.; Khaliq, S.; Hussain, A.; Asghar Saqib, M. Implementation and comparison of particle swarm optimization and genetic algorithm techniques in combined economic emission dispatch of an independent power Plant. Energies 2019, 12, 2037. [Google Scholar] [CrossRef] [Green Version]
  28. Qu, B.; Qiao, B.; Zhu, Y.; Liang, J.; Wang, L. Dynamic power dispatch considering electric vehicles and wind power using decomposition based multi-objective evolutionary algorithm. Energies 2017, 10, 1991. [Google Scholar] [CrossRef] [Green Version]
  29. He, L.; Lu, Z.; Pan, L.; Zhao, H.; Li, X.; Zhang, J. Optimal economic and emission dispatch of a microgrid with a combined heat and power system. Energies 2019, 12, 604. [Google Scholar] [CrossRef] [Green Version]
  30. Mei, P.; Wu, L.; Zhang, H.; Liu, Z. A hybrid multi-objective crisscross optimization for dynamic economic/emission dispatch considering plug-in electric vehicles penetration. Energies 2019, 12, 3847. [Google Scholar] [CrossRef] [Green Version]
  31. Arora, J.S. Introduction to Optimum Design; Elsevier: Amsterdam, The Netherlands, 2016. [Google Scholar]
  32. Titus, S.; Jeyakumar, A.E. A hybrid EP-PSO-SQP algorithm for dynamic dispatch considering prohibited operating zones. Electr. Power Components Syst. 2008, 36, 449–467. [Google Scholar] [CrossRef]
  33. Sommese, A.J.; Verschelde, J.; Wampler, C.W. Introduction to numerical algebraic geometry. In Solving Polynomial Equations; Springer: Berlin/Heidelberg, Germany, 2005; pp. 301–337. [Google Scholar]
  34. Liao, S.J. The Proposed Homotopy Analysis Technique for the Solution of Nonlinear Problems. Ph.D. Thesis, Shanghai Jiao Tong University, Shanghai, China, 1992. [Google Scholar]
  35. Li, T.Y. Numerical solution of multivariate polynomial systems by homotopy continuation methods. Acta Numer. 1997, 6, 399–436. [Google Scholar] [CrossRef]
  36. Liao, S.J. Notes on the homotopy analysis method: Some definitions and theorems. Commun. Nonlinear Sci. Numer. Simul. 2009, 14, 983–997. [Google Scholar] [CrossRef]
  37. Lee, E.; Mavroidis, C. Solving the geometric design problem of spatial 3R robot manipulators using polynomial homotopy continuation. J. Mech. Des. 2002, 124, 652–661. [Google Scholar] [CrossRef]
  38. Sommese, A.J.; Verschelde, J. Numerical homotopies to compute generic points on positive dimensional algebraic sets. J. Complex. 2000, 16, 572–602. [Google Scholar] [CrossRef] [Green Version]
  39. Alexander, J.C.; Yorke, J.A. The homotopy continuation method: Numerically implementable topological procedures. Trans. Am. Math. Soc. 1978, 242, 271–284. [Google Scholar] [CrossRef]
  40. Mehta, D. Finding all the stationary points of a potential-energy landscape via numerical polynomial-homotopy-continuation method. Phys. Rev. 2011, 84, 025702. [Google Scholar] [CrossRef] [Green Version]
  41. Martinez-Pedrera, D.; Mehta, D.; Rummel, M.; Westphal, A. Finding all flux vacua in an explicit example. J. High Energy Phys. 2013, 6, 110. [Google Scholar] [CrossRef] [Green Version]
  42. Leykin, A.; Plaumann, D. Determinantal representations of hyperbolic curves via polynomial homotopy continuation. Math. Comput. 2017, 86, 2877–2888. [Google Scholar] [CrossRef]
  43. Verschelde, J.; Yu, X. Polynomial homotopy continuation on GPUs. Acm Commun. Comput. Algebra 2016, 49, 130–133. [Google Scholar] [CrossRef]
  44. Akoglu, T.A.; Hauenstein, J.D.; Szanto, A. Certifying solutions to overdetermined and singular polynomial systems over Q. J. Symb. Comput. 2018, 84, 147–171. [Google Scholar] [CrossRef] [Green Version]
  45. Iba, K.; Suzuki, H.; Egawa, M.; Watanabe, T. Calculation of critical loading condition with nose curve using homotopy continuation method. IEEE Trans. Power Syst. 1991, 6, 584–593. [Google Scholar] [CrossRef]
  46. Mehta, D.; Nguyen, H.D.; Turitsyn, K. Numerical polynomial homotopy continuation method to locate all the power flow solutions. IET Gener. Transm. Distrib. 2016, 10, 2972–2980. [Google Scholar] [CrossRef] [Green Version]
  47. Lawrence, C.T.; Zhou, J.L.; Tits, A.L. User’s Guide for CFSQP Version 2.5: A C Code for Solving (Large Scale) Constrained Nonlinear (Minimax) Optimization Problems, Generating Iterates Satisfying All Inequality Constraints; Technical Report TR-94-16r1; Electrical Engineering Department and Institute for Systems Research, University of Maryland: College Park, MD, USA, 1997; Available online: https://www.researchgate.net/profile/Andre_Tits (accessed on 1 July 2019).
  48. Deb, K.; Pratap, A.; Agarwal, S.; Meyarivan, T. A fast and elitist multiobjective genetic algorithm: NSGA-II. IEEE Trans. Evol. Comput. 2002, 6, 182–197. [Google Scholar] [CrossRef] [Green Version]
  49. Ah King, R.T.F.; Rughooputh, H.C.S. Elitist multiobjective evolutionary algorithm for environmental/economic dispatch. In Proceedings of the 2003 Congress on Evolutionary Computation, CEC’03, Canberra, Australia, 8–12 December 2003; Volume 2, pp. 1108–1114. [Google Scholar]
  50. Sommese, A.; Wampler, C. The Numerical Solution of Systems of Polynomials Arising in Engineering and Science; World Scientific Publishing Company: London, UK, 2005. [Google Scholar]
  51. Li, T.Y. Solving Polynomial Systems by the Homotopy Continuation Method. In Handbook of Numerical Analysis; Gulf Professional Publishing: London, UK, 1993. [Google Scholar]
  52. Allgower, E.L.; Georg, K. Introduction to Numerical Continuation Methods; Society for Industrial and Applied Mathematics (SIAM); Springer: Berlin/Heidelberg, Germany, 2003. [Google Scholar]
  53. Stern, F.; Wilson, R.V.; Coleman, H.W.; Paterson, E.G. Comprehensive approach to verification and validation of CFD simulations—Part 1: Methodology and procedures. J. Fluids Eng. 2001, 123, 793–802. [Google Scholar] [CrossRef]
Figure 1. Computational flow of the numerical polynomial homotopy continuation (NPHC) methodology.
Energies 13 04281 g001
Figure 2. Trajectory of the minimization of the fuel cost objective function with the NPHC algorithm.
Energies 13 04281 g002
Figure 3. Trajectory of the roots (solutions) during the minimization of the fuel cost objective function with the NPHC algorithm. Red squares represent x 1 , blue triangles represent x 2 , and green circles represent x 3 .
Energies 13 04281 g003
Figure 4. Pareto front for fuel cost and SO2 emissions constructed using 25 elements. Red squares represent the sequential quadratic programming (SQP), green circles represent NSGA-II, and black × represent NPHC.
Energies 13 04281 g004
Figure 5. Pareto front for fuel cost and NOx emissions constructed using 25 elements. Red squares represent SQP, green circles represent NSGA-II, and black × represent NPHC.
Energies 13 04281 g005
Figure 6. Pareto front for fuel cost, SO2 emissions, and NOx emissions constructed using 25 elements. Red squares represent SQP, green circles represent NSGA-II, and black × represent NPHC.
Energies 13 04281 g006
Figure 7. Pareto front for fuel cost and SO2 emissions constructed using 500 elements. Red squares represent SQP, green circles represent NSGA-II, and black × represent NPHC.
Energies 13 04281 g007
Figure 8. Pareto front for fuel cost and NOx emissions constructed using 500 elements. Red squares represent SQP, green circles represent NSGA-II, and black × represent NPHC.
Energies 13 04281 g008
Figure 9. Pareto front for fuel cost, SO2 emissions, and NOx emissions constructed using 500 elements. Red squares represent SQP, green circles represent NSGA-II, and black × represent NPHC.
Energies 13 04281 g009
Figure 10. Time of computation required by the NPHC algorithm in terms of the number of elements or individuals used to construct the Pareto set. Red squares represent minimization of fuel cost–SO2, and black × represent minimization of fuel cost–NOx, and green circles represent minimization of fuel cost–SO2–NOx.
Energies 13 04281 g010
Table 1. Minimization of fuel cost.
MethodValue ($/h)Producers (MW)Time
SQP8344.593435.198, 299.970, 130.6610.090
NSGA-II8357.559473.832, 244.248, 146.60557.442
NPHC8344.593435.198, 299.970, 130.6610.006
Table 2. Minimization of SO2 emissions.
MethodValue (ton/h)Producers (MW)Time
SQP8.9659550.603, 220.760, 93.1600.341
NSGA-II8.9786575.635, 236.714, 52.97157.065
NPHC8.9659552.112, 219.444, 92.9600.010
Table 3. Minimization of NOx emissions.
MethodValue (ton/h)Producers (MW)Time
SQP0.095925493.075, 265.802, 106.1270.394
NSGA-II0.096389540.950, 225.798, 97.76657.467
NPHC0.095924508.580, 250.443, 105.7230.007
Table 4. Minimization of fuel cost.
MethodValue ($/h)Producers (MW)Time
SQP8344.593435.198, 299.970, 130.6610.090
NSGA-II8344.832431.532, 307.204, 127.289403.250
NPHC8344.593435.198, 299.970, 130.6610.006
Table 5. Minimization of SO2 emissions.
MethodValue (ton/h)Producers (MW)Time
SQP8.9659550.603, 220.760, 93.1600.341
NSGA-II8.9662557.153, 211.829, 95.463432.091
NPHC8.9659552.112, 219.444, 92.9600.010
Table 6. Minimization of NOx emissions.
MethodValue (ton/h)Producers (MW)Time
SQP0.095925493.075, 265.802, 106.1270.394
NSGA-II0.095926510.543, 248.199, 105.969430.515
NPHC0.095924508.580, 250.443, 105.7230.007