Abstract
The operation of microgrids is a complex task because it involves several stakeholders and controlling a large number of different active and intelligent resources or devices. Management functions, such as frequency control or islanding, are defined in the microgrid concept, but depending on the application, some functions may not be needed. In order to analyze the required functions for network operation and visualize the interactions between the actors operating a particular microgrid, a comprehensive use case analysis is needed. This paper presents the use case modelling method applied for microgrid management from an abstract or concept level to a more practical level. By utilizing case studies, the potential entities can be detected where the development or improvement of practical solutions is necessary. The use case analysis has been conducted from top-down until test use cases by real-time simulation models. Test use cases are applied to a real distribution network model, Sundom Smart Grid, with measurement data and newly developed controllers.. The functional analysis provides valuable results when studying several microgrid functions operating in parallel and affecting each other. For example, as shown in this paper, ancillary services provided by an active customer may mean that both the active power and reactive power from customer premises are controlled at the same time by different stakeholders.
1. Introduction
Microgrids can be classified according to the function demand, capacity, voltage type, voltage level, and mode of operation. The operation mode can be either steady-state in grid-connected or islanded mode or transition to grid-connected or to islanded mode. Moreover, a microgrid can be permanently islanded, which is an isolated or a remote microgrid. Microgrids are complex systems, which can be formed at different voltage levels in the electricity distribution network, and they are able to provide several technical functions in addition to supporting the requirements of reliability, efficiency, and reduced emissions. These functions are intended to the resilient operation, seamless transitions, provision of ancillary services, and communication between the actors as well as services for the resiliency needs of the participating communities.
The development of the management system for microgrids is a challenging task. The challenges arise from the distributed and intermittent, flexible energy resources, many of which are on customer premises playing a crucial role in the management of the microgrid. The management of microgrids can consist of several systems to be managed. Indeed, a microgrid management system (MMS) can be described as a management system of systems. The functions of the microgrids (e.g., energy management, Volt/Var control, or intentional islanding) are distributed to devices. An operation can be described as the method of a concept or a joint action of several systems or devices functioning together to accomplish the desired objective. Each individual system or unit has a specific function, and without their task execution, the operation would not succeed or be complete. Operation is the method by which a device or system performs its function while a function is what something does or is used for. In the same way, we can understand that the microgrid functions represent the tasks that a microgrid has to perform to fulfill the functional requirements imposed on it, and which methods are available to perform the required function(s).
For the microgrid control functions, several definitions have been suggested. The microgrid functions can be defined based on the control hierarchy, which are primary, secondary, and tertiary control levels, as authors in [1,2,3] present. Authors in [4,5] present the functions according to the microgrid architecture by layers 0, 1, 2, 3, and 4. IEEE standards 2030.7 and 2020.8 define the core microgrid controller functions as a dispatch function and a transition function, excluding the functions related to the protection of microgrids [6,7]. IEC TS 62898-2 defines the main control systems of the microgrids as the primary control, and further, a central controller takes care of the secondary control [8]. The microgrid control functions are also released by vendor-based solutions [9]. Now, however, standards are starting to appear and develop. There are concerns that regard how to utilize or map the early stage standardization, different requirements, and use cases in real microgrids, real microgrid functions, or test cases, which can vary [10].
Therefore, this research aims to define, study and analyze the functions of microgrids by taking into account the functionalities of microgrids, the aim of operation as well as the different power grid applications to the extent appropriate to the context. Furthermore, the studied microgrid functions are implemented in the operation of an MMS by developing relevant levels of use cases, that is, behavioral descriptions. Based on a selected (test) use case, a simulation model is developed for further case studies and controller development and vice versa, an existing simulation model and a simulation case study are described by developing a corresponding (test) use case. These selected cases differ with their operating or functioning time-frame—one is related to protection in electromagnetic transients (EMT) simulations, and the other two are related to demand response and reactive power control in RMS transient stability simulations. These three types of test cases were selected to highlight that use case modelling, simulation, and testing over different time domains, as co-simulation is essential in the research and development of microgrid control systems.
By starting this research with the definitions related to microgrid functions, functionality, operations, or applications, it is noteworthy that several terms are describing the control or management system: a microgrid management system, a microgrid controller, a microgrid central controller, and a microgrid energy management system. Therefore, Section 2 clarifies the terms mentioned above and different types of microgrid applications. Section 3 presents the microgrid functions as well as the general control and operational use cases of microgrids. Section 4 presents the functional analysis of microgrids and the use case modeling and, further, Section 5 presents the demand response and protection primary use cases with the help of the Sundom Smart Grid case. Section 6 presents the selected test use cases—ancillary services (AS) as well as protection—according to the defined microgrid functionalities. Section 7 provides conclusions.
2. Definitions and Applications
Several similar definitions exist for microgrids, but in the following, definitions for microgrids and microgrid management systems are presented based on the IEEE and IEC standardization. Furthermore, different types of microgrids are presented because the microgrids can work in different ways, depending on the microgrid concept application in addition to the targets of operational optimization. Finally, the definitions for the control hierarchy and control architecture of a microgrid management system are presented.
2.1. Microgrids
In IEEE standard 2030.7 a microgrid is defined as follows: ‘A group of interconnected loads and distributed energy resources with clearly defined electrical boundaries that acts as a single controllable entity with respect to the grid and can connect and disconnect from the grid to enable it to operate in both grid-connected or island modes’ [6].
In IEC-TS 62898-1, a microgrid is defined as follows: ‘Group of interconnected loads and distributed energy resources with defined electrical boundaries that acts as a single controllable entity and is able to operate in both grid-connected and island mode.’ The definition covers both utility microgrids and customer microgrids [11].
The microgrid concept should provide a broad range of economic, technical, and environmental benefits to different stakeholders according to the use of configuration and operation schemes [3]. From the power system operator’s viewpoint, the microgrids can be considered as an aggregation concept of the coordinated control (both supply and demand-side) based on the connected, flexible distributed energy resources (DERs). From the end user’s point of view, microgrids should decrease the costs of energy, increase power quality and reliability, and offer energy services, for example.
Microgrids are often identified according to different kinds of communities, such as energy communities that could facilitate the power grid energy management. Participation in a community must be open to all potential local members, and it must be voluntary to join as well as leave the community [12]. For example, in energy communities, the owners of distributed energy resources (DER) participate in the energy generation that is sold to the local energy utilities, and the profits are divided among the participants. The generated electricity could also be consumed by participating prosumers, providing a valuable economic benefit of local energy generation. The Renewable Energy Directive (EU) 2018/2001 insists that local communities are organized in the vicinity of renewable energy projects they own and develop, while the Electricity Market Directive (EU) 2019/944 does not engage citizen energy communities in the same geographical location between generation and consumption [12]. The energy communities can be those such as homogenous energy communities, mixed energy communities, or self-sufficient communities. Energy communities can be composed of a part of a microgrid, a microgrid, or a subset set or a superset of microgrids that have the objective of the energy function for operation. In other words, microgrids are not equivalent to energy communities, but they can form the technical basis of microgrids.
A microgrid can be constructed based on a variety of benefit expectations, which might be the improved reliability, economy, or preparedness for disasters. Additionally, the geographical location sets conditions for the microgrid feasibility. Microgrids can be classified by their different aims to operate [11] as follows:
- Improving reliability: a distribution microgrid (a part of a utility grid, a campus, or another area of operation) or a facility microgrid (in a customer, a military base, or a hospital installation, etc.);
- Low-cost powering remote areas: an isolated microgrid (in rural areas, or islands);
- Reducing energy cost: the microgrid users offer ancillary services;
- Providing disaster-preparedness: asset optimization due to critical conditions (a disaster-prone area).
2.2. Microgrid Management System
The purpose of implementing an advanced control and optimization system in microgrids is to fulfill the functional requirements or benefit expectations set for the microgrid. The microgrid control or management system has several similar terms defining the system, but in this research, we rely on how standardization is describing an MMS.
IEEE standard 2030.7 defines a microgrid control system as follows: A system that includes the control functions that define the microgrid as a system that can manage itself, operate autonomously, and connect to and disconnect from the main distribution grid for the exchange of power and the supply of ancillary services; it includes the functions of the microgrid energy management system (MEMS); it is the microgrid controller if implemented in the form of a centralized system [6].
IEC-TS 62898-1 defines a microgrid energy management system as follows: ‘System operating and controlling energy resources and loads of the microgrid’ [11].
The purpose of the microgrid control system is to provide the microgrid with the means to control itself, operate independently or connected to the grid, and connect or disconnect the primary distribution grid for electricity exchange and ancillary services. It should have both real-time control and energy management functions for operating in the grid-connected and the islanded mode, managing the transition functions and providing ancillary services, supporting the grid, and participating in the operation of the energy market or the operation of the utility. A microgrid control system consists of software and hardware and can be physically centralized or distributed. The term microgrid control system (or MMS as used in this paper) describes the situation where the control functions can be distributed in the microgrid assets or being centralized in one controller [6].
2.3. Control Scheme Hierarchy and Control Architecture of a Microgrid Management System
The control system scheme is illustrated by particular interconnections of elements. An element is a set of any objects that make up a set. For example, in object-oriented modeling, the object can be a combination of variables, functions, and data structures referring to a particular instance of a class. The function of a control system defines the possible transformations made by the control system, which can change the information (change the state of parameters) or can change the scheme (structure) and the behavior [13]. The composite of a control system depends on the elementary control systems, and it can be realized in different hierarchies [13].
A hierarchical control scheme is proposed consisting of three control levels, which are primary, secondary, and tertiary control levels [1]. The hierarchy of these three control levels is presented in Figure 1a.
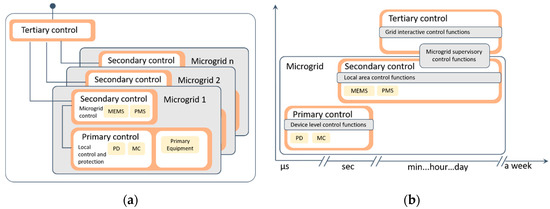
Figure 1.
Three control levels of a microgrid management system. (a) Hierarchical control levels: primary control, secondary control, and tertiary control. Adapted from [1]. (b) Microgrid control system time-frame and action time domain. Adapted from [6].
Primary control is the local of DER, featuring the fastest response, and it is based on local measurements. The primary control includes current and voltage control loops, active and reactive power droop control loops, as well as virtual impedance loops [14,15]. For example, for power (P/Q) sharing in microgrids, multiple power electronic converters can operate in parallel, and droop control can be employed in this control level. Another example is in the islanded microgrid, where the essential function of the energy storage system (ESS) is to adjust power by charging or discharging the storage in order to achieve the power balance in the grid. Additionally, primary control is involved in balancing the energy between the ESs. Depending on the state of charge (SoC) of the ESs, their support for active power can be adjusted in coordination with the controllable DER units. Islanding detection is also included in this control level.
Secondary control includes the microgrid energy management system (MEMS) that is responsible for energy management either in the grid-connected or islanded mode of the microgrid. Energy management system (EMS) functions include economic dispatching and unit commitment [16]. Unit commitment can provide setpoints for a day(s) based on prediction, and economic dispatch provides setpoints based on measurements [16]. Hence, there can be several requirements and different time-frames for dispatching of DERs, especially when controlling a multi-microgrid or a cluster of microgrids [16].
Secondary control is utilized for the control of power quality, voltage unbalance, harmonic compensation, as well as synchronization and power exchange with the primary grid and the other microgrids [16]. In the following, some examples of these duties are pointed out [1].
Power quality control includes voltage and frequency deviation restoration, which aims to ensure that the deviations are regulated toward zero after changes of demand or generation inside the microgrid. The differences are processed by the new reference parameters for the power electronics connected DER units to restore the output voltage frequency and amplitude. Several methods and resources have been proposed, for example, in [17,18,19,20].
In an islanded microgrid, voltage unbalance compensation is used in sensitive load bus (SLB) by equalizing the compensation efforts among the DG units. Additionally, the limitations for the harmonics can be satisfied with secondary control algorithms. The optimal setting points or compensating references for primary controllers are calculated in this control level [21,22].
Power exchange can be controlled, for example, for economical operation of the grid. The optimization procedure is for minimizing a cost function, which outputs references either for the active power and voltage or the reactive power and frequency [23].
Tertiary control gives setpoints for long-term control regarding the requirements from the hosting power system [1]. Furthermore, tertiary control coordinates the operation of multiple microgrids, which interacts with each other in the system (for example, functioning as a nested microgrid), and communicates the requirements from the host grid, such as voltage support and frequency regulation [1]. Tertiary control deals with ancillary services, for example, frequency support, load following support, and hourly ramping [24]. Additionally, tertiary control can be utilized for power quality improvement, such as a procedure for differentiating the power quality level, multiple-power-quality-level (MPQL), for different areas, which is presented in [25]. Furthermore, tertiary control can be applied for the blackout situation of the primary grid by the management of a group of interconnected microgrids or a microgrid cluster for acting as a virtual power plant (VPP) in order to supply the critical loads [26].
In addition to the previously discussed control, zero-level control is defined as the internal control (the level 0) that is responsible for managing the voltage or current output of the power electronic interface (of DG units) [27]. These interfaces can be divided into current-source inverters (CSIs) and voltage-source inverters (VSIs) [28]. The CSIs are utilized for injecting current to the grid, whereas the VSIs are used for maintaining the stable voltage in the network [29].
Figure 1b presents the time frame and action time domain of an MMS. The device-level control or the primary control of a microgrid act in the range from microseconds to seconds. The local area control functions and microgrid supervisory control functions are the secondary control acting in the range from seconds to days. The tertiary control is the grid-interactive control functions or microgrid supervisory control functions acting in the range from minutes to days or a week [6].
The architecture of the microgrid control system can be centralized or decentralized. In centralized control architecture, the decision of the control actions is made in a single place, due to the advantage that the complete knowledge of the system is there. In contrast, in decentralized control architecture, several subsystems are controlled by themselves, but they share information. Furthermore, the architecture of the one single system may be the internal architecture of a control product, as well as it can be a bill of material, including both software and hardware. The question is how the “bill of material” of the microgrid management system as a “system of systems” is structured to solve the functions required by users. It is essential to describe the control system adequately so that everyone understands and agrees that it does what is expected. An architectural layout can be created to house all control systems, and a functional specification can be written for the control system, although their interpretation is usually tricky. However, none of these things provide the necessary assurance for a particular performance. The control system architecture is meant to translate the functional requirement into hardware.
Concerning this, the microgrid control system architecture can be illustrated by four layers: layer 1–layer 4, but it is attached to layer 0. Layer 0 presents the primary microgrid components. In the following, the different layers are presented from the device or subsystem perspective. Layer 0 (primary devices) includes devices and actions such as transformers, lines, circuit breakers, switches, generation, load, or storage. Control, monitoring, or sensing devices at layer 1 have hardwired connections to the primary equipment for monitoring or controlling of them. Layer 1 (device-level control) can be load controllers, protection relays, distributed generation controllers, and meters for layer 0 devices. Layer 2 (network levels control) contains communications equipment, sensors, security gateways, and data processing and aggregating devices. Layer 3 (supervisory level control) includes a supervisory controller or energy manager, which can host, for example, forecasting, data management, or optimization. The equipment in layer 1 receives commands from layer 3 algorithms. The commands can be related to, for example, power factor control, demand response, dispatch of renewables, load shedding, Volt/VAr management, generation source optimization, or secondary frequency control. Layer 4 (grid integration and analytics layer) is responsible for the diagnostic and engineering elements, such as automatic event report retrieval, detailed sequential event recorder reports, and management of settings for all microgrid central control system equipment. Human–machine interfaces in this layer provide the real-time status of the controller to network operations and maintenance staff. Layer 4 includes economic optimization, automated financial transactions, and forecasting functions [4,5,30].
3. Microgrid Functions and Control and Operational Use Cases
Regardless of the microgrid application, there are general functions defined for microgrids that are presented in this section. Additionally, it can be realized that depending on the application, some functionalities might not be needed. Despite this, it is necessary to define the representative functions that an MMS has to perform as well as the representative use cases, where the aim is to fulfill the operational requirements of smart grids (system, metering, as well as grid operations). In this research, the defined microgrid functions are considered and presented as functional requirements for the MMS.
3.1. IEEE and IEC TS Standardization
IEEE standardization [6,7] defines the core functions of microgrids that are dispatch and transition. The dispatch function is a command for the microgrid components or their separate controllers that might be open/close, start/stop, set the generation levels, or reduce the load. The control system has to dispatch the microgrid assets in terms of power. In the grid-connected mode, the dispatch function should fulfill interconnection agreement in energy and interconnection requirements in power quality, but also it should satisfy the microgrid operator’s internal requirements. The dispatch function should apply in grid-connected, islanded, and in transition mode. Transition function is defined for several transition actions. The transition function might be planned or unplanned. Additionally, reconnection to the grid and black start are transition functions. [6]
The testing of the microgrid control system should include proper and representative (i) test scenarios, (ii) performance metrics, and (iii) testing environment ranging from an entirely simulated environment to field-installed equipment. For example, the testing scenarios of the dispatch function should be defined in the grid-connected operation as well as in the islanded operation. In grid-connected and islanded operations, the impact of load and generation variation, as well as active and reactive power, (P, Q), flows within the microgrid should be verified. Additionally, at the point of interconnection (POI), the power flows (P, Q) should be verified in the grid-connected mode and the voltage and frequency (V, f) in the islanded operation mode. A real-time hardware-in-the-loop (HIL) simulation environment is suitable for testing the components of the microgrid control system [7].
The management of microgrid functions can be established through four layers (or communication function blocks) presented in Figure 1b, which are (1) a device layer (e.g., control of voltage/frequency, reactive power, electric vehicle (EV), energy storage (ES), load, generation, islanding detection, or fault management, protection); (2) a local area control layer (e.g., load management, building energy management, automatic generation control, fast load shedding, a plant controller, sequence logic, status control, resynchronization, or disturbance recording); (3) a supervisory control layer (e.g., forecasting, optimization, state estimation, topology chance management, data management, visualization, dispatch, generation smoothing, spinning reserve, emergency handling, protection coordination, or black start); and (4) a high-level grid interface layer (e.g., an area electric power system control, spot market, a distribution management system, SCADA, or connection to an adjacent microgrid). The functions in these four blocks can reside in different hardware and software components that make up the microgrid control system [6].
According to [11], the functions of the microgrid control system should include power balance management, demand-side management, economic dispatch, and information exchange between the grid-connected microgrid and the main grid. Both IEEE and IEC standardization recognize the EMS as a part of a microgrid management system.
3.2. Use Cases
Ten primary use cases were modeled for a microgrid control system or an MMS in Oak Ridge National Laboratory [31] based on microgrid controls and operational functions described in [32]. These use cases aim to capture the key requirements of a microgrid controller. The basic functions or use cases modeled were:
- Frequency control;
- Voltage/reactive power control;
- Intentional islanding;
- Unintentional islanding;
- Transition to grid-connected operation;
- Energy management;
- Protection;
- Ancillary services;
- Black start;
- User interface and data management.
Other similar definitions can be found in [33], for example:
- Coordinated dispatch of DER;
- Seamless transition;
- Power exchange with the main grid;
- Provision of AS;
- Enabling market participation of DER.
3.3. Microgrid Energy Management System
The microgrid EMS (MEMS) aims to provide optimized operation of a microgrid while satisfying its technical constraints. The EMS functions are presented in Figure 2a, which are the real-time control of microgrid assets for providing ancillary services as well as an optimization of the assets for the energy market. These functions run based on data monitoring, data analytics, and forecasting (generation, load, storage, meteorological data, and market prices) functions [34].
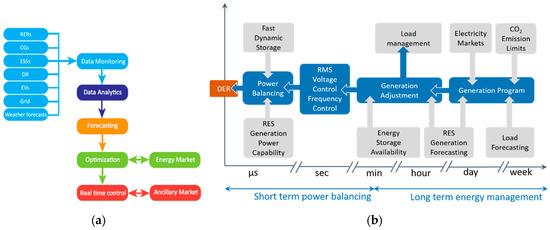
Figure 2.
Microgrid energy management system: (a) microgrid EMS functions [34]; (b) timing classification of the EMS control functions. Adapted from [35].
Furthermore, the MEMS can be considered for long-term energy management as well as a short-term power balancing system, as presented in Figure 2b. Long-term energy management includes load forecasting, generation prediction, energy storage reserve, energy estimation, peak shaving, operational planning, reduction in CO2 emissions, provision of adequate capacity of power reserve in conformity with the electricity market, and demand forecasting. Short-term power balancing includes real-time power dispatching between DER internal sources as well as RMS voltage regulation and primary frequency control [35].
3.4. Protection System
Traditionally in the radial distribution systems, overcurrent protection schemes have been used, but also distance and differential protection schemes are employed. In microgrids, the MMS is responsible for the protection system management so that the protection system is adaptable depending on the operation mode of the microgrid (grid-connected or island), and if necessary, on the changes in generation and demand. Due to the existence of the distributed generation, the fault currents can vary substantially, and the fault current flow can be bidirectional. Therefore, the traditional non-directional overcurrent relay protection schemes are not able to operate properly in most situations. For the protection of microgrids, voltage or total harmonic distortion (THD) based protection could be suitable. The authors in [36] claim that the protection system of low voltage microgrids should be based on the voltage measurement because the inverter connected distributed generation (DG) units can provide low short circuit currents and thus delay the operation of the protective device. In this research, the protection system is not studied further. Communication-based protection systems/concepts have been proposed in [37,38,39]. Additionally, suitable communication standards for protection systems are available, such as IEC 61850. In this research, protection techniques are not studied further.
4. Functional Analysis and Use Case Modelling
Microgrids are often discussed from their feasibility point of view even though microgrids are not a new invention, they have been operated in non-interconnected islands or remote locations. There have been standby or backup generators, providing a secure electricity supply to hospitals, industrial plants, or communities. The unique element is that the concept is applied to a single customer end, and various actors participate in microgrid management while expecting benefits. With a functional analysis of microgrids, the aim here is to represent the abstraction related to microgrids and sharpen the focus of the functions.
4.1. Functional Analysis
The framework for the functional analysis of microgrids is made “top-down”, as illustrated from left to right in Figure 3. The highest level describes the application where the microgrid concept is applied and further the aim of the microgrid operation, as presented in Section 2.1. Next, the microgrid functionalities from the management point of view are given, highlighting that functionality (or feature) is the sum of functions or any aspect of what a microgrid can do for a user, e.g., distribution system operator (DSO). In other words, functionalities of the microgrids are used for identifying its features but also for enabling a user to gain specific capabilities. Finally, the general microgrid functions are defined as presented in Section 3.3 and especially two core functions: dispatch and transition, which are presented in Section 3.1. The last column in the left shows examples of the goals of the microgrid functions. In the following, some examples are used partly from [9,40] to present how a microgrid functionality can be formed from several microgrid functions or how different functions are interlinked.
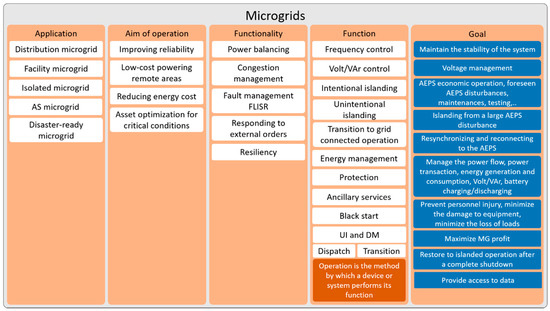
Figure 3.
The functional analysis of microgrids.
- Power balancing and load balancing
- Frequency control (in islanded mode): steady-state device-level control (P/f droop), coordinated control of DERs, transient device-level control, frequency smoothing, low-frequency ride-through (LFRT), emergency load shedding;
- Volt/VAr control: steady-state device-level control (Q/V droop), coordinated control of DERs, management of voltage fluctuations due to intermittent power generation of DERs, low voltage ride-through (LVRT);
- Energy management (in islanded mode).
- Congestion management
- Energy management: grid-connected energy balancing, operation optimization, forecast;
- Volt/VAr control: secondary level voltage control (settings for voltage controllers);
- Intentional islanding: network reconfiguration;
- Transition to grid-connected operation: network reconfiguration;
- User interface (UI) and data management (DM): energy exchange information and V/VAr support schedules between the main grid and the microgrid, real-time data (voltages, currents, active power, and reactive power) at POI.
- Fault management, fault location, isolation and supply restoration (FLISR)
- Unintentional islanding: anti-islanding protective schemes’
- Protection: short-circuit protection, earth-fault protection, adaptive protection settings’
- Black start: system restoration procedure.
- Responding to external orders
- Ancillary services: frequency control support (TSO), voltage control support (DSO), congestion management (utilizing generation curtailment, load curtailment or load shedding, ES);
- Intentional islanding: request from the operating entity, a scheduled tariff transition or operation agreement;
- UI and DM: energy exchange information and V/VAr support schedules between the main grid and the microgrid, real-time data (voltages, currents, active power, and reactive power) at POI.
- Resiliency
- Intentional islanding: Islanding operation plans for particular outages;
- Frequency control: Uninterruptable power supply function for the critical load (intelligent load shedding).
For the functional analysis of microgrids describing the functions of an MMS, the secondary and tertiary control level functions are considered here. Figure 4 presents the microgrid control functions and functionalities based mainly on [3,6,8,31,41,42]. The description of the functionalities may vary because a microgrid design has no set of constraints on network topology or system configuration, demand, and generation resources. However, Figure 4 highlights the fact that an MMS consists of different systems, coordinates between them, and the operation mode can be set up based on the optimization interest. The functions are presented between the control hierarchy levels and the control system architecture layers. It can be noticed that the functions of an MMS do not extend to the internal control of the primary equipment.
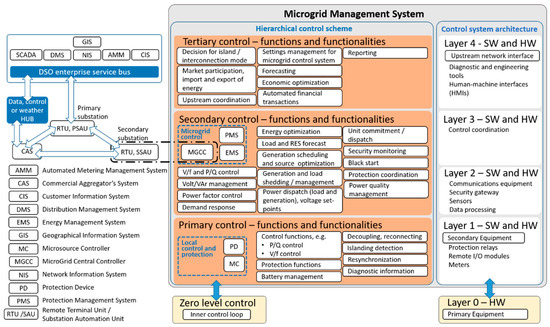
Figure 4.
The functions of a microgrid management system.
The development of the MMS is complex, involving various systems to be merged for operation according to defined goals. Therefore, an MMS, which may consist of systems from different vendors, needs to address several objectives in a coordinated manner. Hence, the operational or behavioral descriptions of the system with the various levels of use cases are vital for implementing and testing the total system operation and the functionalities. Furthermore, for developing new intelligent concepts for microgrids as well as implementing the microgrid concept in a particular or special application, the use cases are essential.
4.2. Use Case Modelling and High-Level Use Cases
Use case (UC) methodology supports the engineering process for complex systems and standardization [43]. UCs describe the system and its functionalities to be developed. The system can be described by static or dynamic presentations, in which static presentations describe the actors’ relations to the system (for example, by class diagrams). In contrast, dynamic presentations or behavioral diagrams illustrate the relationship or interaction between actors (for example, use case diagrams or activity diagrams). The UC descriptions can vary in the level of the abstraction and the scope of the design. The building of UCs can be made from top-down or bottom-up approaches [44].
Visualization of different smart grid UCs in the architectural viewpoint is possible with the framework and methodology of the Smart Grid Architecture Model (SGAM), which is neutral regarding the solution and technology. The three-dimensional SGAM framework is presented in Figure 5a. The domains describe the complete chain of electrical energy. The zones describe the hierarchical layers of power system management. The interoperability layers represent the interoperability of any two components of the smart grid, that is, the interoperability needs to be considered on five different interoperability layers [45].
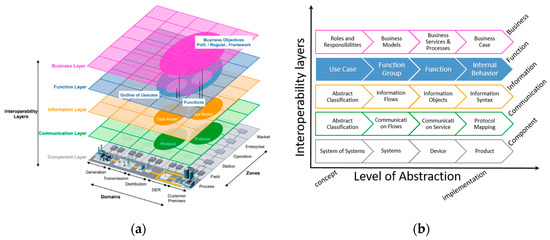
Figure 5.
Smart grid architecture model (SGAM) and the levels of abstraction: (a) SGAM framework [45]; (b) exemplary categorization of different abstraction levels per SGAM layer. Adapted from [46].
The smart grid systems cover all five SGAM interoperability layers, in which the function layer hosts functional architectures. Consequently, different systems have specific content in the functional architecture viewpoint. UCs represent certain operational scenarios in which the smart grid functions are performed. From a functional point of view, a function represents a logical entity that performs a dedicated function; consequently, a function group is a logical aggregation of one or more functions. For example, the substation automation function group can be divided into protection, control, monitoring, and data acquisition, which can be further decomposed into other subdivisions. The aim is to define the basic functions that can be utilized as building blocks for complex systems, which make possible the study and comparison of different functional setups [45].
For each interoperability layer, abstraction levels can be defined, as illustrated in Figure 5b. This paper focuses on the function layer that describes UCs, functions, and services of the system, including their relationships from an architectural viewpoint. The abstraction levels defined in [46] are utilized to describe the meanings of different levels of functions, as presented in Figure 5b.
Several ways and a methodology were previously introduced, and they are applicable for determining the functions of microgrids. However, it is the manner of the UC “level”, that is, the conceptual description, the use case concept or user stories, that provides an overview of the system or background for a cluster of use cases with appropriate accuracy. Therefore, the different levels of use cases are defined.
The use cases can be developed on several levels and for several purposes [47]. The general idea of a function together with generic actors is described by a high-level use case (HL-UC). The HL-UC can be implemented by various ways, so it cannot be mapped to a particular system or architecture. Furthermore, a use case implemented on a specific system, characterized by a defined boundary, is defined by a primary use case (PUC). A PUC can be mapped on a defined architecture. Mapping is used to break down the higher-level abstract use case into one or more implementation possibilities, namely specializations. The PUCs can be mapped to the SGAM. Next, secondary use cases (SUCs) are used for describing key functionalities used by multiple PUCs (for example, dispatch or transition) [48].
The principal or conceptual functions of an MMS can be described with HL-UCs, which represent the scenarios that the investigated system (microgrid) has to perform with the involving actors. Figure 6 presents the HL-UC diagram of an MMS, which is based on the functions present in Figure 3. Protection and energy management functions are highlighted, as they can illustrate EMS and PMS. Additionally, three PUCs are shown: demand response (DR), reactive power window (RPW) control as well as overcurrent (OC) protection.
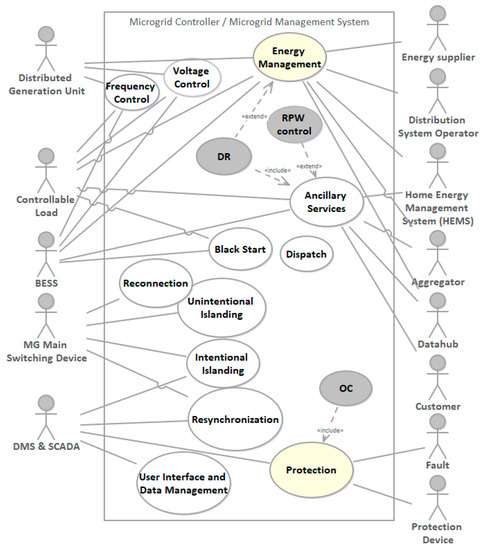
Figure 6.
The high-level use cases of a microgrid management system.
Different levels of behavioral diagrams are developed in the next sections by the exemplary UC studies of the Sundom Smart Grid (SSG), in Vaasa, Finland. For the description of MMS for the SSG, the following levels of use cases are applied: (i) conceptual description, (ii) high-level use cases, (iii) primary, (iv) secondary, and (v) test use cases. Conceptual descriptions are described in Section 2 (definition and applications) and the HL-UCs are presented in Section 3.3. and in Figure 3. The SUCs, dispatch, and transition are described in Section 3.1.
In Section 5, two PUCs will be developed in order to apply the microgrid concept, and the microgrid control functions into a particular application. The PUCs are selected based on the functions operated by two defined subsystems: the MEMS and the protection management system (PMS). The PUCs are demand response (DR) for ancillary services (AS), and overcurrent protection, developed for the SSG.
Furthermore, in Section 6, three test use cases (TUCs) will be developed for the SSG that consists of the developed real-time simulation test scenarios with software in the loop (SIL) or HIL capabilities. The TUCs are based on the developed PUCs. The first two are the demand response for ancillary services TUC and the RPW control for technical ancillary services TUC, and the third is the fault F1 at the transformer terminal TUC. Figure 7 presents the different levels of the developed UCs.
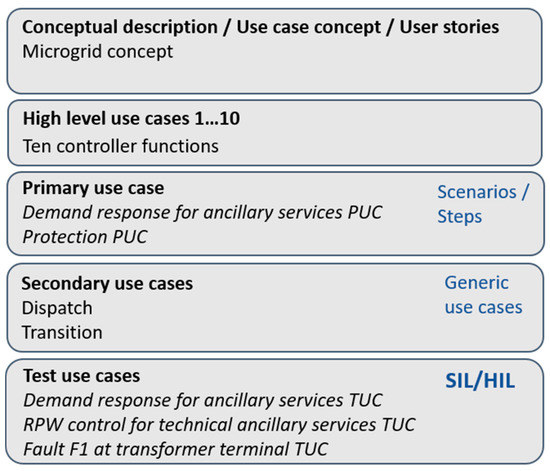
Figure 7.
The applied use cases.
5. Demand Response and Protection Primary Use Cases for the Sundom Smart Grid
The SSG is a living lab established in a medium voltage (MV) network in Vaasa, Finland. There are four MV feeders and an additional feeder for the wind turbine (WT) only. Modern IEDs with fiber-optic connections are installed in the primary substation and four secondary substations. The IEC 61,850 sampled values (SV) and the generic object-oriented substation event message (GOOSE) measurements from the network at 20 points are collected in a cloud service. The SSG is connected with a direct communication link and the data collection facilities to the University of Vaasa’s Future, Reliable, Electricity and Energy Systems Integration (FREESI) laboratory. Figure 8 presents the single line diagram of the simplified SSG. The microgrid is considered to cover the whole MV grid, and the connection point is at J05.
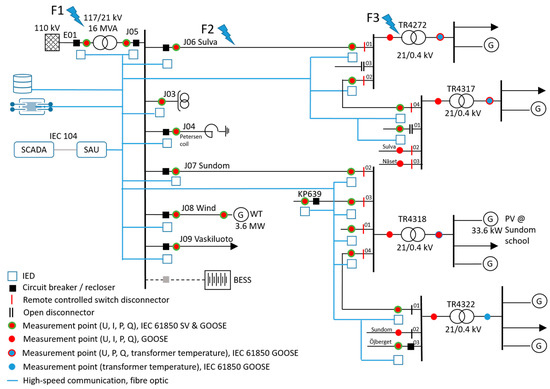
Figure 8.
Single line diagram of the Sundom Smart Grid. Adapted from [49].
5.1. The Demand Response for Ancillary Services PUC
The demand response for ancillary services PUC is associated with energy management as well as ancillary service HL-UCs, as Figure 6 illustrates. Figure 9a presents the activity diagram of the energy management HL-UC, where the path “non-critical load management—external request and separate compensation-based DR” relates to the demand response for ancillary services PUC. The activity diagram is one of the UML behavioral diagrams that present a process or algorithm as a sequence of steps. With the activity diagram, the alternative scenarios can be given, and it is a more sophisticated version of the flowchart diagram. In Figure 9a, energy management is divided into three scenarios, which are aimed for grid-connected operation, islanded operation, and ancillary services. In grid-connected and islanded operation modes, the DER control can be either coordinated or individual.
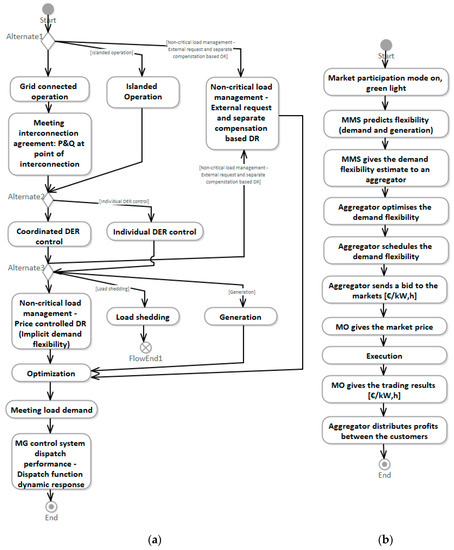
Figure 9.
Microgrid energy management system: (a) activity diagram of the energy management high-level use case (HL-UC); (b) activity diagram of the demand response for ancillary services protection use case (PUC).
Furthermore, the management of DER can be non-critical load management that is price-controlled DR (implicit demand flexibility or tariff controlled) and generation, which are optimized by EMS. Load shedding stabilizes the voltage or angle and supports to maintain the power balance within the microgrid. In more detail, Figure 9b presents the activity diagram of the demand response for ancillary services PUC, and Figure 10, in turn, gives the use case diagram of it.
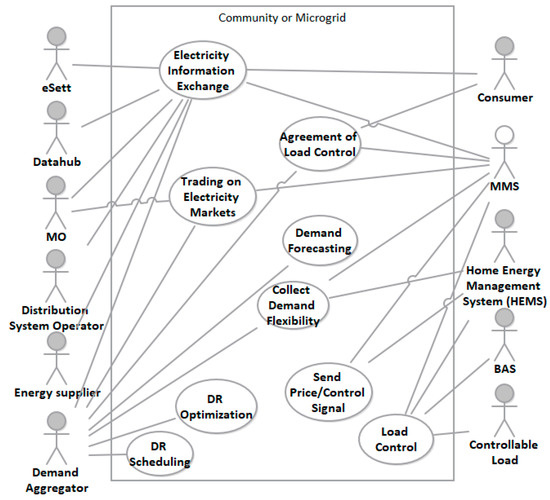
Figure 10.
Use case diagram of the demand response for ancillary services PUCs.
Figure 10 presents the use case of demand response for ancillary services, where the related actors are associated to the following sub-use cases: electricity information exchange, trading on electricity markets, agreement of load control, demand forecasting, collection of demand flexibility, DR optimization, DR scheduling, sending of the price signal, and load control. Moreover, Figure 9b presents the activities within the use case, which are:
- Market participation mode on—green light;
- MMS predicts flexibility (demand and generation);
- MMS gives the demand flexibility estimate to an aggregator;
- Aggregator optimizes the demand flexibility;
- Aggregator schedules the demand flexibility;
- Aggregator sends a bid to the markets (EUR/kW,h);
- Market operator (MO) gives the market price;
- Execution;
- MO gives the trading results (EUR/kW,h);
- Aggregator distributes profits between the customers.
5.2. The Protection PUC
Figure 11a presents the use case diagram of protection PUCs in the SSG. The use cases are fault F1 at the primary transformer, fault F2 at MV feeder, and fault F3 at the secondary transformer. The locations of the faults are presented in Figure 8. Fault F1 describes the situation were a fault happens in the primary transformer protection zone. Fault F2 describes the situations where a fault occurs in the MV feeder protection zone, and fault F3 describes a situation where a fault happens in the secondary transformer zone, that is, in the LV distribution network.
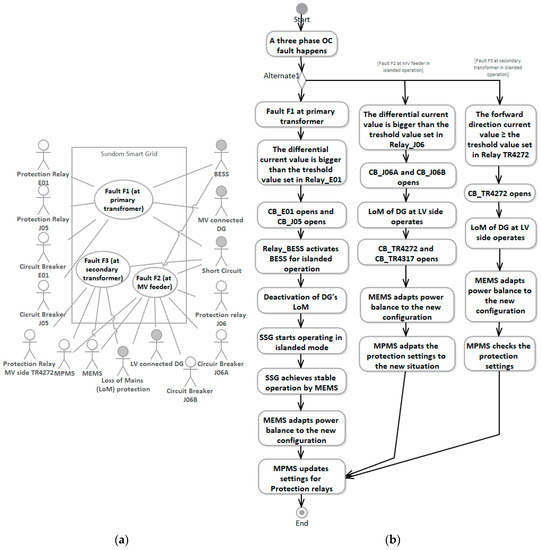
Figure 11.
The protection PUC for the Sundom Smart Grid: (a) use case diagram; (b) activity diagram.
Figure 11b presents the activity diagram of the protection PUC in the overcurrent (OC) protection cases. The cases of the interest are faults F1, F2, and F3, where
- F1 presents OC fault at the primary transformer;
- F2 presents OC fault at MV feeder in the microgrid islanded operation mode;
- F3 presents OC fault at the secondary transformer in the microgrid islanded operation mode.
In the case of F1, differential protection operates, and after that, the battery energy storage system (BESS) is activated for islanded operation, and loss of mains (LoM) protection is deactivated in DGs. The MEMS takes care of stabilizing the islanded operation of the microgrid, adapts the power balance to the new grid configuration, and updates the settings for protection relays. In the case of F2, line differential protection operates, and after that, LoM operates at the LV side. Here, the line differential is used since it provides the required selectivity conveniently in this kind of system. Next, circuit breakers (CBs) open at related secondary transformers. Finally, the MEMS adapts the power balance in the new microgrid configuration, and the microgrid protection management system (MPMS) adapts the protection settings to the new situation. In the case of F3, the directional OC protection operates at the MV terminals of the transformer, and the CB (in the future) at the secondary substation opens. After that, the LoM of DG operates at the LV side, the MEMS adapts power balance to the new grid configuration, and the MPMS checks the protection settings.
6. Demand Response, Reactive Power Control and Protection Test Use Cases for the Sundom Smart Grid
In the following, the TUCs are developed for creating test scenarios for real-time simulation, which aims to conduct SIL or HIL testing of microgrid control functions. The TUCs are generated in different ways, from top-down and bottom-up, as well as based on different functioning time-frames. For the first case, the demand response for ancillary services TUC, a higher-level use case (PUC), was developed and further extended to a TUC and finally a control algorithm in the simulation platform. For the second and the third cases, the reactive power control for technical ancillary services TUC and the overcurrent fault F1 at the transformer terminal TUC the, existing simulation platform, developed models, and case studies were utilized for developing the TUCs. The functioning time-frame differs in the following manner: in the first case, the control can be considered as a grid interactive control or a tertiary control function; in the second case, the control can be considered as a microgrid supervisory control or a secondary control function; the last case can be considered as a device level controller or a primary control function, as well as a secondary control.
6.1. The Demand Response for Ancillary Services TUC
The demand response for ancillary services TUC was developed for the SSG. In this scenario, the DSO operates as a microgrid operator or owner, and there is no contract for load control with customers. The energy company contracts with customers and acts as a retailer aggregator that contributes to the control of electric storage heating and water boilers, which are the most prominent general load types of residential customers.
The customers are divided into three groups: group 1 represent residential customers with electricity use of up to 10,000 kWh per year; group 2 consists of residential customers with annual consumption of over 10,000 kWh; and group 3-type customers represent other residential customers who are not included in group 1 or group 2. The customers with electrically heated houses are included in group 2. The DR program is applied for electric heating of customers in group 2 and the water boilers of customers in group 1 and 2. Additionally, control of the battery for the DR program could be applied to all customers with photovoltaic (PV) units including battery storage, but this is left for future studies. Furthermore, control of PV generation and active power could be utilized for power balance management/renewable energy resources (RES) control.
Figure 12 presents the evaluation of DR potential in the SSG, showing the peak power measurement in 2018 as well as the estimates for years 2020, 2025, and 2030. The values are categorized by demand and by generation, according to feeders J06 Sulva, J07 Sundom, and J09 Vaskiluoto. Additionally, the increasing amount of electric vehicles—harging of them, is considered here. The potential of the DR in water boilers and electric storage heating is presented as a negative load as well as in wind power and an increasing amount of PV generation. It can be noticed that there is potential for executing DR programs in the SSG.
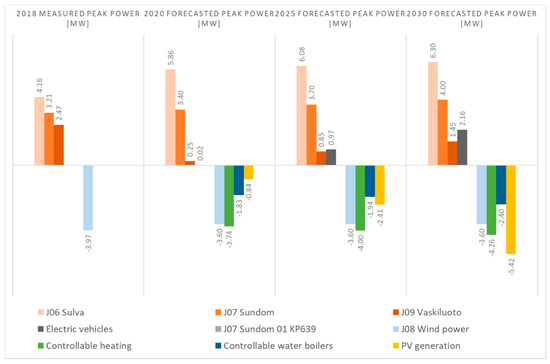
Figure 12.
Peak power, the potential of demand response, and the estimation of distributed generation in the Sundom Smart Grid.
The DR program is executed according to the load control agreement between an aggregator and customers. The aggregator submits a bid to the MO based on criteria agreed with the customers. In this case, the criteria or measures include the level of the spot electricity price forecast and the temperature forecast. The spot price level has to be over 4 cents/kWh (the DR program will be permitted), and the temperature has to be below 5 °C (the limit where the heating is generally activated, that is, there exist controllable loads), in order to execute the DR program. Figure 13 presents the operation of the developed control or the “flowchart” for the simulation model development as aforementioned by the activity diagram of the developed TUC. The activity diagram presents the control signal generation based on the measurements that mimic temperature and price forecasts.
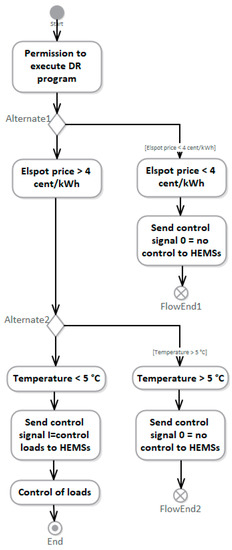
Figure 13.
Demand response in the Sundom Smart Grid—activity diagram of the demand response for ancillary services TUC.
Next, the TUC was exploited in the development of a simulation model of the DR controller. A previously developed simulation platform was exploited, which is based on OPAL-RT’s real-time co-simulation platform. The emulated system consists of the power grid simulations in ePHASORSIM and the control algorithm simulations in eMEGASIM in parallel with interactions. This is presented in more detail in [10]. The simulations in this study were carried out with real-time simulation models but in offline mode, which is sufficient to verify the methodology described in this paper. The benefit is that in the future, the developed models can be utilized in the real-time SIL simulations and HIL testing.
The simulation concept for the DR (as well as reactive power control to be presented later) TUC is presented in Figure 14, where the simulated power grid, control algorithms, and a subsystem are present. Active and reactive power inputs are implemented with the PQload subsystems, where Pload expresses the measured power. The data of measured power consist of the hourly average values of the active power of the year 2018. Next, participation factors nG1…nG3, express the share of all customers for generating the loading of a feeder by the customer type groups (group1–group3, as described above). Active power Pwb represents the price-controlled active power from the water boilers. Furthermore, active power from electric storage heating is represented by Ph, which is price-controlled and depends on temperature conditions. The reactive power of the loads Qload was generated with a constant power factor of 0.995ind. Overall, participation in the DR program was set to nDR = 0.3, representing the fact that 30% of potential customers have contracts with the retailer/aggregator.
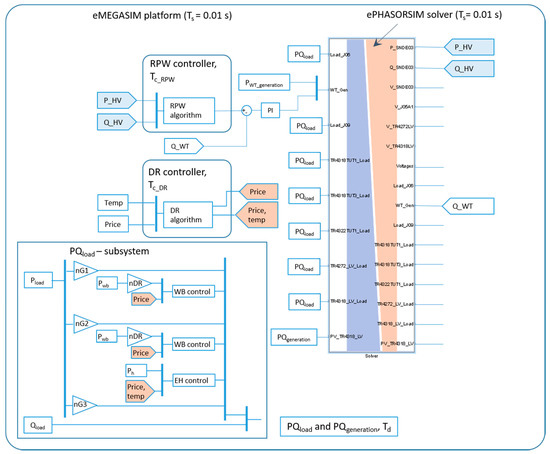
Figure 14.
The simulation architecture for the emulated power system and the controllers.
The simulation was executed for the full year of 2018. The simulation model utilizes the measurement and historical data, which are hourly values of average active power by feeders, time series of temperature, and Elspot electricity prices. Load data are gathered from the measurement database containing real data from the SSG.
Four test cases were developed for power flow calculations in different situations.
- (1)
- No wind generation and no DR control;
- (2)
- No wind generation and DR control applied;
- (3)
- Wind generation from a 3.6 MW turbine considered and no DR control;
- (4)
- Wind generation from a 3.6 MW turbine considered and DR control applied.
Figure 15 shows the active power flow at the HV/MV connection point in the different cases. It can be seen that wind generation produces fluctuation of the active power flow at the HV connection point. Furthermore, by executing price-based DR control, the fluctuation of active power increases.
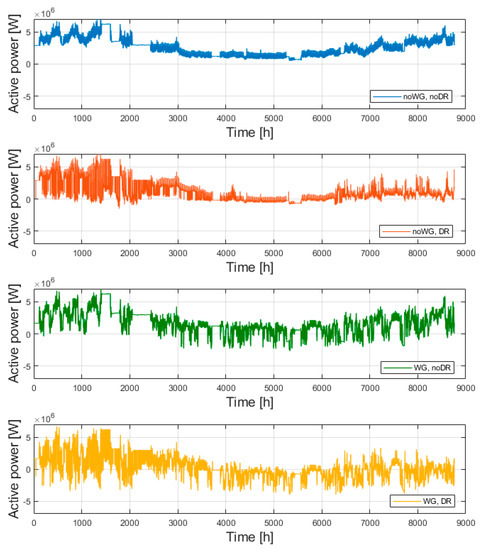
Figure 15.
Demand response in the Sundom Smart Grid—active power flow in the HV/MV connection point in different case studies.
6.2. The Reactive Power Control or the Technical Ancillary Services TUC
The reactive power window (RPW) control for technical ancillary services TUC was developed for the SSG, which presents the management of reactive power at the interconnection point of the microgrid. In this case, the point is the HV/MV connection of the SSG, and the RPW control represents a secondary control function of an MMS. The task of the RPW control is to manage the reactive power flow to stand within the RPW limits defined by the transmission system operator (TSO) [50]. The control is executed through a full-scale wind turbine (WT) converter that is connected to the substation with its feeder J08.
The RPW control algorithm, as well as the simulation platform, are developed in previous studies, and they are presented in [10]. Figure 16 shows the developed activity diagram of the RPW control algorithm for the technical ancillary services TUC. Furthermore, the simulation architecture where the controller is functioning is presented in Figure 14.
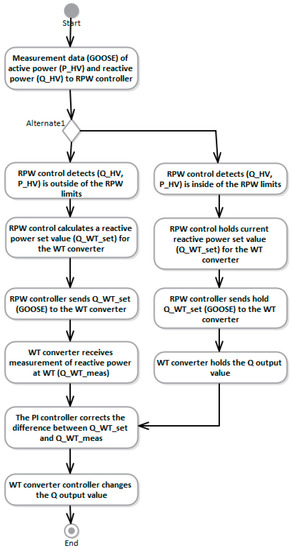
Figure 16.
Reactive power control in the Sundom Smart Grid—activity diagram of RPW control for the technical ancillary services TUC.
Six test cases were developed for power flow calculations in different situations:
- (1)
- No wind generation, no DR control, and no RPW control;
- (2)
- No wind generation, DR control applied, and no RPW control;
- (3)
- Wind generation from a 3.6 MW turbine considered, DR control applied, and no RPW control;
- (4)
- Wind generation considered, no RPW control, and DR control applied;
- (5)
- Wind generation considered, RPW control applied, and no DR control;
- (6)
- Wind generation considered, RPW control applied, and DR control applied.
Figure 17 shows the results of the reactive power flow at the HV/MV connection point in different case studies. The first figure at the top describes case 1 (case 1 also in DR). When comparing it to Figure 15, it can be noticed that the reactive power flow curve follows the curve of the active power flow. The second figure, case 2, describes the situation that is the same as case 2 in DR. It can be noticed that executing the DR program causes fluctuations in the reactive power flow similar to active power. The third figure, case 3, is the same as case 3 in DR. In this case, the curve of the reactive power flow does not follow the shape of active power. This can be explained by the fact that the WT is connected via a short connection directly to the MV bus at the primary substation and, therefore, the line does not generate reactive power to a great extent. In the fourth figure, case 4 (the same as case 4 in DR), the shape of the reactive power flow curve differs from the active power flow because of the changes in the active power generation of the WT as well as because of DR. The generation is near the substation, but the demand is happening in “customer premises” via long connections. The cabling affects the amount of reactive power generation (capacitive). In this study (the year 2018), the cabling degree (the share of the length of the underground cables in the network) is 31%. The next two figures present the results of case 5 and case 6. Reactive power control is executed in these cases, and it can be noticed that executing DR generates fluctuations in the reactive power flow.
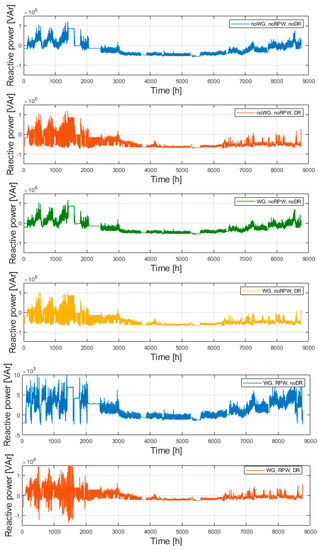
Figure 17.
Reactive power control in the Sundom Smart Grid—reactive power flow at the HV/MV connection point in different case studies.
Based on these results, it can be stated that for the reactive power flow at the HV/MV in the SSG connection point: (i) the effect of wind generation is negligible, (ii) the effect of DR control is notable, (iii) the effect of RPW control is remarkable, and (iv) the effect of DR and RPW control in parallel is noteworthy. These phenomena can be explained based on the characteristics of the studied distribution network. The less cables loaded, the more reactive power produced by the cables. The wind turbine is connected to the MV bus by a short cable. All the loads are modelled as constant power types, but in reality, the loads in the SSG are also voltage-dependent (constant current or constant impedance) in addition to constant power types. Hence, the controlled loads are resistive and thus of constant power type, not consuming reactive power. The effect of DR on the reactive power flow is noted for the cables increasing the reactive power generation.
6.3. The Overcurrent Fault F1 at Transformer Terminal TUC
The OC fault F1 at the transformer terminal TUC is associated with the fault F1 at the primary transformer PUC as well as the protection HL-UC and the unintentional islanding HL-UC. The OC fault F1 at the transformer terminal TUC relates to the path fault F1 as illustrated in Figure 11b. In this case or path, the transformer protection is implemented by the circuit breakers (CBs) operated by the protection relays. According to Figure 8, for the protection of the primary transformer, there is a protection device (PD) that is located at the bay E01.
In this TUC, the transformer protection is implemented at the primary side protection relay IED-E01, which operates the CB at E01 and is connected to the secondary side relay IED-J05, as shown in Figure 18. The secondary side relay IED-J05 is a part of the MV busbar protection and also operates the POI of this microgrid (CB J05). The function of the PD1 is to isolate the primary substation from the utility grid during the line fault conditions. The PD2 (LBS + IED-J05) is located on the secondary side of the transformer. Figure 18 shows the single line diagram for the overcurrent fault F1 at the transformer primary side terminal. Figure 18 is drawn based on Figure 8 to include only the related devices involved in fault F1 to understand how they interact with each other in this fault case. As indicated in Figure 18, the differential protection function is used as the main 1 protection and definite time overcurrent protection function is used as the main 2 protection at IED-E01, IED-J05 and IED-J06, which receive local sampled value (SV) measurements (SV Local) available at these locations. The remote SV measurements (SV Remote) of other bays in the substation can be subscribed by these IEDs using the Ethernet-based high speed communication network, station bus 1. The local and remote SV measurements are used for the detection of the fault by the main 1 and main 2 protections, and GOOSE messages are published and subscribed to indicate and determine whether a fault exists on the remote end.
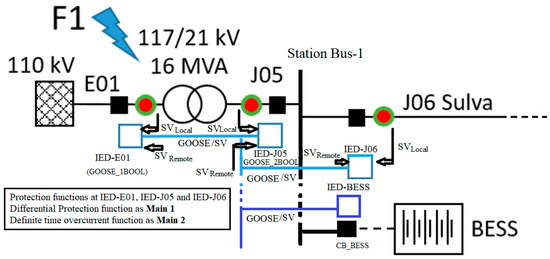
Figure 18.
Single line diagram of the overcurrent fault F1 at the transformer terminal TUC (based on Figure 8).
The activity diagram of the OC fault F1 at the transformer terminal TUC is presented in Figure 19, which is developed based on the IEC 61,850 GOOSE communication-based definite time overcurrent relay case studies conducted in [51]. The main difference between the network presented in [51] and the SSG (Figure 8 and Figure 18) is that in the SSG, there is also differential protection functioning as the main 1 protection and the definite time overcurrent protection function as the main 2 protection for the transformer, whereas in [51], there is only an overhead line protected by a definite time overcurrent protection function.
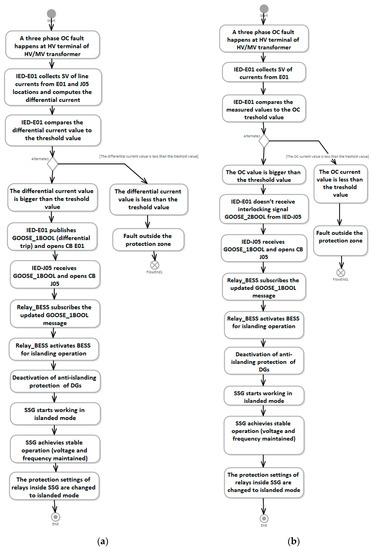
Figure 19.
Activity diagram of the overcurrent fault F1 at the transformer terminal TUC: (a) main 1 protection; (b) main 2 protection.
In Figure 19, it is assumed that the IED-E01 detects the fault F1 either with its main 1 differential protection function (a) or main 2 definite time overcurrent (b). If the fault is detected by the differential protection function, IED-E01 publishes the fault detection GOOSE message “GOOSE_1BOOL” (transfer trip of the POI) and sends the tripping command to CB E01. After receiving the GOOSE_1BOOL message, IED-J05 sends the tripping command to CB J05. Alternatively, the fault F1 is detected by the main 2 definite time overcurrent function of IED-E01. Here the reverse interlocking scheme can be applied, so that if IED-J05 detects a fault at the MV busbar, it publishes the GOOSE message “GOOSE_2BOOL” (interlocking signal). In the fault F1, IED-E01 detects the overcurrent and receives no GOOSE_2BOOL message, which also results in the tripping of CB E01 and a transfer trip command “GOOSE_1BOOL” is sent to IED J05. Additionally, the IED-BESS receives the GOOSE_1BOOL from the IED-E01 and activates/connects the BESS rapidly so that it can act as the grid-forming source for the islanded part of the SSG without the disconnection of DGs. In this fault case, the fault is removed completely after the tripping of CB J05, and smooth transition to the islanded mode can be ensured without the disconnection of DGs. Moreover, the anti-islanding protections at the DGs need to be deactivated until a stable islanded mode operation is reached. After reaching a stable islanded mode operation with voltage and frequency maintained in the islanded section, the anti-islanding protections of DGs are reactivated, and the protection settings of IEDs are changed to the settings suitable for the fault detection in the islanded mode. In this use case, the BESS is assumed to be normally disconnected in the grid-connected mode, and it is activated only during the islanded mode of operation.
In this paper, only the potential methodology is discussed for the overcurrent fault F1 at the primary terminal of the transformer based on the previous work conducted in [51]. The use case will be further evaluated for its practical implementation into case studies, and the results will be presented in future research papers. A real-time simulation model of the SSG model will be created using Matlab/Simulink, implementing the IEC 61,850 standard based GOOSE and SV messages in order to evaluate the performance of the proposed protection scheme.
7. Conclusions
This paper introduced several microgrid management functions based on the current standardization and research. Based on these, the functionalities of microgrids were aligned not only to the control scheme hierarchy that includes three known control levels: primary, secondary, and tertiary, but also to zero control levels. In addition, a control architecture, including four control layers, was presented. Two specific separate systems were identified, namely, the energy management system and the protection system.
The microgrid management system is a system of systems, and therefore this paper focuses on defining the functions of the microgrids regardless of the practical solution. Moving from an abstract level or microgrid concept and going closer to practice, the utilization of use case modelling was presented. With reference to the depth and different levels of use cases, the relation of functionality between the concept and a single case study of the microgrid management system was highlighted.
In order to apply a microgrid concept as a management system in a real-world case, we propose that higher-level use cases and primary use cases should be clarified and only the particular requirements of the network in question should be deployed. In this paper, general microgrid functions were presented as HL-UCs. Further selected PUCs were developed for a real distribution network (the SSG), and finally dedicated TUCs, which rely on the real measurement data. Finally, various sets of simulation case studies were aligned with the developed TUCs. The simulation cases were developed for real-time SIL and controller hardware-in-the-loop (CHIL) simulations, and they function on different time frames. The AS use cases were tested in co-simulation setup with one-year measurement data, whereas the protection use case was tested in the EMT platform.
The description of the proper level of use cases becomes extremely important when applying several microgrid functionalities that can affect each other; for example, as shown in this paper, ancillary services where the active power, as well as reactive power, are controlled at the same time.
Because the end customer plays a crucial role in most of the microgrids, the management system is formed from different subsystems considering the aims of operation and goals. In order to recognize and realize the different levels of functions that can affect each other, a methodology for expressing the functions of the system like those in this paper is essential; for example, one that considers a residential customer, who owns the inverter-connected generation and controllable loads and wants to participate in both DR programs and reactive power management.
Multiobjective control of microgrids exerts pressure to develop test cases for utilizing a management system in a central, distributed, comprehensive and dedicated manner, as presented in this paper.
This paper presented TUCs for real-time SIL and CHIL simulation, which were selected based on different time frames. In the future, different configurations, with reference to the depth of use cases and time domain analysis, need to be developed in order to examine various microgrid functions running in parallel.
Author Contributions
Conceptualization, K.S.; methodology, K.S.; software, K.S.; validation, K.S.; formal analysis, K.S., and A.A.M.; investigation, K.S.; resources, K.S.; data curation, K.S.; writing—original draft preparation, K.S.; writing—review and editing, K.K., A.A.M., H.L., and L.K.; visualization, K.S.; supervision, K.K., and H.L.; project administration, L.K., and K.K.; funding acquisition, L.K. All authors have read and agreed to the published version of the manuscript.
Funding
This work was carried out in the VINPOWER project with financial support provided by the European Regional Development Fund (ERDF), Project No. A73094. In addition, this work was carried out in the SolarX research project with financial support provided by the Business Finland, 2019–2021 (grant No. 6844/31/2018).
Acknowledgments
The provision of measurement data by Vaasan Sähköverkko Ltd. is highly appreciated. The data that support the findings of this study are available from the corresponding author upon reasonable request and with permission of Vaasan Sähköverkko Ltd.
Conflicts of Interest
The authors declare no conflict of interest.
References
- Olivares, D.E.; Mehrizi-Sani, A.; Etemadi, A.H.; Cañizares, C.A.; Iravani, R.; Kazerani, M.; Hajimiragha, A.H.; Gomis-Bellmunt, O.; Saeedifard, M.; Palma-Behnke, R.; et al. Trends in Microgrid Control. IEEE Trans. Smart Grid 2014, 5, 1905–1919. [Google Scholar] [CrossRef]
- Meng, L.; Savaghebi, M.; Andrade, F.; Vasquez, J.C.; Guerrero, J.M.; Graells, M. Microgrid central controller development and hierarchical control implementation in the intelligent microgrid lab of Aalborg University. In Proceedings of the IEEE Applied Power Electronics Conference and Exposition (APEC), Charlotte, NC, USA, 15–19 March 2015. [Google Scholar]
- Hatziargyriou, N. Microgrids Architectures and Control; John Wiley & Sons Ltd.: Chichester, UK, 2014. [Google Scholar]
- Manson, S.; Ravikumar, K.G.; Raghupathula, S.K. Microgrid Systems: Design, Control Functions, Modeling, and Field Experience. In Proceedings of the Grid of the Future Symposium, Reston, Virginia, 28–31 October 2018. [Google Scholar]
- Maitra, A.; Microgrid Controller Requirements and Relationship with DMS. Advanced Grid Technologies Workshop Series, NREL, 7–9 July 2015. Available online: https://www.nrel.gov/esif/assets/pdfs/agct_day3_maitra.pdf (accessed on 29 June 2020).
- IEEE. IEEE Standard for the Specification of Microgrid Controllers; IEEE Std 2030.7-2017; IEEE: New York, NY, USA, 2018; pp. 1–43. [Google Scholar] [CrossRef]
- IEEE. IEEE Standard for the Testing of Microgrid Controllers; IEEE Std 2030.8-2018; IEEE: New York, NY, USA, 2018; pp. 1–42. [Google Scholar] [CrossRef]
- IEC. Microgrids—Part 2: Guidelines for Operation; IEC/TS 62898-2; IEC: Geneva, Switzerland, 2018; pp. 1–38. [Google Scholar]
- Liu, G.; Starke, M.R.; Herron, D. Microgrid Controller and Advanced Distribution Management Survey Report; Oak Ridge National Laboratory (ORNL): Oak Ridge, TN, USA, 2016. [Google Scholar]
- Sirviö, K.H.; Mekkanen, M.; Kauhaniemi, K.; Laaksonen, H.; Salo, A.; Castro, F.; Babazadeh, D. Accelerated Real-Time Simulations for Testing a Reactive Power Flow Controller in Long-Term Case Studies. J. Electr. Comput. Eng. 2020, 17. [Google Scholar] [CrossRef]
- IEC. Microgrids—Part 1: Guidelines for Microgrid Projects Planning and Specification; IEC/TS 62898-1; IEC: Geneva, Switzerland, 2017; pp. 1–33. [Google Scholar]
- Caramizaru, A.; Uihlein, A. Energy Communities: An Overview of Energy and Social Innovation; European Union: Luxemburg, 2020; Available online: https://publications.jrc.ec.europa.eu/repository/bitstream/JRC119433/energy_communities_report_final.pdf (accessed on 29 June 2020).
- Hazewinkel, M. Encyclopaedia of Mathematics, A-Integral—Coordinates; Springer: New York, NY, USA, 1995. [Google Scholar]
- Guerrero, J.M.; Vasquez, J.C.; Matas, J.; Vicuna, L.G.; Castilla, M. Hierarchical Control of Droop-Controlled AC and DC Microgrids—A General Approach Toward Standardization. IEEE Trans. Ind. Electron. 2011, 58, 158–172. [Google Scholar] [CrossRef]
- Rokrok, E.; Shafie-khah, M.; Catalão, J.P. Review of primary voltage and frequency control methods for inverter-based islanded microgrids with distributed generation. Renew. Sustain. Energy Rev. 2018, 82, 3225–3235. [Google Scholar] [CrossRef]
- Meng, L.; Sanseverino, E.R.; Luna, A.; Dragicevic, T.; Vasquez, J.C.; Guerrero, J.M. Microgrid supervisory controllers and energy management systems: A literature review. Renew. Sustain. Energy Rev. 2016, 60, 1263–1273. [Google Scholar] [CrossRef]
- Zhao, H.; Hong, M.; Lin, W.; Loparo, K.A. Voltage and Frequency Regulation of Microgrid with Battery Energy Storage Systems. IEEE Trans. Smart Grid 2019, 101, 414–424. [Google Scholar] [CrossRef]
- Nutkani, I.U.; Peng, W.; Chiang, L.P.; Blaabjerg, F. Secondary Droop for Frequency and Voltage Restoration in Microgrids. In Proceedings of the 17th European Conference on Power Electronics and Applications [EPE’15 ECCE-Europe), Geneva, Switzerland, 8–10 September 2015; pp. 1–7. [Google Scholar] [CrossRef]
- Guo, F.; Wen, C.; Mao, J.; Song, Y. Distributed Secondary Voltage and Frequency Restoration Control of Droop-Controlled Inverter-Based Microgrids. IEEE Trans. Ind. Electron. 2015, 627, 4355–4364. [Google Scholar] [CrossRef]
- Bouzid, A.M.; Sicard, P.; Abourida, S.; Paquin, J. Secondary Voltage and Frequency Restoration Control of Droop-Controlled Inverter-Based Microgrids. In Proceedings of the 9th IEEE-GCC Conference and Exhibition (GCCCE), Manama, Bahrain, 8–11 May 2017; pp. 1–6. [Google Scholar] [CrossRef]
- Savaghebi, M.; Jalilian, A.; Vasquez, J.C.; Guerrero, J.M. Autonomous Voltage Unbalance Compensation in an Islanded Droop-Controlled Microgrid. IEEE Trans. Ind. Electron. 2013, 604, 1390–1402. [Google Scholar] [CrossRef]
- Mousazadeh Mousavi, S.Y.; Jalilian, S.Y.; Savaghebi, M.; Guerrero, J.M. Flexible Compensation of Voltage and Current Unbalance and Harmonics in Microgrids. Energies 2017, 10, 1568. [Google Scholar] [CrossRef]
- Vandoorn, T.L.; De Kooning, J.D.; Meersman, B.; Vandevelde, L. Communication-based secondary control in microgrids with voltage-based droop control. In Proceedings of the PES T&D, Orlando, FL, USA, 7–10 May 2012. [Google Scholar] [CrossRef]
- Majzoobi, A.; Khodaei, A. Application of microgrids in providing ancillary services to the utility grid. Energy 2017, 123, 555–563. [Google Scholar] [CrossRef]
- Meng, L.; Tang, F.; Savaghebi, M.; Vasquez, J.C.; Guerrero, J.M. Tertiary Control of Voltage Unbalance Compensation for Optimal Power Quality in Islanded Microgrids. IEEE Trans. Energy Convers. 2014, 294, 802–815. [Google Scholar] [CrossRef]
- Saleh, M.S.; Althaibani, A.; Esa, Y.; Mhandi, Y.; Mohamed, A.A. Impact of Clustering Microgrids on Their Stability and Resilience during Blackouts. In Proceedings of the 2015 International Conference on Smart Grid and Clean Energy Technologies (ICSGCE), Offenburg, Germany, 20–23 October 2015; pp. 195–200. [Google Scholar] [CrossRef]
- Palizban, O.; Kauhaniemi, K.; Guerrero, J.M. Microgrids in Active Network Management—Part I: Hierarchical Control, Energy Storage, Virtual Power Plants, and Market Participation. Renew. Sustain. Energy Rev. 2014, 36, 428–439. [Google Scholar] [CrossRef]
- Palizban, O.; Kauhaniemi, K. Microgrid control principles in island mode operation. In Proceedings of the IEEE Powertech Conference, Grenoble, France, 16–20 June 2013; pp. 1–6. [Google Scholar] [CrossRef]
- Guerrero, J.M.; Chandorkar, M.; Lee, T.; Loh, P. Advanced Control Architectures for Intelligent Microgrids—Part I: Decentralized and Hierarchical Control. IEEE Trans. Ind. Electron. 2013, 604, 1254–1262. [Google Scholar] [CrossRef]
- Stadler, M.; Mashayekh, S.; Narayanan, S.; Deforest, N.; Brandt, T.; Berkeley, L. Supervisory Controller for PV and Storage Microgrids; Technical Report; Lawrence Berkeley National Laboratory: Berkeley, CA, USA, 2015. [Google Scholar]
- Xu, Y.; Liu, G.; Reilly, J. ORNL microgrid use cases. In Use Case Repository; EPRI: Palo Alto, CA, USA, 2014; Available online: http://smartgrid.epri.com/Repository/Repository.aspx (accessed on 29 June 2020).
- Bower, W.; Ton, D.; Guttromson, R.; Glover, S.; Stamp, J.; Bhatnagar, C.; Reilly, J. The Advanced Microgrid Integration and Interoperability; Technical Report; Sandia National Laboratories: Albuquerque, NM, USA; Livermoore, CA, USA, 2014. Available online: https://www.energy.gov/sites/prod/files/2014/12/f19/AdvancedMicrogrid_Integration-Interoperability_March2014.pdf (accessed on 29 June 2020).
- Reilly, J.; Hefner, A.; Marchioni, B.; Joos, G. Microgrid Controller Standardization—Approach, Benefits and Implementation. In Proceedings of the CIGRE Grid of the Future Symposium, Cleveland, OH, USA, 24 October 2017; Available online: https://cigre-usnc.org/wp-content/uploads/2017/10/1_REILLY_GOTF_Cleveland_Oct-24-2017.pdf (accessed on 29 June 2020).
- Zia, M.F.; Elbouchikhi, E.; Benbouzid, M. Microgrids energy management systems: A critical review on methods, solutions, and prospects. Appl. Energy 2018, 22215, 1033–1055. [Google Scholar] [CrossRef]
- Kanchev, H.; Lu, D.; Colas, F.; Lazarov, V.; Francois, B. Energy Management and Operational Planning of a Microgrid with a PV-Based Active Generator for Smart Grid Applications. IEEE Trans. Ind. Electron. 2011, 5810, 4583–4592. [Google Scholar] [CrossRef]
- Laaksonen, H. Technical Solutions for Low-Voltage Microgrid Concept. Ph.D. Thesis, University of Vaasa, Vaasa, Finland, 2011. [Google Scholar]
- Beheshtaein, S.; Cuzner, R.; Savaghebi, M.; Guerrero, J.M. Review on microgrids protection. IET Gener. Transm. Distrib. 2019, 136, 743–759. [Google Scholar] [CrossRef]
- Memon, A.A.; Kauhaniemi, K. A critical review of AC Microgrid protection issues and available solutions. Electr. Power Syst. Res. 2015, 129, 23–31. [Google Scholar] [CrossRef]
- Hosseini, S.A.; Abyaneh, H.A.; Sadeghi, S.H.; Razavi, F.; Nasiri, A. An overview of microgrid protection methods and the factors involved. Renew. Sustain. Energy Rev. 2016, 64, 174–186. [Google Scholar] [CrossRef]
- Kang, N.; Wang, J.; Singh, R.; Lu, X. Interconnection, Integration, and Interactive Impact Analysis of Microgrids and Distribution Systems; Technical Report; Argonne National Laboratory U.S. Department of Energy: Oak Ridge, TN, USA, 2017. Available online: https://publications.anl.gov/anlpubs/2017/03/134097.pdf (accessed on 29 June 2020).
- Chowdhury, S.; Chowdhury, S.P.; Crossley, P. Microgrids and Active Distribution Networks; Institution of Engineering and Technology (IET): London, UK, 2009. [Google Scholar]
- Repo, S.; Ponci, F.; Giustina, D.D.; Alvarez, A.; Garcia, C.C.; Al-Jassim, Z.; Amaris, H.; Kulmala, A. The IDE4L Project: Defining, Designing, and Demonstrating the Ideal Grid for All. IEEE Power Energy Mag. 2017, 153, 41–51. [Google Scholar] [CrossRef]
- European Commission. M/490 Smart Grid Mandate Standardization Mandate to European Standardisation Organisations (ESOs) to Support European Smart Grid Deployment; European Commission: Brussels, Belgium, 2011. [Google Scholar]
- Gottschalk, M.; Uslar, M.; Delfs, C. The Use Case and Smart Grid Architecture Model Approach—The IEC 62559-2 Use Case Template and the SGAM Applied in Various Domains; Springer: Cham, Switzerland, 2017. [Google Scholar]
- CEN-CENELEC-ETSI. CEN-CENELEC-ETSI Smart Grid Reference Architecture; Technical Report; CEN-CENELEC-ETSI: Brussels, Belgium, 2012; Available online: https://ec.europa.eu/energy/sites/ener/files/documents/xpert_group1_reference_architecture.pdf (accessed on 29 June 2020).
- CEN-CENELEC-ETSI. CEN-CENELEC-ETSI SGAM User Manual—Applying, Testing & Refining the Smart Grid Architecture Model (SGAM); Technical Report; CEN-CENELEC-ETSI: Brussels, Belgium, 2014; Available online: ftp://ftp.cencenelec.eu/EN/EuropeanStandardization/HotTopics/SmartGrids/SGCG_Methodology_ SGAMUserManual.pdf (accessed on 29 June 2020).
- CEN-CENELEC-ETSI. CEN-CENELEC-ETSI Sustainable Processes; Technical Report; CEN-CENELEC-ETSI: Brussels, Belgium, 2012; Available online: https://ec.europa.eu/energy/sites/ener/files/documents/xpert_group1_sustainable_processes.pdf (accessed on 29 June 2020).
- CEN-CENELEC-ETSI. CEN-CENELEC-ETSI Overview of SG-CG Methodologies; Technical Report; CEN-CENELEC-ETSI: Brussels, Belgium, 2014; Available online: ftp://ftp.cencenelec.eu/EN/EuropeanStandardization/HotTopics/SmartGrids/SGCG_Methodology_Overview.pdf (accessed on 29 June 2020).
- Laaksonen, H.; Hovila, P. Flexzone concept to enable resilient distribution grids—Possibilities in Sundom Smart Grid. In Proceedings of the CIRED Workshop, Helsinki, Finland, 14–15 June 2016. [Google Scholar]
- Sirviö, K.; Mekkanen, M.; Castro, F.; Ansari, S.; Kauhaniemi, K.; Babazadeh, D.; Laaksonen, H. Controller Development for Reactive Power Flow Management Between DSO and TSO Networks. In Proceedings of the IEEE PES Innovative Smart Grid Technologies Europe (ISGT-Europe), Bucharest, Romania, 25–28 October 2019. [Google Scholar]
- Memon, A.A. AC Microgrid Functions Using IEC 61850 Communication: Simulations (Offline/Real-Time) and Lab Demonstration. Presentation. 2020. Available online: https://www.univaasa.fi/fi/sites/vinpowertyopajat/tulosaineisto/presentaatiot/t2_2_slides_memon_ac_microgrid_functions_using_iec_61850_communication.pdf (accessed on 29 June 2020).


© 2020 by the authors. Licensee MDPI, Basel, Switzerland. This article is an open access article distributed under the terms and conditions of the Creative Commons Attribution (CC BY) license (http://creativecommons.org/licenses/by/4.0/).