1. Introduction
Electrical power supply has been historically dominated by conventional power plants with directly coupled synchronous generators. However, due to recent environmental concerns, there is a strong motivation to accelerate the decommissioning of conventional plants (particularly most fossil fuel-fired power plants) and their replacement by renewable power generation. As of this writing, the European Union has set a “20-20-20” target plan, which aims to achieve a 20% reduction in greenhouse gas emissions compared to 1990 levels. Such reduction can theoretically be achieved by reaching 20% of the share from a renewable power plant, as well as a 20% increase in energy efficiency by 2020 [
1]. A more significant increase of the share of renewable power generation impacts the overall system stability of electrical power systems. These impacts are due to a change of the dynamics’ properties of the power system, e.g., low and variable system inertia [
2,
3]. Transient stability (i.e., the ability of the synchronous generators of the system to keep synchronism after being subjected to large-size disturbances) is one of the main stability concerns when increasing the share of renewable power generation, especially when the target is to reach levels close to or above 50% [
4].
A previous work by the authors of this paper, published in [
5], provides a review of the methods proposed so far in the existing literature to attempt to safeguard the transient stability of systems with shares of renewable power generation up to 50%. Remarkably, [
5] points out that the main challenge is to ensure and reduced the amplitude of the first swing and good damping of the rotor angle oscillations that are excited by large-size disturbances. Therefore, the power–angle modulation (PAM) controller was proposed in [
5] as a feasible mean to properly adjust the post-fault active power response of fully decoupled wind generators (WG) (e.g., WG system type IV). The preliminary research results shown in [
5] suggest that PAM may allow a safe increase (i.e., without causing transient instability) of the share of decoupled wind generation beyond 50%.
The contributions of this paper are threefold. First, the degree of transient stability enhancement that can be achieved in power systems with high shares (beyond 50%) of decoupled wind generation is investigated. Unlike all other related studies of existing literature, it is considered that the outer control loops of the wind generator can work either under the principle of current control [
6], or under the principle of fast local voltage control [
7]. In both cases, PAM is superimposed on the current control loops. Secondly, the investigation of the degree of enhancement takes into account different approaches of tuning of PAM. It considers a simple approach in the form of parametric sensitivity, and also a sophisticated approach in the form of a formal optimization problem. Thirdly, the paper also gives insight on what is a suitable objective function of the optimization problem, which entails the best performance of PAM. The whole investigation is conducted based on a synthetic model of the Great Britain (GB) system.
The reminder of the paper has the following sequence:
Section 2 presents the modelling aspects concerning with the used wind generator models (working under the principles of current control or local voltage control) equipped with PAM, and it also overviews the synthetic model of the GB system.
Section 3 provides an analysis of the transient stability performance that results when tuning PAM via parametric sensitivity.
Section 4 presents the formulation of the optimal tuning of PAM and the analysis of the solutions (for enhancement of the transient stability performance) obtained by applying the mean-variance mapping optimization algorithm (MVMO). A summary of concluding remarks and an outlook for future research is provided in
Section 5.
2. Modelling Aspects of the Case Study
The synthetic model of the GB system, presented in [
8], is chosen as a case study. This model can exhibit transient instability when the share of renewable power generation is above 50%. This section overviews the characteristics of this model as well as the main features of the selected models of wind generator type IV. The whole study is conducted based on root mean square (RMS) simulations in DIgSILENT
TM PowerFactory
® version 2018 SP1, by using a processor Intel
®Core™ i7-8650 CPU with 2.11 GHz.
2.1. Wind Generator Type IV with Current Control
The model of the wind generator with current control is developed based on the generic RMS model described in detail in the IEC 61400-27-1 International Standard for WG type IV [
9]. A schematic of the model used in this paper is highlighted with a green square in
Figure 1a. The core of the model comprises active power (AP), reactive power (RP), and current control loops. The details of the implementation aspects of the model by using the functionalities of DIgSILENT
TM PowerFactory
® can be found in [
6].
The reactive power support under fault conditions is based on a typical fault ride-through (FRT) concept, in which the reactive short-circuit current is provided as a function of the voltage drop at the point of common coupling (PCC), and according to a slope defined by the so-called “k-factor” [
9]. The active power controller is fed by input signals concerning with the measured power and voltage at the PCC, the power reference for the controllers (e.g., 1 pu), and the rotational speed of the generator [
10]. The maximum current capacity (I
max) that the grid side converter can handle is assumed to be 1.1 pu, in line with a theoretical expected overloading capacity for a wind generator type IV [
11,
12].
Figure 1a,b indicate that the PAM controller alters the active current reference of the grid side converter of the wind generator type IV. The PAM controller performs when the FRT function is activated. The PAM controller is implemented as a filter differentiator (i.e., washout filter, with a gain K
w-PAM and a time constant T
w-PAM). As explained in [
5], unlike the similar approach with power system stabilizers applied in synchronous generators, the phase compensators (i.e., lead-lag filters) are not part of the PAM controller. This compensation is obviated due to the assumption of a small phase lag between the active current reference and the active power output of the grid side converter of the wind generator type IV [
5]. The input of the PAM controller attached to a wind generator type IV is the rotor angle deviation between the slack synchronous generator of the system and the synchronous generator that is electrically close to the wind generator. Interested readers can find a detailed description of the working and design principles of the PAM controller in [
5].
2.2. Wind Generator Type IV with Fast Local Voltage Control
The model of wind generator with fast local voltage control (FLVC) is developed based on the RMS model described in [
7,
13]. The core of the model, relevant for transient stability studies, comprises a reactive power–voltage control channel and an active power control channel.
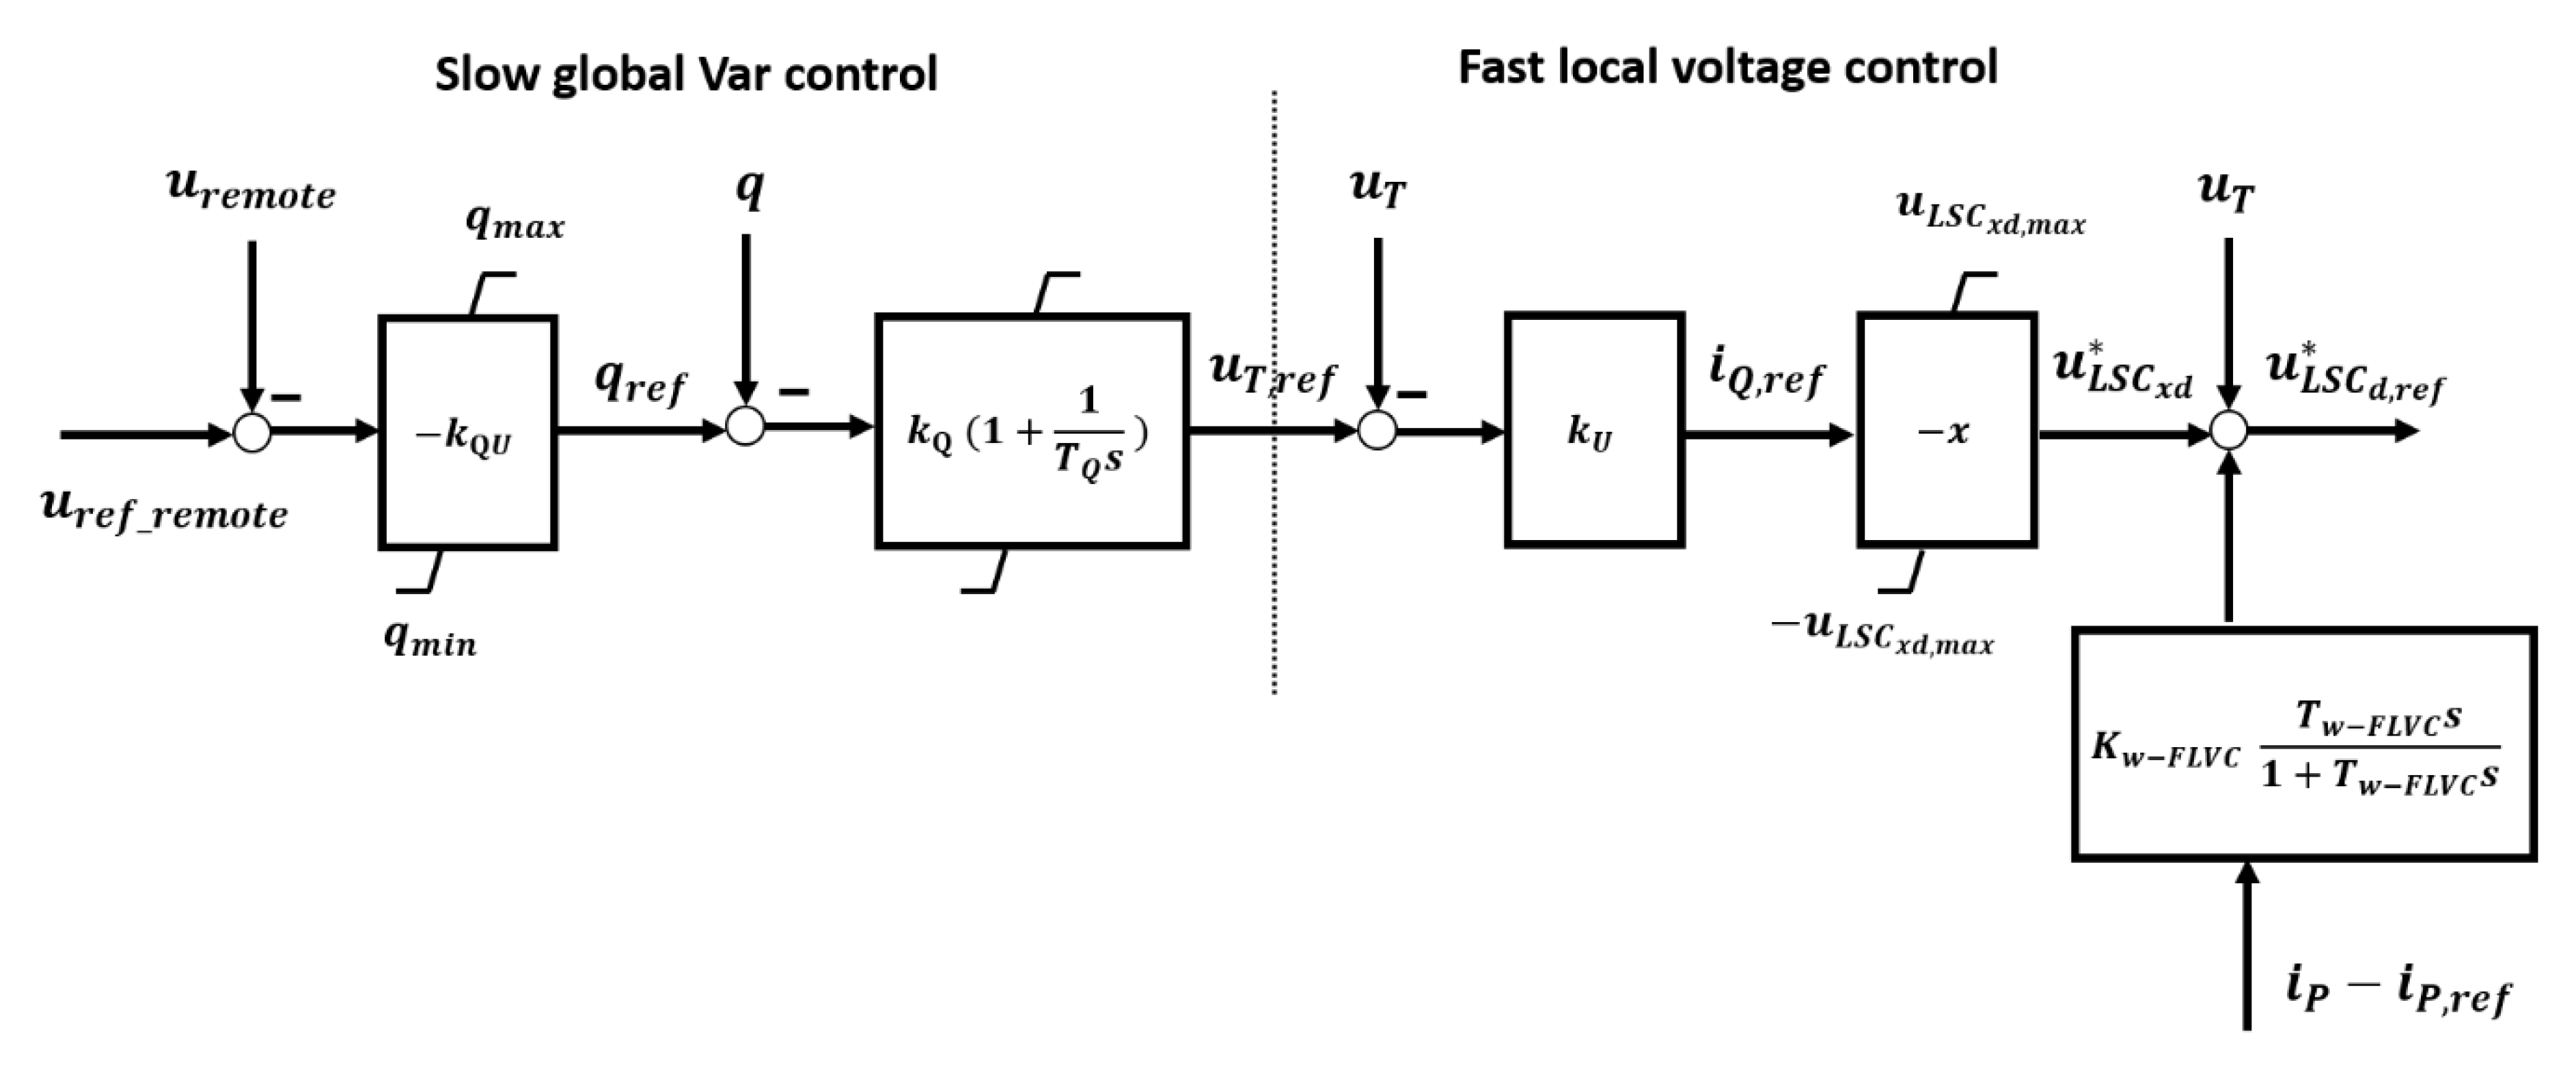
Figure 2 shows the structure of the reactive power–voltage control channel. The left part of the schematic is based on a slow droop controller, which determines the voltage reference at the terminals of the generator, based on a remotely measured voltage. The right part of the schematic concerns with the necessary fast reaction during large disturbances. This reaction is associated with time response (e.g., resembling a fast-exponential decay response) of the washout filter (with a gain K
w-FLVC and a time constant T
w-FLCV).
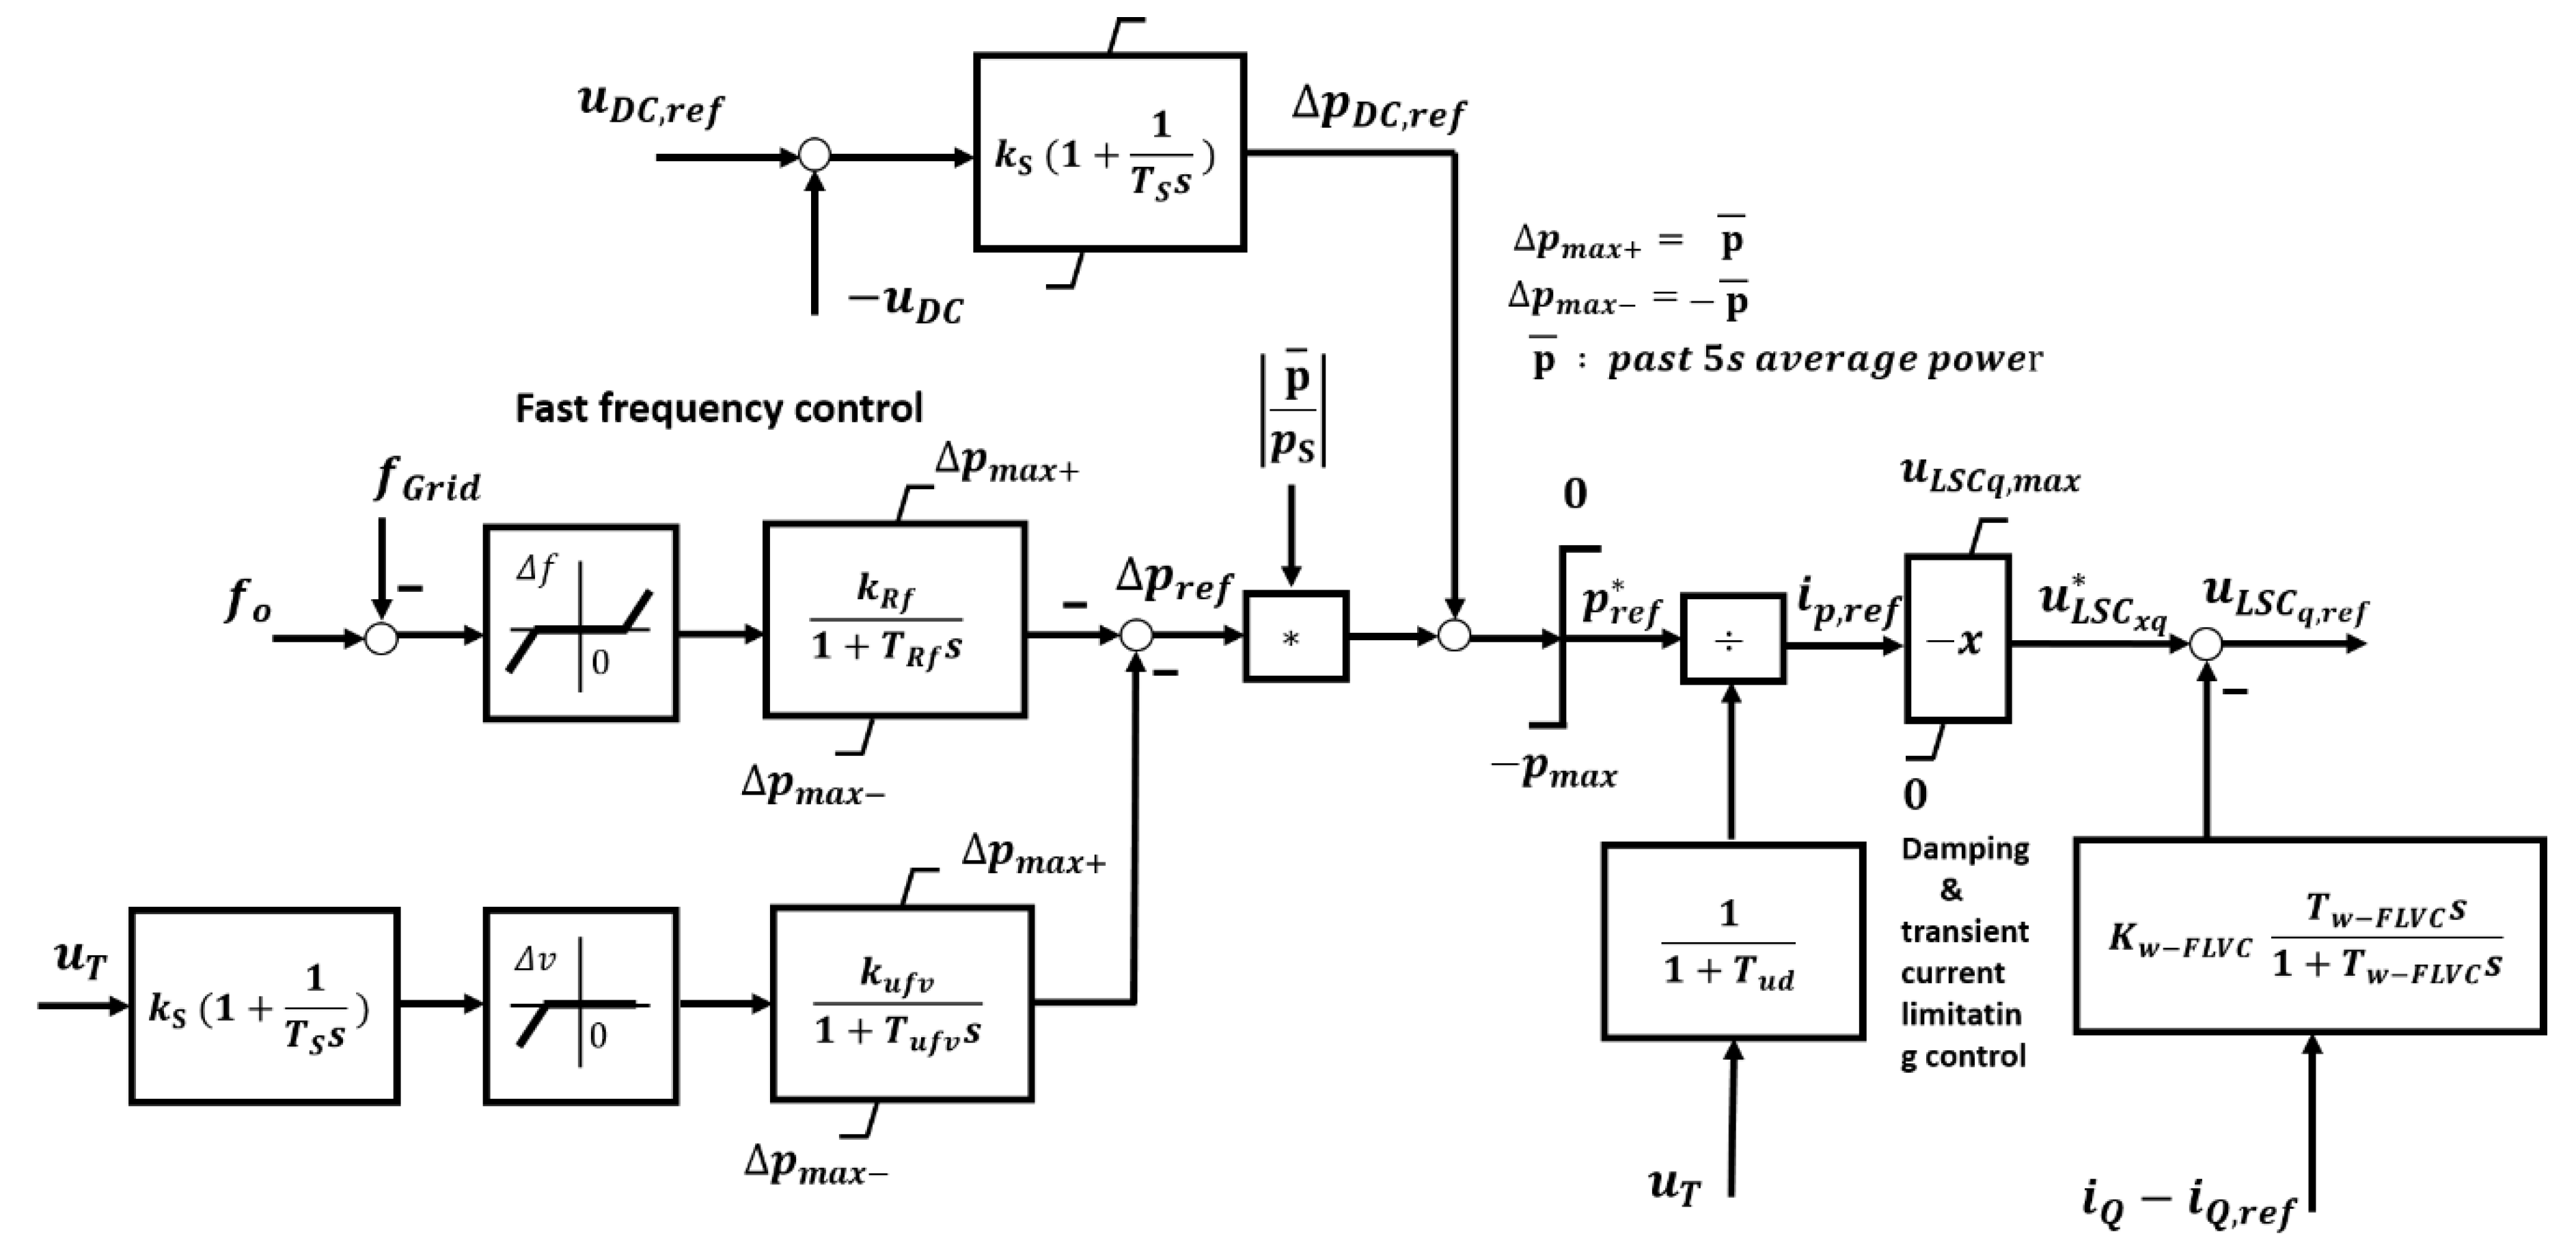
The active power control channel is illustrated in
Figure 3. The left part of the schematic concerns with the main control target of this channel, i.e., regulation of the DC voltage level. This channel is extended to provide a supplementary fast frequency control, which can be precluded by an extra control loop detecting unacceptable voltage dips at the AC side of the grid side converter. As in the case of the reactive power–voltage control channel, the right part of the schematic of the active power control channel concerns the necessary fast reaction during large disturbances. So, a washout filter (with a gain K
w-FLVC and a time constant T
w-FLCV) is used here as well to perform such fast reaction.
As shown in [
7], the addition of the washout filters in the active power control channel and the reactive power–voltage control channel can help to quickly (i.e., in less than 200 ms) restore active and reactive power imbalances, which also seems to be possible in low inertia systems. Therefore, this paper takes this approach into account, to analyze if this alternative can also help to enhance the transient stability in systems with a share of renewable power generation above 50%. It is worth pointing out the fundamental difference between the wind generators with current control and PAM and the wind generators with FLVC. In the first case, cf. study described in [
5], the relative rotor angle deviations are taken into account to affect the deployment of the active power output of the wind generators immediately when a large disturbance occurs. In the second case, cf. study described in [
7], the measured voltage deviations trigger the reaction of the FLVC in order to quickly reduce these deviations and indirectly affect the deployment of the active power output of the wind generators.
2.3. Synthetic Model of the GB System
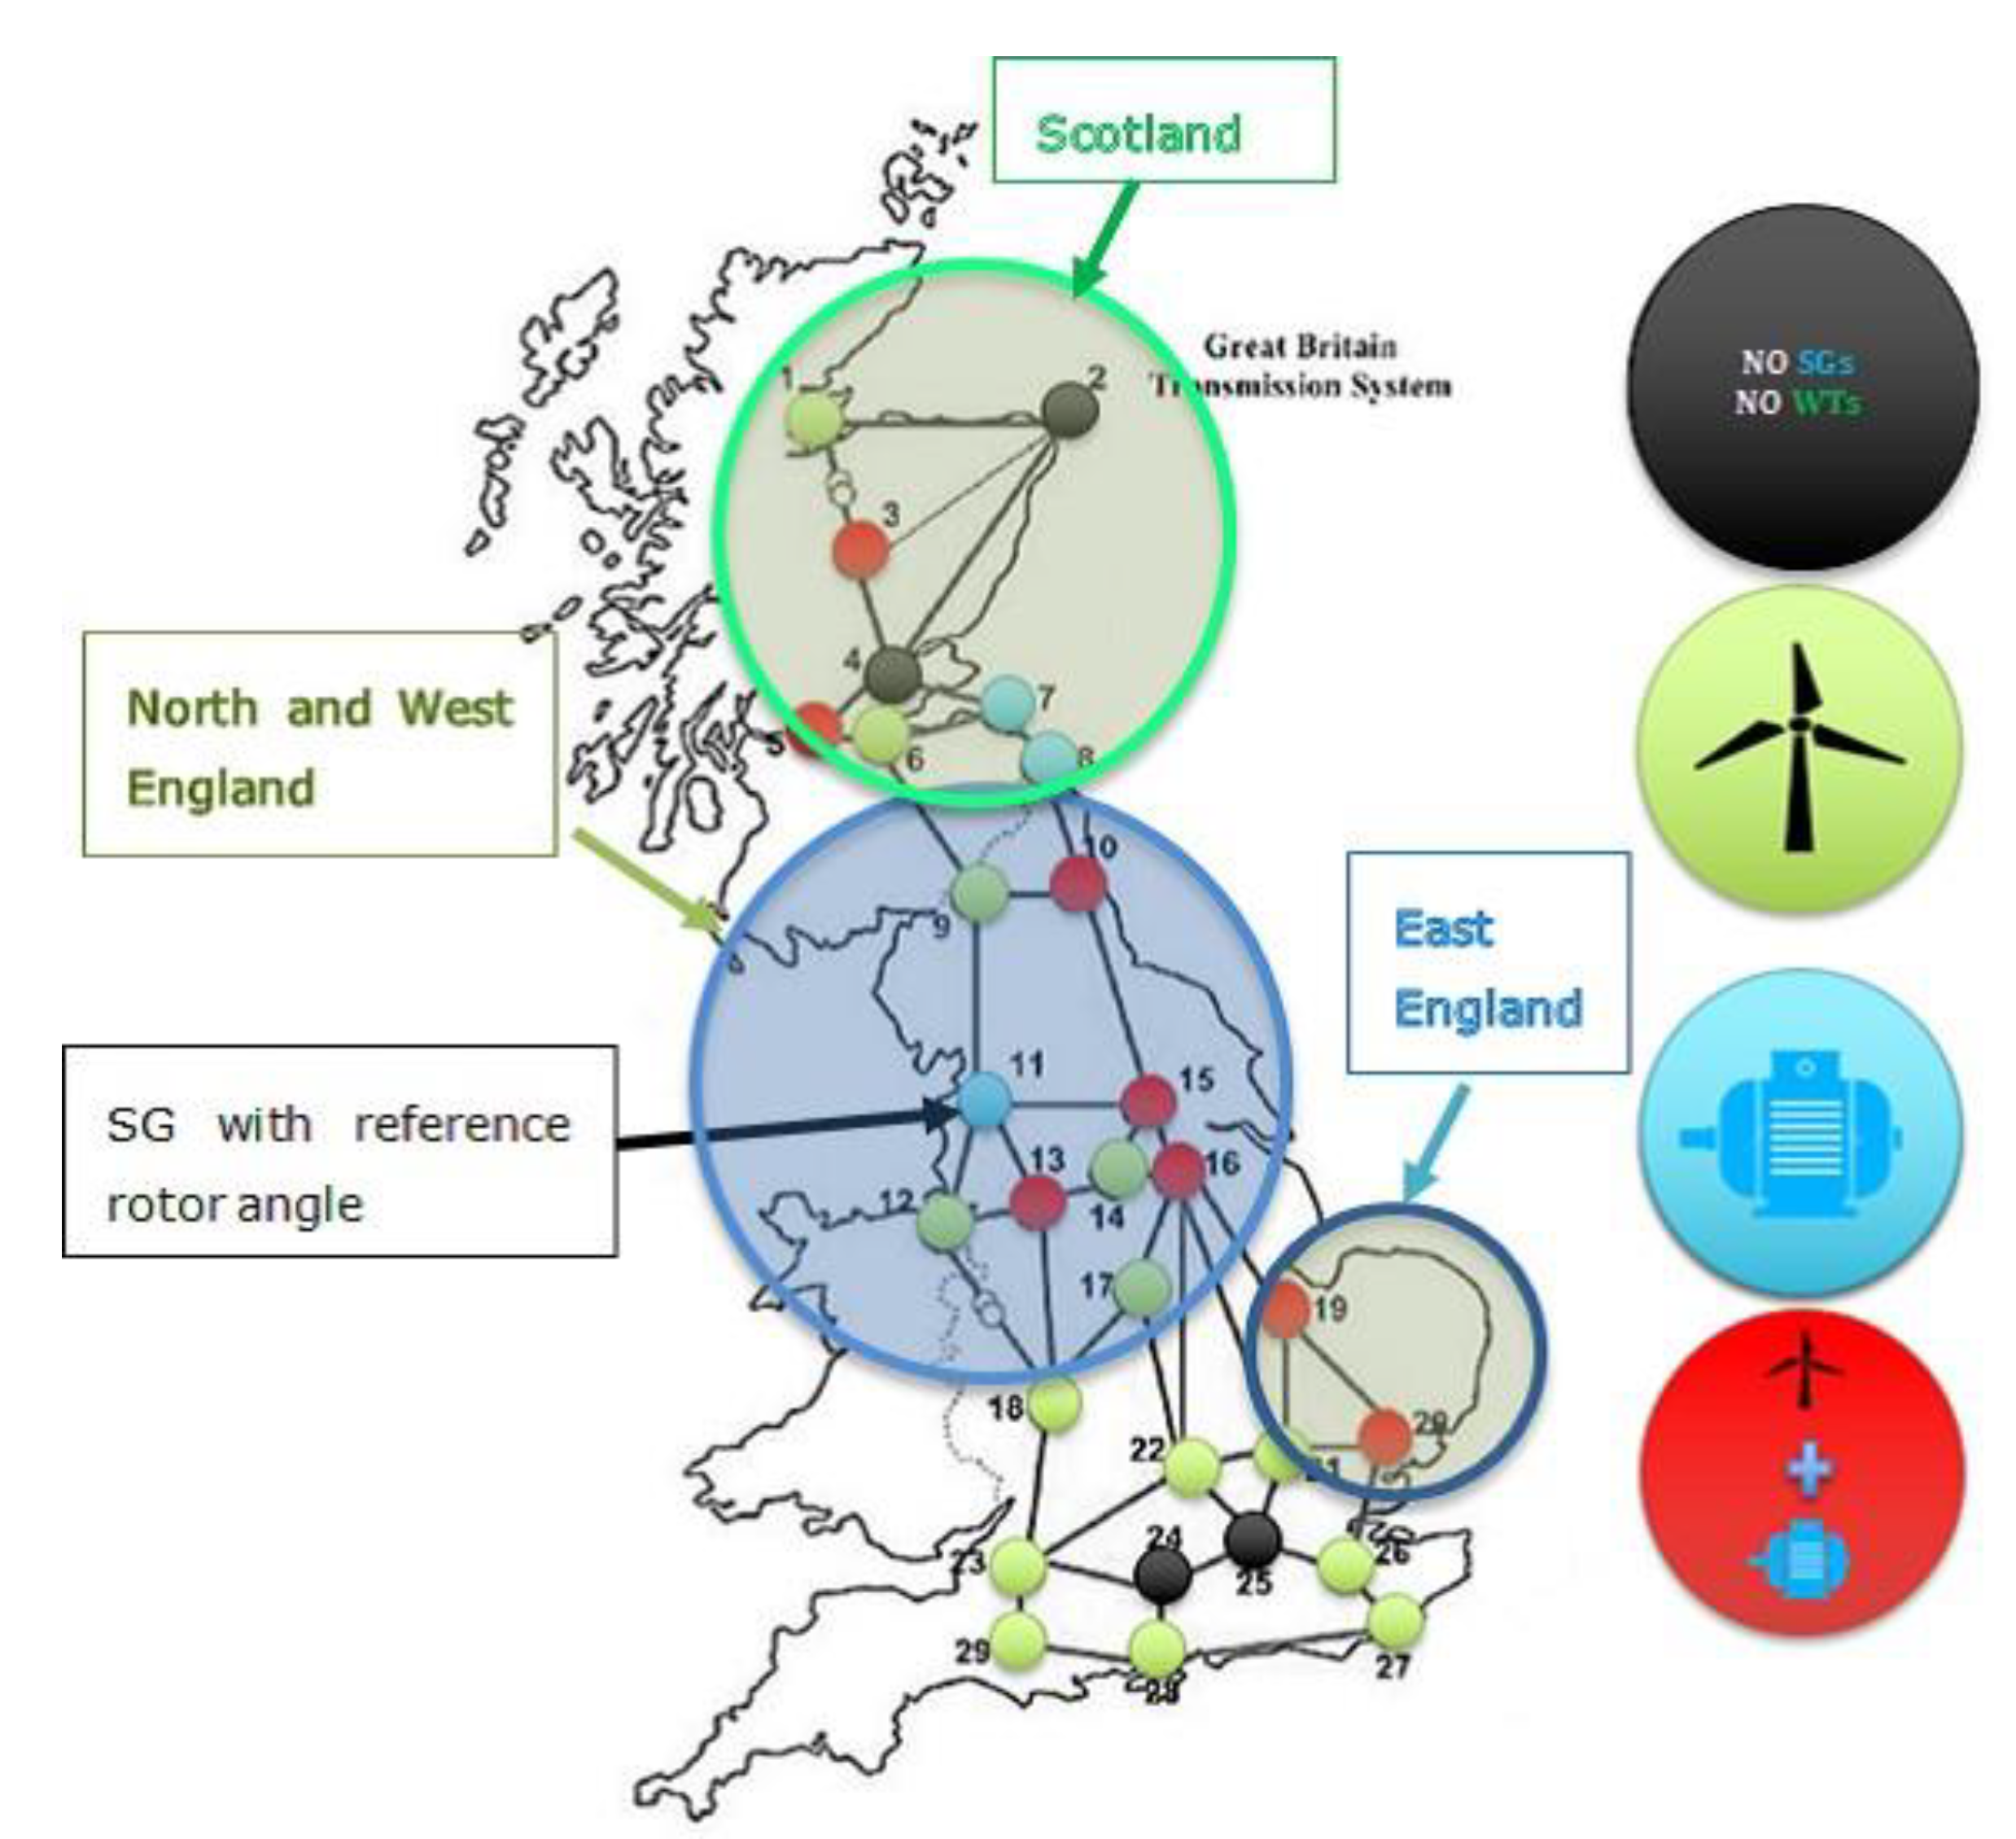
The diagram of the synthetic model of the GB system is shown in
Figure 4. This representation describes the generation units by using several colored zones. The black zones entail no generation units, the green zones represent only wind generation units, the blue zones constitute only synchronous generation units, and the red zones basically represent hybrid zones with wind generators and nearby synchronous generators [
5]. The reference angle used to measure the relative rotor angle deviations belongs to the synchronous generator SG11, which is located in zone 11 (this is the least sensitive synchronous generator to high rotor angle excursions caused by large disturbances). It is worth mentioning that the inertia constant of the synchronous generators 10, 11, 13, 15, and 16, is 7 s, whereas it is 2 s for synchronous generators 3, 5, 7, 8, 19, and 20. In addition, the control zone 11 is the only one that exclusively comprises synchronous generation (i.e., wind generation is absent in this zone). The values of nodal load and generation dispatches were taken from [
14], to create an operational scenario with 75% share from wind power generation.
Following the findings from [
5], the wind generators located in the hybrid zones, indicated with the red color in
Figure 4, are the candidates to perform control actions that can help to ensure transient stability in the synthetic model of the GB system. Therefore, these wind generators are represented differently in two cases. In the first case, the wind generators have a current control approach and are equipped with PAM (cf.
Section 2.1). The PAM controller modulates the active power of the wind generators, depending on the angular difference between the nearby synchronous generator (to be supported to keep synchronism) and the angular reference of the power system. In the second case the wind generators have a FLVC approach (cf.
Section 2.2). In both cases, the remaining wind generators (i.e., the ones indicated by green circles in
Figure 4) are represented by a model with current control approach and without PAM.
3. Controller Tuning Based on Parametric Sensitivity
The maximum angle difference indicator is selected as a metric to assess the transient stability performance [
14]:
where ∆
δ is the angle difference between any pair of synchronous generators of the system.
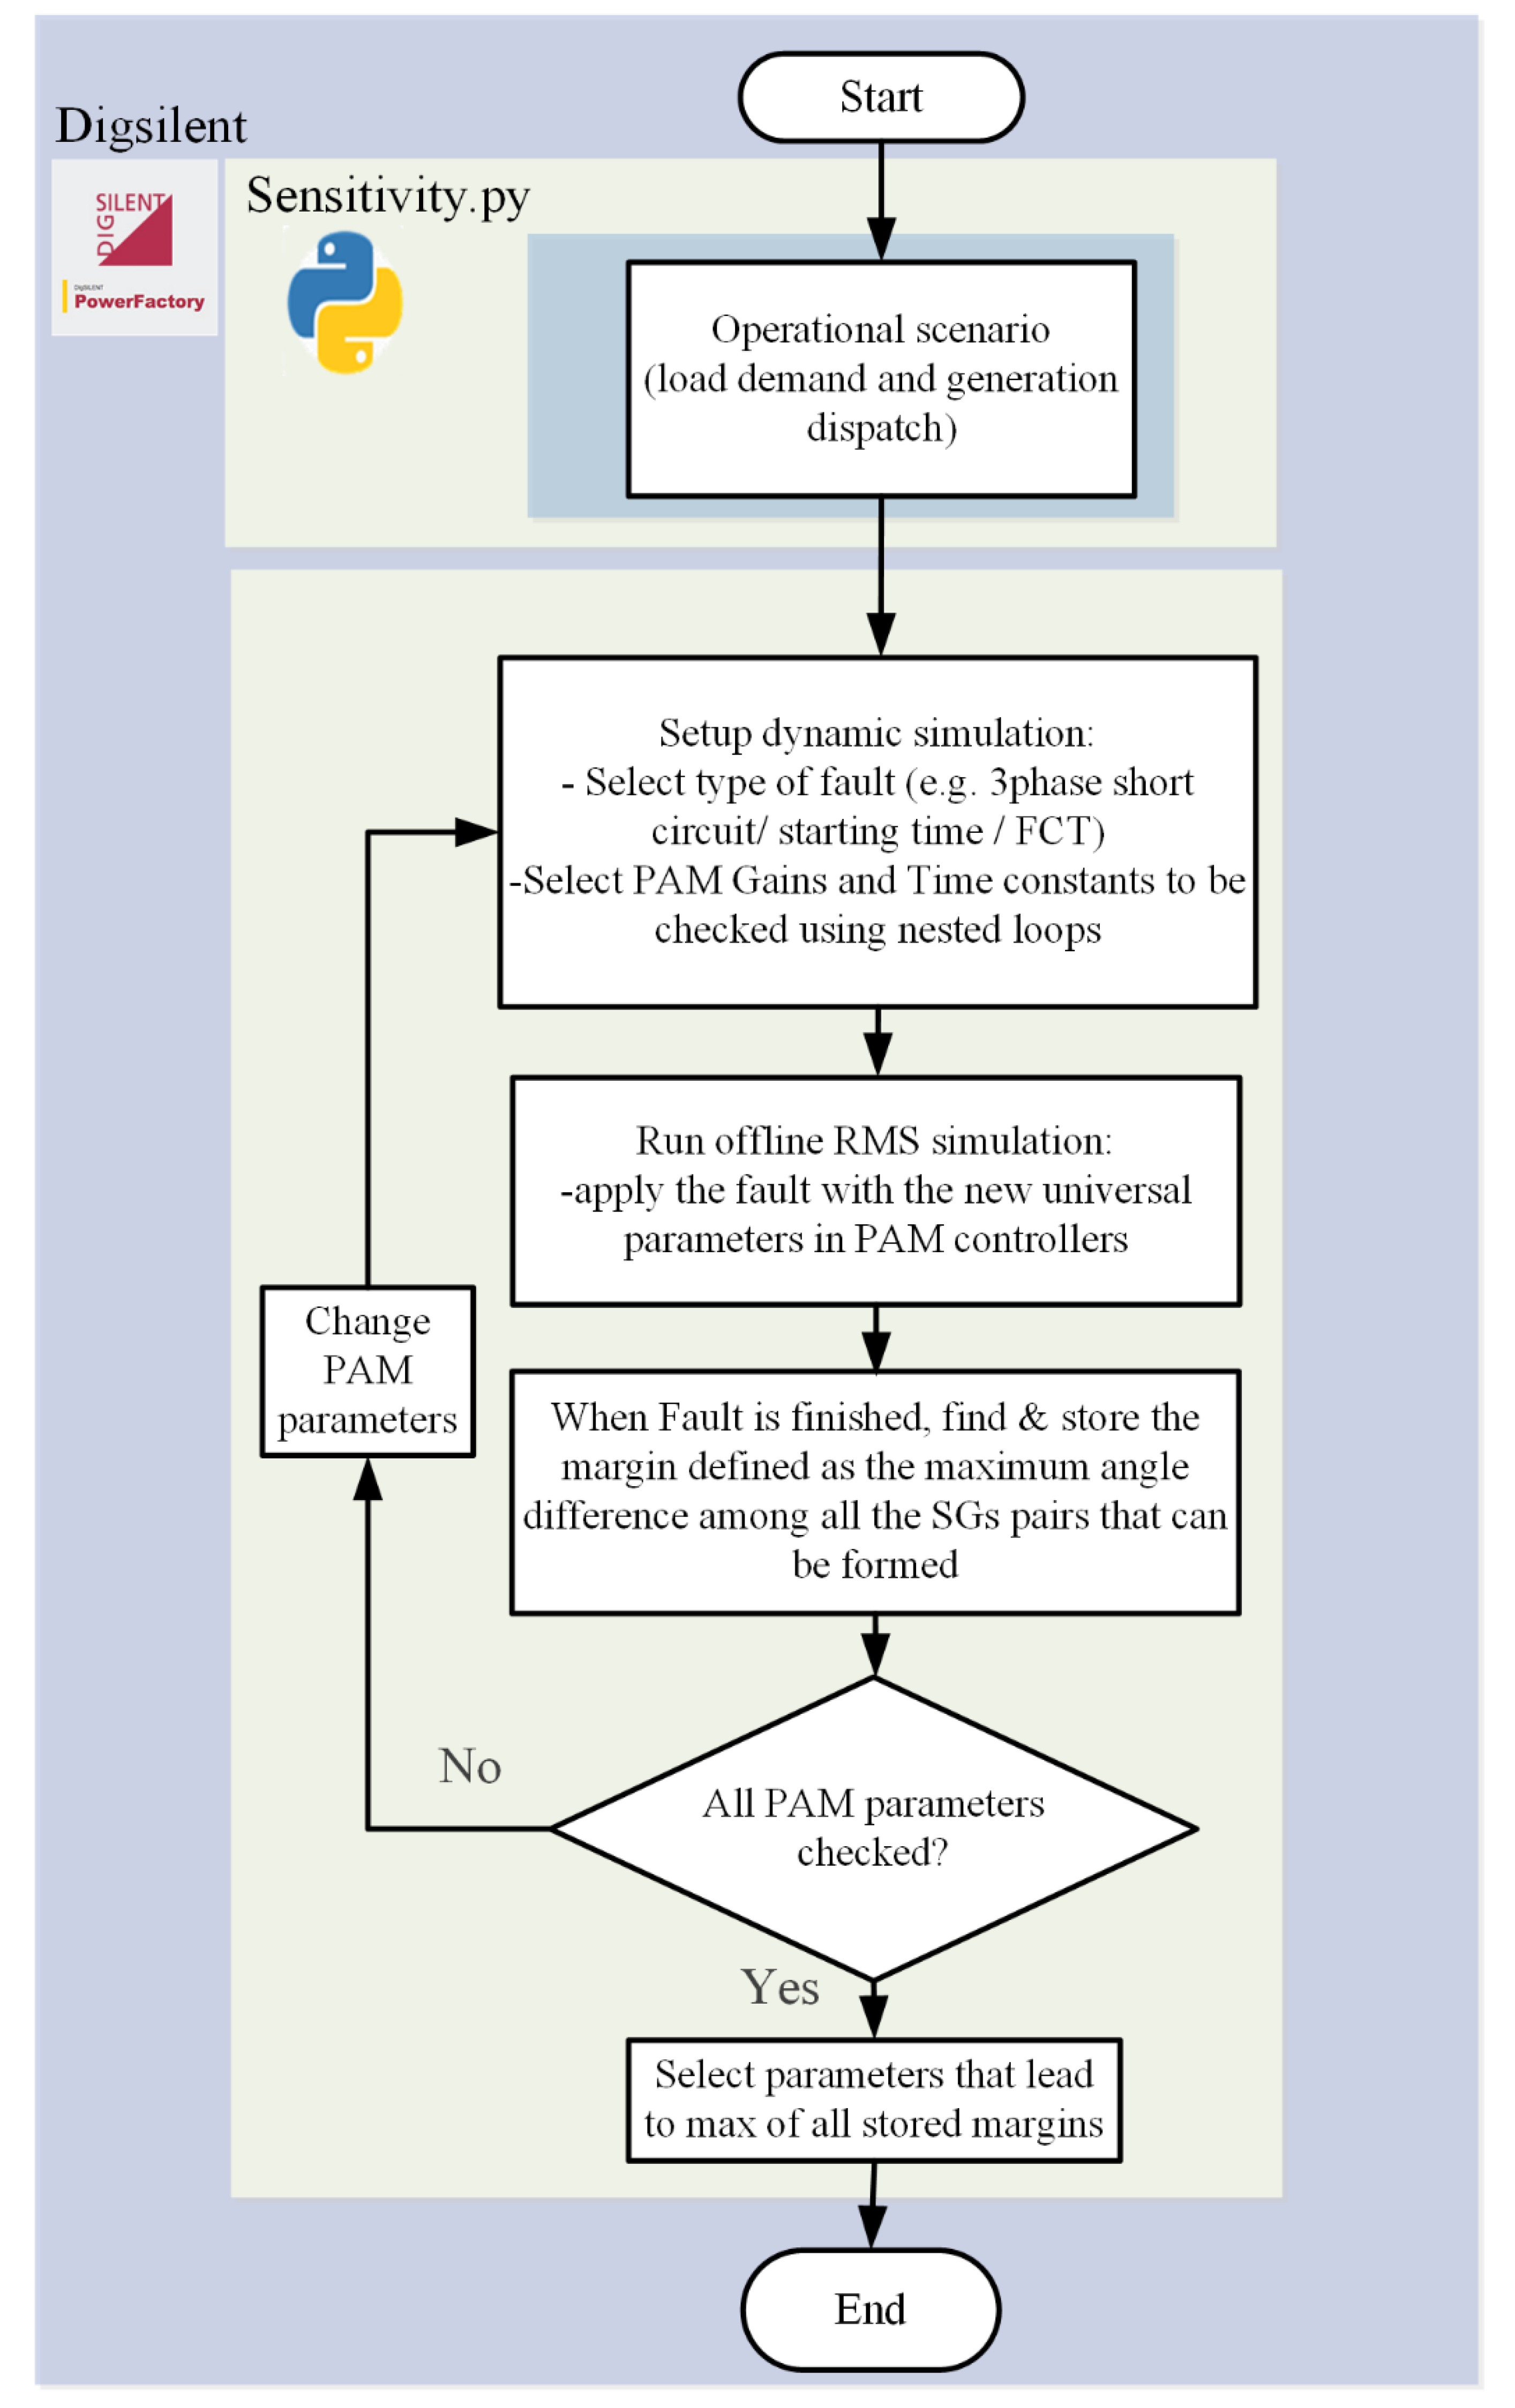
Figure 5 shows the procedure defined for parametric sensitivity-based tuning of the parameters of the washout filters used in PAM or in the fast local voltage control (i.e., each parameter from a set of parameters is varied incrementally, whereas the other parameters have a fixed value). For each set of values of time constants and gains of the washout filters used in either PAM or FLVC, a selected severe disturbance is implemented (e.g., a three-phase fault in the middle of line 6–9 with fault clearing time of 120 ms, which causes transient instability) by using RMS simulations, and the transient stability performance is assessed by computing the maximum angle difference between any pair of synchronous generators. The synthetic model of the GB system has 11 synchronous generators. Hence, the possible pairs of generators are determined by using (2). This is the so-called nC
r formula, typically used to find the unique permutations, or combinations, of n objects taking r items at a time.
where n = 11, is the number of the synchronous generators still connected in the GB system, and r = 2 represents the angular correlation between for the synchronous generators. By using these values, a total of 55 pairs of synchronous generators correlations are formed in the analysis shown in
Figure 5.
Once an RMS simulation is done, the margin is computed for the corresponding set of washout gains and time constants, and the next set of parameters are evaluated under the same fault conditions. When all sets of parameters are evaluated, then the user can select the set that gives the best value of margin as the best settings for the washout filters acting on the selected wind generators.
Table 1 and
Table 2 illustrate the values obtained for the washout filters used in the case that the wind generators have current control and PAM and the case that wind generators perform fast local voltage control, respectively. From
Table 1, note that the parametric sensitivity analysis suggests that gain values K
w = 60 and a time constant values T
w = 0.01 s can be considered for all washout filters used in the PAM controller added on the wind generator models with current control. By contrast, gain values K
w-FLVC = 0.03 and time constant values of T
w-FLVC = 0.01 s can be considered for all washout filters used by the wind generator models with FLVC.
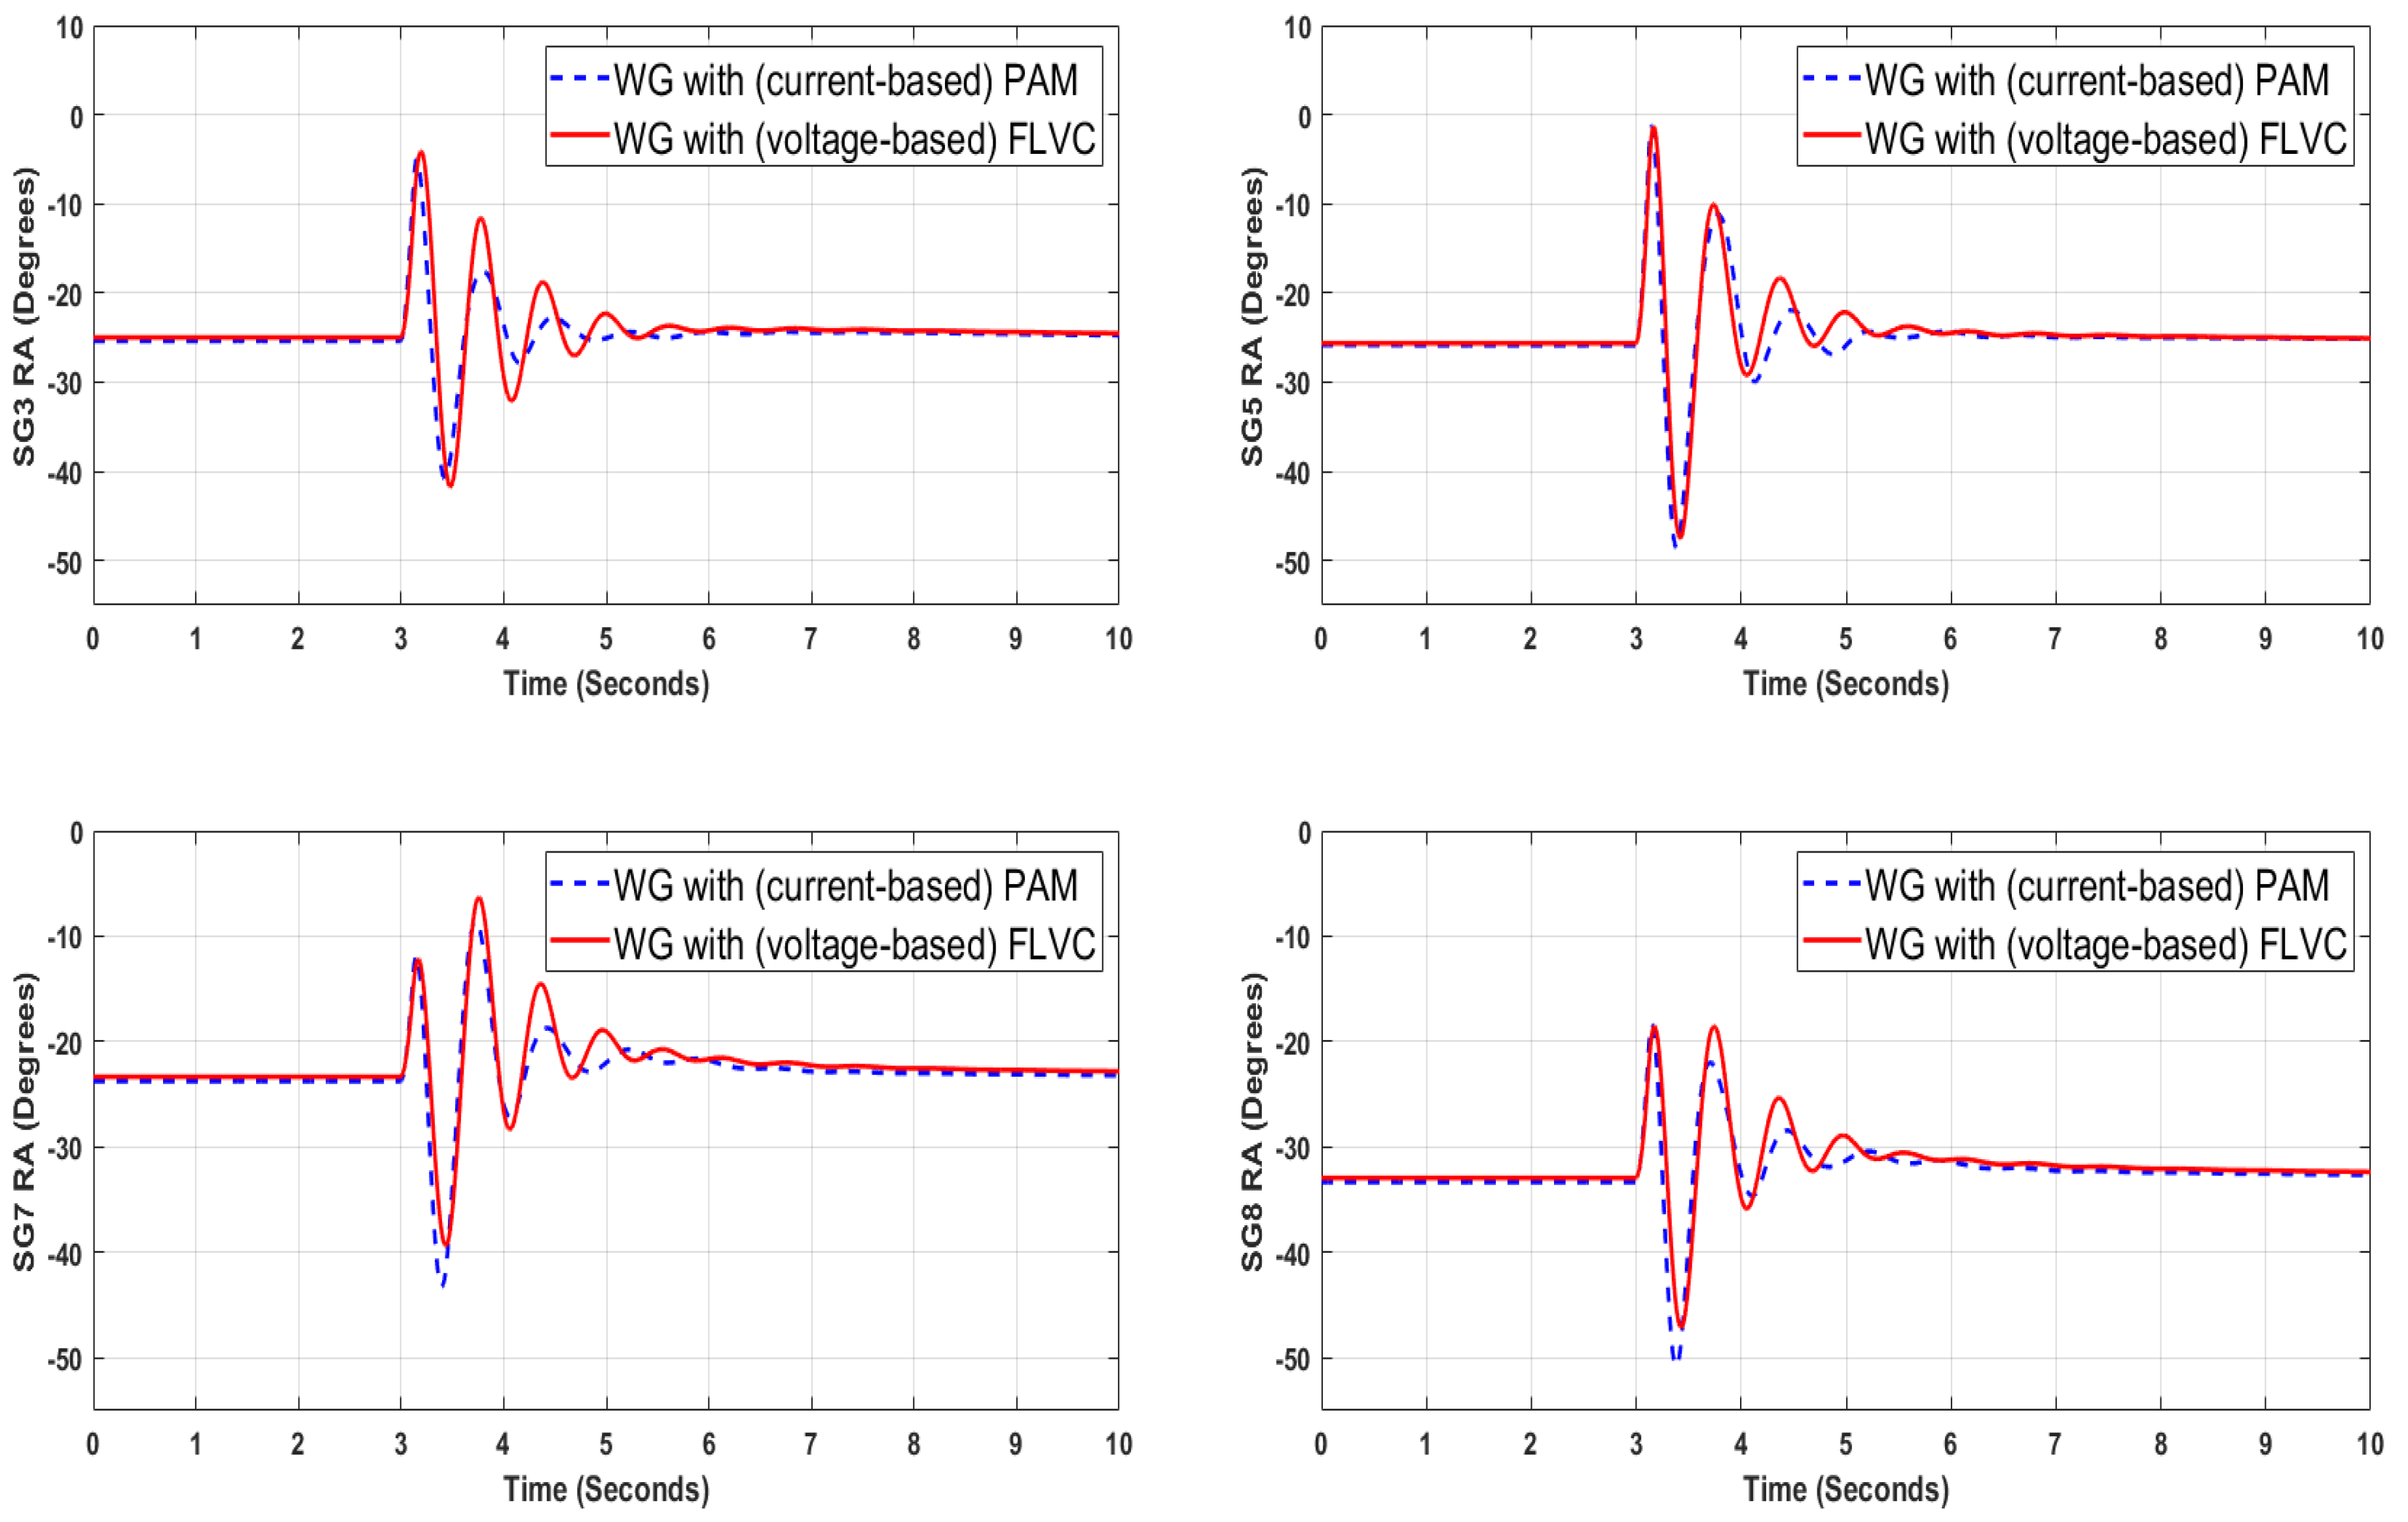
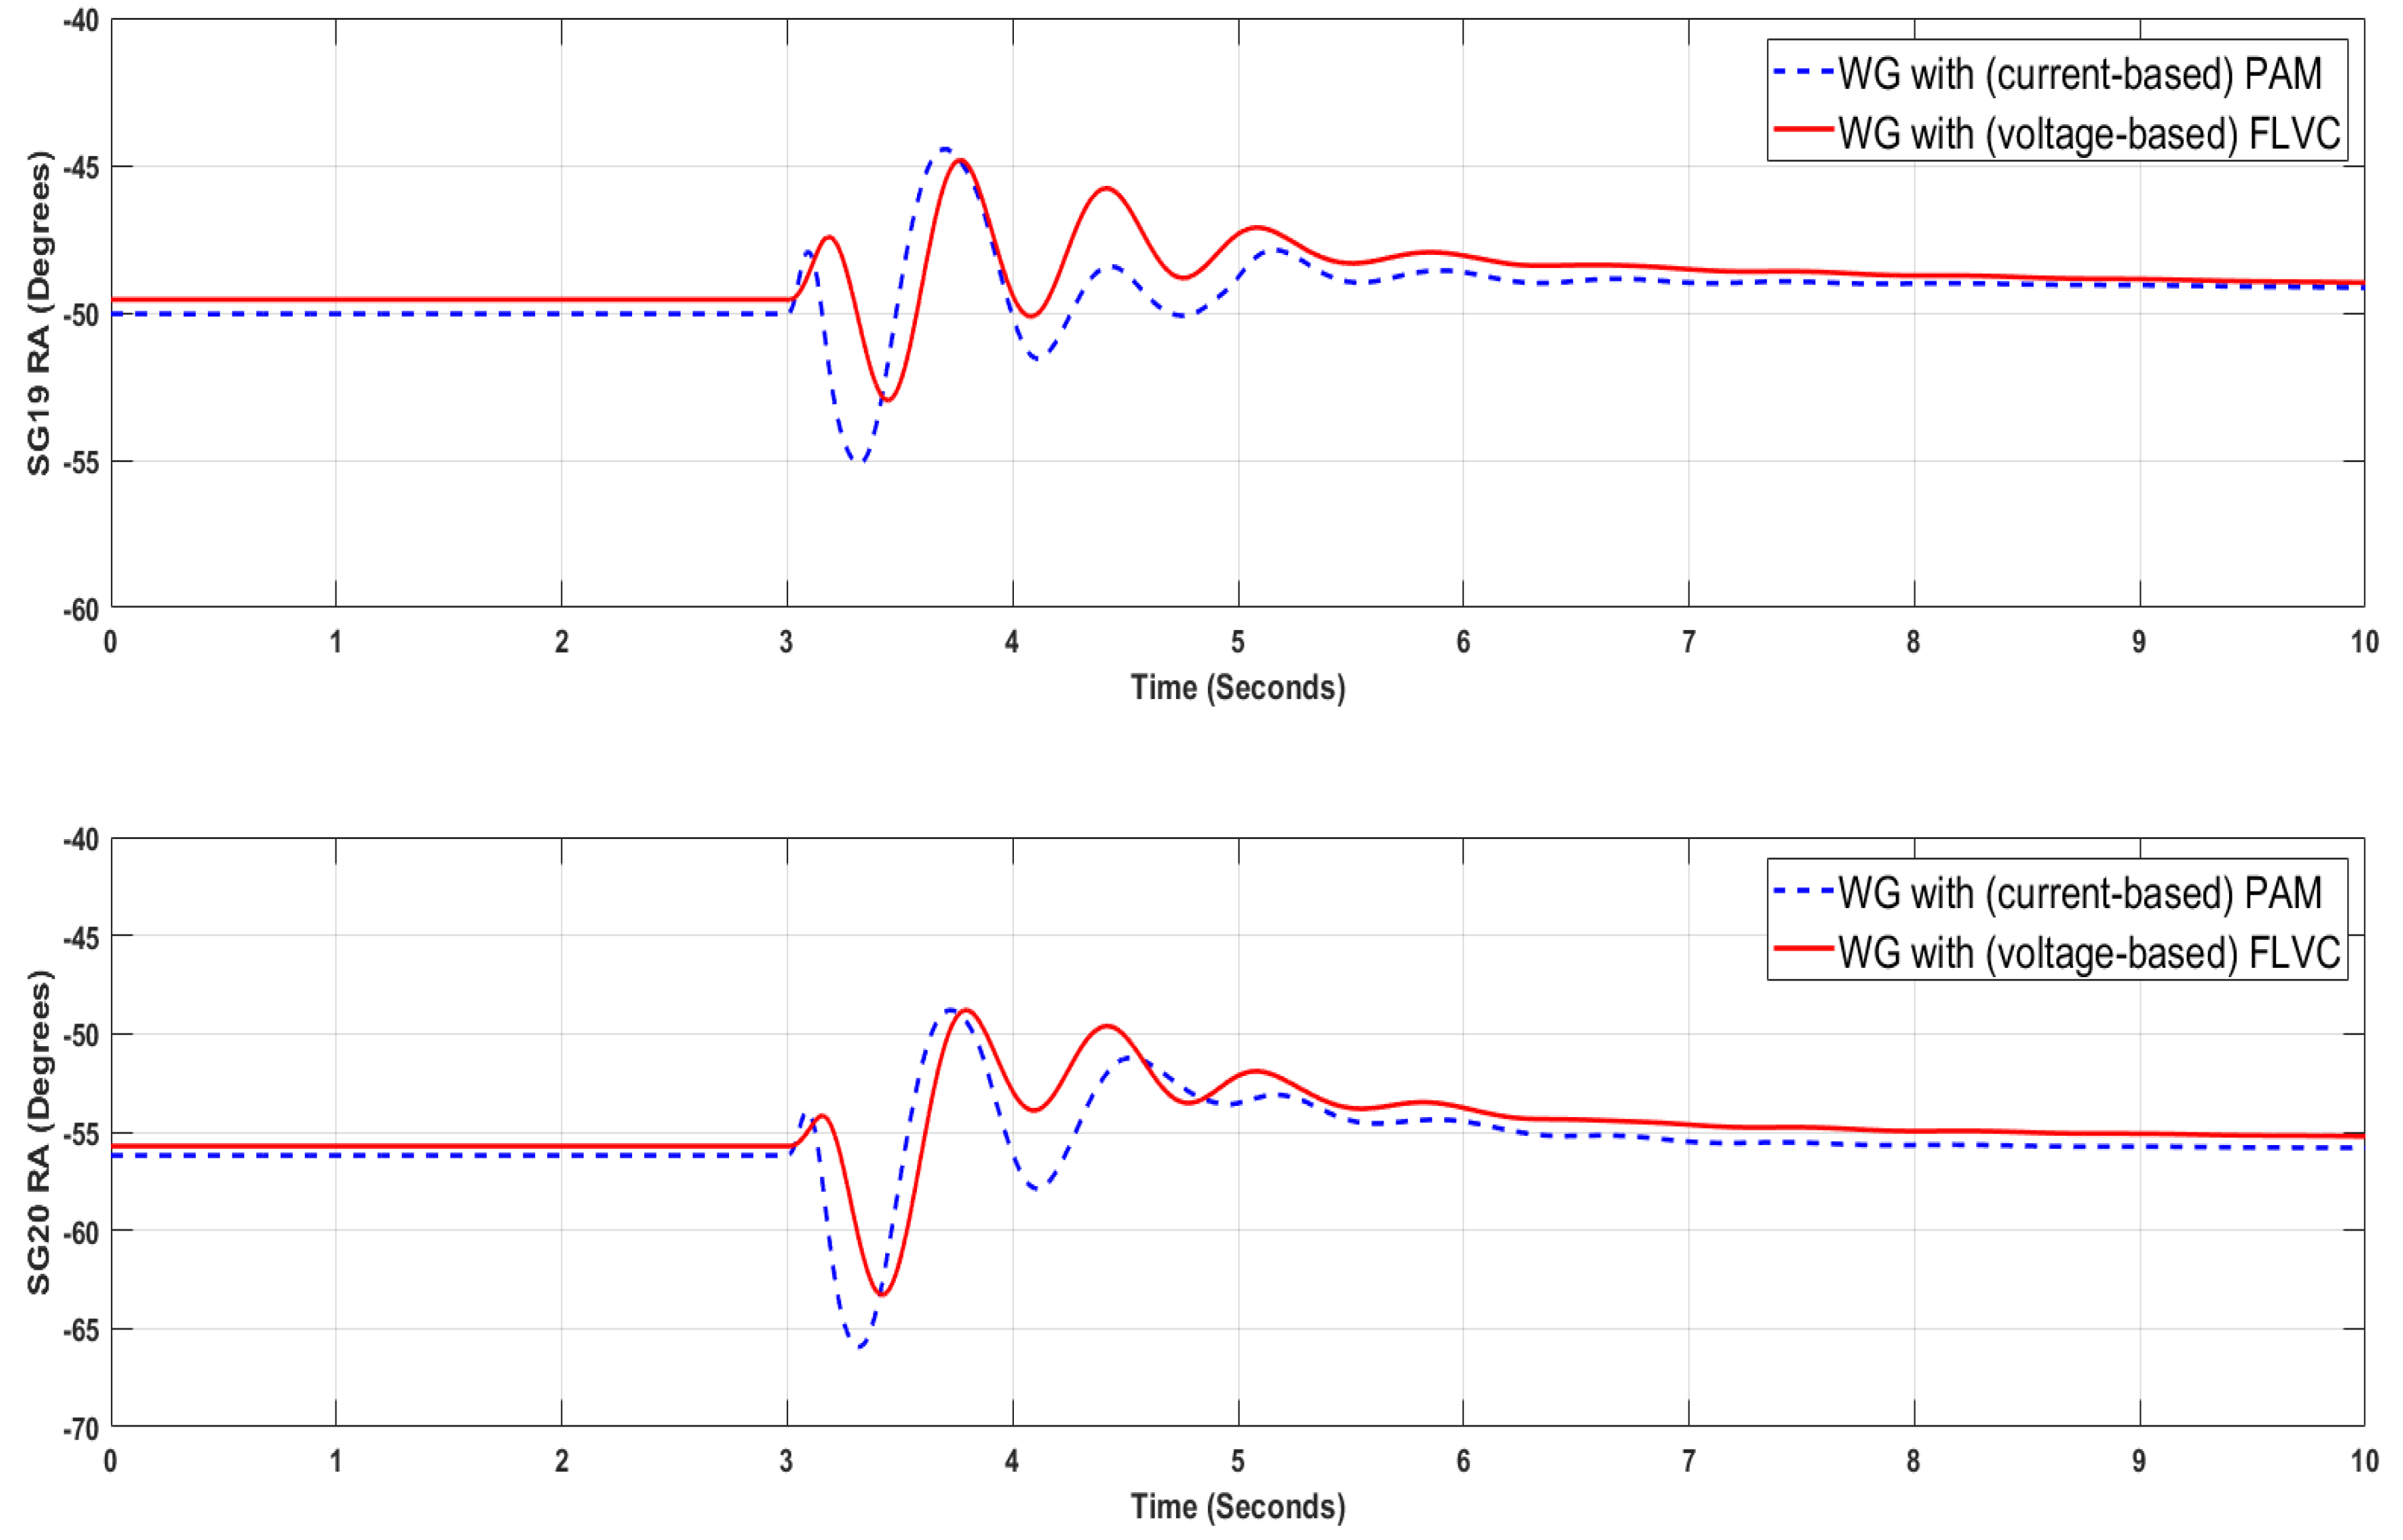
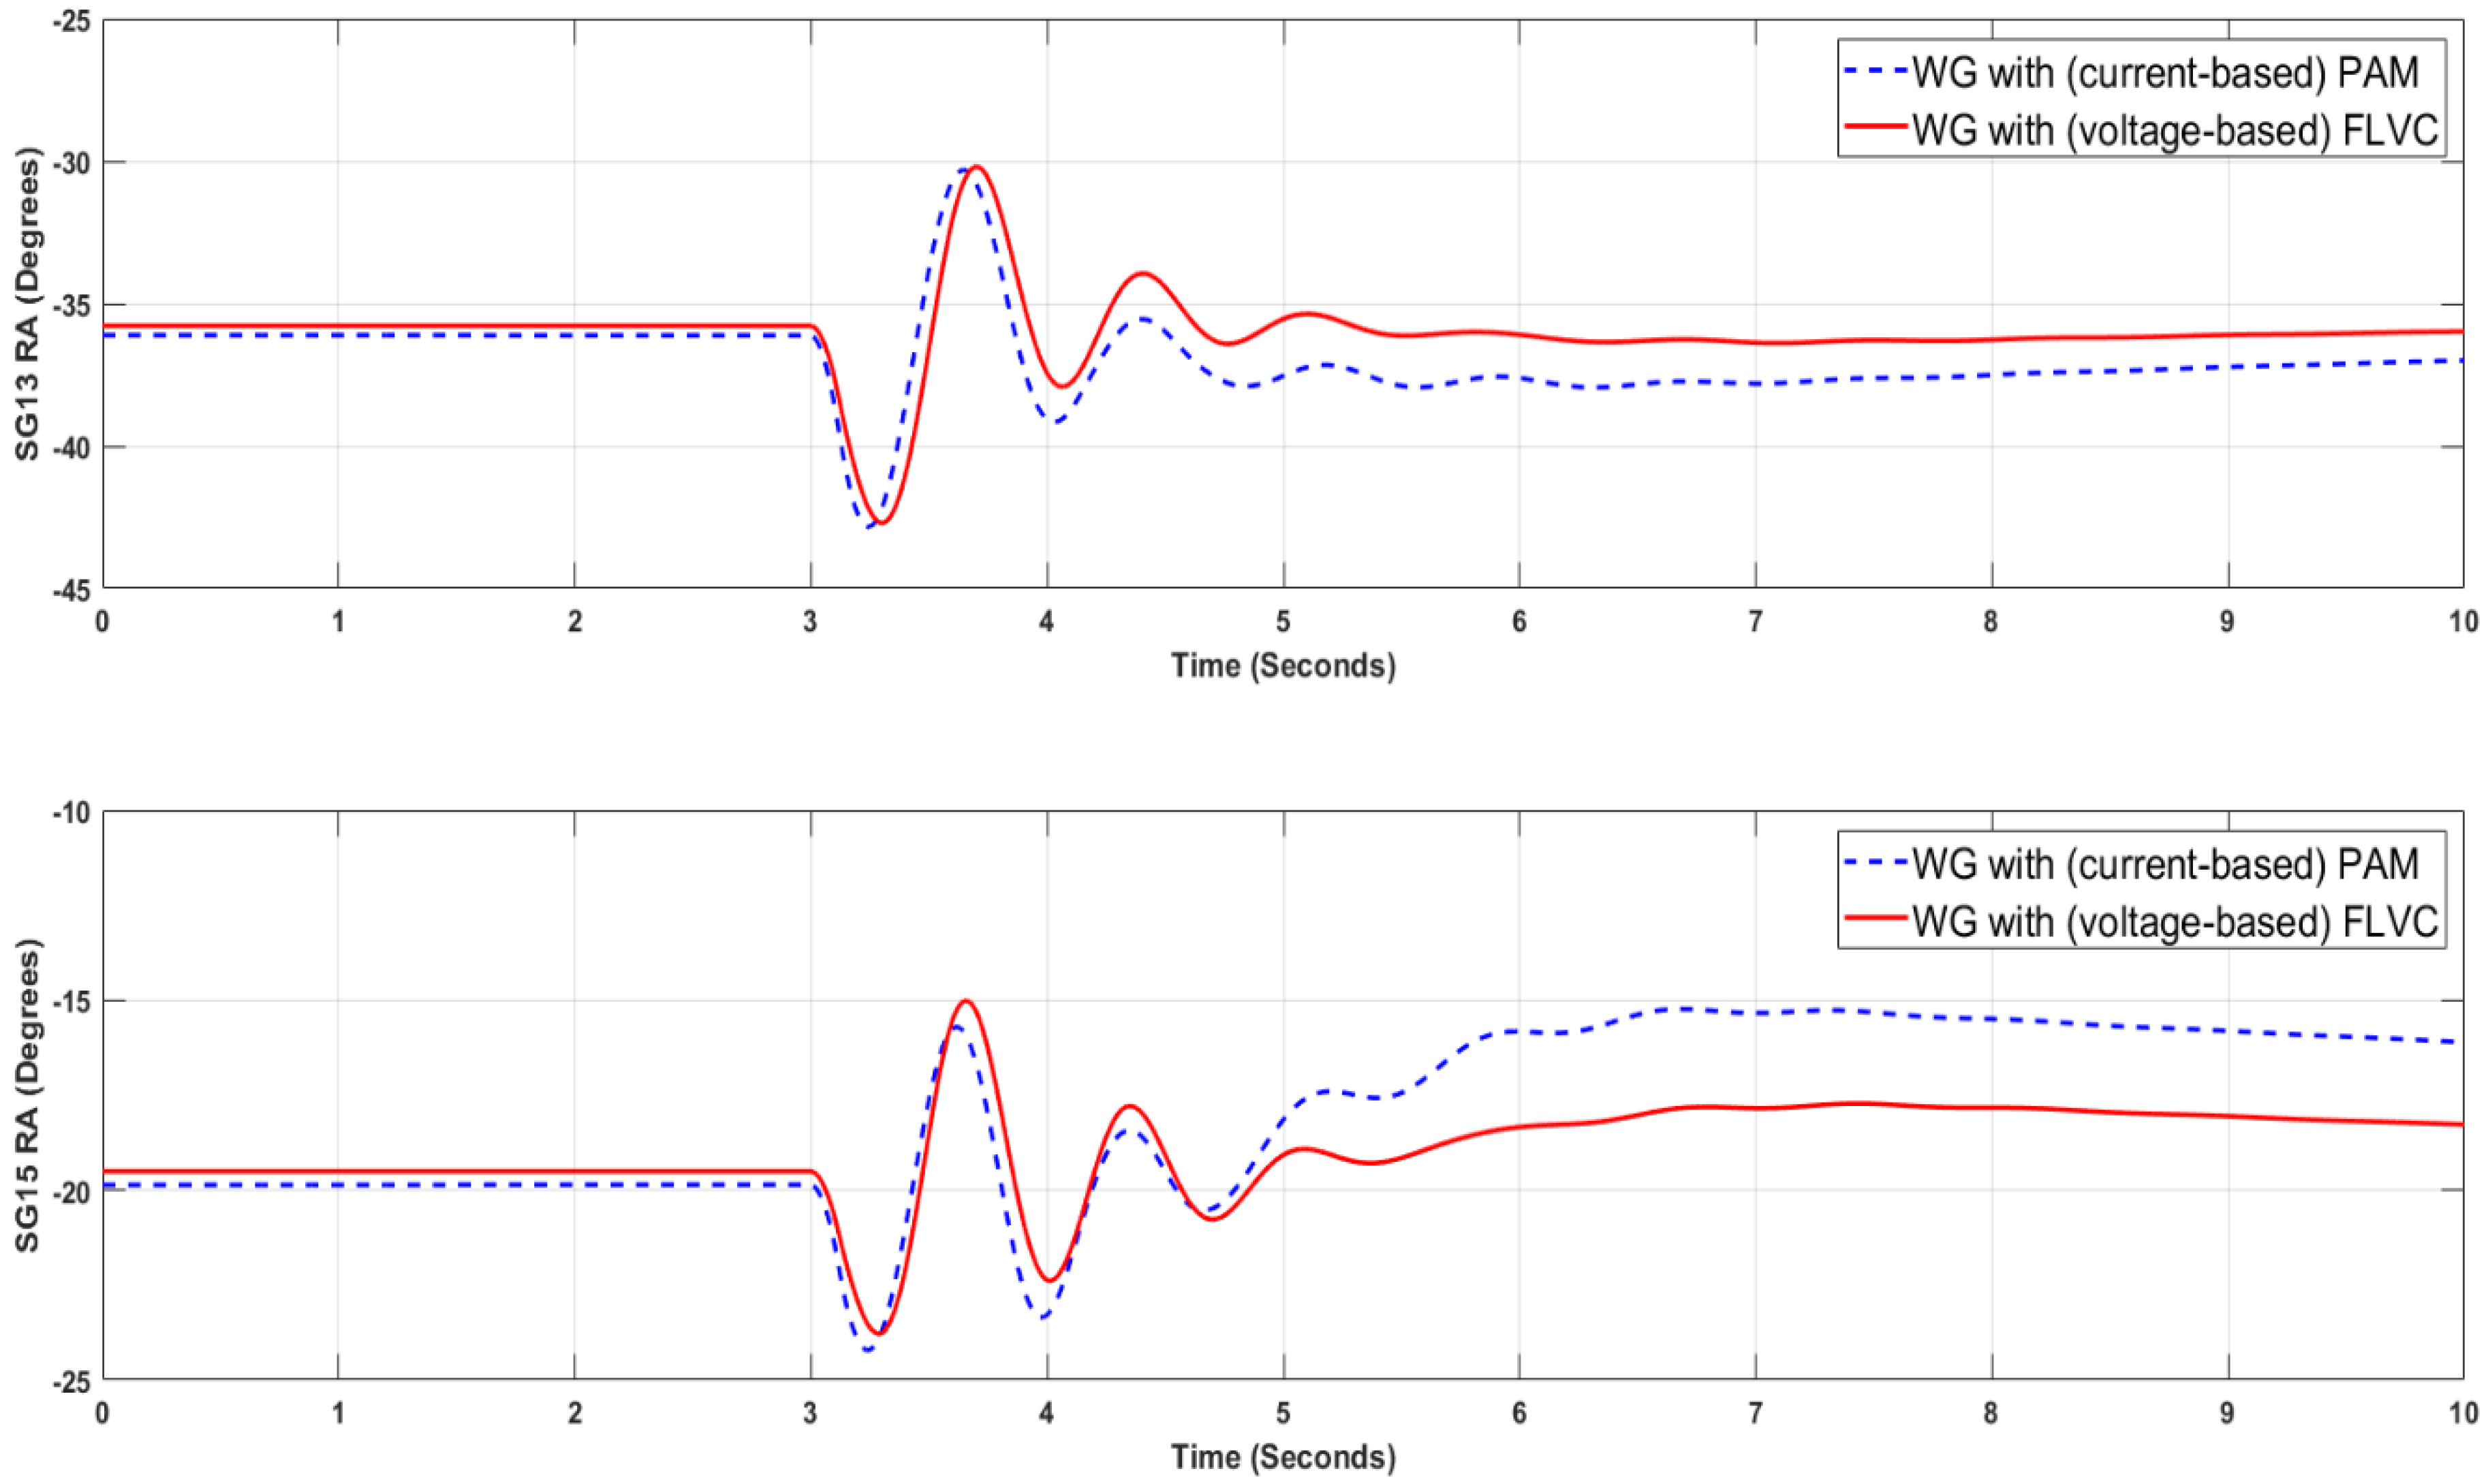
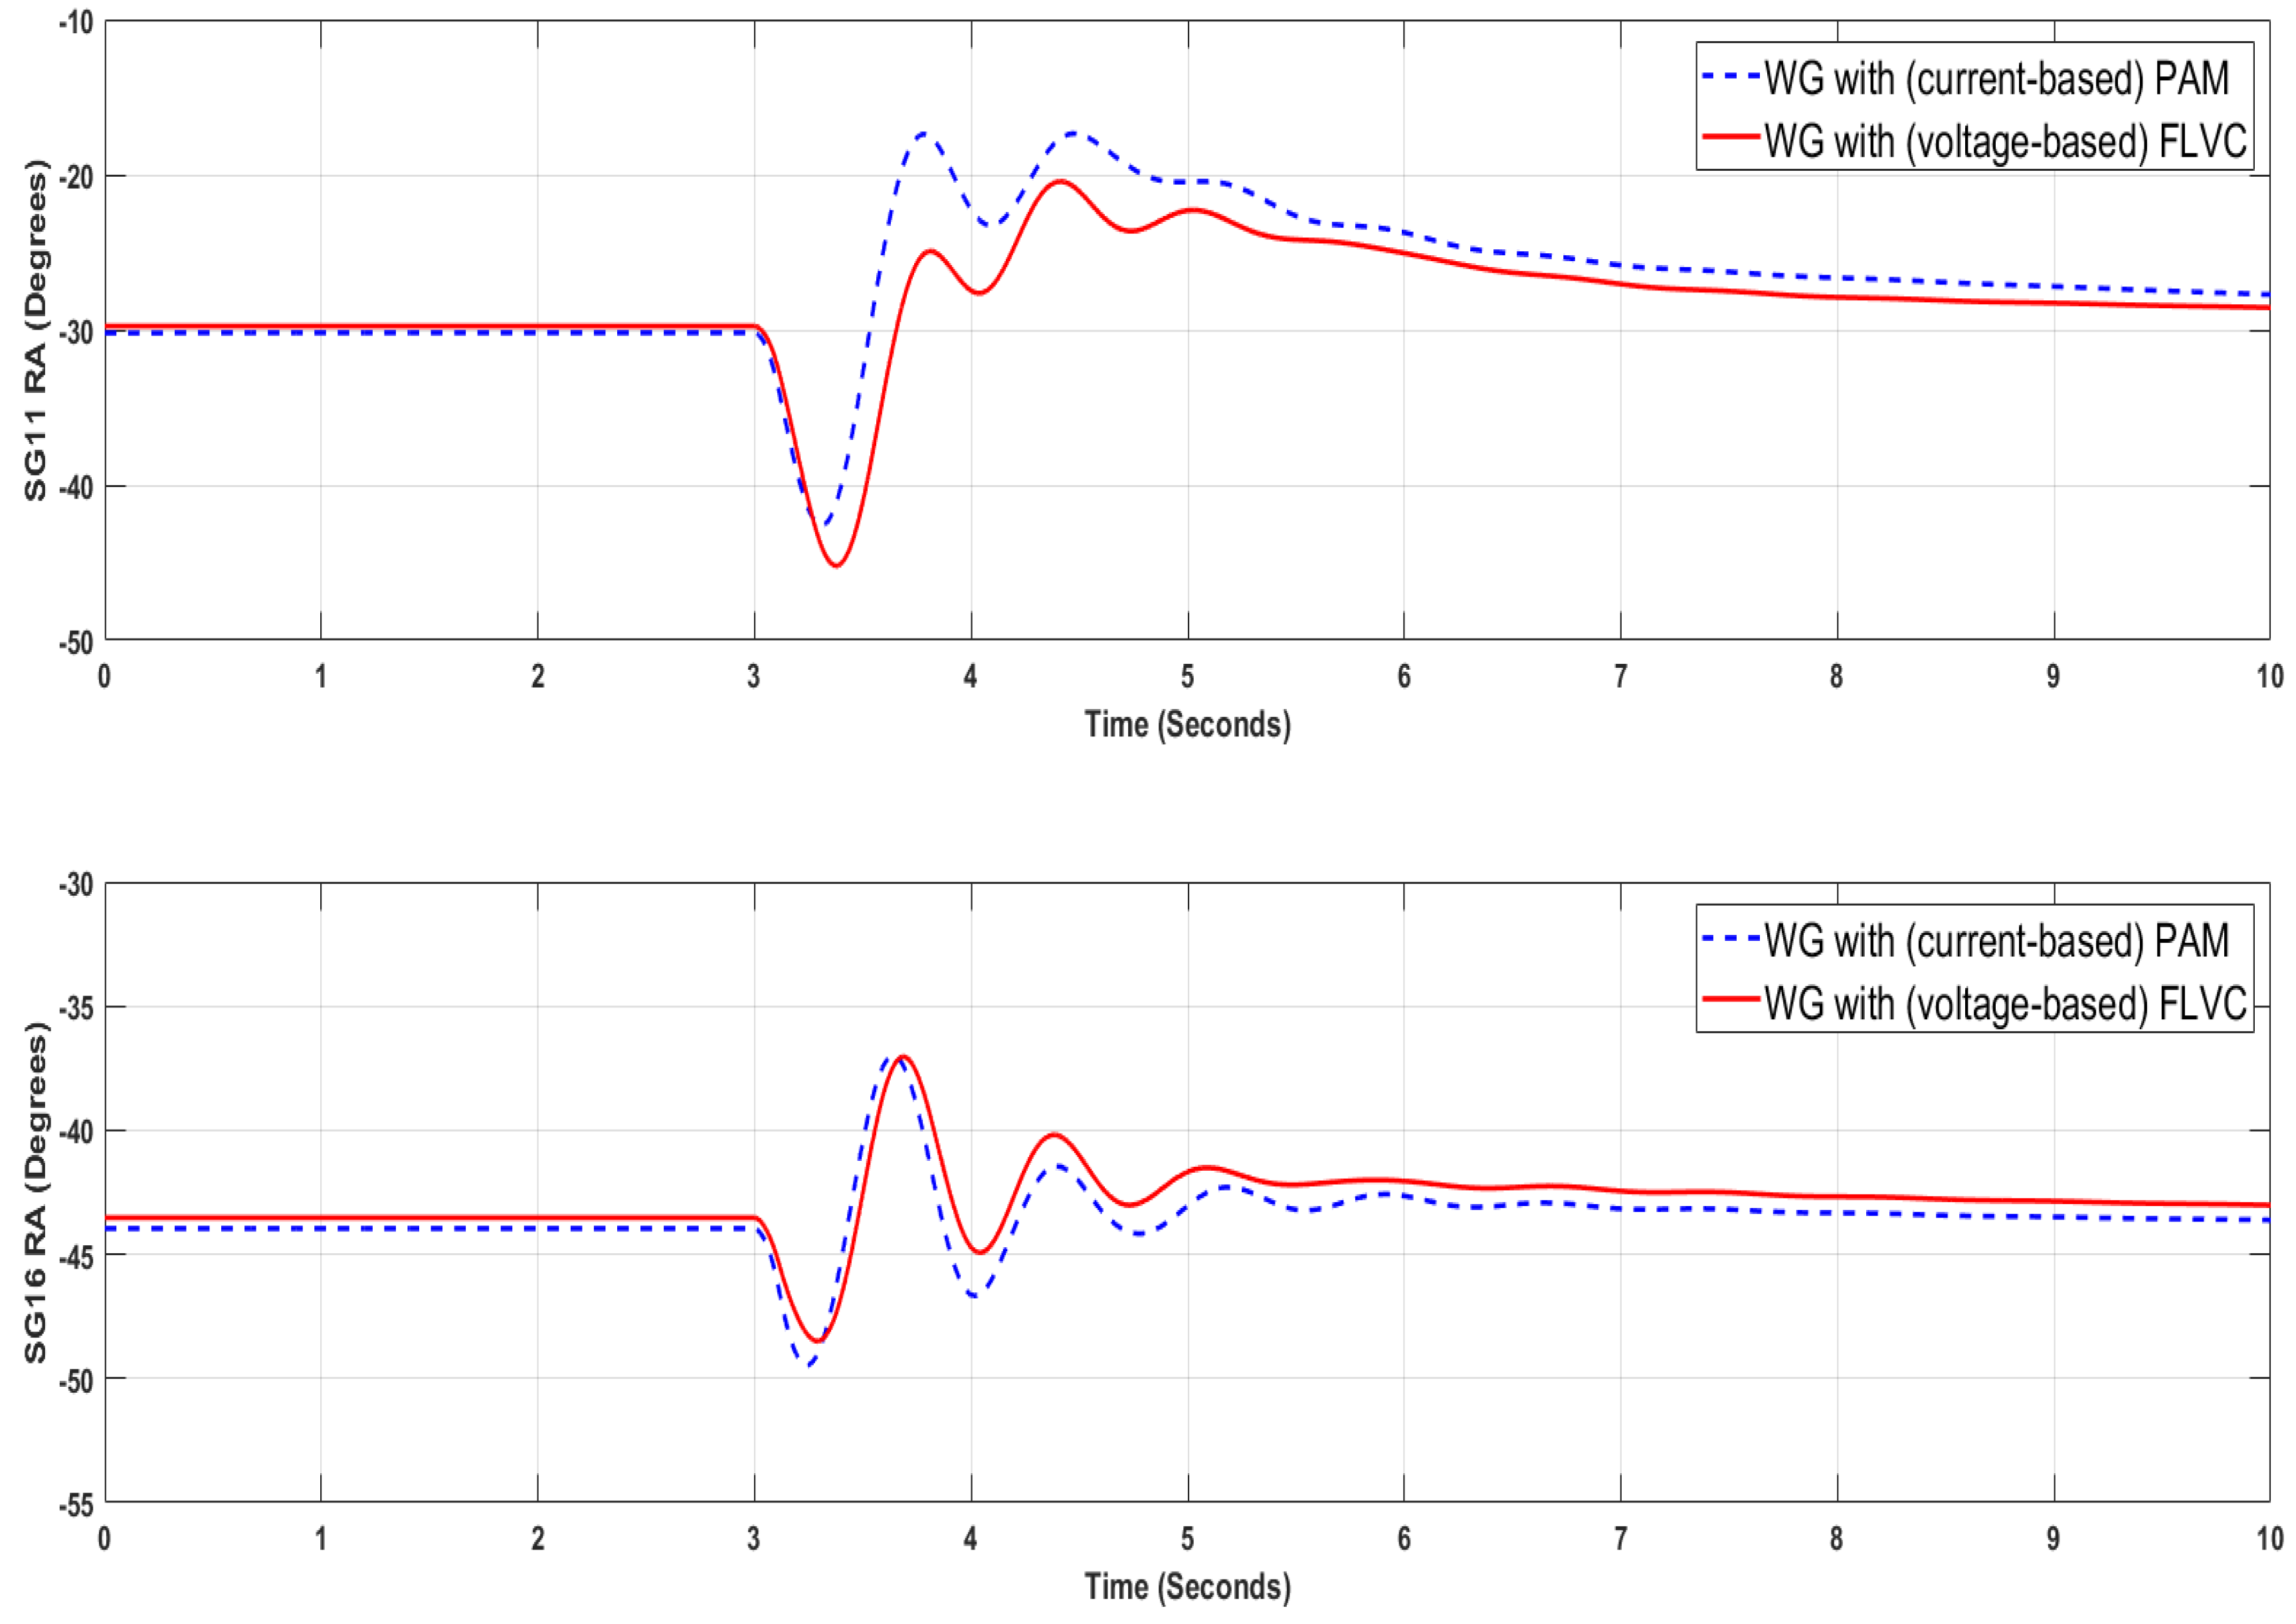
The time evolution of the rotor angles of the critical synchronous generators w.r.t. the rotor angle of the slack generator (i.e., SG11) is shown in
Figure 6,
Figure 7,
Figure 8 and
Figure 9. Note in these figures that a similar transient stability performance can be achieved when the wind generators perform with current control and are equipped with PAM vs. the case when the wind generators perform with FLVC. Based on these findings, it could be speculated that the use of FLVC would be a more convenient option, since, unlike the current control with PAM, the FLVC does not need wide area measurements to generate the input signal for the washout filters. Theoretically, the dynamic rotor angle responses shown in
Figure 6,
Figure 7,
Figure 8 and
Figure 9 can be further improved by also tuning other (inner) control loops of the grid side converter of the wind generator. Such study shall also take into account possible collateral effects that may deteriorate other forms of dynamic phenomena of the grid side converters and the power system. This is being investigated in ongoing research that will be presented in a future publication. Although the parametric sensitivity procedure shown in
Figure 5 is simple to implement, it becomes onerous and may not guarantee optimal controller performance when the search space of the parameter values grows significantly. To ascertain if a better transient stability performance can be achieved,
Section 4 of this paper provides an analysis of the tuning problem from an optimization point of view.
4. Controller Tuning Based on Optimization
4.1. Formulation of the Optimization Problem
The problem of optimal tuning of PAM is taken in this section as an example to illustrate the degree of improvement of the performance of transient stability that can be achieved, when resorting to a procedure that is alternative to parametric sensitivity. Mathematically, the optimization problem has the following format:
Two options are considered for
in (3). In the first option,
is computed by using (1), whereas
, described by (6) below, is used in the second option. The two options are evaluated in the solution of the optimization problem to ascertain if a better transient stability performance can be achieved (w.r.t. the performance achieved by using parametric sensitivity analysis as described in
Section 3). Equation (4) indicates that the problem is subjected to correct initialization of the differential algebraic equation (DAE) system of the power system under study (e.g., the synthetic model of the GB system, including WGs with PAM).
where
is computed by using (2). The parameters
t1 and
t2 are the initial and end time of the time window (i.e., time of fault occurrence and end simulation time) defined to compute the angle difference between any pair of synchronous generators of the system. The difference takes into account the deviation w.r.t. the steady-state angular value (i.e., computed in the initialization,
) of
.
The solution vector
x, shown in (6), comprises the parameters of all PAM controllers attached to the WGs that support the transient stability of the system, cf. (7).
where K
w-PAM and T
w-PAM are the gain and time constant of each washout filter, respectively. N
WG is the number of active PAM controllers. The minimum and maximum bounds (
xmin, and
xmax) of K
w-PAM and T
w-PAM were defined based on the reference values shown in [
15]. For the synthetic model of the GB system with 75% share from wind power generation, there are eight WGs equipped with PAM. The locations of these WGs are highlighted in
Figure 4 with red points, and they correspond with the zones 3, 5, 10, 13, 15, 16, 19, and 20 shown in
Figure 4. Therefore, the solution vector
x has 16 optimization variables (eight WGs, each one with two optimization variables, i.e., K
w-PAM and T
w-PAM).
The optimization problem defined by (3)–(7) is a bound constrained, non-linear, multi-modal, and single objective problem, with all optimization variables treated as real numbers. The evaluation of these equations entails a tremendous computational burden, because RMS time domain simulations should be run in every evaluation of the objective function (e.g., each simulation with 10 time window entails around 40 s by using DIgSILENT
TM PowerFactory
® version 2018 SP1). The solution of the problem is done by using a heuristic optimization algorithm. In existing literature of heuristic optimization, there are several types of algorithms that could be used for this purpose. Among these algorithms, the mean-variance mapping optimization algorithm is selected (MVMO) due to its outstanding performance in solving different types of computational expensive optimization problems [
16], including several applications to optimization problems in the field of power systems [
4,
17]. The optimal tuning of MVMO and a comparison of its performance (to solve the optimal tuning of PAM) against the performance of other competitive algorithms is being investigated and will be presented in a future publication. The basic notions of MVMO and its use to tackle the optimal tuning of PAM are concisely presented in the next sub-section.
4.2. Solution of the Optimization Based on MVMO Algorithm
MVMO is one of the emerging families of evolutionary optimization algorithms. Simply put, MVMO performs in an iterative manner to generate a new solution vector
x based on the fitness/objective function value associated with the previously evaluated solution vectors. Interested readers can find a detailed description of the general working principle of MVMO in [
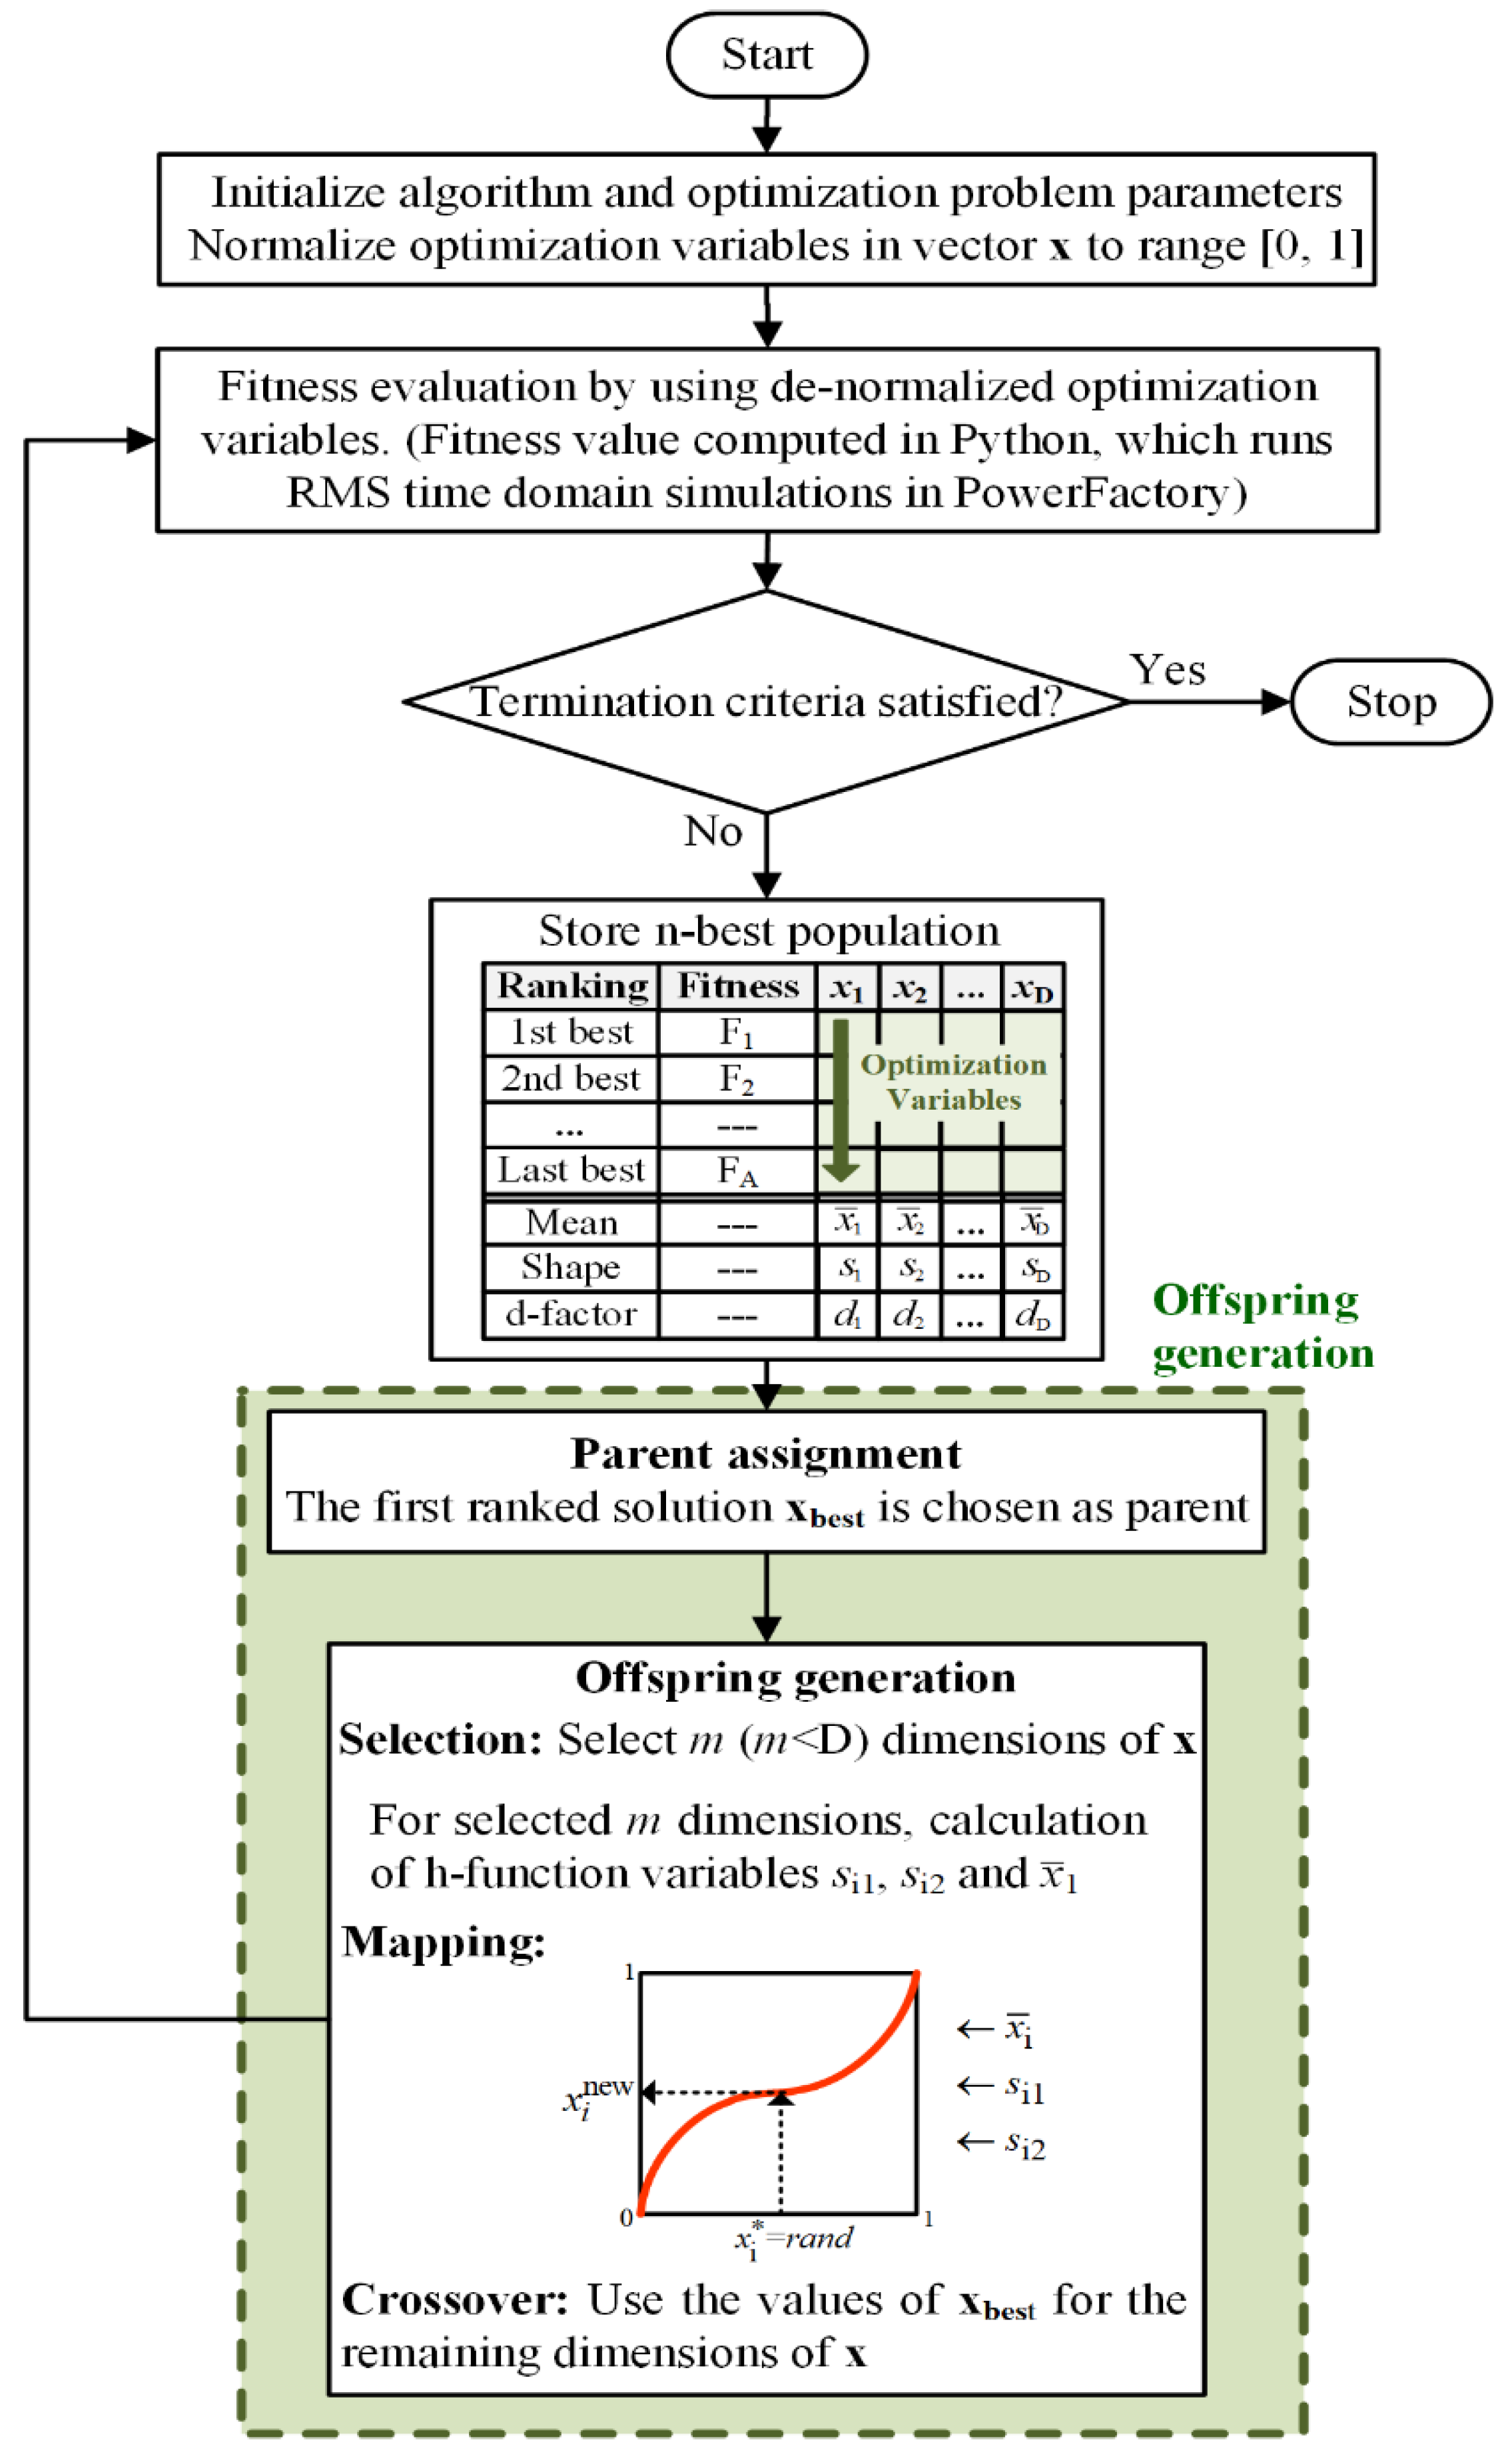
16]. In this paper, the emphasis in on the overview of the procedure based on MVMO to tackle the optimal tuning of PAM, which is illustrated in
Figure 10.
According to
Figure 10, the initial stage of MVMO concerns the generation of random values of the elements of the optimization vector
x. Each random value follows a uniform probabilistic distribution function, which is defined between the minimum (min) and maximum (max) bounds of the corresponding optimization variable. The initial solution vector
x is normalized, i.e., each random value is transformed from the original min-max scale into the range 0–1. The normalized solution vector is fed into the block of fitness evaluation, which has two internal functions: one function is used to de-normalize elements of the solution vector (i.e., K
w-PAM_i and T
w-PAM_i), whereas the other function is used substitute the values of K
w-PAM_i and T
w-PAM_i in the dynamic model of each WG with PAM, and to run the RMS time domain simulations needed to evaluate (3) and (4). A static penalty scheme is used to penalize the objective function value by adding a high value (e.g., 1 × 10
6) when (4) is not satisfied. The penalized objective function value constitutes the so-called fitness value.
Next, MVMO undergoes an iterative loop, encompassing all steps of its evolutionary mechanism [
16]. To generate a new solution vector, this mechanism (working within a normalized search space in the range 0–1) has an adaptive memory, implemented as a solution archive, which stores and ranks (based on the value of fitness) a small set (e.g., 3–5) of the best solution vectors found by MVMO among all previous function evaluations. The solution archive is updated throughout the function evaluations whenever a better fitness value is found for a newly generated solution vector. The first ranked best solution is the overall best solution vector generated so far, which is used to create a new solution vector. Some values (i.e., K
w-PAM_i and T
w-PAM_i) of the first ranked solution are kept in the new solution vector, whereas the remaining values are generated by using the so-called mapping function [
16]. The amount of elements and their indexes (positions) within the new solution vector that are generated via the mapping function are selected based on a quadratic function (evaluated as a function of the number of maximum function evaluations, and computed between the half of all the total number of optimization variables and only one optimization variable) and a random-sequential strategy, respectively [
16]. The iteration loop and the whole MVMO algorithm stops when a maximum number of fitness evaluations is done. Given the computationally expensive nature of the problem of optimal tuning of PAM, it was selected to have a maximum of 50 fitness evaluations, which is the same number of calculations of margin performed by parametric sensitivity in in
Section 3 (cf.
Table 1 and
Table 2), and it is also in line with the number of function evaluations that are usually selected as stop criteria in different competitions on computationally expensive optimization problems [
16]. The initialization, fitness evaluation, and iterative loop of MVMO are performed in Python™ 3.8, whereas the RMS simulations needed for fitness evaluation are done in DIgSILENT
TM PowerFactory
® version 2018 SP1.
The parameters used for MVMO to solve this optimization problem are listed in
Table 3. The selection of the parameters was based on a sensitivity analysis (i.e., evaluating a (3) and (4) to ascertain if there is improvement of fitness by changing the settings of MVMO). In
Table 3, the values of the parameters “scaling factor” and “number of the mutated variables” allow one to dynamically change the shape of the mapping function, as an adaptive operator to tune the balance between exploration (global search) and exploitation (local search) of MVMO throughout the optimization search process.
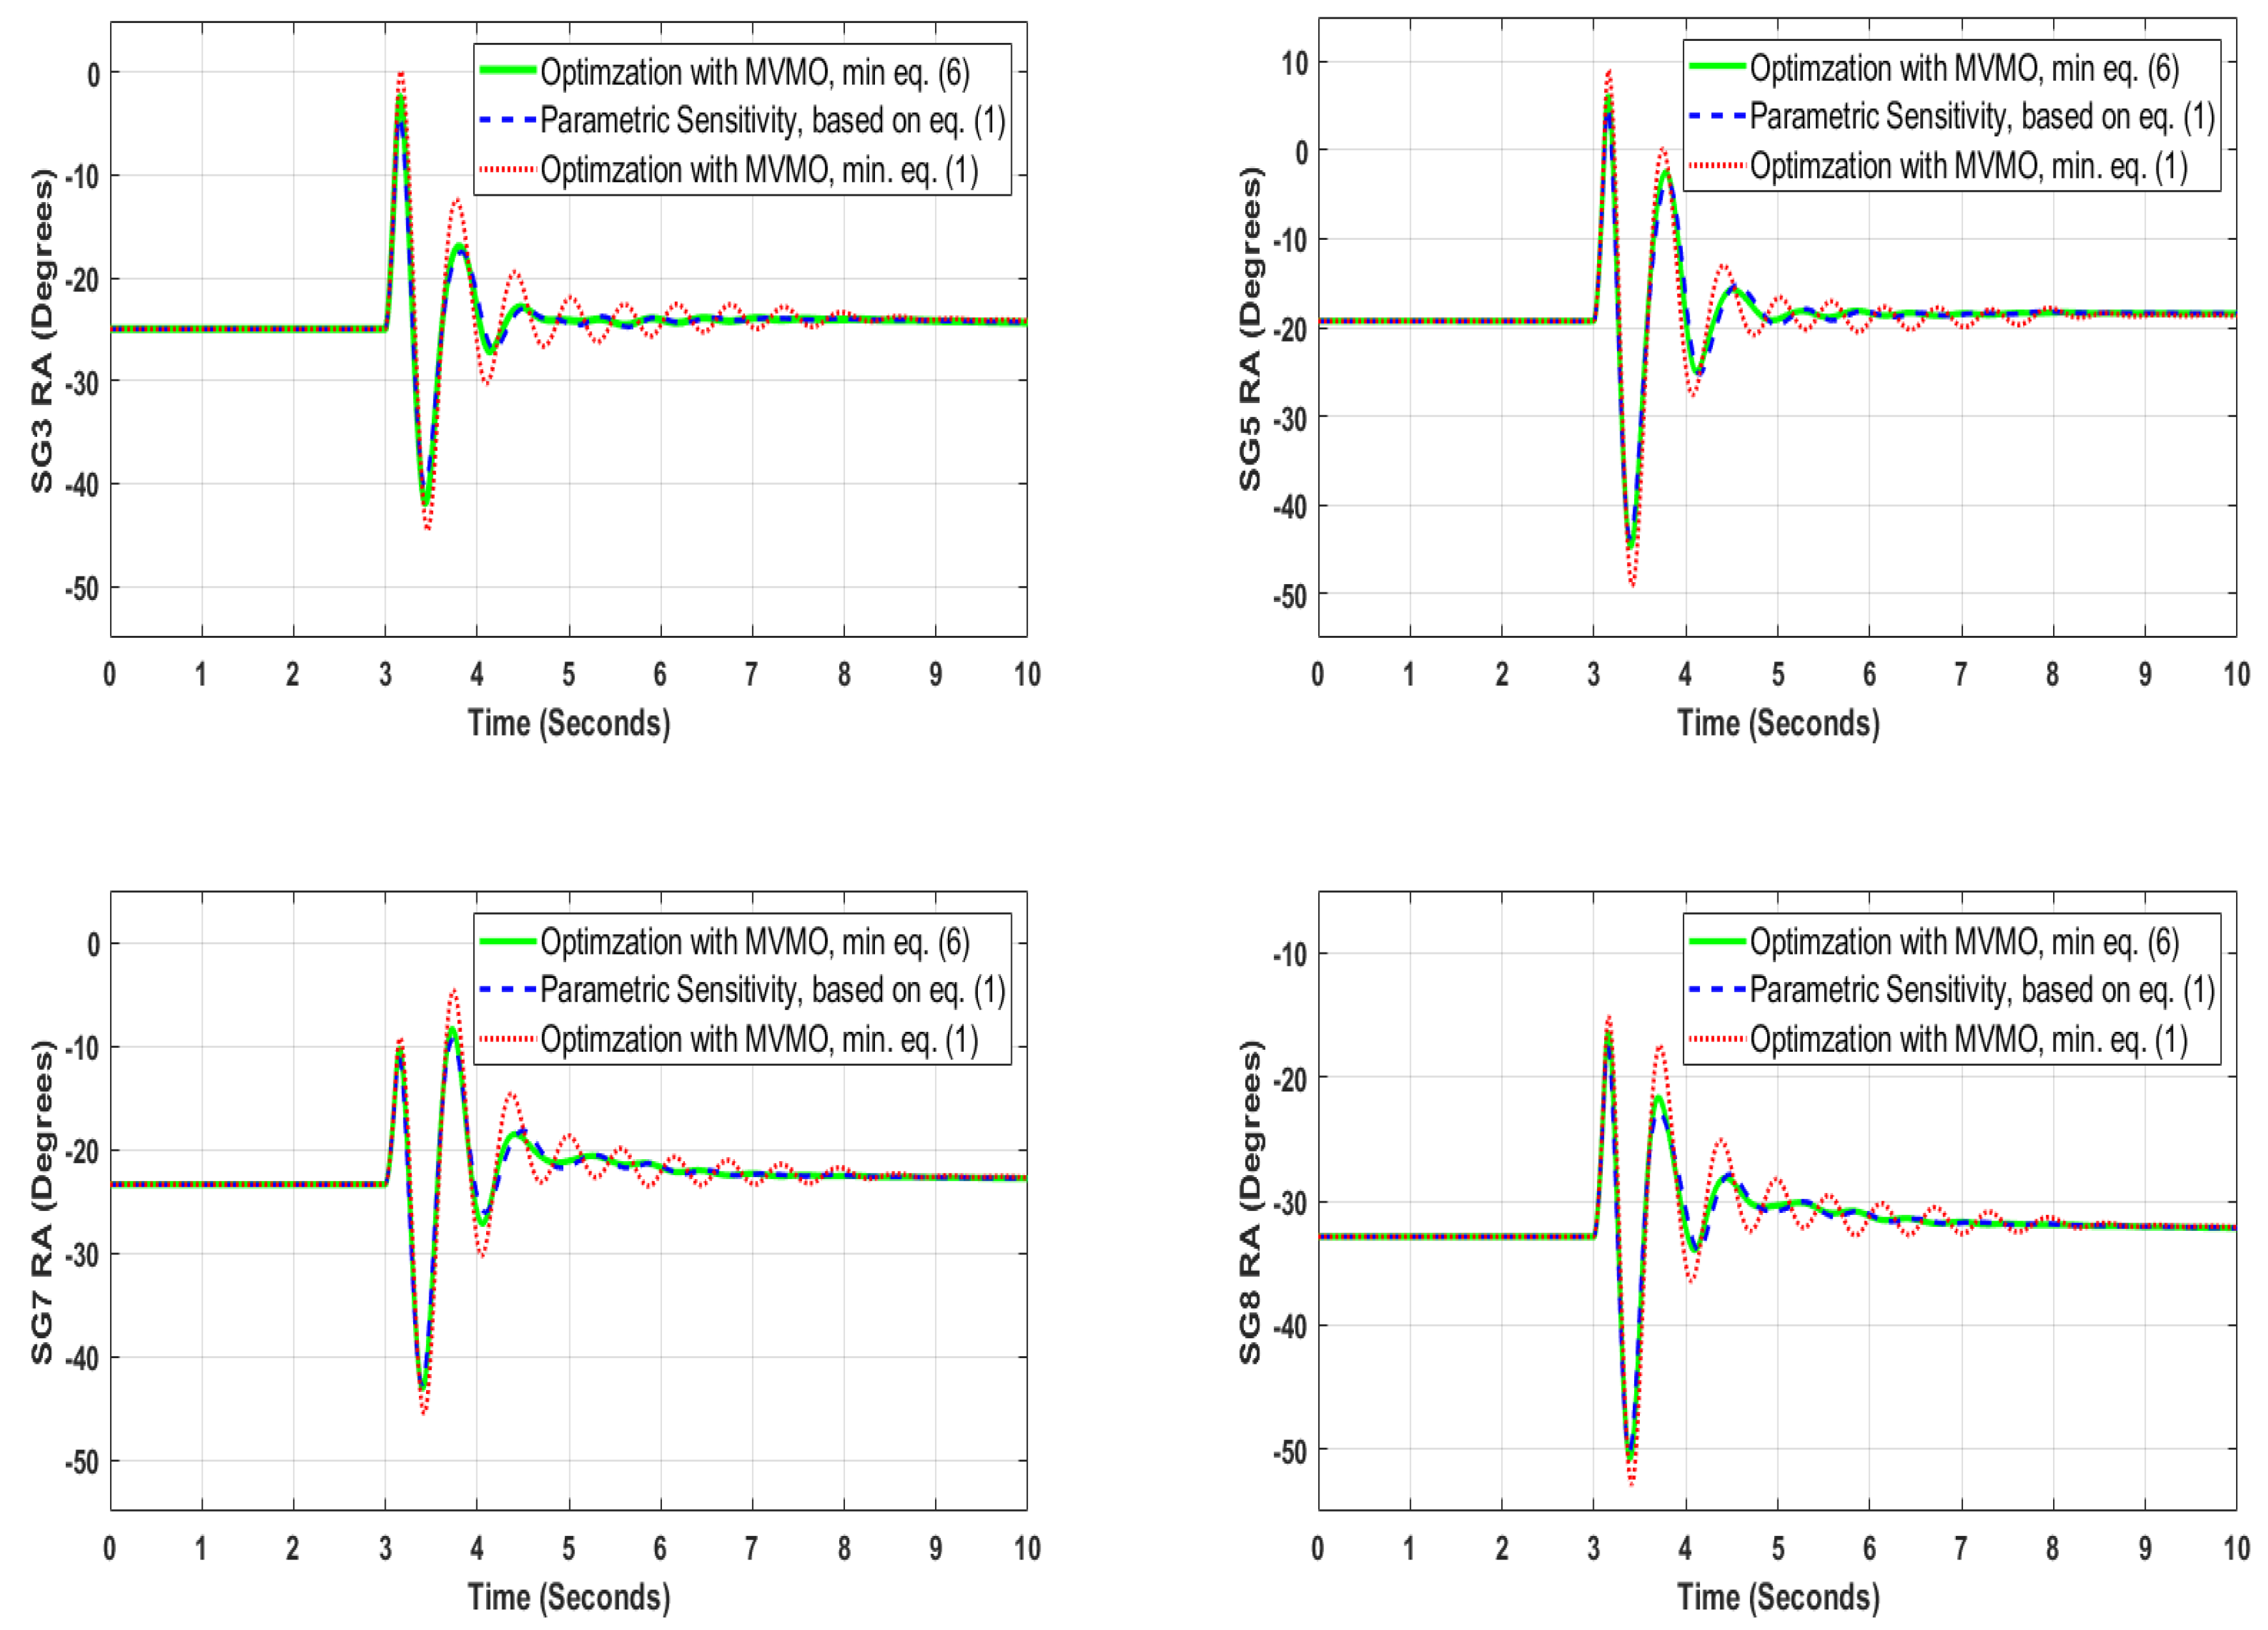
4.3. Optimization Results
Figure 11 shows the transient stability performance that can be achieved when the PAM controllers of the WGs are tuned based on parametric sensitivity (cf.
Section 4) or based on optimization by using the MVMO algorithm (cf.
Section 4.1 and
Section 4.2).
Note in
Figure 11 that the minimization of the objective function (3), when computed by using (6), entails the best transient stability performance, i.e., lowest amplitude of first rotor angle swing, and the highest damping of the subsequent rotor angle oscillations. The values of the PAM controllers found for this case are given in
Table 4. Note in
Table 4 that the PAM controllers of some WGs have relatively low gains, which entails that these WGs do not need to significantly spend kinetic energy to support the power system to effectively decrease the amplitude of the rotor angle oscillations. By contrast, the high gain value of the PAM attached to the large size wind power plants (e.g., WG19) entails that these plants will have to spend more kinetic energy within a very short time (i.e., in less than 5 s) to effectively support the power system to decrease the amplitude of the rotor angle oscillations. This is feasible because of their large value of installed capacity. These findings correspond with the insight on the fundamental working principles of PAM examined in [
5]. Besides,
Figure 11 shows that using the margin, cf. (1), as an objective function to be minimized within 50 function evaluations, is not a convenient option, because the best settings of the PAM controllers cannot be found to be effective (unlike the case when (6) is used as objective function) in improving the overall transient stability performance of the system. Finally,
Figure 11 also shows that the transient stability performance achieved by tuning the PAM controllers by parametric sensitivity is relatively similar to the performance achieved via optimal tuning with MVMO. It is important to point out, that the optimization-based tuning of PAM was done with a very reduced number of fitness evaluations, which is the same number of margin calculations done by the parametric sensitivity-based tuning of PAM. If the number of function evaluations of the optimization is increased, better settings of the PAM controllers will be achieved, which will entail a higher improvement of transient stability. These observations cannot be generalized and should be carefully investigated in other power systems (e.g., with different topologies, sizes, and shares of RES), to properly take into account the different dynamic properties of each power system.
5. Conclusions
This paper presented an investigation on the transient stability performance of power systems with high shares (e.g., around 75%) of wind generation. This investigation took into account two alternatives for transient stability support by wind generators: (i) the wind generators work under the principle of current control and are equipped with a PAM controller; (ii) the wind generators work under the principle of FLVC. The whole investigation was conducted based on a synthetic model of the Great Britain (GB) system.
The first part of the investigation addressed the tuning of the washout filters used in PAM or in FLVC based on the point of view of parametric sensitivity with the aim of achieving the best possible rotor angle margin indicator that reflects the degree of improvement of the overall transient stability performance. The tuning done, based on parametric sensitivity, indicated that relatively high gain values of the washout filters should be used in the case of current control supplemented by PAM control, whereas relatively low gain values of the washout filters should be used in the case of FLVC. In both cases, the time constant of the washout filters should have a low value. RMS time domain simulations showed these settings entail a similar transient stability performance when using either current control with PAM or FLVC. In view of this, the alternative of FLVC would be a more convenient choice for systems with high shares of RES, since, unlike the current control with PAM, the FLVC does not need wide area measurements to generate the input signal for the washout filters.
The second part of the investigation was devoted to the tuning of the washout filters through the solution of an optimization problem, which constitutes a bound constrained, non-linear, multi-modal, and single objective problem, with all optimization variables treated as real numbers. The problem is computationally expensive and was solved by using the MVMO algorithm. Furthermore, the optimization search of MVMO was done separately for two different options of objective function. The first option was based on the minimization of the margin indicator (like in parametric sensitivity), whereas the second option tackled the minimization of the time varying rotor angle deviations with respect to the pre-disturbance rotor angle positions. It was found out that the second option entails the best transient stability performance, i.e., lowest amplitude of first rotor angle swing and the highest damping of the subsequent rotor angle oscillations. Remarkably, the MVMO-based tuning of the PAM controllers allowed one to optimally allocate the contributions (i.e., identification of the most suitable values of the gains and time constants of the washout filters) of the involved wind generators, taking into account their installed capacity and electrical distance to the nearest vulnerable (i.e., risk of losing synchronism when a large disturbance occurs) synchronous generators. The optimal tuning is important to ensure that the necessary and feasible amount of kinetic energy of the wind generators is quickly and effectively deployed to timely safeguard the overall transient stability performance of the power system with high shares of wind generation.
The same computing budget (i.e., running a maximum of 50 RMS time domain simulations) used in the parametric sensitivity-based tuning as reference, a computing budget) was also considered in the application of MVMO to perform the optimal tuning by using any of the two options of objective function. RMS time simulations showed that the transient stability performance achieved by tuning the PAM controllers by parametric sensitivity is relatively similar to the performance achieved via optimal tuning with MVMO. Nevertheless, if the number of function evaluations of the optimization is increased, better settings of the PAM controllers can be achieved, which can also entail a higher improvement of transient stability. Please note that these observations cannot be generalized, and they should be carefully investigated in other power systems (e.g., with different topologies, sizes, and shares of RES), to properly take into account the different dynamic properties of each power system. Therefore, ongoing and future research studies are directed to cover various important aspects such as: (i) the inclusion of the parameters concerning with communication time delays and other control loops of the grid side converter of the wind generators in the optimization problem; (ii) the use and proposition of other transient stability indicators in the formulation of the optimization problem; and (iii) an improvement of the optimization search within an even smaller computing budget (which is very important if multiple operating conditions, topologies, and disturbances are taken into account).
Author Contributions
Conceptualization, A.P. and S.P.; Formal analysis, A.P.; Investigation, A.P.; Methodology, A.P. and S.P.; Resources, J.L.R.T.; Software, A.P.; Supervision, J.L.R.T., P.P., M.v.d.M., and F.G.-L.; Validation, J.L.R.T.; Visualization, A.P. and J.L.R.T.; Writing—original draft, S.P., A.P. and J.L.R.T.; Writing—review & editing, A.P. and J.L.R.T. All authors have read and agreed to the published version of the manuscript.
Funding
This research was carried out as part of the MIGRATE project. This project has received funding from the European Union’s Horizon 2020 research and innovation program under grant agreement No 691800.
Acknowledgments
This research was carried out as part of the MIGRATE project. This project has received funding from the European Union’s Horizon 2020 research and innovation program under grant agreement No 691800. This reflects only the authors’ views, and the European Commission is not responsible for any use that may be made of the information it contains.
Conflicts of Interest
The authors declare no conflict of interest. The funders had no role in the design of the study; in the collection, analyses, or interpretation of data; in the writing of the manuscript, or in the decision to publish the results.
Abbreviations
| WG | Wind Generator |
| SG | Synchronous Generator |
| PAM | Power-Angle Modulation |
| PCC | Point of Common Coupling |
| FRT | Fault ride-through |
| MVMO | Mean-variance mapping optimization |
| FLVC | Fast local voltage control |
| GB | Great Britain |
References
- Kumar, S.; Madlener, R. Renewable energy roadmap for central Europe until 2050: A scenario based techno-economic analysis. In Proceedings of the 2016 21st Century Energy Needs—Materials, Systems and Applications (ICTFCEN), Kharagpur, India, 17–19 November 2016; pp. 1–6. [Google Scholar]
- Breithaupt, T.; Tuinema, B.; Herwig, D.; Wang, D.; Hofmann, L.; Torres, J.L.R.; Mertens, A.; Rüberg, S.; Meyer, R.; Sewdien, V.; et al. Deliverable D1.1: Report on Systemic Issues. Public Deliverable of the MIGRATE (Massive InteGRATion of Power Electronic Devices) Project. December 2016. Available online: https://www.h2020-migrate.eu/downloads.html (accessed on 13 August 2020).
- National Grid. Technical Report on the Events of 9 August 2019. September 2019. Available online: https://www.nationalgrideso.com/document/152346/download (accessed on 20 January 2020).
- Wang, D.; Torres, J.L.R.; Rakhshani, E.; van der Meijden, M. MVMO-based identification of key input variables and design of decision trees for transient stability assessment in power systems with high penetration levels of wind power. Front. Energy Res. 2020, 8. [Google Scholar] [CrossRef]
- Perilla, A.; Torres, J.L.R.; Papadakis, S.; Rakhshani, E.; van der Meijden, M.; Gonzalez-Longatt, F. Power-angle modulation controller to support transient stability of power systems dominated by power electronic interfaced wind generation. Energies: Special issue hybrid AC/DC transmission grids. Energies 2020, 13, 3178. [Google Scholar] [CrossRef]
- Energynautics. MIGRATE Project, Type-3 and Type-4 EMT—Model Documentation, Internal Technical Report; Energynautics: Darmstadt, Germany, 2017. [Google Scholar]
- Erlich, I.; Korai, A.; Neumann, T.; Zadeh, M.K.; Vogt, S.; Buchhagen, C.; Rauscher, C.; Menze, A.; Jung, J. New control of wind turbines ensuring stable and secure operation following islanding of wind farms. IEEE Trans. Energy Convers. 2017, 32, 1263–1271. [Google Scholar] [CrossRef]
- Rüberg, S.; Sewdien, J.L.V.; Torres, E.R.; Rakhshani, D.; Wang, B.; Tuinema, N.; Farrokhseresht, D.; Gusain, A.; Perilla, J.; Jimenez, M.; et al. Deliverable D1.6: Demonstration of Mitigation Measures and Clarification of Unclear Grid Code Requirements. Public Deliverable of the MIGRATE (Massive InteGRATion of Power Electronic Devices) Project. December 2019. Available online: https://www.h2020-migrate.eu/downloads.html (accessed on 13 August 2020).
- IEC. Wind Turbines—Part 27-1: Electrical Simulation Models—Wind Turbines, Technical Report, 1st ed.; IEC 61400-27-1; IEC: Geneva, Switzerland, 2015. [Google Scholar]
- Weise, B. Impact of K-factor and active current reduction during fault-ride-through of generating units connected via voltage-sourced converters on power system stability. IET Renew. Power Gener. 2015, 9, 25–36. [Google Scholar] [CrossRef]
- Clark, K.; Miller, N.W.; Sanchez-Gasca, J.J. Modeling of GE Wind Turbine Generators for Grid Studies—Version 4.5. 2010. Available online: https://www.researchgate.net/profile/Kara_Clark/publication/267218696_Modeling_of_GE_Wind_Turbine-Generators_for_Grid_Studies_Prepared_by/links/566ef77308ae4d4dc8f861ef.pdf (accessed on 13 August 2020).
- Muljadi, E.; Samaan, N.; Gevorgian, V.; Li, J.; Pasupulati, S. Short circuit current contribution for different wind turbine generator types. In Proceedings of the IEEE Power and Energy Society General Meeting, Providence, RI, USA, 25–29 July 2010; pp. 1–8. [Google Scholar]
- Erlich, I.; Korai, A.; Shewarega, F. Study on the minimum share of conventional generation units required for stable operation of future converter-dominated grids. In Proceedings of the 2018 IEEE Power & Energy Society General Meeting (PESGM), Portland, OR, USA, 5–10 August 2018; pp. 1–5. [Google Scholar]
- MIGRATE (Massive InteGRATion of Power Electronic Devices) H2020 Project. Internal Deliverable D1.2: Power System Analysis and Key Performance Indicators. Technical Report. January 2018; Unpublished. [Google Scholar]
- Rueda, J.L.; Cepeda, J.C.; Erlich, I. Probabilistic approach for optimal placement and tuning of power system supplementary damping controllers. IET Gener. Transm. Distrib. 2014, 8, 1831–1842. [Google Scholar] [CrossRef]
- Rueda, J.L.; Erlich, I. Hybrid single parent-offspring MVMO for solving CEC2018 computationally expensive problems. In Proceedings of the 2018 IEEE Congress on Evolutionary Computation (CEC), Rio de Janeiro, Brazil, 8–13 July 2018; pp. 1–8. [Google Scholar]
- Rueda, J.L.; Carvalho, L.; Miranda, V.; Erlich, I.; Theologi, A.M.; Lee, K.Y. OPF Test Bed and Performance Evaluation of Modern Heuristic Optimization Algorithms. In IEEE Press Book: Application of Modern Heuristic Optimization Methods in Power and Energy Systems; Lee, K.Y., Vale, Z.A., Eds.; John Wiley & Sons Inc.: Hoboken, NJ, USA, 2020; ISBN 978-1-119-60231-6. [Google Scholar]
© 2020 by the authors. Licensee MDPI, Basel, Switzerland. This article is an open access article distributed under the terms and conditions of the Creative Commons Attribution (CC BY) license (http://creativecommons.org/licenses/by/4.0/).

 ,
, 


