Abstract
A model hydrochar was synthesized from glucose at 180 °C and its Cu(II) sorption capacity was studied experimentally and computationally as an example of molecular-level adsorbent design. The sorption capacity of the glucose hydrochar was less than detection limits (3 mg g−1) and increased significantly with simple alkali treatments with hydroxide and carbonate salts of K and Na. Sorption capacity depended on the salt used for alkali treatment, with hydroxides leading to greater improvement than carbonates and K+ more than Na+. Subsequent zeta potential and infrared spectroscopy analysis implicated the importance of electrostatic interactions in Cu(II) sorption to the hydrochar surface. Computational modeling using Density Functional Theory (DFT) rationalized the binding as electrostatic interactions with carboxylate groups; similarly, DFT calculations were consistent with the finding that K+ was more effective than Na+ at activating the hydrochar. Based on this finding, custom-synthesized hydrochars were synthesized from glucose-acrylic acid and glucose-vinyl sulfonic acid precursors, with subsequent improvements in Cu(II) adsorption capacity. The performance of these hydrochars was compared with ion exchange resins, with the finding that Cu(II)-binding site stoichiometry is superior in the hydrochars compared with the resins, offering potential for future improvements in hydrochar design.
1. Introduction
According to the World Health Organization (WHO), approximately 785 million people lack access to clean drinking water, mainly in poor countries [1], but also in some rural and even highly urbanized areas [2] in the developed world. Heavy metal contamination of the water supply is a persistent problem that dates back to antiquity [3], and some researchers speculate that lead contamination of the water supply may have played a role in the downfall of the Roman empire [3]. More recently, Fernández-Luqueño et al. [4] summarized the health effects of heavy metals, listing their contributions to disease ranging from cancer to lung failure. Despite widespread acknowledgement of these negative human health outcomes, providing uniform access to drinking water free of heavy metal contamination has proven remarkably difficult to achieve, as evidenced by recent widely reported examples [2].
Different technologies have been developed to remove heavy metals from water [5] including precipitation [5,6,7], sedimentation [8], flotation [8,9], membrane processes [8,10,11,12], electrochemical processes [13,14,15], adsorption [16,17], and ion exchange [18,19]. Most of these technologies are either costly, wasteful, reliant on non-renewable resources, energy inefficient, or unable to achieve sufficiently low levels of metal concentration on their own. Of the available options, adsorption and the kindred technique of ion exchange are energy efficient and capable of achieving suitably low metal concentrations [20]. However, commercial adsorbents and ion exchange resins are derived from non-renewable resources, either petrochemicals or coal, meaning that their use has associated negative environmental impacts, creating a tradeoff between clean drinking water and mitigating climate change [21]. Accordingly, development of renewable, cost-effective, and high-capacity metal adsorbates has potential to greatly expand access to clean drinking water while minimizing other negative environmental impacts [22,23].
Recently, pyrolysis biochar has emerged as a renewable sorbent for heavy metal removal [24,25]. Unlike most activated carbons, which are produced from coal, pyrolysis biochar is produced from biomass or agricultural wastes [26]. In some cases, heavy metal capacity on biochar can reach 40 mg g−1, which is comparable with activated carbons (20–80 mg g−1) [25] or ion exchange resin capacity (20–30 mg g−1) [25]. Surface precipitation and electrostatic interactions are thought to be the key adsorption mechanisms onto biochar, and abundant oxygenated functional groups (OFG) are associated with effective cation adsorption [27,28]. Unfortunately, pyrolysis at typical conditions (>400 °C) tends to be ineffective for OFG formation, meaning that biochar must usually be activated to increase its adsorption capacity [29]. Various activation procedures can increase the sorption capacity of biochar, but only by adding cost, energy use, or waste generation [30]. Lastly, pyrolysis is performed in the vapor phase and requires a dry feedstock, negatively impacting the process energy balance for utilization of abundant wet wastes [31,32].
Hydrothermal carbonization (HTC) [33,34,35] of carbon-rich feeds, including carbohydrates, biomass, and food waste, at moderate temperature (130–250 °C) and autogenous pressures is a versatile, low-energy, and renewable way to produce carbon-rich materials with abundant OFGs that are known as hydrothermal chars (hydrochars) [36,37]. Possibly due to the abundance of OFGs present in hydrochars, they have greater metal sorption capacity than most pyrolysis biochars, making them especially attractive for drinking water purification [5,38,39]. For example, Regmi et al. [33] reported a hydrochar with greater Cu(II) sorption capacity than conventional activated carbon (4.8 compared with 1.8 mg g−1) [39]. Similarly, HTC compatibility with wet feeds eliminates the need for drying, benefiting process-level energy balance especially for agricultural and food waste streams [40,41].
Although HTC is a promising technology, process costs and uncertainties must be reduced to de-risk further investment [42]. Similarly, HTC can benefit by maximizing its value, which in the case of sorbent manufacture, can be accomplished by maximizing hydrochar sorption capacity [16]. Accordingly, a persistent mystery in the field of hydrochar sorption is the high capacity that the material has for metal cations despite its relatively low (<10 m2 g−1) measurable surface area. For this reason, many reports describe methods to increase hydrochar surface area [29,37,43]. Unfortunately, hydrochar activation to increase surface area again produces wastes and requires energy; moreover, the resulting capacity of the activated material often decreases on a per area basis; for example, Jain et al. [44] reported that the phenol capacity of activated carbon produced from hydrochar decreased with increasing surface area, from 0.16 to 0.13 mg g−1 [16].
While pyrolytic treatment and various chemicals can increase hydrochar sorption capacity, immersion in an alkali solution at room temperature reportedly increases OFG abundance and heavy metal adsorption capacity with minimal energy requirements while generating minimal amounts of waste [28,33,37]. The mechanism of the alkali-treatment promotion effect is not clear since mild alkali treatment does not increase hydrochar surface area [45], and the conditions are not sufficient to make or break covalent bonds. Moreover, alkali treatment is sometimes reported as a necessary step for hydrochar to exhibit any heavy metal sorption capacity [29,37], while for others, alkali treatment is not reported [33]. Understanding alkali treatment is, therefore, one goal of this work.
Complicating analysis further, hydrochar OFG abundance, and sorption capacity vary depending on the properties of the feed and reaction conditions. Guo et al. [46,47] have shown that, starting with a lignocellulosic raw material, a hydrochar can be produced with greater OFG abundance than produced from carbohydrate precursors. For example, HTC from wood (initially consisting of 52.7 wt% C) produces a hydrochar with 77 wt% C [48], whereas the carbon content of hydrochar produced from glucose typically contains 53–62 wt% C [49]. Hydrochar OFG abundance tends to decrease with increasing reaction conditions such as reaction time, temperature, and water-to-biomass ratio [46,47,48]. For many feeds [50,51,52,53,54], HTC can be performed over the temperature range from 160–180 °C and at reaction times <12 h to promote formation of OFGs. More aggressive conditions (≥200 °C) are preferred for other applications [55].
The relationship between feed properties, reaction conditions, and sorption capacities provides an opportunity to synthesize a hydrochar tailor-made for a specific application, such as heavy metal adsorption. For example, Demir-Cakan et al. [56] reported that co-HTC of glucose and acrylic acid produced a hydrochar with exceptionally high OFG abundance; the resulting materials exhibited sorption capacities up to 350 mg g−1 for Pb(II) and 90 mg g−1 for Cd(II). In comparison, Xue et al. [16] reported peanut-hull based hydrochar sorption capacity for Cd(II) as 12.38 mg g−1.
Ideally, hydrochars could be designed for a specific application at the molecular level. Computational methods have proven effective at understanding sorption mechanisms and thereby enabling the molecular level design of metal-organic frameworks for sorption of perfluoroalkyl substances [57], nanopores for CO2 adsorption [58], and ion exchange resins and activated carbon for heavy metal sorption [59,60]. Density Functional Theory (DFT) is an especially valuable tool for studying the geometry and energetics of sorbate binding to the active site, provided that molecular structures are known that can be used as targets of rational design. Unfortunately, the structural models of hydrochar have only recently converged [61,62,63], making attempts at molecular level design or computational modeling of sorbate-sorbent binding difficult until now.
Recent work by Brown et al. [61] reconciled several disparate models proposed for the structure of hydrochar synthesized from glucose. Previous models inferred from infrared spectroscopy and Raman microscopy [62,64] indicated that hydrochar structures resembled activated carbon and consisted of fused aromatic cores, comprised of many aromatic rings and with OFGs present primarily as side chains. In contrast, solid-state Nuclear Magnetic Resonance (NMR) [65] and Near-Edge X-ray Absorption Fine Structure (NEXAFS) [63] indicate a structure consisting primarily of individual furan and arene groups, polymerized via short alkyl chains, and decorated with OFGs. Brown et al. [61] recognized that previously reported Raman spectra of hydrochar contained artifacts due to laser-induced pyrolysis of the hydrochar material, causing it to collapse into a condensed aromatic structure. DFT simulation of hydrochar Raman vibrations [61] then indicated that artifact-free Raman spectra were indeed consistent with the furan-arene polymer previously inferred from NMR and NEXAFS [62,63,64,66]. This paves the way for a molecular-level study of metal binding to hydrochar as a furan-rich polymer, thereby enabling rational design of hydrochar.
The objective of this work was molecular-level design of a hydrochar adsorbent using both experiments and simulation. To focus on generalizable mechanisms, we studied a model hydrochar synthesized from glucose for sorption of a model heavy metal, Cu(II) cations. Sorption capacity was studied before and after alkali treatment and compared with capacities measured for several activated carbon materials. Similarly, the hydrochar was characterized for OFG type and density using Fourier transforms-infrared spectroscopy (FT-IR), solid-state titration, and zeta potential measurement. Metal-hydrochar binding interactions and geometries were evaluated using DFT simulations. Chars with different types and/or densities of OFGs and other metal binding groups were custom synthesized for comparison with glucose hydrochar. The experimental and simulation results described here establish a new method for the rational design of hydrochar sorbents at the molecular level.
2. Materials and Methods
2.1. Materials
All reagents were analytical grade, including: D-(+)-glucose (99.5%-Sigma Aldrich), acrylic acid monomer (99.0%-TCI chemicals), vinyl sulfonic acid (99.0%-TCI Chemicals), hydrochloric acid (0.1 M, 99.0%-Acros), sodium hydroxide (0.1 M, 95.0%), and the anhydrous salts sodium carbonate (99.5%-Sigma Aldrich), sodium hydroxide (97.0%-EM Science), potassium carbonate (99.0%-Alfar Aesar), and potassium hydroxide (85%-Sigma Aldrich). The carbon materials were donations from Norit (since acquired by Cabot) and MeadWestvaco. Specific activated carbon samples included wood-based carbons, Norit Darco® KB-G, Norit Darco® KB-WJ and Nuchar® (MeadWestvaco), and a peat-based carbon, Norit® SX-1. Amberlyst® 15 was used in its hydrogen form and AG® 50 W-X4 in its hydrogen form was purchased from Bio-Rad. Cu(NO3)2 · 2.5 H2O and elemental standards, 5% HNO3, 10 µg/mL were acquired from PerkinElmer. Deionized (DI) water was purified to a minimum resistivity of 17.9 MΩ cm prior to use.
2.2. Hydrochar Synthesis
Hydrochar was prepared from a precursor solution formed by dissolving 28.152 g of D-(+)-glucose in 100 mL of DI water. The solution was loaded into a 160 cm3 PTFE-lined, stainless-steel autoclave, which was then placed in a room-temperature oven that was heated to 180 °C at a heating rating of approximately 10 °C min−1, held at 180 °C for 8 h, before allowing to cool for 12 h. The reaction protocol was selected to replicate those that favor OFG generation, as reported previously by Brown et al. [61] and others [46]. After reaction, the resulting slurry was mixed first with a solution of 100 mL of ethanol and 100 mL of water, and then filtered to remove soluble organic materials from the solid hydrochar. The solid hydrochar was recovered by filtration and rinsed again with ethanol and water. The washing and filtering steps were repeated twice. The hydrochar was then placed in a crucible, dried in an oven at 65 °C for 24 h, and stored in airtight vials before further analysis or use.
Functionalized hydrochars were custom synthesized by preparing a precursor solution consisting of glucose and either acrylic acid or vinyl sulfonic acid and subjecting it to a modified HTC treatment. For the synthesis of acrylic acid-hydrochars (AA-hydrochar), the precursor solution consisted of 10 g of glucose, 10 g of acrylic acid, and 80 g of DI water. The HTC reaction time was extended to 16 h for AA-hydrochar synthesis (at 190 °C), as 8 h reaction time yielded a material that could not be recovered by filtration [56]. For synthesis of vinyl sulfonic acid-hydrochars (VSA-hydrochar), the precursor solution consisted of 36.1 g of glucose, 7.22 g of vinyl sulfonic acid, and 150 mL of water. After some preliminary trials to evaluate the effects of reaction temperature and time on hydrochar yield, the synthesis of VSA-hydrochar was performed at 190 °C for 24 h to yield a solid that could be recovered by filtration. As described previously for hydrochar, both AA-hydrochar and VSA-hydrochar were recovered by filtration, with ethanol and water washing, and oven drying at 65 °C.
Hydrochars were activated by mixing 2.0 g of the synthesized material with 500 mL of alkali solution (2 N). The effects of alkali solutions of Na2CO3, K2CO3, NaOH, KOH were evaluated. After several hours at room temperature, the material was recovered by filtration, and placed in DI water where the pH was neutralized by dropwise addition of HCl (1 N) and NaOH (1 N) until the pH stabilized. The final product was washed 3 times with DI water, dried in a 100 °C oven, ground, and stored in airtight glass vials.
2.3. Hydrochar Characterization
The surface areas of the samples were determined by N2 physisorption at 77 K on a Micromeritics ASAP 2000 apparatus, using N2 as adsorbate. N2 physisorption on similar instruments has been reported in more detail elsewhere [67]. Surface areas were determined using the Brunauer–Emmett–Teller (BET) model [68]. Prior to adsorption-desorption experiments, all the samples were degassed at 120 °C for 12 h.
Diffuse Reflectance Infrared Fourier Transform Spectroscopy (DRIFTS) was performed on powder samples using a Thermo-Fisher FT-IR 6700 with DRIFTS accessory, described previously in the literature [69]. The spectral resolution was 2 cm−1 and all samples were purged with N2 gas for 2 min before analysis to exclude atmospheric CO2 and H2O from the sample space. A background spectrum was obtained prior to each measurement and results were obtained by scanning 1024 times and taking their average. Spectra were analyzed using MagicPlot software and plotted by normalization with the baseline.
Zeta potential measurements were determined using a zeta meter (Malvern Zetasizer-Nano-Z) that has been previously described elsewhere [70]. For each test, 0.005 g of the solid sample was suspended in 100 cm3 of de-ionized water containing 0.1 N NaCl followed by homogenization for 2 h in an ultrasonic bath. After ultrasonication, the aqueous suspension was equilibrated at different pH values for 30 min. Zeta potential results are reported as the average and standard deviation of three measurements.
The combined densities of strong and weak acid groups were determined using the Boehm titration method, described previously in the literature [29,71,72]. In brief, a carbon sample (0.5 g) was placed in NaHCO3 solution (20 mL, 0.1 N), agitated for 48 h, and the carbon was removed by filtration. The resulting filtrate was degassed for at least 30 min using N2 to remove CO2 and was then titrated to determine the acid site density of carbon-rich materials [73].
2.4. Hydrochar Adsorption Tests
For single-point Cu(II) cation adsorption tests, 0.2 g of sorbent was suspended in 10 mL of an aqueous solution of Cu(II) (0.08 M) and placed within an high density polyethylene sample vial (Celltreat). Initially, the supernatant liquid was clear and pale blue, a consequence of the Cu(II) present in the mixture. The resulting slurry was agitated at room temperature using a wrist-action shaker (Burrell) for 24 h. Preliminary tests indicated that adsorption equilibrium was reached after 12 h. After shaking and centrifugation, the supernatant liquid remained clear and the pale blue coloration was visibly fainter. The hydrochar was discarded and Cu(II) concentrations in the supernatant liquid were measured using a Perkin Elmer, Nexion 350 × Inductively Coupled Plasma (ICP) spectrometer. The ICP response was calibrated using standard solutions. Samples were diluted prior to each measurement to ensure that the concentration fell within the pre-determined calibration range. Adsorption capacity was then estimated using the initial () and final () Cu(II) concentrations and the mass of sorbate ():
Each adsorption measurement was performed at least in duplicate and ICP concentration measurements were performed in triplicate. Average values are reported here. Control runs were performed in the absence of sorbent and the loss to the vial was equivalent to <1 mg g−1 of sorbent.
2.5. Computational Modeling
DFT simulations were performed to study cation-hydrochar binding energies and geometries. The proposed hydrochar structures were modeled using DFT with the Gaussian 09 program [74] run via WebMO [75]. All the geometries were optimized using the Becke, 3-parameter, Lee–Yang–Parr (B3LYP) [76,77] hybrid functional, with the 6–311+G(d,p) basis set. Because the physical experiments included a water solvent, the polarizable continuum model (PCM) [78] was chosen to implicitly include the solvent in these calculations, assuming its dielectric constant was equal to 78. Model adsorption reactions were modeled and compared with one another to determine their energies and relative favorability. For each adsorption reaction, the products were hydrochar with a bound copper atom, and the respective ion, either hydrogen, sodium, or potassium, in solution. Multiple initial configurations were studied to confirm that the final geometry captured a global minimum, rather than a local one.
3. Results and Discussion
The objective of this study development of rational methods to design hydrochar for heavy metal adsorption at the molecular level [79]. The study consists of several components: (1) measurements of sorption capacity of glucose hydrochar and comparison with activated carbon; (2) characterization and DFT modeling of glucose hydrochar; (3) custom-synthesis of hydrochars with tailored heavy metal capacity.
3.1. Glucose Hydrochar Sorption Capacity and Characterization
As a starting point, hydrochar was synthesized from a glucose precursor solution. The base structure of glucose hydrochar was recently reconciled between several models [61,62,63], with the finding that it consists of a furan-rich polymer decorated with OFG groups. Accordingly, and following previous reports, we hypothesized that the OFG groups would encourage heavy metal sorption. Unfortunately, glucose hydrochar exhibited negligible Cu(II) sorption capacity, <3 mg g−1, as shown in Table 1. The negligible Cu(II) capacity measured for glucose hydrochar seemingly contradicted previous literature descriptions of hydrochar absorption capacity [80,81,82], thus, motivating further examination.

Table 1.
Adsorption Capacity and Surface Area of Hydrochar and Activated Carbon. BET = Brunauer–Emmett–Teller model.
Sun et al. [37] reported that alkali treatment increased the sorption capacity of hydrochar by 2–3 times, motivating the study of alkali treatment in the current study. As shown in Table 1, alkali treatment greatly increased the Cu(II) capacity, by at least an order of magnitude compared with the original glucose hydrochar. Several different bases were evaluated, with the finding that strong bases (hydroxides) outperformed weak ones (carbonates) and that bases featuring the potassium cation outperformed ones possessing sodium.
We compared the capacity of alkali-activated glucose hydrochar with several different activated carbons (Table 1), selected to cover a range of properties [83]. Interestingly, the activated carbons exhibited much greater sorption capacity than glucose hydrochar without activation, but less capacity than their alkali-activated forms. Alkali treatment was evaluated for two of the activated carbons, and it was found that the treatment either had no effect (Norit® SX1) or even negative effect (Nuchar®) on sorption capacity. The different response to alkali treatment observed for activated carbon and hydrochar clearly points to differences in the mechanism that must be understood for molecular-level hydrochar design.
To understand the adsorption results presented in Table 1, surface areas were measured using N2 sorption and the BET isotherm fitting method. Consistent with previous reports [29,37,43], the measured BET surface area of hydrochar was <10 m2 g−1. Alkali treatment had no effect on the measured hydrochar surface area, allowing us to reject the hypothesis that the effect of the treatment was to open up the hydrochar pore structure [82,84]. Similarly, consistent with previous reports [83], the BET surface areas of the activated carbons were >800 m2 g−1 and not affected by the dilute alkali treatment. Accordingly, while the capacity of glucose hydrochar is comparable to activated carbon on a mass basis, on a surface area basis the capacity is orders of magnitudes greater. This observation clearly points to a specific hydrochar-sorbate interaction that can be engineered to maximize adsorption.
The strongest common sorbate-hydrochar interaction is electrostatic [85], which can be understood as the interaction between the positively charged metal cation and negatively charged functional groups on the hydrochar surface. Accordingly, as a way to understand and quantify hydrochar surface charge, we measured hydrochar zeta potential before and after alkali activation and over a wide range of pH, from 2–12. Figure 1 presents the results, showing that zeta potential of alkali activated hydrochar was much more negative in the pH range of interest (pH < 7) than the parent hydrochar. Under strongly alkali pH, the zeta potential of the parent and the alkali treated material are the same to within the limits of experimental uncertainty, which is consistent with expectations given that the alkali treatment is simply immersion in an alkali solution with pH > 9.
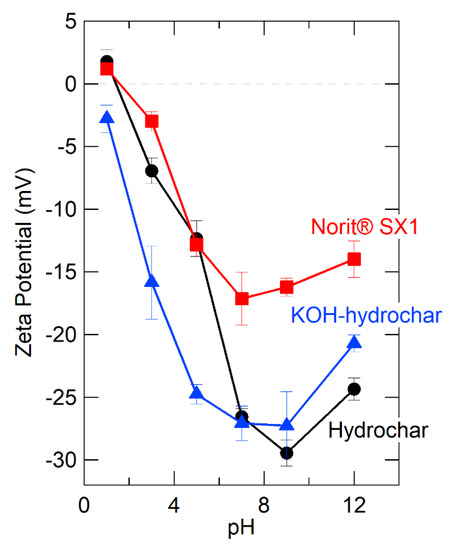
Figure 1.
Comparison of zeta potential of different sorbent materials as a function of pH.
Zeta potential measurements support electrostatic interaction as the primary basis of cation sorption to the hydrochar, providing a valuable clue for rational design. For further comparison, we measured the zeta potential of one of the aforementioned activated carbons (Norit® SX-1) and include these data in Figure 1. The zeta potential of the activated carbon was much less negative than glucose hydrochar, even before alkali treatment. Again, this points to a qualitatively different sorption mechanism for activated carbon compared to hydrochar, with cation sorption to activated carbon likely occurring due to cation-π interactions, which appear to be less important than electrostatic interactions for cation binding to hydrochar [86].
Rational sorbent design requires understanding the molecular binding sites. Figure 1 clearly implicates the importance of groups that ionize on alkali treatment, which naturally suggests carboxylic acids, acid anhydrides, and strongly acidic aromatic alcohols, such as phenol [16,24,73]. The fact that strong bases were more activating than weak ones (Table 1) seems consistent with de-protonation of weak acids but does not provide sufficient molecular detail for sorbent design. Accordingly, glucose hydrochar was analyzed using FT-IR for identification of ionizable OFGs. Figure 2 provides FT-IR spectra divided into the fingerprint region, 1000–2000 cm−1 (Figure 2a) and the C−H and O−H stretching region, 2400–4000 cm−1 (Figure 2b). Prior to alkali treatment, glucose hydrochar exhibits bands attributable to carbonyl (1720 cm−1) and hydroxyl (3200–3400 cm−1) groups associated with carboxylic acids. Other features at 2900, 1600, and 1200 cm−1 are attributable to C−H stretches, arenes/furans breathing modes, and C−O stretches, respectively [65] These spectroscopic attributions are broadly consistent with the structural models previously inferred from NMR [65], Raman [61], and NEXAFS [62,63,64,66]. Interestingly, the C−H and O−H stretches are sufficiently differentiated to suggest that carboxylic acid exists in its free, rather than dimerized, state [87].
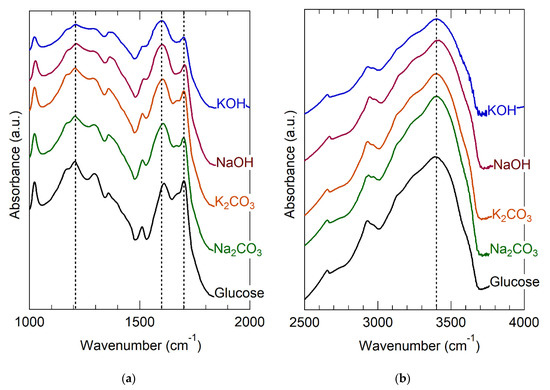
Figure 2.
FT-IR spectra of glucose hydrochar as synthesized and after activation by various bases. (a) the fingerpint region (1000–2000 cm−1) (b) the O−H and C−H stretch region (2500–4000 cm−1).
After alkali treatment, the intensities of the hydroxyl band at 3200–3400 cm−1 and carbonyl band at 1720 cm−1 become much less intense. Simultaneously with these changes, the intensity of the band at 1600 cm−1 increases and the feature broadens noticeably. The C−O stretch present at approximately 1200 cm−1 becomes less intense and broader after alkali treatment. The effects are more noticeable for treatment with the hydroxides than the carbonates, consistent with their relative basicities and with the observed effects on sorption capacity, noted in Table 1.
All of the aforementioned changes observed in the FT-IR spectra of glucose hydrochar after alkali treatment are attributable to deprotonation of carboxylic acid groups to form carboxylates [37,88]. Specifically, deprotonation involves a shift of the main carbonyl band from approximately 1700 to about 1600 cm−1; [84] a reduction of intensity of the C−O stretch at 1200 cm−1; and a reduction of the intensity of the O−H stretch at 3200–3400 cm−1. The last of these is consistent with partial removal of the H atoms involved with O−H stretches, as expected for de-protonation. The carboxylate feature at 1600 cm−1 overlaps with the furan/arene breathing mode that is characteristic of hydrochar [61,63,89]. The fact that alkali treated hydrochar still exhibits an O−H stretching band is consistent either with incomplete de-protonation of acid groups or with the presence of multiple forms of O−H in the structure (i.e., alcohol groups that are not sufficiently acidic to be deprotonated).
Since the carboxylic acid groups present in glucose hydrochar appear to be primarily in their protonated forms (Figure 1) and since the pH of the HTC reaction mixture is about 3 [90], the pKa of these acid groups must be greater than approximately 3–otherwise, they would be present in hydrochar in their deprotonated forms. Alkali treatment then deprotonates these groups, resulting in formation of the alkali carboxylate. Because hydrochar is a complex material and because localized induction and steric effects can influence pKa [91], carboxylic acids present in hydrochar likely possess a range of pKa’s. In fact, this assertion is supported from the broad zeta potential curve observed for glucose hydrochar and shown in Figure 1. Treatment with carbonates may therefore deprotonate only the strongest carboxylic acids present in hydrochar, while treatment with hydroxides deprotonates both strong and weak carboxylic acids.
We considered the possibility of alternative ionizable groups, aside from carboxylic acid. Treatment with hydroxide would partially deprotonate any strongly acidic alcohol groups (e.g., phenols) present in the hydrochar structure; however, the FT-IR spectra show no direct evidence to support the formation of phenolate ions, nor do reported structural models suggest the presence of phenol in hydrochar [24,61,63]. Accordingly, metal-carboxylate binding appears to be the primary cation adsorption mechanism underlying glucose hydrochar sorption, providing a clear target for molecular simulation.
Hydrochar is thought to be composed of furan/arene polymers connected by alkyl spacers. Mild alkali treatment is insufficient to break or form covalent bonds present in this structure [82], which is consistent with the negligible change in surface area associated with alkali treatment (see Table 1). That stated, Mihajlovic et al. [92] proposed that hydrolytic degradation of OFGs can sometimes occur during alkali treatment, and re-arrangement of the hydrochar structure from its hypothesized form would complicate attempts to model the binding site. Accordingly, we searched for evidence of bond breaking in the spectra shown in Figure 2. Inspection of the FT-IR spectra suggests that important hydrochar features [28,29] at 1020 cm−1 (C−OH alcohol and/alkyl-substituted ethers groups), 1600 cm−1 (furan/arene breathing modes), and 2900–3000 cm−1 (C−H stretch) are not affected by alkali treatment, consistent with the main effect of alkali treatment being confined to deprotonation rather than making and/or breaking of covalent bonds. This observation permits use of published hydrochar structural models to recreate the local environment of the metal-carboxylate binding site for DFT simulation.
3.2. DFT Simulations of the Metal-Carboxylate Interactions
Zeta potential measurements and FT-IR analysis clearly implicate metal-carboxylate binding. DFT simulations of the metal-carboxylate complex were performed to examine this hypothesis in more detail. In particular, we sought to answer three questions: (1) since a metal cation should be able to displace protons from carboxylic acid, why is alkali treatment required to activate the hydrochar? (2) Why do potassium salts outperform sodium salts? (3) What is the geometry of the binding site?
Simulating cation-carboxylate binding requires recreating a plausible local environment. The hydrochar molecule, pictured in Figure 3a, was created as a composite structure based on previous literature. Titirici et al. [93] demonstrated via NMR that the majority of the aromatic functionality of hydrochars synthesized from glucose at temperatures less than 200 °C can be attributed to furan groups. Latham et al. [63] supported this via NEXAFS while showing that carbonyl groups are also important. The previously mentioned IR spectra also indicate the presence of carbonyl groups and are in agreement with the model proposed by Latham et al. [63]. Accordingly, we recreated the local adsorption environment as a furanic dimer configuration to be consistent with published hydrochar structures [61]. The carboxylic acid/carboxylate group resides as a side chain on the alkyl linker between adjacent furan rings, consistent with the observation using FT-IR and the importance of carboxylate groups inferred from sorption capacity measurements presented here. The local environment experienced by a metal cation during adsorption also includes water solvent molecules. Here, we recreated the water solvation effect using an implicit cavity model of the appropriate dielectric constant (taken as 78). Future work can improve the accuracy of our calculations by including explicit water molecules in the simulation.
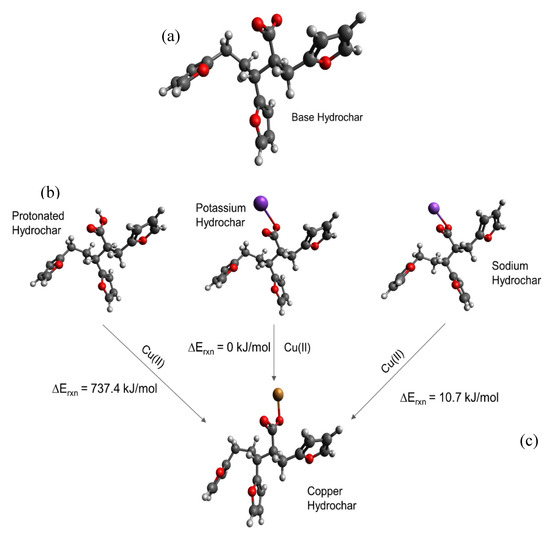
Figure 3.
Carboxylate-containing hydrochar structures optimized using Density Functional Theory (DFT). (a) Model of the base hydrochar molecule. The different structures in (b) involve carboxylate binding with hydrogen, potassium, and sodium, respectively, with the carboxylate, which make up the reactants of the modeled adsorption reactions. (c) Illustrates the interaction between Cu(II) and the carboxylate group. Estimated adsorption energies are provided as shown. Legend:  carbon;
  hydrogen;
  oxygen;
  potassium;
  sodium;
  copper.
carbon; hydrogen; oxygen; potassium; sodium; copper.
We then simulated a series of possible cation-carboxylate structures, starting with the hydrochar model shown in Figure 3a. The focus of these calculations was to answer the aforementioned questions that focus on elucidation of trends, rather than quantitative energy estimates. We then simulated cation binding, shown stoichiometrically in Figure 3b, by replacing either H+, K+, or Na+ with the Cu(II) cation to form the final structure shown in Figure 3c.
Consistent with experimental observations (Table 1), we find that replacing H+ with Cu(II) is energetically unfavorable, whereas replacing K+ and Na+ is energetically favorable. The simulated energies are consistent with the observation that glucose hydrochar requires alkali treatment prior to activation. Moreover, DFT simulations predict that replacing K+ is energetically more favorable than replacing Na+ by 10.72 kJ mol−1, which is consistent with the observation that KOH is a more effective activating salt than NaOH and K2CO3 is more effective than Na2CO3. That stated, the calculated energy difference between K+ and Na+ substitution is relatively modest, which is again consistent with experimental observation. Note that for these reactions the cations in solution may not be properly modeled by implicit solvation, which is why for instance the replacement of a hydrogen by Cu(II) is so endothermic. Nonetheless the trends in cation exchange are captured by the DFT calculations.
Figure 3c shows the optimized geometry of a Cu-hydrochar structure. Here, the Cu-carboxylate bond length is approximately 1.85 Å, slightly longer than that associated with the distance between the proton and carboxylate group in carboxylic acid. The longer bond is consistent with the size of the Cu(II) ion compared with the proton [37].
The DFT simulations summarized in Figure 3 explain that alkali treatment removes the proton to activate the sorption capacity of glucose hydrochar. Physically, the proton is more tightly bonded to the carboxylate group than the metal cations, owing to the differences in ionic radii and the strong effect of ion-ion distance on the strength of electrostatic interactions [94]. Similarly, the differences observed between potassium and sodium can be ascribed to their relative ionic radii.
Interestingly, alkali treatment is not always reported as a necessary step for observation of hydrochar sorption capacity. This may be due to differences in the reaction mixture pH for different precursors and/or the presence of alkali salts in many hydrochar starting materials [95,96]. Accordingly, subtle differences in the reaction mixture and the composition of the precursor may decide whether or not alkali treatment is required to activate a given hydrochar for metal adsorption. Alternatively, the alkali step may not be uniformly reported, even when it is required. We recommend more consistent reporting of alkali treatment and reaction mixture pH in future work in this area.
3.3. Custom-Synthesis of Hydrochar for Heavy Metal Adsorption
Experiments and DFT simulations clearly implicate the importance of metal-carboxylate interactions in hydrochar adsorption of Cu(II). Accordingly, our next step was custom synthesis of a hydrochar for heavy metal adsorption. Following the work of Demir-Cakan et al. [56], we elected to synthesize a hydrochar by co-processing glucose and acrylic acid. Acrylic acid possesses a polymerizable double bond, which can form covalent linkages with the alkyl linker groups in the hydrochar structure, thereby increasing the density of carboxylate groups in the resulting material. We term the resulting material acrylic acid-hydrochar, or simply AA-hydrochar. Demir-Cakan et al. [56] reported synthesis of a series of AA-hydrochars, starting with different amounts of acrylic acid in the precursor mixture. Here, we selected a precursor mixture with composition similar to the optimum reported by Demir-Cakan et al. [56] as a proof of concept.
Table 2 provides the sorption capacity and surface area measurements for AA-hydrochar. As expected from DFT simulations, without activation the Cu(II) sorption capacity of AA-hydrochar is negligible. Interestingly, Demir-Cakan et al. [56] did not report alkali activation of their materials, which might be attributable to their study of Pb(IV) and Cd(II) whereas we studied Cu(II) or the aforementioned impact of subtle differences in reaction mixture pH on hydrochar protonation and subsequent sorption capacity. Regardless, after alkali activation, sorption capacity increases by at least an order of magnitude for the AA-hydrochar, and strong bases are again more effective than weak bases. AA-hydrochar capacity for Cu(II) sorption is greater than that observed for standard glucose hydrochar (50 ± 4 compared with 40 ± 4 mg g−1). Again, the effect is not as pronounced as reported by Demir-Cakan et al. [56], but it is consistent with the design concept.
Table 2.
Adsorption capacity and surface area of custom-synthesized hydrochar and ion exchange resins.
The effect of AA and glucose co-processing to produce hydrochar was consistent with our expectations, but consistency does not imply confirmation and we considered alternative hypotheses. Table 2 shows that the surface area of AA-hydrochar was similar to the glucose hydrochar, eliminating surface area changes as a major difference between these materials. To understand further, we studied the OFGs of AA-hydrochar using FT-IR. Figure 4 provides the FT-IR spectra obtained for AA-hydrochar before and after KOH treatment. The FT-IR of glucose hydrochar is included in Figure 4 for direct comparison to show that the AA-hydrochar spectrum exhibits much more intense bands associated with carboxylic acids at 1720 (carbonyl) and 1200 cm−1 (C-O stretch) than glucose hydrochar. In fact, the carboxylic acid bands dominate the AA-hydrochar spectrum and appear as the most prominent features. The band at 1600 cm−1, which is characteristic of furans and arenes, appears only as a minor, though distinct, feature in the AA-hydrochar spectrum. In comparison, the furan/arene band is one of the most prominent features in the glucose hydrochar spectrum. Similarly, after alkali treatment, the carbonyl band shifts to approximately 1550 cm−1 and becomes the most prominent feature in the AA-hydrochar spectrum. Correspondingly, the C-O stretch feature shifts and broadens. Taken together, these observations clearly indicate that AA-hydrochar has abundant carboxylic acid groups that deprotonate after alkali treatment.
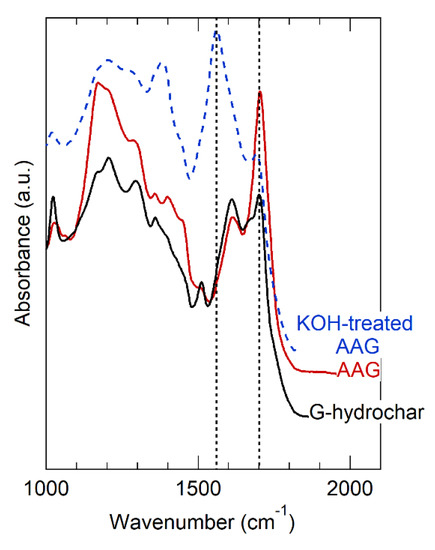
Figure 4.
FT-IR spectra of AA-hydrochar before and after KOH treatment. G-hydrochar is synthesized entirely of glucose precursor, shown before alkali treatment. AA-hydrochar synthesized from co-feed of acrylic acid and glucose, shown before and after alkali treatment using KOH.
The performance of hydrochar sorbents is often compared with activated carbon [25,39]. However, our findings indicate that hydrochar adsorption is mediated by metal-carboxylate binding interactions that are more similar to what occurs on an ion exchange resin, rather than activated carbon. Accordingly, we measured Cu(II) sorption capacity of two commercial ion exchange resins, Amberlyst®-15 and AG® 50W-X4. Capacity results for these resins are provided in Table 2. Interestingly, these resins far outperform activated carbon (Table 1) and outperform by about a factor of two the AA-hydrochar. Moreover, the ion exchange resins did not require alkali activation, unlike the hydrochars. Since the resins outperform hydrochar, even AA-hydrochar, we sought to understand the differences between the resins and the hydrochar as part of our rational design approach.
An obvious potential difference between the resins and the hydrochar is surface area. Table 2 provides N2 sorption-based BET surface areas for Amberlyst®-15 and AG® 50W-X4. Interestingly, Amberlyst®-15 exhibits much greater surface area than any of the hydrochars, which could explain its superior performance. However, the surface area measured for AG® 50W-X4 was less than any of the other materials (<1 m2 g−1, the instrument detection limit), meaning that surface area considerations alone cannot explain the performance of the resins–at least not the surface area measured by N2 sorption and estimated by BET analysis of the isotherm. In fact, the swelling behavior of ion exchange resins has been studied carefully in water and other solvents [98,99,100]; swelling in the presence of water likely opens the pore structure of AG® 50W-X4 (and possibly the other sorbents), accounting for its sorption capacity despite negligible N2 sorption surface area. Understanding the effects of hydrochar swelling on surface area available for cation sorption is an area that should be studied in the future.
The binding site in both Amberlyst®-15 and AG® 50W-X4 is a sulfonate group [101], whereas the findings presented here indicate that carboxylate groups are mainly responsible for binding in glucose hydrochar and especially AA-hydrochar. The sulfonic acid group is at least 1000× stronger than the carboxylic acid group, meaning that this difference could explain sorption behavior and the need for alkali activation. Accordingly, we modified the acrylic acid synthesis procedure for incorporation of a sulfonate group into the hydrochar structure by co-processing glucose and vinyl sulfonic acid. Like acrylic acid, vinyl sulfonic acid possesses a polymerizable double bond that can be incorporated in the hydrochar-alkylated backbone. Unlike acrylic acid, though, vinyl sulfonic acid can introduce a sulfonate group into the hydrochar instead of the carboxylic acid introduced by acrylic acid. Accordingly, we term this new char vinyl sulfonic acid-hydrochar, or VSA-hydrochar.
Table 2 provides the Cu(II) cation sorption capacity of VSA-hydrochar. Interestingly, despite the strength of the vinyl sulfonic acid precursor (pKa < 1 compared with 4.35 for acrylic acid) [98,102], we observed negligible Cu(II) sorption capacity for VSA-hydrochar before treatment with alkali. After treatment with KOH, the Cu(II) capacity of VSA-hydrochar increased substantially to 51 ± 3 mg g−1. Interestingly, NaOH was much less effective at increasing Cu(II) sorption capacity than KOH, consistent with the aforementioned trend observed and simulated for carboxylate binding.
As before, the measured BET surface area of VSA-hydrochar was in the same range as the other hydrochars and <10 m2 g−1. Similarly, Figure 5 shows the FT-IR spectrum of VSA-hydrochar. Unlike carboxylic acid and carboxylate groups that have intense and well-differentiated vibrational bands, sulfonic acid and sulfonate give rise to weak and broad bands that are not easily differentiated from other features [103]. That stated, the FT-IR VSA-hydrochar spectrum contains bands in the range expected for sulfonic acid (1100–1300 cm−1). The carboxylate/carboxylic acid bands are less intense in VSA-hydrochar than glucose hydrochar, indicating substitution of the weak acid in AA-hydrochar for the strong acid in VSA-hydrochar.
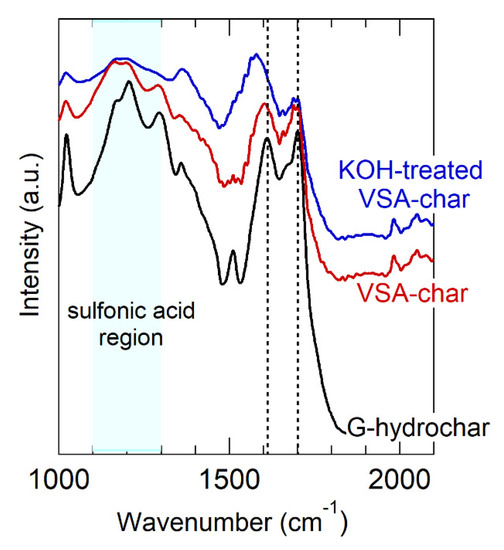
Figure 5.
FT-IR spectrum of VSA-hydrochar, before and after KOH treatment. Vertical lines mark the carboxylic acid and carboxylate vibration bands. The region where sulfonic acid vibrations appear is indicated. The spectrum of glucose hydrochar is reproduced from Figure 4 as a point of reference.
Cu(II)-sulfonate structures were simulated using DFT methods, similar to those previously presented for carboxylate binding. Figure 6a shows the sulfonic acid- hydrochar geometry, which consisted of two furan groups bonded to a sulfonic acid group. As before, binding was simulated as an exchange of Cu(II) for H+, K+, and Na+. Despite the strength of the sulfonic acid, DFT calculations found that replacing H+ with Cu(II) was thermodynamically unfavorable, consistent with the need to activated VSA-hydrochar with alkali. Figure 6b summarizes this result. Similarly, the distance of the Cu−O bonded to sulfonate (shown in Figure 6c) is 1.95 Å, somewhat greater than the Cu−O bond in carboxylate hydrochar (1.85 Å). As before, the cations in solution may not be properly modeled by implicit solvation, which is why some energies may be so large, despite DFT identifying the trends in cation exchange.
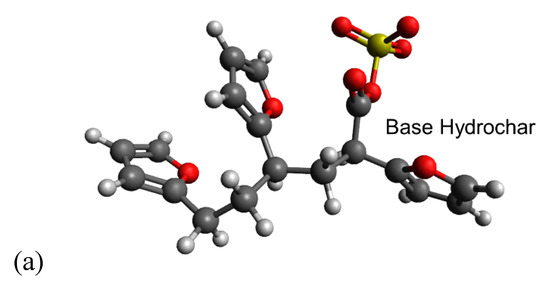
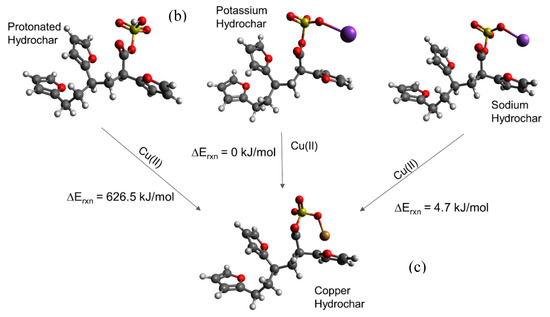
Figure 6.
Sulfonate-containing hydrochar structures optimized using DFT. The structure in (a) is the sulfonated hydrochar molecule. (b) Depicts the reactants which are the interactions between the sulfonate group and either hydrogen, potassium, or sodium, respectively. Structure (c) shows binding of Cu(II) to the sulfonated hydrochar molecule. Adsorption energies are provided as shown. Legend: carbon; hydrogen; oxygen;  sulfur; potassium; sodium; copper.
carbon; hydrogen; oxygen; sulfur; potassium; sodium; copper.
Surface area, FT-IR, and DFT simulations provide further evidence of cation-sulfonate binding in the VSA-hydrochar, but do not explain why the performance of neither VSA-hydrochar nor AA-hydrochar can match the commercial ion exchange resins. As a final hypothesis, we quantified the density of surface acids present on the various sorbents, with the expectation that differences in the density of surface acids might explain observed differences in sorption capacity. For these experiments, hydrochars were first treated with strong acid (HCl) to protonate fully all available acid groups. Then, the acid group density was measured of the protonated sorbent using Boehm titration methods [29,71,72].
Table 3 summarizes the carboxylic acid site density measurements. As expected, the density of acid functional groups on the glucose hydrochar is much greater than on the activated carbons considered here, consistent with the different adsorption mechanisms for the two materials (primarily electrostatic vs. primarily π-cation). The ion exchange resins have much greater acid concentrations than any of the other sorbents, consistent with their superior performance and indicating that the AA- and VSA-hydrochars function as designed, albeit with fewer acid binding groups than are available on the ion exchange resins tested here. Nonetheless, the Cu(II) adsorption performance of the designer hydrochars is comparable to the ion exchange resins (to within a factor of two) and superior to activated carbon, meaning that strategies to increase acid functional group density can be effective for synthesis of task-specific hydrochar sorbents.
Table 3.
Titration results of sorption materials.
Table 3 provides qualitative evidence of the importance of acid group density on sorption performance and permits analysis of a critical parameter: the binding stoichiometry of the metal-acid complex formed during adsorption. Binding stoichiometry is important for quantifying sorbent performance since the ideal absorbent will possess high density of binding sites and utilize them as efficiently as possible. Simultaneously achieving high binding site density and binding site utilization may not be possible, since densely spaced binding sites may promote bidentate binding instead of monodentate binding, which is less efficient binding site utilization. We analyzed the sorption and acid site density data to evaluate these effects in hydrochar, activated carbon, and ion exchange resins.
To use Table 3 data to understand stoichiometry, we plotted Cu(II) sorption capacity as a function of measured acid group density, converting both to molar quantities, as shown in Figure 7. For comparison, lines of constant ion-binding site stoichiometry (two Cu ions per acid, 1:1, and 1:2) are shown. Data for the activated carbons cluster around the origin and fall entirely off the stoichiometric trend lines, as expected given that the sorption mechanism to activated carbons is likely cation-π interactions and is, therefore, independent of acid site density. In contrast, sorption for the hydrochars falls between the 1:1 and 1:2 stoichiometry lines, indicating that—on average—each acid group binds approximately 0.75 Cu ions. This again is further quantitative evidence of the importance of electrostatic interactions for binding to hydrochar.
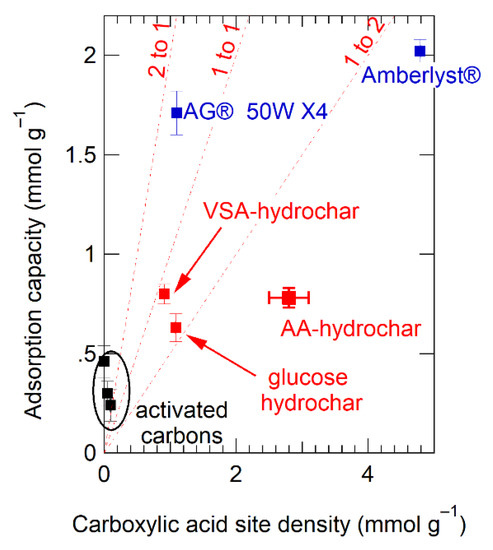
Figure 7.
Measured Cu(II) adsorption capacity plotted as a function of measured carboxylate group density. Lines of constant cation-anion stoichiometry are shown as dotted lines at 2 Cu(II) ions per binding site (2:1), 1 Cu(II) ions per binding site, and 1 Cu(II) ion for every two binding sites. Legend:  depicts activated carbon,
  ion exchange resins,
  hydrochar.
depicts activated carbon, ion exchange resins, hydrochar.
The stoichiometry inferred from Figure 7 shows that the designer hydrochars outperform Amberlyst®-15 on a per acid site basis. This is an important finding since increasing binding site utilization efficiency is an effective means of increasing sorption capacity, along with increasing the density of binding sites themselves. Interestingly, AG® 50W-X4 far exceeds all other sorbents on effectiveness per acid site, with nearly two Cu ions associated with every acid site (Figure 6). The difference between AG® 50W-X4 and Amberlyst®-15 is noteworthy as both sorbents are described in the literature as polymerized styrene backbones with periodic sulfonic acid group substitution [101]. The difference in their performance must be due either to (1) the ability of the sorbent to hold charge, which could be saturated for Amberlyst®-15 limiting its sorption capacity, (2) differences in acid site accessibility in the swollen resins and hydrochars, or (3) differences in the spatial proximity of the acid binding groups in the different sorbents. The performance of AG® 50W-X4 suggests further engineering of the hydrochar structure to optimize sorption capacity.
To understand the origins of stoichiometry between Cu(II) ions and carboxylate or sulfonate groups, we performed simulations to compare monodentate with bidentate binding of Cu(II) to carboxylate and sulfonate groups. To make the calculation accessible using DFT, we simplified the structure previously used in Figure 3 and Figure 6 to remove the furan groups. Figure 8a shows the optimized geometry for the monodentate binding structures, and Figure 8b shows the optimized geometry for the bidentate binding structures. As expected, bidentate binding is much more energetically favorable than binding to a single acid functional group. For the sulfonate site, bidentate binding is more stable by 201 kJ mol−1, and for the carboxylate site, bidentate binding is more stable by 126 kJ mol−1. These values indicate a clear thermodynamic preference for bidentate binding. As measured by the Cu−O distance, the Cu(II) ion is roughly equidistant between the two sulfonate groups; as a result, the Cu−O distance in bidentate binding complex is greater than found in the geometry optimized for single Cu-acid stoichiometry (shown previously in Figure 6). This clearly shows that Cu(II) (and presumably other double charged cations) will prefer bidentate binding, when such an option is available. Since bidentate binding is a less efficient use of sites than monodentate binding, rational design of hydrochars should attempt to achieve uniform acid spacing to minimize acid-acid interaction and the ability of cations to bind simultaneously to multiple acid sites.
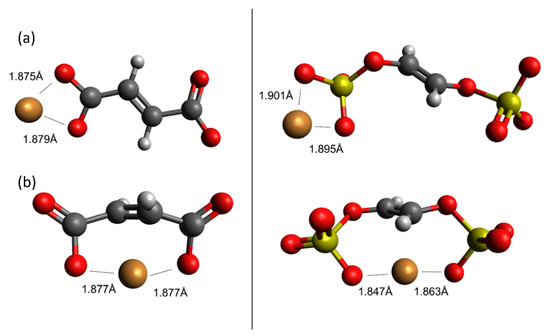
Figure 8.
Optimized geometries of monodentate (a) and bidentate (b) binding of Cu(II) to hydrochar carboxylate and sulfonate groups simulated using DFT. Oxygen-Cu(II) distances are shown for reference. Legend: carbon; hydrogen; oxygen; sulfur; copper.
carbon; hydrogen; oxygen; sulfur; copper.
When functional group precursors with polymerizable double bonds are co-fed to the HTC reactor with glucose, the functional group bearing molecules will polymerize primarily with each other, rather than with groups present in the hydrochar. Because they are formed by co-feeding glucose and vinyl groups, VSA-hydrochar is not engineered to achieve the desired spacing, which may explain why it falls short of the desired 1:1 Cu-binding site stoichiometry. More uniform spacing of the binding groups has potential to improve binding site utilization by forcing binding to occur via the preferred monodentate arrangement rather than via the thermodynamically preferred bidentate geometry. Furthermore, utilization of vinyl sulfonic acid as a source of binding groups detracts from the renewable and green characteristics of hydrochar. Accordingly, future work in this area should seek to utilize feeds that are naturally abundant in anionic binding sites and/or functional groups that are converted into anionic binding sites during HTC. Questions of binding site access and cooperative effects should be addressed for hydrochars synthesized from renewable or waste resources, using similar methods as shown here for rational sorbent design.
As a final analysis, we evaluated cation-π binding to the furan backbone itself in the absence of acid groups, as a comparison with the arene backbone present in commercial exchange resins. By providing a secondary stabilizing interaction, optimizing the cation-π binding interaction can potentially improve the utilization efficiency of the anionic binding sites—a desired goal as explained previously. In particular, we were interested to understand the effect of locating the cation between nearby rings as compared with interacting with a single ring individually—in the absence of anionic binding groups, such as sulfonate or carboxylate. Figure 9 provides the results of these calculations; Figure 9a,b depict arene binding and Figure 9c,d depict furan binding, respectively. In both cases, locating the Cu(II) between two nearby aromatic rings (either furan or arene) is more stable than interaction with a single aromatic ring. Interestingly, the energy difference is greater for furan-cation interactions (Figure 9c,d) than arene-cation interactions (Figure 9a,b), by approximately 23 kJ mol−1. Accordingly, a final design consideration for custom-synthesis of hydrochar sorbents is inclusion of geometries, which permit formation of furan “pockets” for optimized cation-π interaction. When combined with electrostatic interactions, cation-π interactions can provide a secondary stabilizing force to optimize hydrochar sorption capacity.
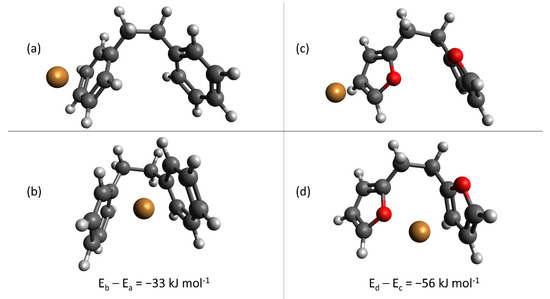
Figure 9.
Optimized geometries calculated for arene, (a,b), and furan, (c,d), cation-π binding, in the absence of anionic binding groups. Legend: carbon; hydrogen; oxygen; sulfur; copper. Differences in energy are shown directly in the Figure.
carbon; hydrogen; oxygen; sulfur; copper. Differences in energy are shown directly in the Figure.
Figure 3, Figure 6, Figure 7, Figure 8 and Figure 9 describe a combined experimental and simulation approach for rational design of hydrochar sorbents to exploit electrostatic interactions between anionic functional groups and metal cations. Maximizing the effectiveness of each functional group can be achieved by spacing them uniformly throughout the material, thus emphasizing monodentate binding over bidentate binding. Presumably, highly effective hydrochar sorbents, such as those reported by Demir-Cakan et al. [56], who first demonstrated the acrylic acid co-HTC approach, and Xue et al. [16], who activated peanut hull hydrochar using hydrogen peroxide, already exploit these principles. Likewise, the accuracy of the computational approach in particular will benefit as hydrochar structure is further resolved, especially for materials produced from precursors other than glucose. The result of the rational design approach will be hydrochars with maximized value; thus, making them as competitive as possible with sorbents obtained from non-renewable resources. Although not within the scope of this work, computational modeling should be appropriate for guiding selection of conditions for hydrochar regeneration, for example by using alkali solutions to remove the heavy metal adsorbates. Applying our adsorption capacity results directly to metals other than Cu(II) is not recommended; however, the combined experimental and computational approach should be amenable to any metal cation of interest. Similar analysis can be applied in the future to understand the adsorption of organic substances to hydrochar, as organic pollutants will exhibit different hydrochar interactions than metal cations [104].
4. Conclusions
Glucose hydrochar was studied as a model renewable sorbent for heavy metals, using Cu(II) as a test case for custom-designing a hydrochar sorbent. Glucose hydrochar required alkali activation to exhibit Cu(II) sorption capacity; a strong base (hydroxide) was more effective than a weak base (carbonate) and K+ counter ions were more effective than Na+ for activation. In comparison, activated carbon sorption was less than observed for activated glucose hydrochar, despite significant differences in their measured BET surface areas (<10 m2 g−1 compared with >800 m2 g−1). Similarly, activated carbon did not require alkali treatment to promote cation sorption, consistent with entirely different sorption mechanisms for these two common sorbents. Zeta potential measurements indicated that Cu(II) sorption to hydrochar was due to electrostatic interactions and FT-IR analysis implicated a key role for carboxylate groups. DFT simulations provided further information on Cu-hydrochar binding to the carboxylate site, suggesting beneficial synergy with nearby furan groups.
These results were used as the basis for molecular level design of two hydrochars bearing either carboxylate or sulfonate groups. The designer hydrochars exhibited approximately 50 m2 g−1 Cu(II) sorption capacity, consistent with the role of carboxylate and sulfonate groups in cation binding. Nonetheless, the capacity of the hydrochar sorbents failed to yield the expected increase in sorption capacity. In accordance with the electrostatic binding mechanism, sorption capacity of two ion exchange resins, Amberlyst®-15 and AG® 50W-X4, was studied for comparison with hydrochar. The ion exchange resins outperformed hydrochar on a per mass basis. Interestingly, the hydrochars bound approximately 0.75 Cu ions per acid site, whereas Amberlyst®-15 bound only 0.5 Cu ions per acid site. The superior performance of Amberlyst®-15 compared with hydrochar was therefore attributable entirely to differences in acid site density. AG® 50W-X4, on the other hand, bound nearly 2 Cu ions per acid site, which accounted for its superior performance compared with hydrochar. DFT simulations confirmed that bidentate binding is preferred whenever possible, meaning, uniform spacing of the binding groups will maximize their binding efficiency on a per site basis. Similarly, cooperative effects from nearby aromatic groups (either furan or arene) can promote cation-π interactions that improve binding and acid site utilization. The combination of experimental investigation and computer simulation provide a clear starting point for molecular-level design of hydrochar for use as sorbents, that can be used in future work.
Author Contributions
Conceptualization, M.T.T. and N.A.D.; Methodology, A.B.B., and G.A.T.; Validation, L.D. and B.S.; Formal Analysis L.D. and M.P.R.; Investigation J.T.H., L.D., A.A., and M.P.R.; Data Curation, L.D.; Writing (original draft), Writing (review and editing), N.A.D., M.T.T., A.B.B., A.A, J.T.H. and G.A.T.; Visualization, B.S., L.D., M.T.T.; Supervision, M.T.T., N.A.D.; Project Administration, M.T.T., A.B.B., N.A.D.; Funding Acquisition, M.T.T. All authors have read and agreed to the published version of the manuscript.
Funding
The work was funded by the U.S. National Science Foundation (ENG/CBET 1605916).
Acknowledgments
Rediet Tegegne and Maksim Tyufekchiev supported experimental efforts by synthesizing and titrating several of the hydrochars.
Conflicts of Interest
The authors declare no conflict of interest.
References
- Christian-Smith, J.; Gleick, P.H.; Cooley, H. Twenty-first century US water policy. In 21st Century US Water Policy; Oxford University Press: Oxford, UK, 2012. [Google Scholar]
- Bellinger, D.C. Lead contamination in Flint—An abject failure to protect public health. N. Engl. J. Med. 2016, 374, 1101–1103. [Google Scholar] [CrossRef]
- Retief, F.P.; Cilliers, L. Lead poisoning in ancient Rome. Acta Theol. 2006, 26, 147–164. [Google Scholar] [CrossRef]
- Fernandez-Luqueno, F.; López-Valdez, F.; Gamero-Melo, P.; Luna-Suárez, S.; Aguilera-González, E.N.; Martínez, A.I.; García-Guillermo, M.; Hernández-Martínez, G.; Herrera-Mendoza, R.; Álvarez-Garza, M.A. Heavy metal pollution in drinking water-a global risk for human health: A review. Afr. J. Environ. Sci. Technol. 2013, 7, 567–584. [Google Scholar]
- Fu, F.; Wang, Q. Removal of heavy metal ions from wastewaters: A review. J. Environ. Manag. 2011, 92, 407–418. [Google Scholar] [CrossRef] [PubMed]
- Wen, T.; Zhao, Y.; Zhang, T.; Xiong, B.; Hu, H.; Zhang, Q.; Song, S. Effect of anions species on copper removal from wastewater by using mechanically activated calcium carbonate. Chemosphere 2019, 230, 127–135. [Google Scholar] [CrossRef] [PubMed]
- Charerntanyarak, L. Heavy metals removal by chemical coagulation and precipitation. Water Sci. Technol. 1999, 39, 135–138. [Google Scholar] [CrossRef]
- Blöcher, C.; Dorda, J.; Mavrov, V.; Chmiel, H.; Lazaridis, N.; Matis, K. Hybrid flotation—Membrane filtration process for the removal of heavy metal ions from wastewater. Water Res. 2003, 37, 4018–4026. [Google Scholar] [CrossRef]
- Aldrich, C.; Feng, D. Removal of heavy metals from wastewater effluents by biosorptive flotation. Miner. Eng. 2000, 13, 1129–1138. [Google Scholar] [CrossRef]
- Al-Rashdi, B.; Johnson, D.; Hilal, N. Removal of heavy metal ions by nanofiltration. Desalination 2013, 315, 2–17. [Google Scholar] [CrossRef]
- Mukherjee, R.; Bhunia, P.; De, S. Impact of graphene oxide on removal of heavy metals using mixed matrix membrane. Chem. Eng. J. 2016, 292, 284–297. [Google Scholar] [CrossRef]
- Oehmen, A.; Viegas, R.; Velizarov, S.; Reis, M.A.; Crespo, J.G. Removal of heavy metals from drinking water supplies through the ion exchange membrane bioreactor. Desalination 2006, 199, 405–407. [Google Scholar] [CrossRef]
- Wang, A.; Zhou, K.; Zhang, X.; Zhou, D.; Peng, C.; Chen, W. Arsenic removal from highly-acidic wastewater with high arsenic content by copper-chloride synergistic reduction. Chemosphere 2020, 238, 124675. [Google Scholar] [CrossRef] [PubMed]
- Tran, T.-K.; Chiu, K.-F.; Lin, C.-Y.; Leu, H.-J. Electrochemical treatment of wastewater: Selectivity of the heavy metals removal process. Int. J. Hydrogen Energy 2017, 42, 27741–27748. [Google Scholar] [CrossRef]
- Hunsom, M.; Pruksathorn, K.; Damronglerd, S.; Vergnes, H.; Duverneuil, P. Electrochemical treatment of heavy metals (Cu2+, Cr6+, Ni2+) from industrial effluent and modeling of copper reduction. Water Res. 2005, 39, 610–616. [Google Scholar] [CrossRef] [PubMed]
- Xue, Y.; Gao, B.; Yao, Y.; Inyang, M.; Zhang, M.; Zimmerman, A.R.; Ro, K.S. Hydrogen peroxide modification enhances the ability of biochar (hydrochar) produced from hydrothermal carbonization of peanut hull to remove aqueous heavy metals: Batch and column tests. Chem. Eng. J. 2012, 200, 673–680. [Google Scholar] [CrossRef]
- Ihsanullah, D.; Abbas, A.; Al-Amer, A.M.; Laoui, T.; Al-Marri, M.J.; Nasser, M.S.; Khraisheh, M.; Atieh, M.A. Heavy metal removal from aqueous solution by advanced carbon nanotubes: Critical review of adsorption applications. Sep. Purif. Technol. 2016, 157, 141. [Google Scholar] [CrossRef]
- Bakkaloglu, I.; Butter, T.; Evison, L.; Holland, F.; Hancockt, I. Screening of various types biomass for removal and recovery of heavy metals (Zn, Cu, Ni) by biosorption, sedimentation and desorption. Water Sci. Technol. 1998, 38, 269–277. [Google Scholar] [CrossRef]
- Rengaraj, S.; Yeon, J.-W.; Kim, Y.; Jung, Y.; Ha, Y.-K.; Kim, W.-H. Adsorption characteristics of Cu (II) onto ion exchange resins 252H and 1500H: Kinetics, isotherms and error analysis. J. Hazard. Mater 2007, 143, 469–477. [Google Scholar] [CrossRef]
- Lin, S.H.; Lai, S.L.; Leu, H.G. Removal of heavy metals from aqueous solution by chelating resin in a multistage adsorption process. J. Hazard. Mater 2000, 76, 139–153. [Google Scholar] [CrossRef]
- Pourhashem, G.; Adler, P.R.; Spatari, S. Time effects of climate change mitigation strategies for second generation biofuels and co-products with temporary carbon storage. J. Clean. Prod. 2016, 112 Pt 4, 2642. [Google Scholar] [CrossRef]
- Bulut, Y. Removal of heavy metals from aqueous solution by sawdust adsorption. J. Environ. Sci. 2007, 19, 160–166. [Google Scholar] [CrossRef]
- Javaid, A.; Bajwa, R.; Shafique, U.; Anwar, J. Removal of heavy metals by adsorption on Pleurotus ostreatus. Biomass Bioenergy 2011, 35, 1675–1682. [Google Scholar] [CrossRef]
- Kılıc, M.; Kırbıyık, C.; Çepelioğullar, Ö.; Pütün, A.E. Adsorption of heavy metal ions from aqueous solutions by bio-char, a by-product of pyrolysis. Appl. Surf. Sci. 2013, 283, 856–862. [Google Scholar] [CrossRef]
- Inyang, M.; Gao, B.; Yao, Y.; Xue, Y.; Zimmerman, A.R.; Pullammanappallil, P.; Cao, X. Removal of heavy metals from aqueous solution by biochars derived from anaerobically digested biomass. Bioresour. Technol. 2012, 110, 50–56. [Google Scholar] [CrossRef]
- Tripathi, M.; Sahu, J.N.; Ganesan, P. Effect of process parameters on production of biochar from biomass waste through pyrolysis: A review. Renew. Sustain. Energy Rev. 2016, 55, 467–481. [Google Scholar] [CrossRef]
- Wiedner, K.; Rumpel, C.; Steiner, C.; Pozzi, A.; Maas, R.; Glaser, B. Chemical evaluation of chars produced by thermochemical conversion (gasification, pyrolysis and hydrothermal carbonization) of agro-industrial biomass on a commercial scale. Biomass Bioenergy 2013, 59, 264–278. [Google Scholar] [CrossRef]
- Sun, Y.; Gao, B.; Yao, Y.; Fang, J.; Zhang, M.; Zhou, Y.; Chen, H.; Yang, L. Effects of feedstock type, production method, and pyrolysis temperature on biochar and hydrochar properties. Chem. Eng. J. 2014, 240, 574–578. [Google Scholar] [CrossRef]
- Sevilla, M.; Ferrero, G.A.; Fuertes, A.B. Beyond KOH activation for the synthesis of superactivated carbons from hydrochar. Carbon 2017, 114, 50–58. [Google Scholar] [CrossRef]
- Wahi, R.; Zuhaidi, N.; Yusof, Y.; Jamel, J.; Kanakaraju, D.; Ngaini, Z. Chemically treated microwave-derived biochar: An overview. Biomass Bioenergy 2017, 107, 411–421. [Google Scholar] [CrossRef]
- Verma, D.; Fortunati, E.; Jain, S.; Zhang, X. Biomass, Biopolymer-Based Materials, and Bioenergy: Construction, Biomedical, and Other Industrial Applications; Woodhead Publishing: Cambridge, UK, 2019. [Google Scholar]
- Zhang, J.; Zhang, X. 15-The thermochemical conversion of biomass into biofuels. In Biomass, Biopolymer-Based Materials, and Bioenergy; Verma, D., Fortunati, E., Jain, S., Zhang, X., Eds.; Woodhead Publishing: Cambridge, UK, 2019; pp. 327–368. [Google Scholar]
- Regmi, P.; Moscoso, J.L.G.; Kumar, S.; Cao, X.; Mao, J.; Schafran, G. Removal of copper and cadmium from aqueous solution using switchgrass biochar produced via hydrothermal carbonization process. J. Environ. Manag. 2012, 109, 61–69. [Google Scholar] [CrossRef]
- Marfíl, A.P.; Ocampo-Pérez, R.; Collins-Martínez, V.H.; Flores-Vélez, L.M.; Gonzalez-Garcia, R.; Medellín-Castillo, N.A.; Labrada-Delgado, G.J. Synthesis and characterization of hydrochar from industrial Capsicum annuum seeds and its application for the adsorptive removal of methylene blue from water. Environ. Res. 2020, 184, 109334. [Google Scholar] [CrossRef] [PubMed]
- Funke, A.; Ziegler, F. Hydrothermal carbonization of biomass: A summary and discussion of chemical mechanisms for process engineering. Biofuels Bioprod. Biorefining 2010, 4, 160–177. [Google Scholar] [CrossRef]
- Titirici, M.-M. Sustainable Carbon Materials from Hydrothermal Processes; John Wiley & Sons: Hoboken, NJ, USA, 2013. [Google Scholar]
- Sun, K.; Tang, J.; Gong, Y.; Zhang, H. Characterization of potassium hydroxide (KOH) modified hydrochars from different feedstocks for enhanced removal of heavy metals from water. Environ. Sci. Pollut. Res. 2015, 22, 16640–16651. [Google Scholar] [CrossRef] [PubMed]
- Poo, K.-M.; Son, E.-B.; Chang, J.-S.; Ren, X.; Choi, Y.-J.; Chae, K.-J. Biochars derived from wasted marine macro-algae (Saccharina japonica and Sargassum fusiforme) and their potential for heavy metal removal in aqueous solution. J. Environ. Manag. 2018, 206, 364–372. [Google Scholar] [CrossRef] [PubMed]
- Karnib, M.; Kabbani, A.; Holail, H.; Olama, Z. Heavy Metals Removal Using Activated Carbon, Silica and Silica Activated Carbon Composite; Elsevier Ltd.: Amsterdam, The Netherlands, 2014; Volume 50, pp. 113–120. [Google Scholar]
- Oliveira, I.; Blöhse, D.; Ramke, H.-G. Hydrothermal carbonization of agricultural residues. Bioresour. Technol. 2013, 142, 138–146. [Google Scholar] [CrossRef]
- Kruse, A.; Funke, A.; Titirici, M.-M. Hydrothermal conversion of biomass to fuels and energetic materials. Curr. Opin. Chem. Biol. 2013, 17, 515–521. [Google Scholar] [CrossRef]
- Saqib, N.U.; Sharma, H.B.; Baroutian, S.; Dubey, B.; Sarmah, A.K. Valorisation of food waste via hydrothermal carbonisation and techno-economic feasibility assessment. Sci. Total Environ. 2019, 690, 261–276. [Google Scholar] [CrossRef]
- Yu, X.; Liu, S.; Lin, G.; Yang, Y.; Zhang, S.; Zhao, H.; Zheng, C.; Gao, X. Promotion effect of KOH surface etching on sucrose-based hydrochar for acetone adsorption. Appl. Surf. Sci. 2019, 496, 143617. [Google Scholar] [CrossRef]
- Jain, A.; Balasubramanian, R.; Srinivasan, M.P. Tuning hydrochar properties for enhanced mesopore development in activated carbon by hydrothermal carbonization. Microporous Mesoporous Mater. 2015, 203, 178–185. [Google Scholar] [CrossRef]
- Sevilla, M.; Fuertes, A.B. A green approach to high-performance supercapacitor electrodes: The chemical activation of hydrochar with potassium bicarbonate. Chem. Sus. Chem. 2016, 9, 1880–1888. [Google Scholar] [CrossRef]
- Guo, S.; Dong, X.; Liu, K.; Yu, H.; Zhu, C. Chemical, energetic, and structural characteristics of hydrothermal carbonization solid products for lawn grass. Bio. Resour. 2015, 10, 4613–4625. [Google Scholar] [CrossRef]
- Guo, S.; Dong, X.; Wu, T.; Shi, F.; Zhu, C. Characteristic evolution of hydrochar from hydrothermal carbonization of corn stalk. J. Anal. Appl. Pyrolysis 2015, 116, 1–9. [Google Scholar] [CrossRef]
- Guo, S.; Dong, X.; Wu, T.; Zhu, C. Influence of reaction conditions and feedstock on hydrochar properties. Energy Convers. Manag. 2016, 123, 95–103. [Google Scholar] [CrossRef]
- Baccile, N.; Falco, C.; Titirici, M.-M. Characterization of biomass and its derived char using 13 C-solid state nuclear magnetic resonance. Green Chem. 2014, 16, 4839–4869. [Google Scholar] [CrossRef]
- Aragón-Briceño, C.; Ross, A.B.; Camargo-Valero, M.A. Evaluation and comparison of product yields and bio-methane potential in sewage digestate following hydrothermal treatment. Appl. Energy 2017, 208, 1357–1369. [Google Scholar] [CrossRef]
- Aragón-Briceño, C.I.; Grasham, O.; Ross, A.B.; Dupont, V.; Camargo-Valero, M.A. Hydrothermal carbonization of sewage digestate at wastewater treatment works: Influence of solid loading on characteristics of hydrochar, process water and plant energetics. Renew. Energy 2020, 157, 959–973. [Google Scholar] [CrossRef]
- Jackowski, M.; Niedzwiecki, L.; Lech, M.; Wnukowski, M.; Arora, A.; Tkaczuk-Serafin, M.; Baranowski, M.; Krochmalny, K.; Veetil, V.K.; Seruga, P. HTC of Wet Residues of the Brewing Process: Comprehensive Characterization of Produced Beer, Spent Grain and Valorized Residues. Energies 2020, 13, 2058. [Google Scholar] [CrossRef]
- Urbanowska, A.; Kabsch-Korbutowicz, M.; Wnukowski, M.; Seruga, P.; Baranowski, M.; Pawlak-Kruczek, H.; Serafin-Tkaczuk, M.; Krochmalny, K.; Niedzwiecki, L. Treatment of Liquid By-Products of Hydrothermal Carbonization (HTC) of Agricultural Digestate Using Membrane Separation. Energies 2020, 13, 262. [Google Scholar] [CrossRef]
- Wilk, M.; Magdziarz, A.; Jayaraman, K.; Szymańska-Chargot, M.; Gökalp, I. Hydrothermal carbonization characteristics of sewage sludge and lignocellulosic biomass. A comparative study. Biomass Bioenergy 2019, 120, 166–175. [Google Scholar] [CrossRef]
- Liu, Z.; Quek, A.; Kent Hoekman, S.; Srinivasan, M.P.; Balasubramanian, R. Thermogravimetric investigation of hydrochar-lignite co-combustion. Bioresour. Technol. 2012, 123, 646–652. [Google Scholar] [CrossRef]
- Demir-Cakan, R.; Baccile, N.; Antonietti, M.; Titirici, M.M. Carboxylate-rich carbonaceous materials via one-step hydrothermal carbonization of glucose in the presence of acrylic acid. Chem. Mater. 2009, 21, 484–490. [Google Scholar] [CrossRef]
- Liu, K.; Zhang, S.; Hu, X.; Zhang, K.; Roy, A.; Yu, G. Understanding the adsorption of PFOA on MIL-101 (Cr)-based anionic-exchange metal–organic frameworks: Comparing DFT calculations with aqueous sorption experiments. Environ. Sci. Technol. 2015, 49, 8657–8665. [Google Scholar] [CrossRef] [PubMed]
- Vishnyakov, A.; Ravikovitch, P.I.; Neimark, A.V. Molecular Level Models for CO2 Sorption in Nanopores. Langmuir 1999, 15, 8736–8742. [Google Scholar] [CrossRef]
- Gao, J.; Liu, F.; Ling, P.; Lei, J.; Li, L.; Li, C.; Li, A. High efficient removal of Cu (II) by a chelating resin from strong acidic solutions: Complex formation and DFT certification. Chem. Eng. J. 2013, 222, 240–247. [Google Scholar] [CrossRef]
- Gupta, N.K.; Sengupta, A.; Boda, A.; Adya, V.C.; Ali, S.M. Oxidation state selective sorption behavior of plutonium using N, N -dialkylamide functionalized carbon nanotubes: Experimental study and DFT calculation. Rsc. Adv. 2016, 6, 78692–78701. [Google Scholar] [CrossRef]
- Brown, A.B.; McKeogh, B.J.; Tompsett, G.A.; Lewis, R.; Deskins, N.A.; Timko, M.T. Structural analysis of hydrothermal char and its models by density functional theory simulation of vibrational spectroscopy. Carbon 2017, 125, 614–629. [Google Scholar] [CrossRef]
- Chuntanapum, A.; Matsumura, Y. Formation of tarry material from 5-HMF in subcritical and supercritical water. Ind. Eng. Chem. Res. 2009, 48, 9837–9846. [Google Scholar] [CrossRef]
- Latham, K.G.; Simone, M.I.; Dose, W.M.; Allen, J.A.; Donne, S.W. Synchrotron based NEXAFS study on nitrogen doped hydrothermal carbon: Insights into surface functionalities and formation mechanisms. Carbon 2017, 114, 566–578. [Google Scholar] [CrossRef]
- Sevilla, M.; Fuertes, A.B. Chemical and Structural Properties of Carbonaceous Products Obtained by Hydrothermal Carbonization of Saccharides. Chem. A Eur. J. 2009, 15, 4195–4203. [Google Scholar] [CrossRef]
- Falco, C.; Perez Caballero, F.; Babonneau, F.; Gervais, C.; Laurent, G.; Titirici, M.-M.; Baccile, N. Hydrothermal Carbon from Biomass: Structural Differences between Hydrothermal and Pyrolyzed Carbons via 13C Solid State NMR. Langmuir 2011, 27, 14460–14471. [Google Scholar] [CrossRef]
- Baccile, N.; Laurent, G.; Coelho, C.; Babonneau, F.; Zhao, L.; Titirici, M.-M. Structural Insights on Nitrogen-Containing Hydrothermal Carbon Using Solid-State Magic Angle Spinning 13C and 15N Nuclear Magnetic Resonance. J. Phys. Chem. C 2011, 115, 8976–8982. [Google Scholar] [CrossRef]
- Dieguez-Alonso, A.; Funke, A.; Anca-Couce, A.; Rombolà, A.G.; Ojeda, G.; Bachmann, J.; Behrendt, F. Towards biochar and hydrochar engineering—Influence of process conditions on surface physical and chemical properties, thermal stability, nutrient availability, toxicity and wettability. Energies 2018, 11, 496. [Google Scholar] [CrossRef]
- Naderi, M. Chapter Fourteen-Surface Area: Brunauer–Emmett–Teller (BET). In Progress in Filtration and Separation; Tarleton, S., Ed.; Academic Press: Oxford, UK, 2015; pp. 585–608. [Google Scholar]
- Sheng, K.; Zhang, S.; Liu, J.; Shuang, E.; Jin, C.; Xu, Z.; Zhang, X. Hydrothermal carbonization of cellulose and xylan into hydrochars and application on glucose isomerization. J. Clean. Prod. 2019, 237, 117831. [Google Scholar] [CrossRef]
- Clogston, J.D.; Patri, A.K. Zeta Potential Measurement. In Characterization of Nanoparticles Intended for Drug Delivery; McNeil, S.E., Ed.; Humana Press: Totowa, NJ, USA, 2011; pp. 63–70. [Google Scholar]
- Yu, G.X.; Jin, M.; Sun, J.; Zhou, X.L.; Chen, L.F.; Wang, J.A. Oxidative modifications of rice hull-based carbons for dibenzothiophene adsorptive removal. Catal. Today 2013, 212, 31–37. [Google Scholar] [CrossRef]
- Seredych, M.; Lison, J.; Jans, U.; Bandosz, T.J. Textural and chemical factors affecting adsorption capacity of activated carbon in highly efficient desulfurization of diesel fuel. Carbon 2009, 47, 2491–2500. [Google Scholar] [CrossRef]
- Boehm, H.P. Surface oxides on carbon and their analysis: A critical assessment. Carbon 2002, 40, 145–149. [Google Scholar] [CrossRef]
- Frisch, M.J.; Trucks, G.W.; Schlegel, H.B.; Scuseria, G.E.; Robb, M.A.; Cheeseman, J.R.; Scalmani, G.; Barone, V.; Petersson, G.A.; Nakatsuji, H.; et al. Gaussian 09. 2009. Available online: https://gaussian.com/g09citation/ (accessed on 1 May 2020).
- Schmidt, J.R.; Polik, W.F. WebMO Enterprise, Version 20.0; WebMO LLC: Holland, MI, USA. Available online: https://www.webmo.net (accessed on 20 May 2020).
- Becke, A.D. Density-functional exchange-energy approximation with correct asymptotic behavior. Phys. Rev. A 1988, 38, 3098. [Google Scholar] [CrossRef]
- Lee, C.; Yang, W.; Parr, R.G. Development of the Colle-Salvetti correlation-energy formula into a functional of the electron density. Phys. Rev. B 1988, 37, 785. [Google Scholar] [CrossRef]
- Tomasi, J.; Mennucci, B.; Cammi, R. Quantum mechanical continuum solvation models. Chem. Rev. 2005, 105, 2999–3094. [Google Scholar] [CrossRef]
- Kunin, R.; Meitzner, E.F.; Oline, J.A.; Fisher, S.A.; Frisch, N. Characterization of amberlyst 15 macroreticular sulfonic acid cation exchange resin. Ind. Eng. Chem. Prod. Res. Dev. 1962, 1, 140–144. [Google Scholar] [CrossRef]
- Xia, Y.; Liu, H.; Guo, Y.; Liu, Z.; Jiao, W. Immobilization of heavy metals in contaminated soils by modified hydrochar: Efficiency, risk assessment and potential mechanisms. Sci. Total Environ. 2019, 685, 1201–1208. [Google Scholar] [CrossRef] [PubMed]
- Han, L.; Sun, H.; Ro, K.S.; Sun, K.; Libra, J.A.; Xing, B. Removal of antimony (III) and cadmium (II) from aqueous solution using animal manure-derived hydrochars and pyrochars. Bioresour. Technol. 2017, 234, 77–85. [Google Scholar] [CrossRef] [PubMed]
- Shi, Y.; Zhang, T.; Ren, H.; Kruse, A.; Cui, R. Polyethylene imine modified hydrochar adsorption for chromium (VI) and nickel (II) removal from aqueous solution. Bioresour. Technol. 2018, 247, 370–379. [Google Scholar] [CrossRef] [PubMed]
- Timko, M.T.; Wang, J.A.; Burgess, J.; Kracke, P.; Gonzalez, L.; Jaye, C.; Fischer, D.A. Roles of surface chemistry and structural defects of activated carbons in the oxidative desulfurization of benzothiophenes. Fuel 2016, 163, 223–231. [Google Scholar] [CrossRef]
- Petrović, J.T.; Stojanović, M.D.; Milojković, J.V.; Petrović, M.S.; Šoštarić, T.D.; Laušević, M.D.; Mihajlović, M.L. Alkali modified hydrochar of grape pomace as a perspective adsorbent of Pb2+ from aqueous solution. J. Environ. Manag. 2016, 182, 292–300. [Google Scholar] [CrossRef]
- Israelachvili, J.N. Intermolecular and Surface Forces; Academic press: Cambridge, MA, USA, 2011. [Google Scholar]
- Tran, H.; You, S.-J.; Chao, H.-P. Insight into adsorption mechanism of cationic dye onto agricultural residues-derived hydrochars: Negligible role of π-π interaction. Korean J. Chem. Eng. 2017, 34, 1708–1720. [Google Scholar] [CrossRef]
- Doan, V.; Köppe, R.; Kasai, P.H. Dimerization of Carboxylic Acids and Salts: An IR Study in Perfluoropolyether Media. J. Am. Chem. Soc. 1997, 119, 9810–9815. [Google Scholar] [CrossRef]
- Semerciöz, A.S.; Göğüş, F.; Celekli, A.; Bozkurt, H. Development of carbonaceous material from grapefruit peel with microwave implemented-low temperature hydrothermal carbonization technique for the adsorption of Cu (II). J. Clean. Prod. 2017, 165, 599–610. [Google Scholar] [CrossRef]
- Elaigwu, S.E.; Greenway, G.M. Microwave-assisted and conventional hydrothermal carbonization of lignocellulosic waste material: Comparison of the chemical and structural properties of the hydrochars. J. Anal. Appl. Pyrolysis 2016, 118, 1–8. [Google Scholar] [CrossRef]
- Liang, J.; Liu, Y.; Zhang, J. Effect of Solution pH on the Carbon Microsphere Synthesized by Hydrothermal Carbonization. Procedia Environ. Sci. 2011, 11, 1322–1327. [Google Scholar] [CrossRef][Green Version]
- Feng, Z.; Odelius, K.; Rajarao, G.K.; Hakkarainen, M. Microwave carbonized cellulose for trace pharmaceutical adsorption. Chem. Eng. J. 2018, 346, 557–566. [Google Scholar] [CrossRef]
- Mihajlović, M.; Petrović, J.; Kragović, M.; Stojanović, M.; Milojković, J.; Lopičić, Z.; Koprivica, M. Effect of KOH activation on hydrochar surface: FT-IR analysis. RAD Assoc. J. 2017, 2, 65–67. [Google Scholar]
- Libra, J.A.; Ro, K.S.; Kammann, C.; Funke, A.; Berge, N.D.; Neubauer, Y.; Titirici, M.-M.; Fühner, C.; Bens, O.; Kern, J. Hydrothermal carbonization of biomass residuals: A comparative review of the chemistry, processes and applications of wet and dry pyrolysis. Biofuels 2011, 2, 71–106. [Google Scholar] [CrossRef]
- Xia, Y.; Yang, T.; Zhu, N.; Li, D.; Chen, Z.; Lang, Q.; Liu, Z.; Jiao, W. Enhanced adsorption of Pb(II) onto modified hydrochar: Modeling and mechanism analysis. Bioresour. Technol. 2019, 288, 121593. [Google Scholar] [CrossRef]
- Fornes, F.; Belda, R.M.; Lidón, A. Analysis of two biochars and one hydrochar from different feedstock: Focus set on environmental, nutritional and horticultural considerations. J. Clean. Prod. 2015, 86, 40–48. [Google Scholar] [CrossRef]
- Fang, J.; Gao, B.; Chen, J.; Zimmerman, A.R. Hydrochars derived from plant biomass under various conditions: Characterization and potential applications and impacts. Chem. Eng. J. 2015, 267, 253–259. [Google Scholar] [CrossRef]
- Dupont, AMBERLYST™ 15DRY Polymeric Catalyst, product Data Sheet. 2019. Available online: https://www.dupont.com/content/dam/dupont/amer/us/en/water-solutions/public/documents/en/45-D00927-en.pdf (accessed on 1 December 2019).
- Nandan, D.; Gupta, A. Solvent sorption isotherms, swelling pressures, and free energies of swelling of polystyrenesulfonic acid type cation exchanger in water and methanol. J. Phys. Chem. 1977, 81, 1174–1179. [Google Scholar] [CrossRef]
- Davies, C.; Yeoman, G. Swelling equilibria with some cation exchange resins. Trans. Faraday Soc. 1953, 49, 968–974. [Google Scholar] [CrossRef]
- Marcus, Y.; Naveh, J. Anion exchange of metal complexes. XVII. Selective swelling of the exchanger in mixed aqueous-organic solvents. J. Phys. Chem. 1969, 73, 591–596. [Google Scholar] [CrossRef]
- Howery, D.G.; Shore, L.; Kohn, B.H. Proton magnetic resonance studies of the structure of water in Dowex 50 W. J. Phys. Chem. 1972, 76, 578–581. [Google Scholar] [CrossRef]
- Mao, Y.; Fung, B.M. A Study of the Adsorption of Acrylic Acid and Maleic Acid from Aqueous Solutions onto Alumina. J. Colloid Interface Sci. 1997, 191, 216–221. [Google Scholar] [CrossRef] [PubMed]
- Sun, B.; Zhao, Y.; Wu, J.-G.; Yang, Q.-C.; Guang-Xian, X. Crystal structure and FT-IR study of cesium 4-methylbenzenesulfonate. J. Mol. Struct. 1998, 471, 63–66. [Google Scholar] [CrossRef]
- Zhang, X.; Gao, B.; Fang, J.; Zou, W.; Dong, L.; Cao, C.; Zhang, J.; Li, Y.; Wang, H. Chemically activated hydrochar as an effective adsorbent for volatile organic compounds (VOCs). Chemosphere 2019, 218, 680–686. [Google Scholar] [CrossRef] [PubMed]


© 2020 by the authors. Licensee MDPI, Basel, Switzerland. This article is an open access article distributed under the terms and conditions of the Creative Commons Attribution (CC BY) license (http://creativecommons.org/licenses/by/4.0/).