Theoretical and Economic Evaluation of Low-Cost Deep Eutectic Solvents for Effective Biogas Upgrading to Bio-Methane


Abstract
:
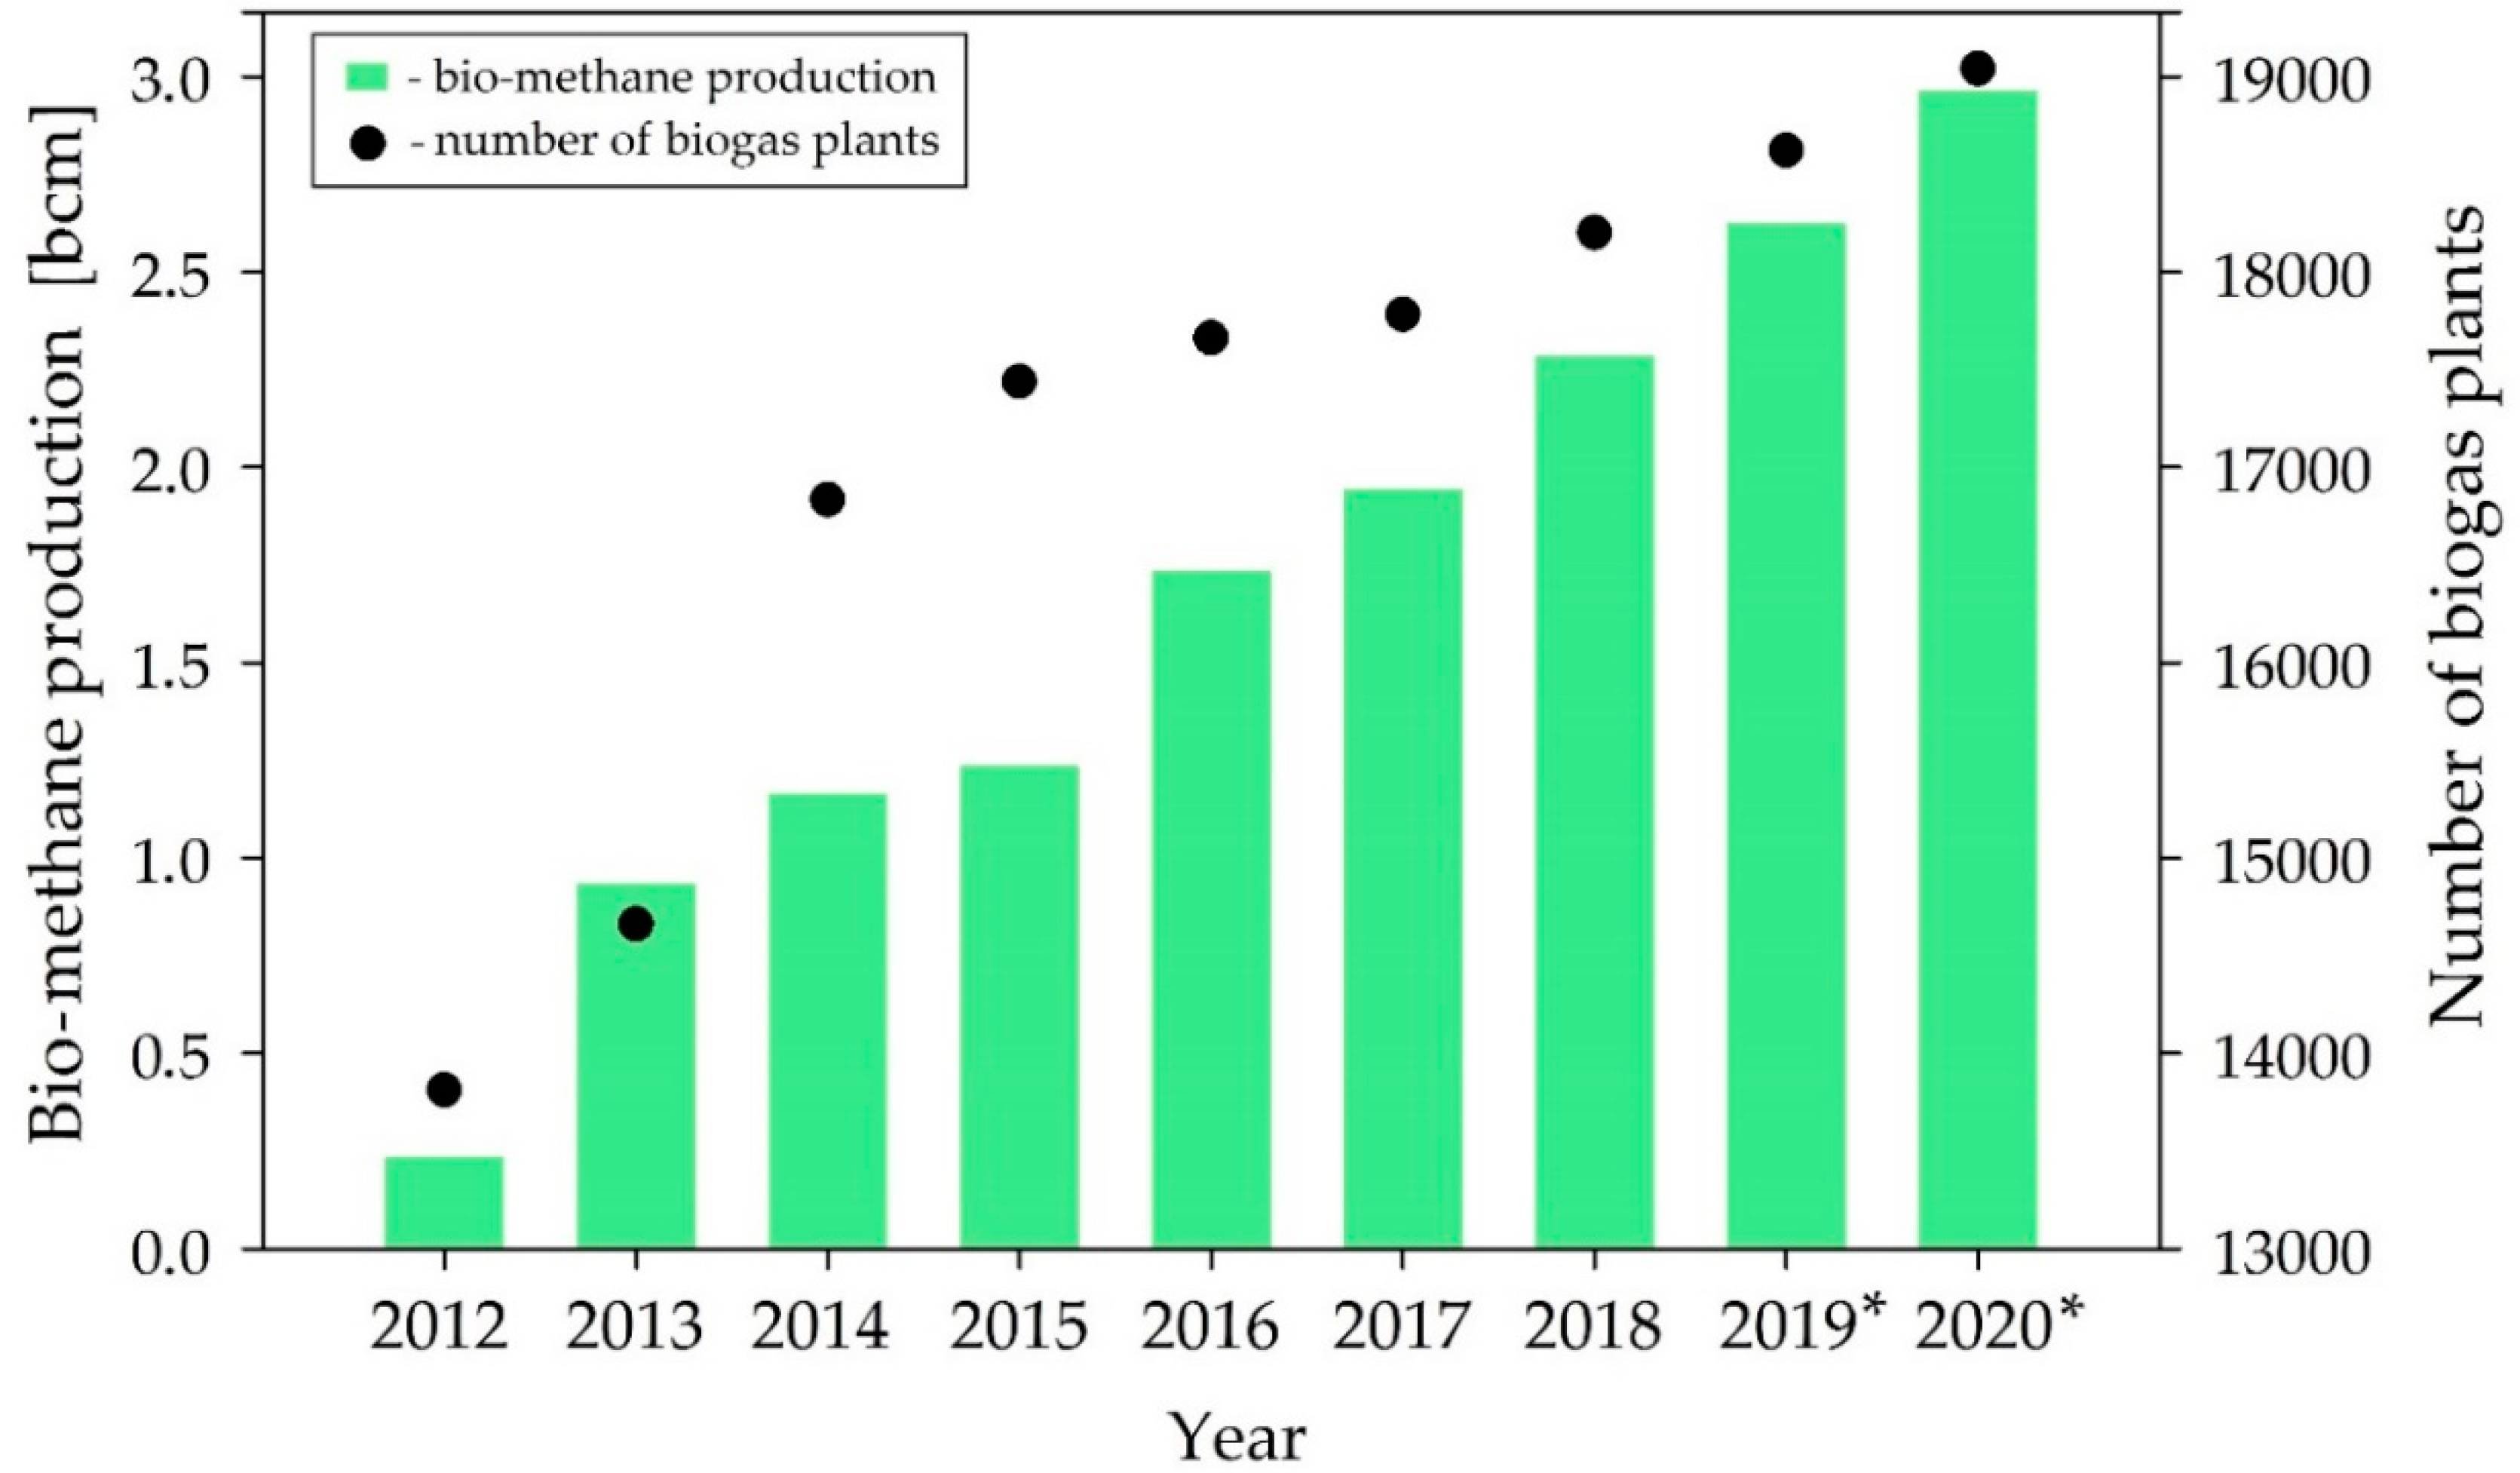
1. Introduction
2. Materials and Methods
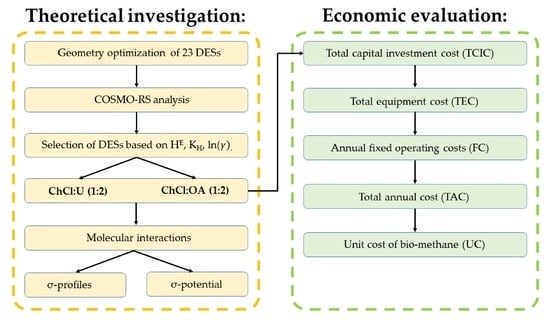
2.1. Procedures
2.1.1. Computational Studies
2.1.2. Biogas Upgrading Technology Description
2.1.3. Cost and Economic Analysis
3. Results and Discussion
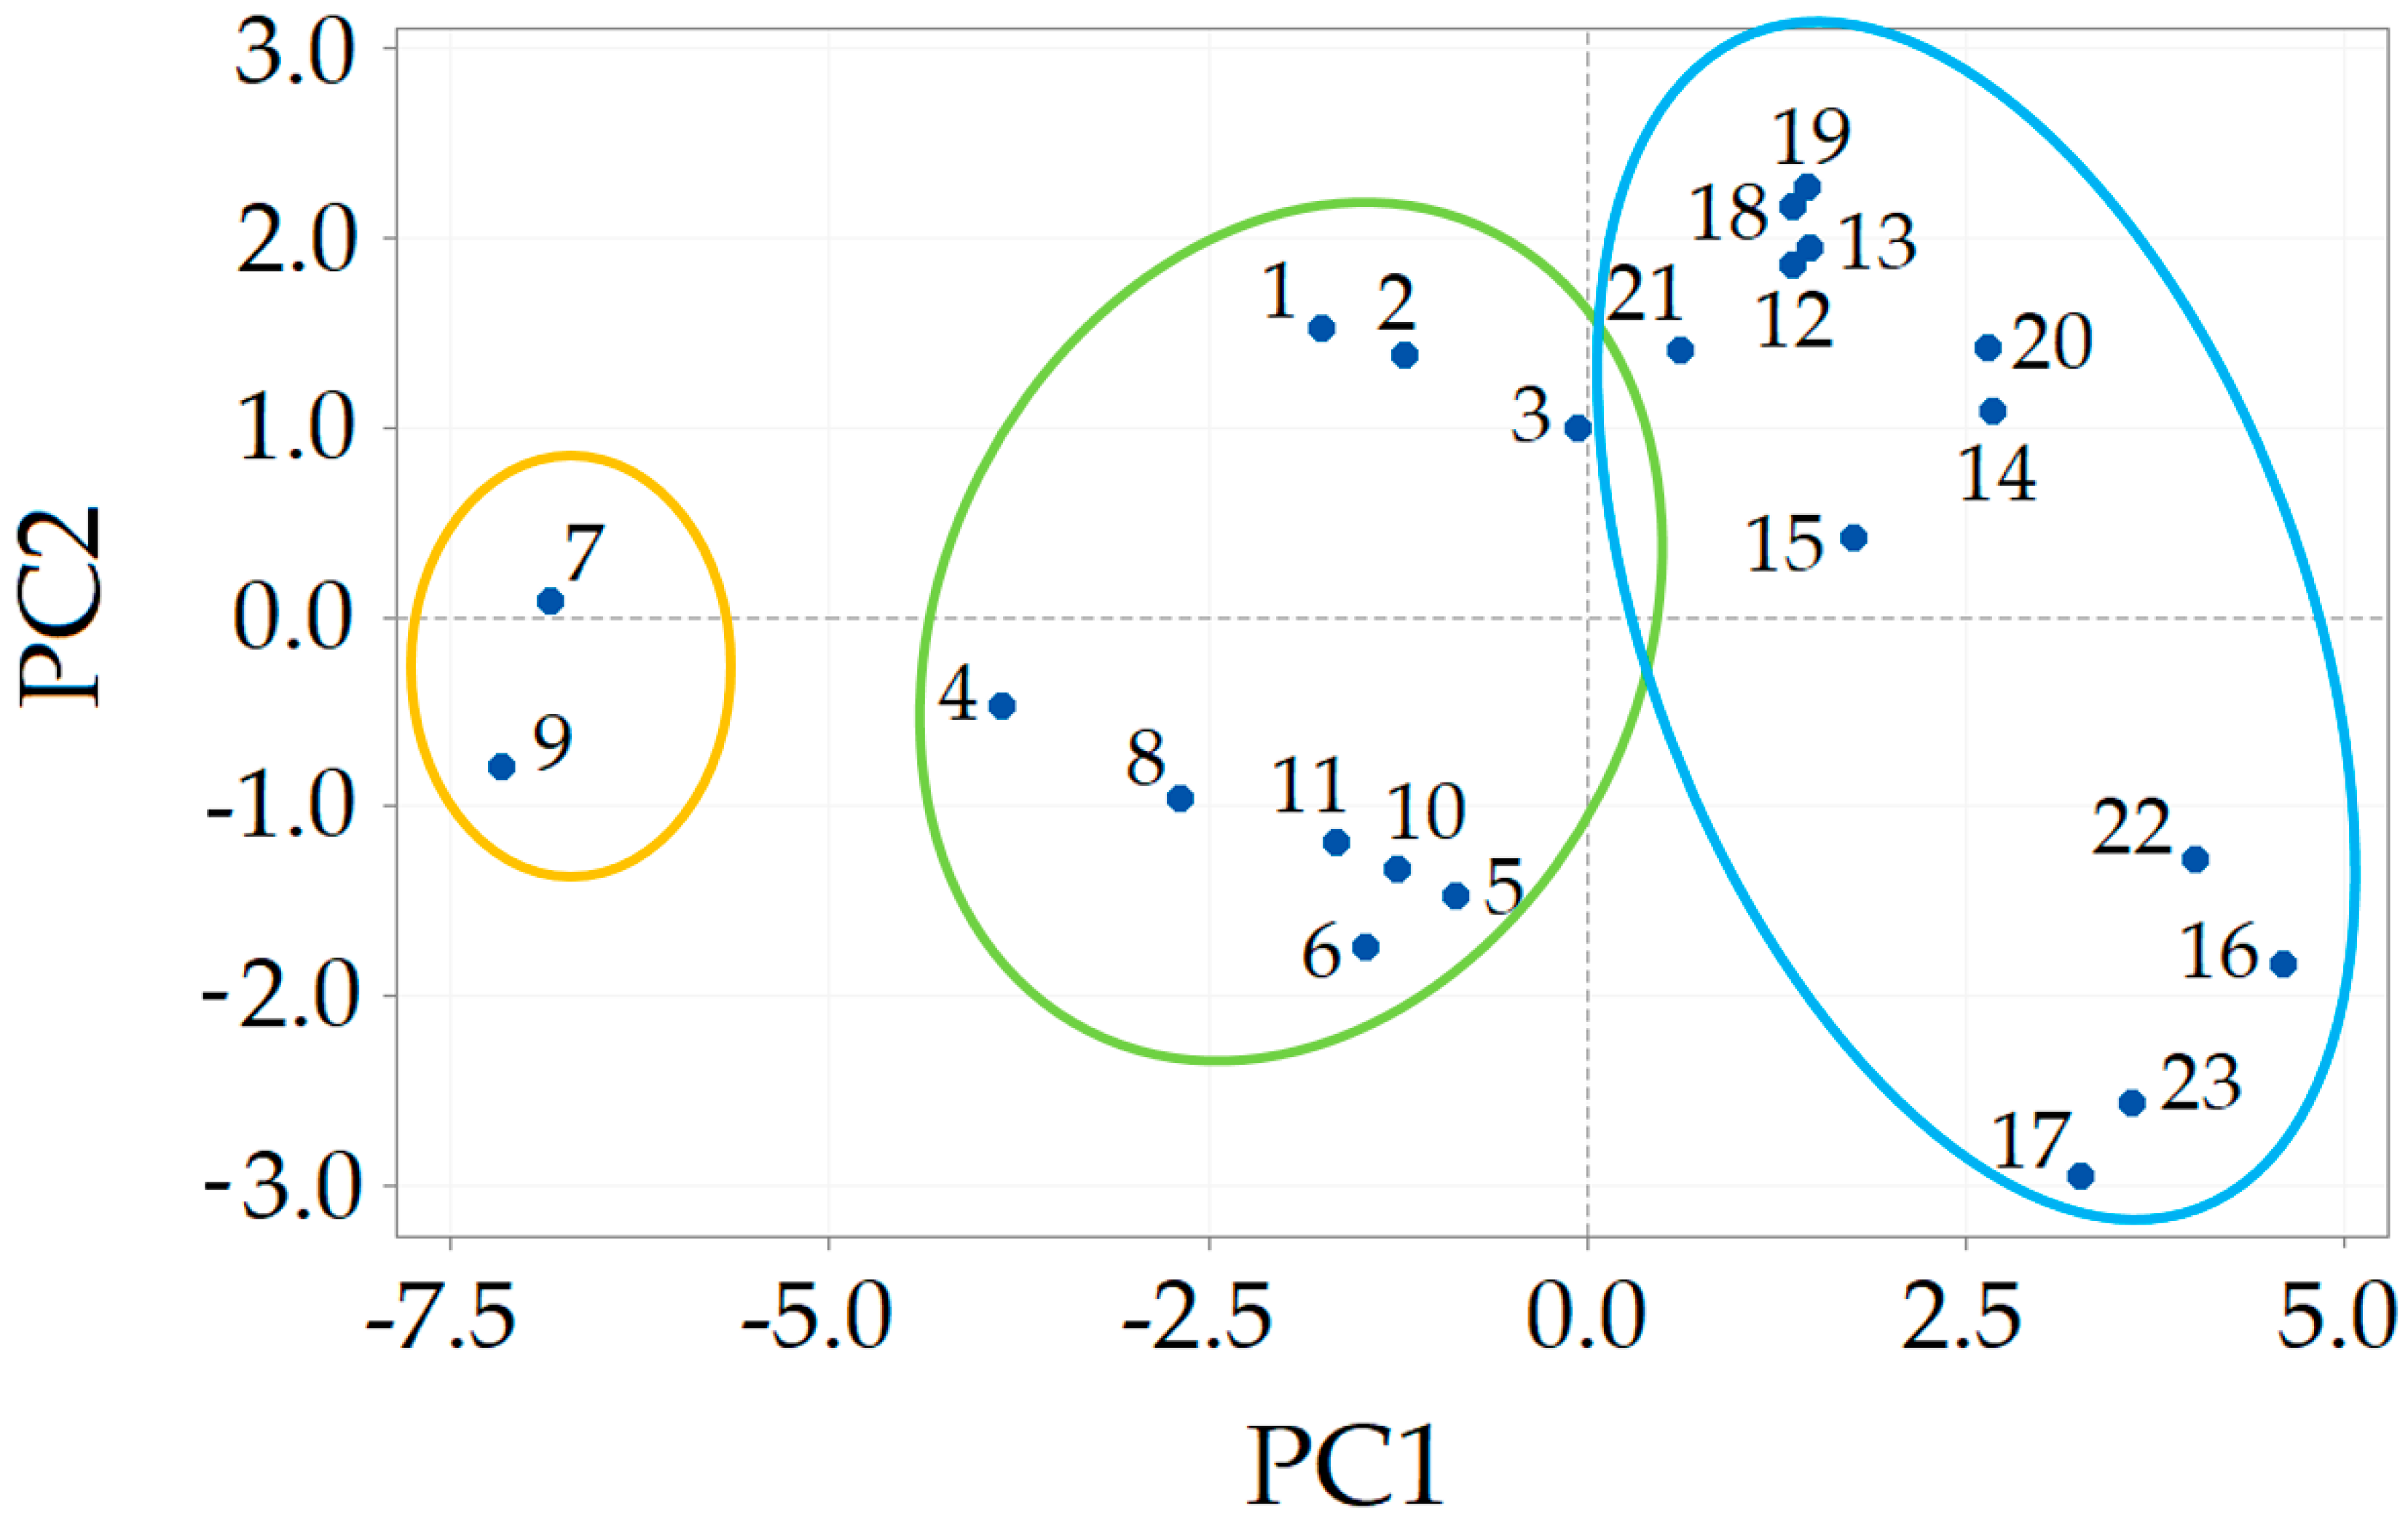
3.1. COSMO-RS Prediction—Pre-Selection of DESs
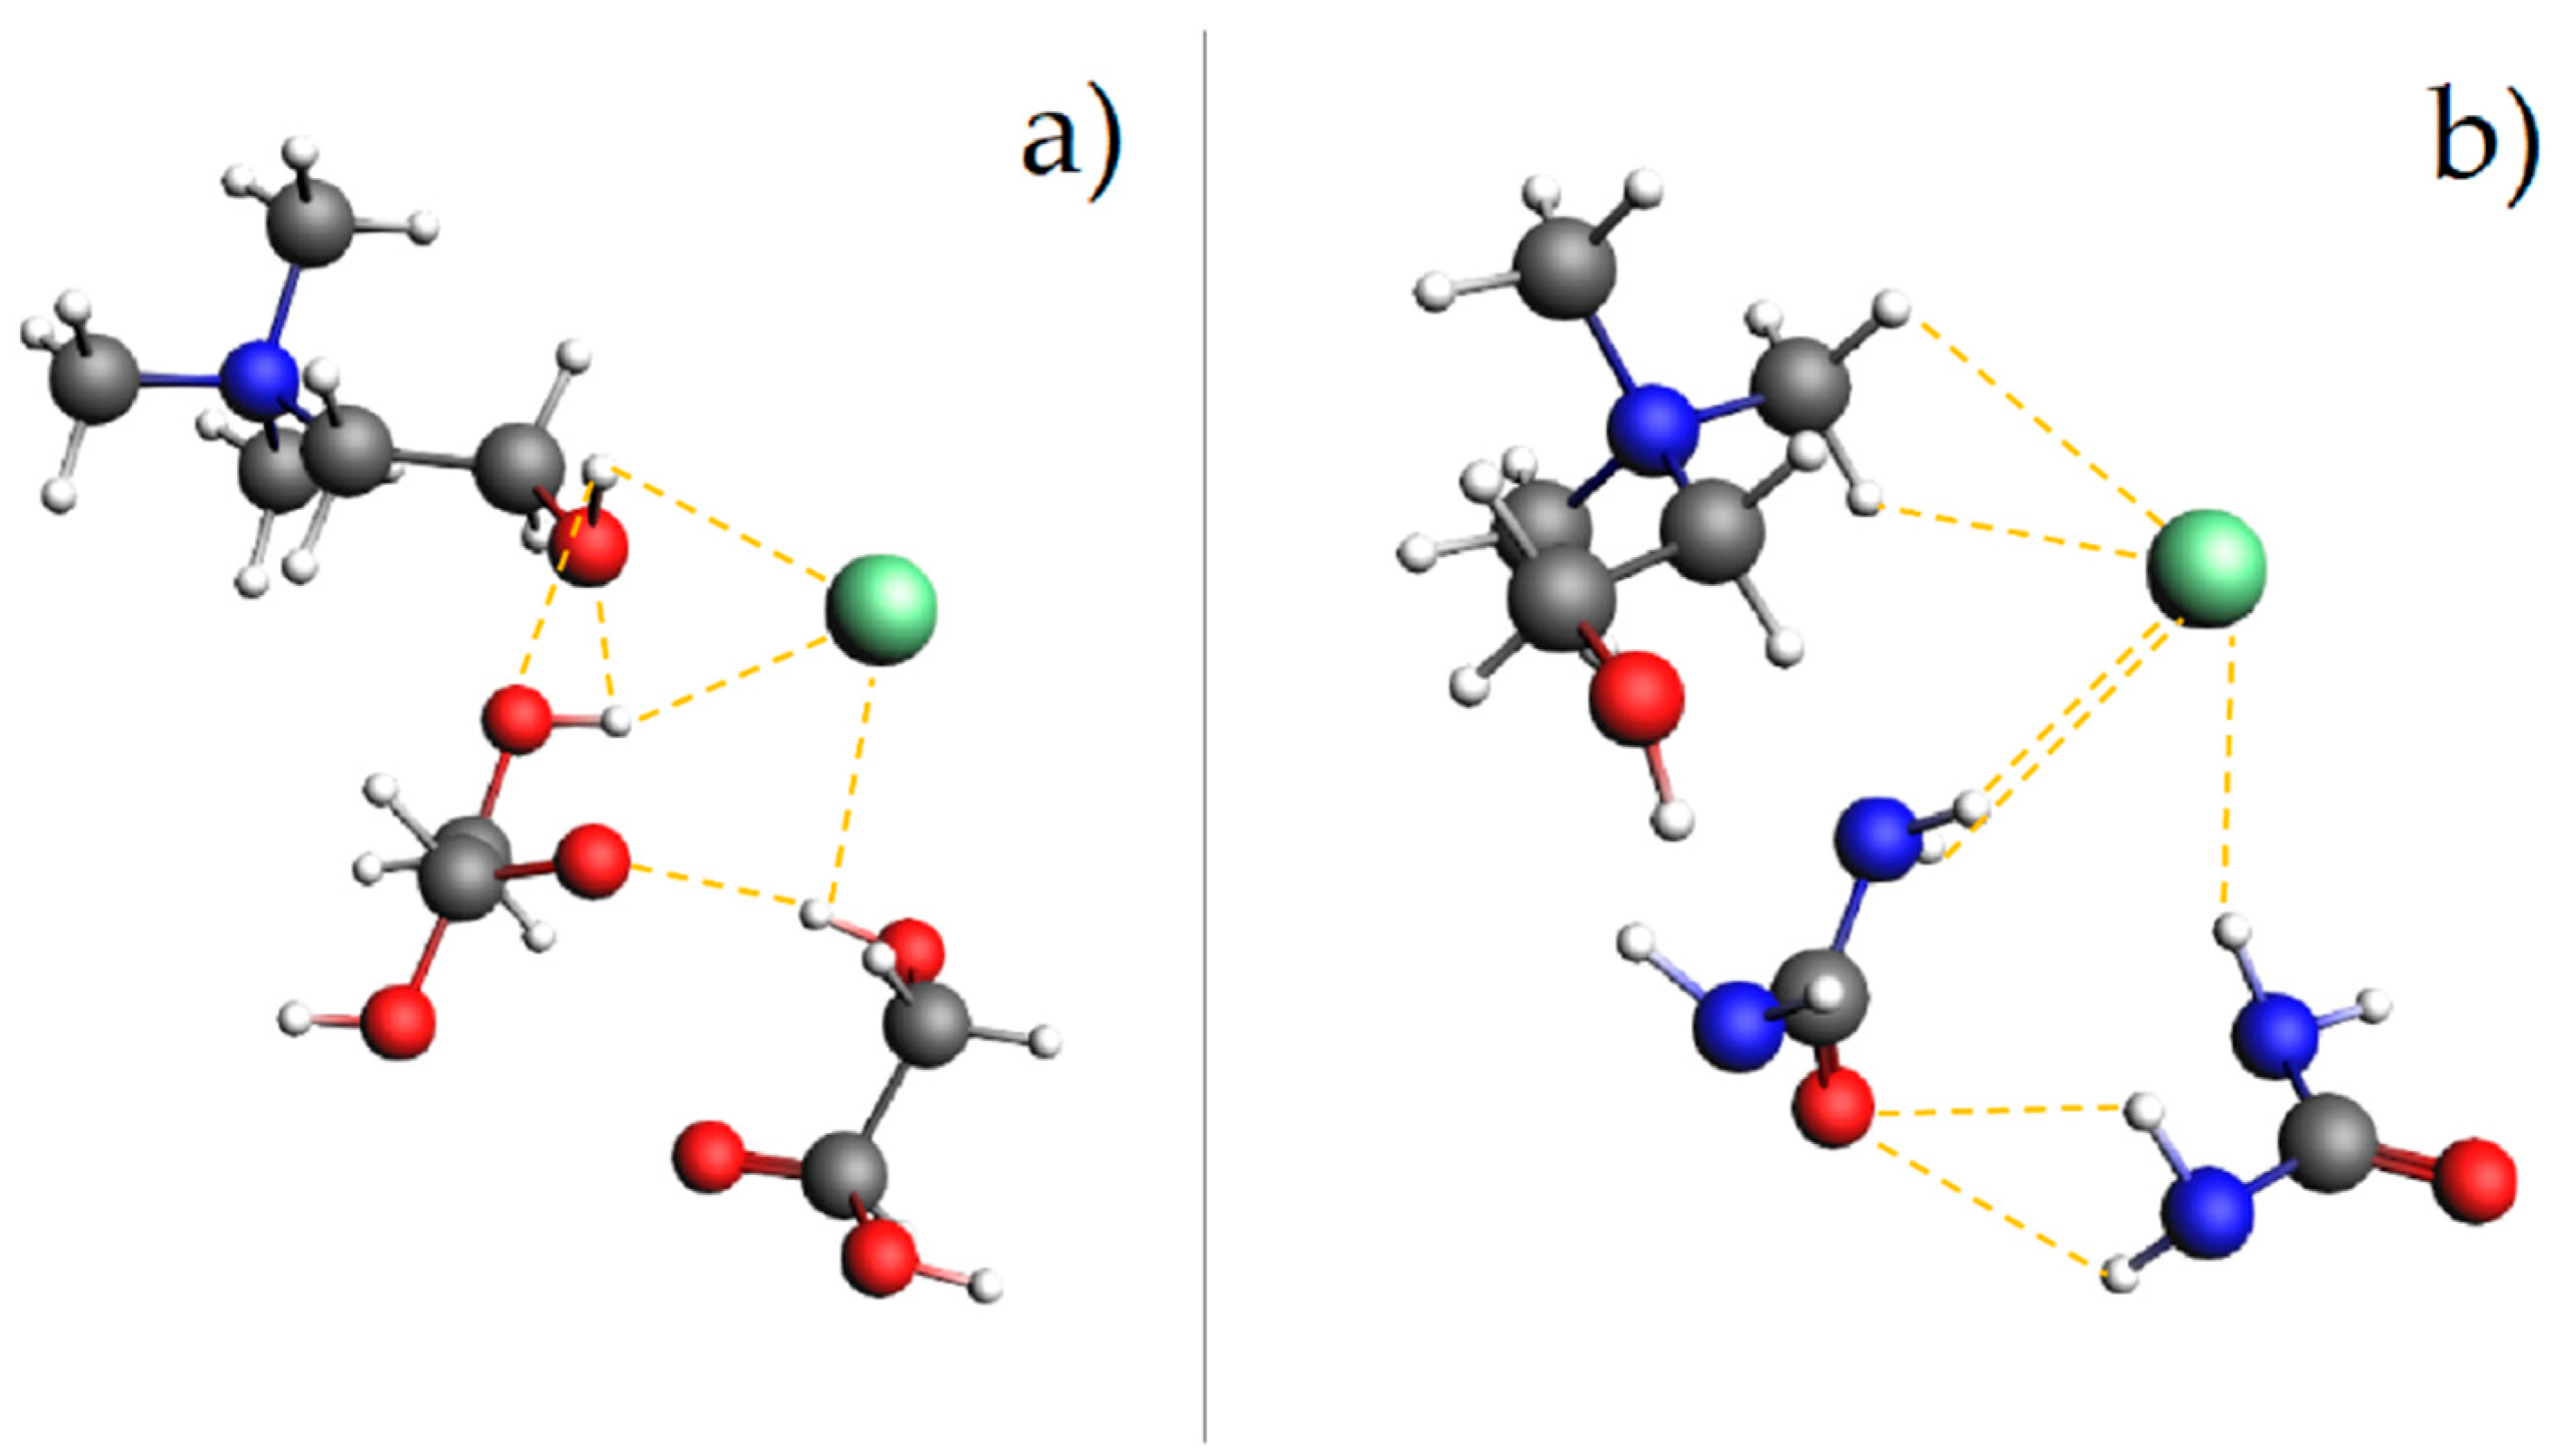
3.2. Molecular Interactions
3.2.1. σ-Profiles
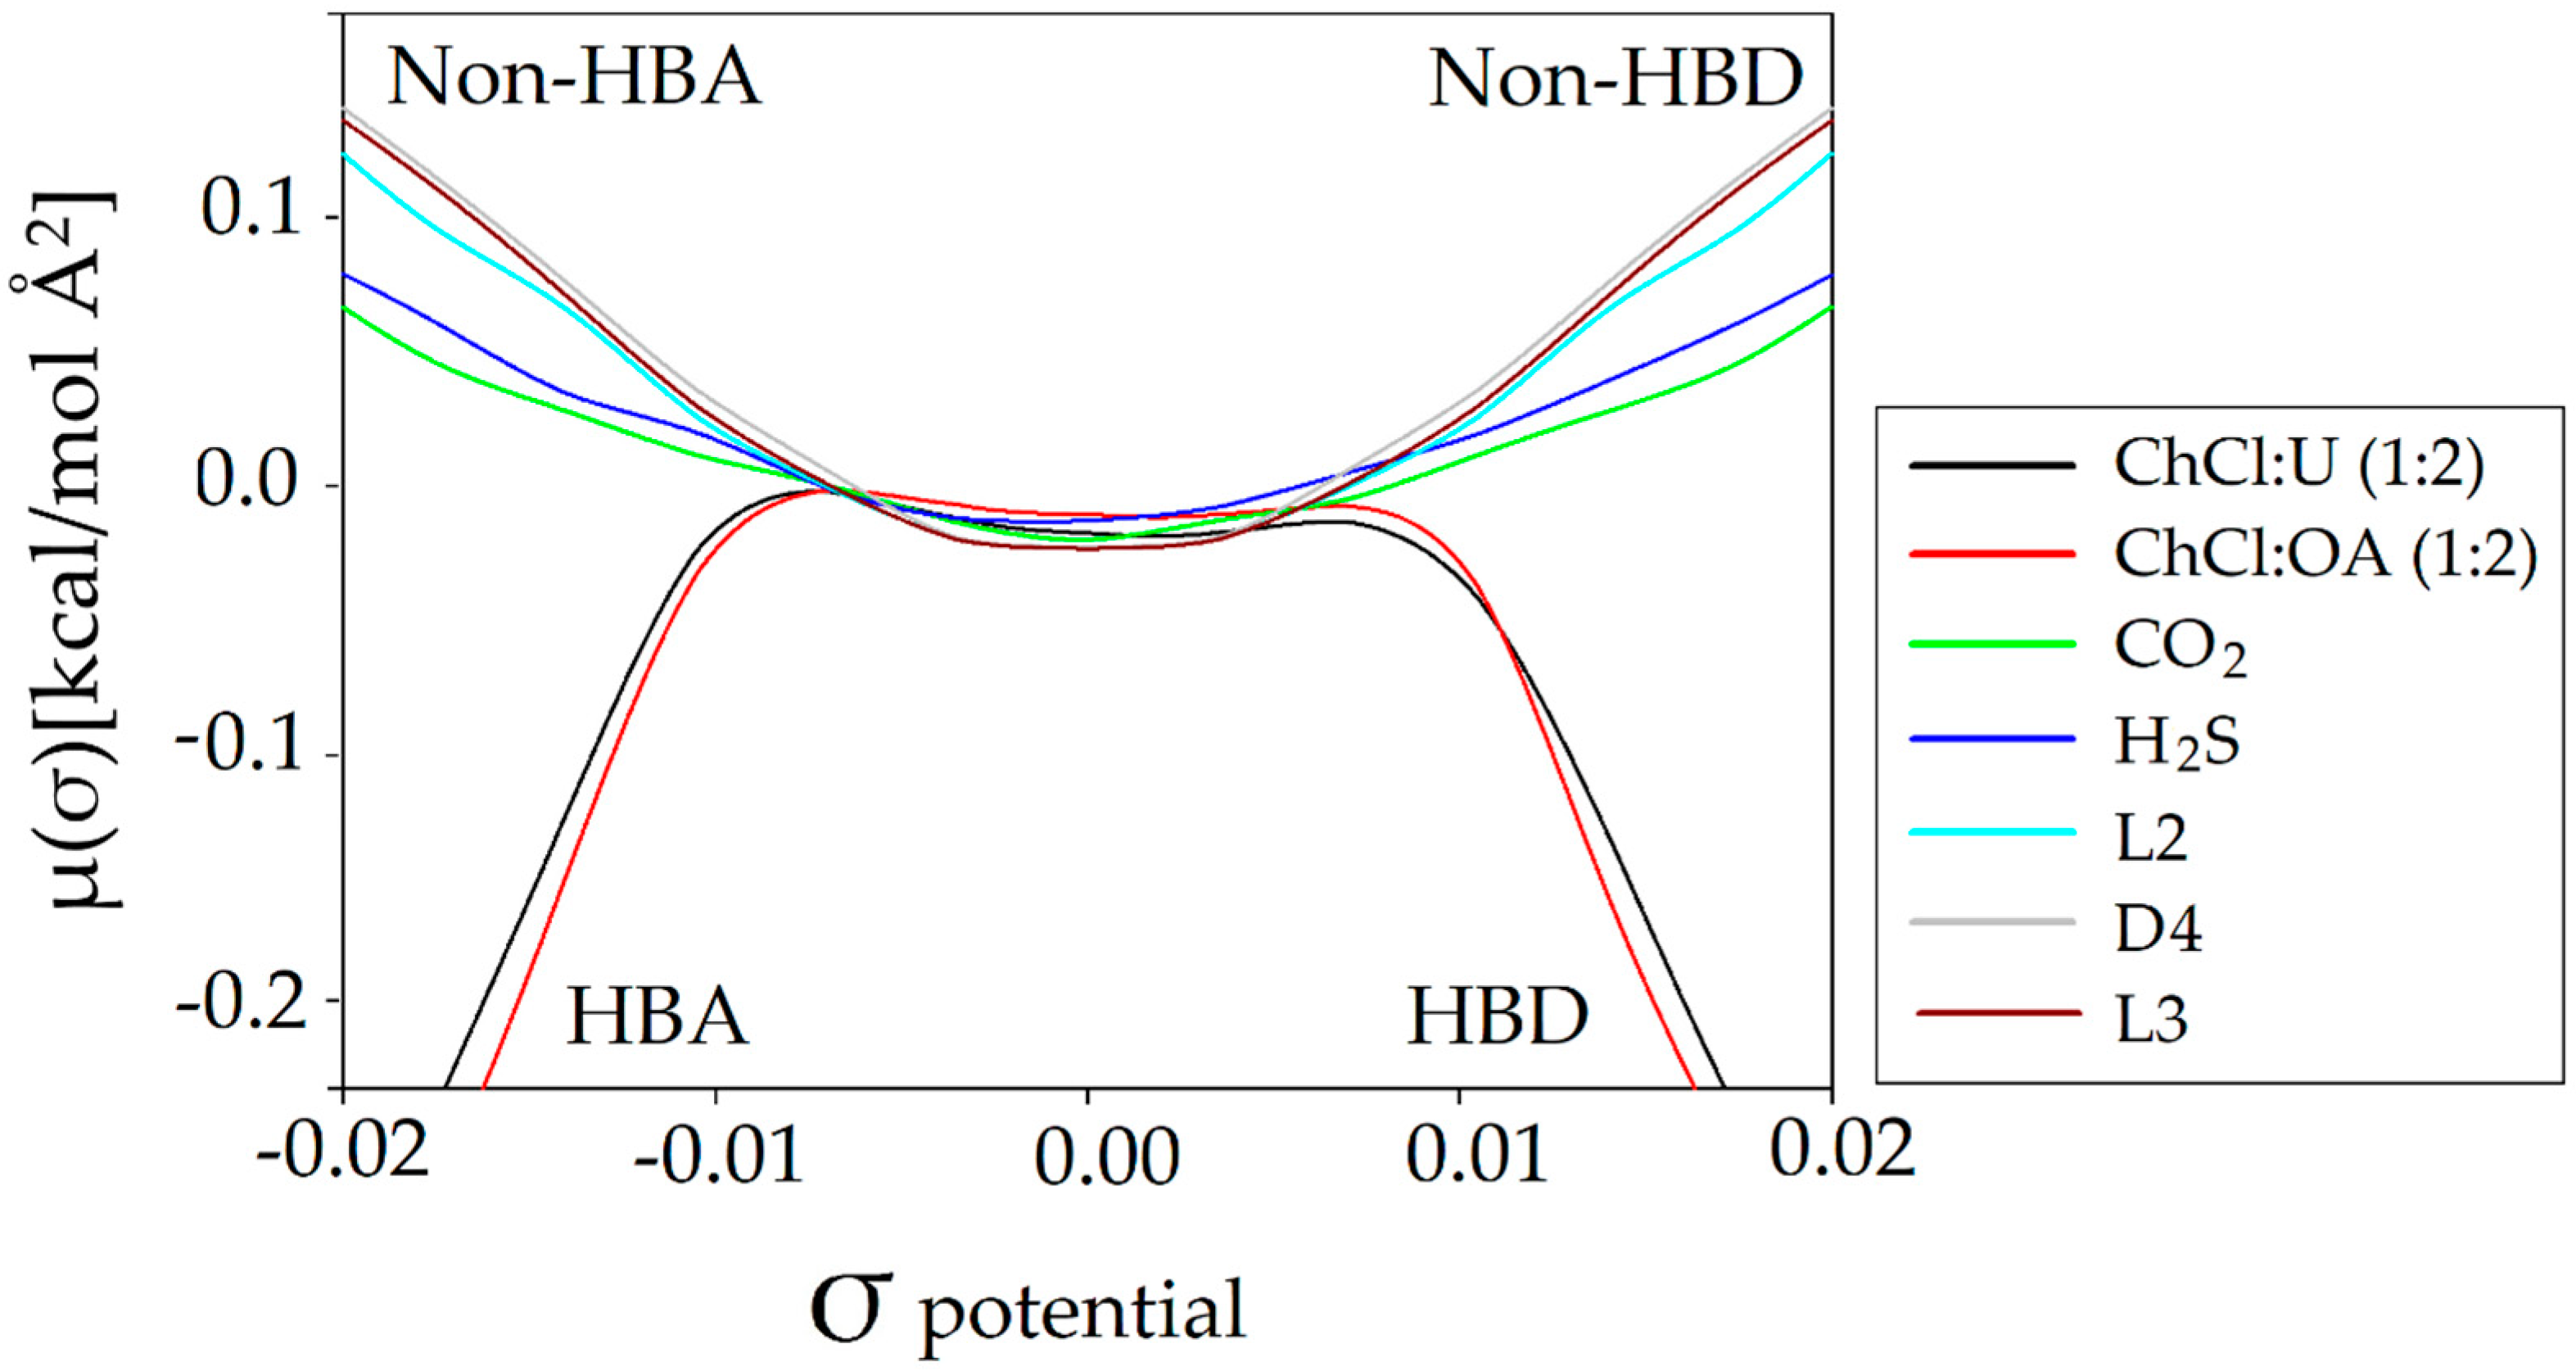
3.2.2. σ-Potential
3.3. Economic Evaluation
3.3.1. Investment Cost
3.3.2. Operation and Maintenance Cost
3.3.3. Economic Comparison of the Overall Biogas Upgrading Process
4. Conclusions
Author Contributions
Funding
Conflicts of Interest
References
- European Biogas Association (EBA). European Biogas Association Annual Report 2019; EBA: Brussels, Belgium, 2019. [Google Scholar]
- European Biogas Association (EBA). Statistical Report 2018: Annual Report; EBA: Brussels, Belgium, 2018; Volume 68. [Google Scholar]
- Persson, M.; Jonsson, O.; Wellinger, A. Biogas Upgrading To Vehicle Fuel Standards and Grid Injection. IEA Bioenergy Task 2007, 37, 1–34. [Google Scholar]
- Andrés, C.; De Guardia, A.; Couvert, A.; Wolbert, D.; Le, S.; Soutrel, I.; Nunes, G. Odor concentration (OC) prediction based on odor activity values (OAVs) during composting of solid wastes and digestates. Atmos. Environ. 2019, 201, 1–12. [Google Scholar]
- Papurello, D.; Soukoulis, C.; Schuhfried, E.; Cappellin, L.; Gasperi, F.; Silvestri, S.; Santarelli, M.; Biasioli, F. Monitoring of volatile compound emissions during dry anaerobic digestion of the Organic Fraction of Municipal Solid Waste by Proton Transfer Reaction Time-of-Flight Mass Spectrometry. Bioresour. Technol. 2012, 126, 254–265. [Google Scholar] [CrossRef] [PubMed]
- Wasajja, H.; Lindeboom, R.E.F.; van Lier, J.B.; Aravind, P.V. Techno-economic review of biogas cleaning technologies for small scale off-grid solid oxide fuel cell applications. Fuel Process. Technol. 2020, 197, 106215. [Google Scholar] [CrossRef]
- Paolini, V.; Petracchini, F.; Segreto, M.; Tomassetti, L.; Naja, N.; Cecinato, A. Environmental impact of biogas: A short review of current knowledge. J. Environ. Sci. Health Part A Toxic Hazard. Subst. Environ. Eng. 2018, 53, 899–906. [Google Scholar] [CrossRef] [PubMed] [Green Version]
- Rasi, S.; Veijanen, A.; Rintala, J. Trace compounds of biogas from different biogas production plants. Energy 2007, 32, 1375–1380. [Google Scholar] [CrossRef]
- Santos-Clotas, E.; Cabrera-Codony, A.; Martín, M.J. Coupling adsorption with biotechnologies for siloxane abatement from biogas. Renew. Energy 2020, 153, 314–323. [Google Scholar] [CrossRef]
- Santos-Clotas, E.; Cabrera-Codony, A.; Boada, E.; Gich, F.; Muñoz, R.; Martín, M.J. Efficient removal of siloxanes and volatile organic compounds from sewage biogas by an anoxic biotrickling filter supplemented with activated carbon. Bioresour. Technol. 2019, 294, 122136. [Google Scholar] [CrossRef]
- Liu, Y.H.; Meng, Z.Y.; Wang, J.Y.; Dong, Y.F.; Ma, Z.C. Removal of siloxanes from biogas using acetylated silica gel as adsorbent. Pet. Sci. 2019, 16, 920–928. [Google Scholar] [CrossRef] [Green Version]
- Ruiling, G.; Shikun, C.; Zifu, L. Research progress of siloxane removal from biogas. Int. J. Agric. Biol. Eng. 2017, 10, 30–39. [Google Scholar]
- Shen, M.; Zhang, Y.; Hu, D.; Fan, J.; Zeng, G. A review on removal of siloxanes from biogas: With a special focus on volatile methylsiloxanes. Environ. Sci. Pollut. Res. 2018, 25, 30847–30862. [Google Scholar] [CrossRef] [PubMed]
- Xiao, Y.; Yuan, H.; Pang, Y.; Chen, S.; Zhu, B.; Zou, D.; Ma, J.; Yu, L.; Li, X. CO2 Removal from Biogas by Water Washing System. Chin. J. Chem. Eng. 2014, 22, 950–953. [Google Scholar] [CrossRef]
- Mandal, B.P.; Biswas, A.K.; Bandyopadhyay, S.S. Selective absorption of H2S from gas streams containing H2S and CO2 into aqueous solutions of N-methyldiethanolamine and 2-amino-2-methyl-1-propanol. Sep. Purif. Technol. 2004, 35, 191–202. [Google Scholar] [CrossRef]
- Jassim, M.S.; Rochelle, G.; Eimer, D.; Ramshaw, C. Carbon Dioxide Absorption and Desorption in Aqueous Monoethanolamine Solutions in a Rotating Packed Bed. Ind. Eng. Chem. Res. 2007, 46, 2823–2833. [Google Scholar] [CrossRef]
- Xu, H.J.; Zhang, C.F.; Zheng, Z.S. Solubility of hydrogen sulfide and carbon dioxide in a solution of methyldiethanolamine mixed with ethylene glycol. Ind. Eng. Chem. Res. 2002, 41, 6175–6180. [Google Scholar] [CrossRef]
- Privalova, E.; Nurmi, M.; Marañón, M.S.; Murzina, E.V.; Mäki-arvela, P.; Eränen, K.; Murzin, D.Y.; Mikkola, J. CO2 removal with ‘switchable’ versus ‘classical’ ionic liquids. Sep. Purif. Technol. 2012, 97, 42–50. [Google Scholar] [CrossRef]
- Gao, J.; Cao, L.; Dong, H.; Zhang, X.; Zhang, S. Ionic liquids tailored amine aqueous solution for pre-combustion CO2 capture: Role of imidazolium-based ionic liquids. Appl. Energy 2015, 154, 771–780. [Google Scholar] [CrossRef]
- Shiflett, M.B.; Yokozeki, A. Solubilities and Diffusivities of Carbon Dioxide in Ionic Liquids: [bmim] [PF 6] and [bmim] [BF 4]. Ind. Eng. Chem. Res. 2005, 4453–4464. [Google Scholar] [CrossRef]
- Jou, F.Y.; Mather, A.E. Solubility of hydrogen sulfide in [bmim][PF 6]. Int. J. Thermophys. 2007, 28, 490–495. [Google Scholar] [CrossRef]
- Pomelli, C.S.; Chiappe, C.; Vidis, A.; Laurenczy, G.; Dyson, P.J. Influence of the interaction between hydrogen sulfide and ionic liquids on solubility: Experimental and theoretical investigation. J. Phys. Chem. B 2007, 111, 13014–13019. [Google Scholar] [CrossRef]
- Rahmati-Rostami, M.; Ghotbi, C.; Hosseini-Jenab, M.; Ahmadi, A.N.; Jalili, A.H. Solubility of H2S in ionic liquids [hmim][PF6], [hmim][BF4], and [hmim][Tf2N]. J. Chem. Thermodyn. 2009, 41, 1052–1055. [Google Scholar] [CrossRef]
- Zhang, X.; Zhang, X.; Dong, H.; Zhao, Z.; Zhang, S.; Huang, Y. Carbon capture with ionic liquids: Overview and progress. Energy Environ. Sci. 2012, 5, 6668–6681. [Google Scholar] [CrossRef]
- Xie, Y.; Zhang, Y.; Lu, X.; Ji, X. Energy consumption analysis for CO2 separation using imidazolium-based ionic liquids. Appl. Energy 2014, 136, 325–335. [Google Scholar] [CrossRef]
- Thuy Pham, T.P.; Cho, C.W.; Yun, Y.S. Environmental fate and toxicity of ionic liquids: A review. Water Res. 2010, 44, 352–372. [Google Scholar] [CrossRef]
- Abbott, A.P.; Capper, G.; Davies, D.L.; Rasheed, R.K.; Tambyrajah, V. Novel Solvent Properties of Choline Chloride/Urea Mixtures. Chem. Commun. 2003, 0, 70–71. [Google Scholar] [CrossRef] [Green Version]
- Azizi, N.; Dezfooli, S.; Khajeh, M.; Hashemi, M.M. Efficient deep eutectic solvents catalyzed synthesis of pyran and benzopyran derivatives. J. Mol. Liq. 2013, 186, 76–80. [Google Scholar] [CrossRef]
- Abbott, A.P.; Barron, J.C.; Ryder, K.S.; Wilson, D. Eutectic-Based Ionic Liquids with Metal-Containing Anions and Cations. Chem. Eur. J. 2007, 13, 6495–6501. [Google Scholar] [CrossRef]
- Mainar, A.R.; Iruin, E.; Colmenares, L.C.; Kvasha, A.; de Meatza, I.; Bengoechea, M.; Leonet, O.; Boyano, I.; Zhang, Z.; Blazquez, J.A. An overview of progress in electrolytes for secondary zinc-air batteries and other storage systems based on zinc. J. Energy Storage 2018, 15, 304–328. [Google Scholar] [CrossRef]
- Werner, S.; Haumann, M.; Wasserscheid, P. Ionic Liquids in Chemical Engineering. Annu. Rev. Chem. Biomol. Eng. 2010, 1, 203–230. [Google Scholar] [CrossRef]
- Sowmiah, S.; Srinivasadesikan, V.; Tseng, M.C.; Chu, Y.H. On the Chemical Stabilities of Ionic Liquids. Molecules 2009, 14, 3780–3813. [Google Scholar] [CrossRef] [Green Version]
- Dai, Y.; Van Spronsen, J.; Witkamp, G.J.; Verpoorte, R.; Choi, Y.H. Ionic liquids and deep eutectic solvents in natural products research: Mixtures of solids as extraction solvents. J. Nat. Prod. 2013, 76, 2162–2173. [Google Scholar] [CrossRef] [PubMed]
- Turosung, S.N.; Ghosh, B. Application of Ionic Liquids in the Upstream oil Industry-A Review. Int. J. Petrochem. Res. 2017, 1, 50–60. [Google Scholar] [CrossRef]
- Smith, E.L.; Abbott, A.P.; Ryder, K.S. Deep Eutectic Solvents (DESs) and Their Applications. Chem. Rev. 2014, 114, 11060–11082. [Google Scholar] [CrossRef] [PubMed] [Green Version]
- Vanda, H.; Dai, Y.; Wilson, E.G.; Verpoorte, R.; Choi, Y.H. Green solvents from ionic liquids and deep eutectic solvents to natural deep eutectic solvents. Comptes Rendus Chim. 2018, 21, 628–638. [Google Scholar] [CrossRef]
- Marcus, Y. Estimation of the Critical Temperatures of Some More Deep Eutectic Solvents from Their Surface Tensions. Adv. Mater. Sci. Eng. 2018, 2018, 2–5. [Google Scholar] [CrossRef] [Green Version]
- Makoś, P.; Słupek, E.; Gębicki, J. Extractive detoxification of feedstocks for the production of biofuels using new hydrophobic deep eutectic solvents – Experimental and theoretical studies. J. Mol. Liq. 2020, in press. [Google Scholar]
- Makoś, P.; Przyjazny, A.; Boczkaj, G. Hydrophobic deep eutectic solvents as “green” extraction media for polycyclic aromatic hydrocarbons in aqueous samples. J. Chromatogr. A 2018, 1570, 28–37. [Google Scholar] [CrossRef] [PubMed]
- Makoś, P.; Boczkaj, G. Deep eutectic solvents based highly efficient extractive desulfurization of fuels—Eco-friendly approach. J. Mol. Liq. 2019, 111916. [Google Scholar] [CrossRef]
- Makoś, P.; Fernandes, A.; Przyjazny, A.; Boczkaj, G. Sample preparation procedure using extraction and derivatization of carboxylic acids from aqueous samples by means of deep eutectic solvents for gas chromatographic-mass spectrometric analysis. J. Chromatogr. A 2018, 1555, 10–19. [Google Scholar] [CrossRef] [PubMed]
- Zhong, F.-Y.; Huang, K.; Peng, H.-L. Solubilities of ammonia in choline chloride plus urea at (298.2–353.2) K and (0–300) kPa. J. Chem. Thermodyn. 2019, 129, 5–11. [Google Scholar] [CrossRef]
- Zhang, K.; Hou, Y.; Wang, Y.; Wang, K.; Ren, S.; Wu, W. Efficient and Reversible Absorption of CO2 by Functional Deep Eutectic Solvents. Energy Fuels 2018, 32, 7727–7733. [Google Scholar] [CrossRef]
- Moura, L.; Moufawad, T.; Ferreira, M.; Bricout, H.; Tilloy, S.; Monflier, E.; Costa Gomes, M.F.; Landy, D.; Fourmentin, S. Deep eutectic solvents as green absorbents of volatile organic pollutants. Environ. Chem. Lett. 2017, 15, 747–753. [Google Scholar] [CrossRef]
- Słupek, E.; Makoś, P.; Gębicki, J. Deodorization of model biogas by means of novel non-ionic deep eutectic solvent. Arch. Environ. Prot. 2020, 46, 41–46. [Google Scholar]
- Słupek, E.; Makoś, P. Absorptive Desulfurization of Model Biogas Stream Using Choline Chloride-Based Deep Eutectic Solvents. Sustainability 2020, 12, 1619. [Google Scholar] [CrossRef] [Green Version]
- Zhang, Y.; Ji, X.; Xie, Y.; Lu, X. Thermodynamic analysis of CO2 separation from biogas with conventional ionic liquids. Appl. Energy 2018, 217, 75–87. [Google Scholar] [CrossRef]
- Ali, E.; Hadj-Kali, M.K.; Mulyono, S.; Alnashef, I. Analysis of operating conditions for CO2 capturing process using deep eutectic solvents. Int. J. Greenh. Gas Control 2016, 47, 342–350. [Google Scholar] [CrossRef]
- Makoś, P.; Słupek, E.; Małachowska, A. Silica Gel Impregnated by Deep Eutectic Solvents for Adsorptive Removal of BTEX from Gas Streams. Materials 2020, 13, 1894. [Google Scholar] [CrossRef] [Green Version]
- Häckl, K.; Kunz, W. Some aspects of green solvents. Comptes Rendus Chim. 2018, 21, 572–580. [Google Scholar] [CrossRef]
- Del Olmo, L.; Lõpez, R.; García De La Vega, J.M. Effect of the molecular structure in the prediction of thermodynamic properties for 1-butyl-3-methylimidazolium chloride ionic liquid. Int. J. Quantum Chem. 2013, 113, 852–858. [Google Scholar] [CrossRef]
- Pye, C.C.; Ziegler, T. An implementation of the conductor-like screening model of solvation within the Amsterdam density functional package. Theor. Chem. Acc. 1999, 101, 396–408. [Google Scholar] [CrossRef]
- AMS 2019.3 COSMO-RS, SCM, Theoretical Chemistry. Vrije Universiteit: Amsterdam, The Netherlands; Available online: http://www.scm.com (accessed on 4 May 2020).
- Rasi, S.; Läntelä, J.; Rintala, J. Upgrading landfill gas using a high pressure water absorption process. Fuel 2014, 115, 539–543. [Google Scholar] [CrossRef]
- Ma, C.; Liu, C.; Lu, X.; Ji, X. Techno-economic analysis and performance comparison of aqueous deep eutectic solvent and other physical absorbents for biogas upgrading. Appl. Energy 2018, 225, 437–447. [Google Scholar] [CrossRef]
- Xie, Y.; Björkmalm, J.; Ma, C.; Willquist, K.; Yngvesson, J.; Wallberg, O.; Ji, X. Techno-economic evaluation of biogas upgrading using ionic liquids in comparison with industrially used technology in Scandinavian anaerobic digestion plants. Appl. Energy 2018, 227, 742–750. [Google Scholar] [CrossRef]
- Scholz, M.; Frank, B.; Stockmeier, F.; Falß, S.; Wessling, M. Techno-economic analysis of hybrid processes for biogas upgrading. Ind. Eng. Chem. Res. 2013, 52, 16929–16938. [Google Scholar] [CrossRef]
- Guthrie, H.M. Capital cost estimation for the chemical and process industries. Chem. Eng. 1969, 32, 114–142. [Google Scholar]
- Euro Statistic Explained Electricity Prices First Semester of 2017_2019 (EUR Per kWh). Available online: https://ec.europa.eu/eurostat/statistics-explained/index.php?title=File:Electricity_prices,_first_semester_of_2017-2019_(EUR_per_kWh).png (accessed on 4 May 2020).
- Alibaba.com Choline Chloride. Available online: https://www.alibaba.com/product-detail/choline-chloride-CAS-67-48-1_62448780792.html?spm=a2700.7724857.normalList (accessed on 4 May 2020).
- Alibaba.com Urea. Available online: https://www.alibaba.com/product-detail/price-per-ton-urea-2019-high_60456580510.html?spm=a2700.7724857.normalList.188.c2e9746du64Jbd (accessed on 4 May 2020).
- Alibaba.com Oxalic Acid. Available online: https://www.alibaba.com/product-detail/99-6-min-Oxalic-Acid-h2c2o4_60767148271.html?spm=a2700.7724857.normalList.11.27d05ea2G45DWC&s=p&bypass=true (accessed on 4 May 2020).
- De Hullu, J.; Massen, J.L.W.; van Meel, P.A.; Shazad, S.; Vaessen, J.M.P. Comparing Different Biogas Upgrading Techniques-Report; Eindhoven University of Technology: Eindhoven, The Netherlands, 2008. [Google Scholar]
- Chu, Y.; He, X. MoDoop: An Automated Computational Approach for COSMO-RS Prediction of Biopolymer Solubilities in Ionic Liquids. ACS Omega 2019, 4, 2337–2343. [Google Scholar] [CrossRef]
- Makoś, P.; Słupek, E.; Gębicki, J. Hydrophobic deep eutectic solvents in microextraction techniques–A review. Microchem. J. 2020, 152. [Google Scholar] [CrossRef]
- Han, J.; Dai, C.; Yu, G.; Lei, Z. Parameterization of COSMO-RS model for ionic liquids. Green Energy Environ. 2018, 3, 247–265. [Google Scholar] [CrossRef]
- Mu, T.; Rarey, J.; Gmehling, J. Performance of COSMO-RS with sigma profiles from different model chemistries. Ind. Eng. Chem. Res. 2007, 46, 6612–6629. [Google Scholar] [CrossRef]
- Mullins, E.; Oldland, R.; Liu, Y.A.; Wang, S.; Sandler, S.I.; Chen, C.C.; Zwolak, M.; Seavey, K.C. Sigma-profile database for using COSMO-based thermodynamic methods. Ind. Eng. Chem. Res. 2006, 45, 4389–4415. [Google Scholar] [CrossRef]
- Salleh, Z.; Wazeer, I.; Mulyono, S.; El-blidi, L.; Hashim, M.A.; Hadj-Kali, M.K. Efficient removal of benzene from cyclohexane-benzene mixtures using deep eutectic solvents—COSMO-RS screening and experimental validation. J. Chem. Thermodyn. 2017, 104, 33–44. [Google Scholar] [CrossRef]
- Liu, Y.-R.; Thomsen, K.; Nie, Y.; Zhang, S.-J.; Meyer, A.S. Predictive screening of ionic liquids for dissolving cellulose and experimental verification. Green Chem. 2016, 18, 6246–6254. [Google Scholar] [CrossRef]
- Hosseinipour, S.A.; Mehrpooya, M. Comparison of the biogas upgrading methods as a transportation fuel. Renew. Energy 2019, 130, 641–655. [Google Scholar] [CrossRef]
- Ryckebosch, E.; Drouillon, M.; Vervaeren, H. Techniques for transformation of biogas to biomethane. Biomass Bioenergy 2011, 35, 1633–1645. [Google Scholar] [CrossRef]
- Petersson, A.; Holm-nielsen, J.B.; Baxter, D. Biogas upgrading technologies—Developments and innovations. IEA Bioenergy Task 2009, 37. [Google Scholar]
- Warren, W.K.E.H. A Techno-economic Comparison of Biogas Upgrading Technologies in Europe. Master’s Thesis, Jyväskylän yliopisto—University of Jyväskylä, Jyväskylä, Finland, 2012; p. 44. [Google Scholar]
- Trading Economics. Available online: https://tradingeconomics.com/commodity/steel?fbclid=IwAR12n6kfQegnqpqrIPqJZ47gjDUh2Q7OIt9BChQosYiJnZSHskCDwczPqJ8 (accessed on 21 May 2020).
- Stürmer, B.; Kirchmeyr, F.; Kovacs, K.; Hofmann, F.; Collins, D.; Ingremeau, C.; Stambasky, J. Technical-Economic Analysis for Determining the Feasibility Threshold for Tradable Biomethane Certificates-Report; European Renewable Gas Registry: Brussels, Belgium, 2016; pp. 1–24. [Google Scholar]
- Chen, W.; Xue, Z.; Wang, J.; Jiang, J.; Zhao, X.; Mu, T. Investigation on the thermal stability of deep eutectic solvents. Wuli Huaxue Xuebao/Acta Phys. Chim. Sin. 2018, 34, 904–911. [Google Scholar] [CrossRef]
- Haz, A.; Strizincova, P.; Majova, V.; Skulcova, A.; Jablonsky, M. Thermal stability of selected deep eutectic solvents. Int. J. Recent Sci. Res. 2016, 7, 14441–14444. [Google Scholar]
- Brown, R.C.; Brown, T.R. Biorenewable Resources: Engineering New Products from Agriculture: Second Edition. Biorenew. Resour. Eng. New Prod. Agric. Second Ed. 2014, 9781118524, 1–375. [Google Scholar]


| Properties | Water | Organic Amine | ILs | DESs |
|---|---|---|---|---|
| The synthesis | No | No | Multi-step synthesis | Easy |
| Applicability | Single function | Single function | Multifunction | Multifunction |
| Tunability | No | No | High | High |
| Thermal stability | Low | Low | Tunable, but generally high | Tunable, but generally high |
| Boiling Points | 100 °C | 111–350 °C | >250 °C | Higher than other solvents (214–1774 °C) |
| Environmentally friendly | Yes | No | Not all | Yes |
| Toxicity | No | Yes | Often increase toxicity for aquatic systems | Acceptable toxicity profiles |
| Corrosive nature | High | High | Low | Low |
| Biodegradability | Readily | Readily | Difficult | Readily |
| Density | Low | Medium | Tunable, but generally higher than other solvents | Tunable, but generally lower than ILs |
| Viscosity | Low | Medium | Tunable, but generally higher than other solvents | Tunable, but generally lower than ILs |
| Surface tension | High | Low | Generally lower than water and higher than organic amine | Low |
| Vapor pressure | High | High | Low | Low |
| Flammability | No | Yes | No | No |
| Nature | Neutral | Basic | Basic/neutral/acid | Basic/neutral/acid |
| Type of absorption | Physical | Chemical/Physical | Physical | Physical |
| Absorption capacity | Medium | Medium | High | High |
| Biodegradable | Yes | No | Poor | Yes |
| Cost | Low | Moderate | High | Low |
| No. | HBA | HBD | HBA:HBD Molar Ratio | Abbreviation |
|---|---|---|---|---|
| 1 | Choline chloride | ethylene glycol | 1:3 | ChCl:EG (1:3) |
| 2 | Choline chloride | glycerol | 1:3 | ChCl:Gly (1:3) |
| 3 | Choline chloride | levulinic acid | 1:3 | ChCl:Lev (1:3) |
| 4 | Choline chloride | lactic acid | 1:2 | ChCl:LA (1:2) |
| 5 | Choline chloride | butyric acid | 1:2 | ChCl:Bu (1:2) |
| 6 | Choline chloride | phenol | 1:2 | ChCl:Ph (1:2) |
| 7 | Choline chloride | urea | 1:2 | ChCl:U (1:2) |
| 8 | Choline chloride | diethylene glycol | 1:2 | ChCl:DEG (1:2) |
| 9 | Choline chloride | oxalic acid | 1:2 | ChCl:OA (1:2) |
| 10 | Choline chloride | methacrylic acid | 1:2 | ChCl:MthA (1:2) |
| 11 | Choline chloride | propylene glycol | 1:2 | ChCl:PG (1:2) |
| 12 | Tetrabutylammonium chloride | ethylene glycol | 1:3 | TBACl:EG (1:3) |
| 13 | Tetrabutylammonium chloride | glycerol | 1:3 | TBACl:Gly (1:3) |
| 14 | Tetrabutylammonium chloride | levulinic acid | 1:3 | TBACl:Lev (1:3) |
| 15 | Tetrabutylammonium chloride | lactic acid | 1:2 | TBACl:LA (1:2) |
| 16 | Tetrabutylammonium chloride | butyric acid | 1:2 | TBACl:Bu (1:2) |
| 17 | Tetrabutylammonium chloride | phenol | 1:2 | TBACl:Ph (1:2) |
| 18 | Tetrapropylammonium bromide | ethylene glycol | 1:3 | TEABr:EG (1:3) |
| 19 | Tetrapropylammonium bromide | glycerol | 1:3 | TEABr:Gly (1:3) |
| 20 | Tetrapropylammonium bromide | levulinic acid | 1:3 | TEABr:Lev (1:3) |
| 21 | Tetrapropylammonium bromide | lactic acid | 1:2 | TEABr:LA (1:2) |
| 22 | Tetrapropylammonium bromide | butyric acid | 1:2 | TEABr:Bu (1:2) |
| 23 | Tetrapropylammonium bromide | phenol | 1:2 | TBABr:Ph (1:2) |
| Parameter | Units | Costs | Ref. |
|---|---|---|---|
| Electricity | EUR/kWh | 0.1 | [59] |
| Heat | EUR/kWh | 0.046 | [57] |
| Personnel | EUR/h | 38.88 | [56] |
| Choline chloride | EUR/t | 4550 | [60] |
| Urea | EUR/t | 218.4 | [61] |
| Oxalic acid | EUR/t | 455 | [62] |
| No. | DES | Activity Coefficient | HE [kJ/mol] | KH [mol/L atm] | ||||||||||||
|---|---|---|---|---|---|---|---|---|---|---|---|---|---|---|---|---|
| L2 | L3 | D4 | H2S | CO2 | L2 | L3 | D4 | H2S | CO2 | L2 | L3 [*103] | D4 [*105] | H2S | CO2 | ||
| 1 | ChCl:EG (1:3) | −5.28 | −6.81 | −6.57 | −0.30 | −1.09 | −5.58 | −5.57 | −5.57 | −5.62 | −5.61 | 50.8 | 1.25 | 3.12 | 1.79 | 0.089 |
| 2 | ChCl:Gly (1:3) | −4.86 | −6.30 | −6.03 | −0.08 | −0.83 | −5.63 | −5.62 | −5.62 | −5.68 | −5.66 | 76.2 | 2.22 | 5.67 | 1.80 | 0.093 |
| 3 | ChCl:Lev (1:3) | −3.68 | −4.77 | −4.42 | 0.16 | −0.54 | −5.68 | −5.68 | −5.68 | −5.73 | −5.71 | 151.3 | 5.67 | 15.49 | 1.90 | 0.104 |
| 4 | ChCl:LA (1:2) | −5.49 | −7.12 | −6.81 | −0.39 | −1.14 | −7.45 | −7.44 | −7.44 | −7.48 | −7.46 | 33.0 | 0.74 | 1.95 | 1.36 | 0.070 |
| 5 | ChCl:Bu (1:2) | −3.13 | −4.04 | −3.66 | 0.01 | −0.54 | −7.52 | −7.51 | −7.52 | −7.53 | −7.52 | 383.8 | 18.57 | 52.76 | 1.89 | 0.119 |
| 6 | ChCl:Ph (1:2) | −3.24 | −4.19 | −3.49 | −0.14 | −0.63 | −7.77 | −7.77 | −7.82 | −7.33 | −7.76 | 366.3 | 17.29 | 69.11 | 1.59 | 0.107 |
| 7 | ChCl:U (1:2) | −8.11 | −10.52 | −10.22 | −1.15 | −2.05 | −7.29 | −7.28 | −7.30 | −7.32 | −7.31 | 1.9 | 0.02 | 0.05 | 0.83 | 0.037 |
| 8 | ChCl:DEG (1:2) | −4.30 | −5.57 | −5.32 | −0.11 | −0.75 | −7.65 | −7.64 | −7.63 | −7.69 | −7.67 | 97.5 | 3.17 | 7.94 | 1.49 | 0.086 |
| 9 | ChCl:OA (1:2) | −8.11 | −10.55 | −9.43 | −1.01 | −1.88 | −8.09 | −8.08 | −8.18 | −8.12 | −8.10 | 3.8 | 0.04 | 0.24 | 0.82 | 0.038 |
| 10 | ChCl:MthA (1:2) | −3.45 | −4.45 | −3.98 | −0.07 | −0.62 | −7.50 | −7.50 | −7.51 | −7.52 | −7.50 | 332.3 | 15.20 | 45.62 | 1.82 | 0.114 |
| 11 | ChCl:PG (1:2) | −3.96 | −5.10 | −4.80 | −0.01 | −0.66 | −7.77 | −7.77 | −7.76 | −7.81 | −7.79 | 203.7 | 7.94 | 20.31 | 2.06 | 0.118 |
| 12 | TBACl:EG (1:3) | −3.39 | −4.36 | −4.12 | 0.18 | −0.43 | −4.13 | −4.13 | −4.13 | −5.62 | −5.61 | 367.9 | 18.13 | 45.69 | 2.04 | 0.120 |
| 13 | TBACl:Lev (1:3) | −2.30 | −2.97 | −2.64 | 0.47 | −0.09 | −4.13 | −4.13 | −4.13 | −5.73 | −5.71 | 640.4 | 39.82 | 107.48 | 2.02 | 0.127 |
| 14 | TBACl:LA (1:2) | −2.97 | −3.83 | −3.53 | 0.43 | −0.11 | −5.35 | −5.35 | −5.35 | −5.38 | −5.35 | 601.2 | 36.54 | 98.86 | 1.96 | 0.125 |
| 15 | TBACl:Bu (1:2) | −1.42 | −1.81 | −1.49 | 0.38 | −0.08 | −5.49 | −5.49 | −5.50 | −5.50 | 5.48 | 1413.2 | 109.25 | 293.16 | 2.10 | 0.146 |
| 16 | TBACl:Ph (1:2) | −1.32 | −1.69 | −1.17 | 0.15 | −0.18 | −5.87 | −5.88 | −5.91 | −5.84 | −5.82 | 1579.3 | 125.21 | 423.11 | 1.63 | 0.128 |
| 17 | TBABr:EG (1:3) | −3.46 | −4.45 | −4.18 | 0.12 | −0.44 | −3.85 | −3.85 | −3.85 | −5.32 | −5.30 | 334.4 | 16.01 | 41.41 | 1.90 | 0.118 |
| 18 | TBABr:Gly (1:3) | −3.28 | −4.25 | −3.95 | 0.21 | −0.34 | −3.67 | −3.66 | −3.66 | −5.37 | −5.36 | 321.7 | 15.68 | 41.48 | 1.77 | 0.112 |
| 19 | TBABr:Lev (1:3) | −2.35 | −3.04 | −2.70 | 0.41 | −0.10 | −3.85 | −3.85 | −3.85 | −5.43 | −5.42 | 593.7 | 36.09 | 98.92 | 1.89 | 0.125 |
| 20 | TBABr:LA (1:2) | −3.03 | −3.92 | −3.59 | 0.03 | −0.50 | −4.97 | −4.53 | −4.98 | −5.00 | −4.98 | 261.8 | 11.87 | 32.05 | 1.56 | 0.101 |
| 21 | TBABr:Bu (1:2) | −1.44 | −1.84 | −1.48 | 0.32 | −0.08 | −5.10 | −5.10 | −4.75 | −5.11 | −5.09 | 1386.6 | 106.58 | 295.07 | 1.97 | 0.145 |
| 22 | TBABr:Ph (1:2) | −1.32 | −1.70 | −1.10 | 0.13 | −0.18 | −5.43 | −5.44 | −5.48 | −5.39 | −5.38 | 1567.8 | 124.03 | 449.89 | 1.60 | 0.129 |
| Type of Impurities | Impurities Concentration | Flow of Individual Impurities | Molar Mass of Impurities | ChCl:U (1:2) | ChCl:OA (1:2) | ||
|---|---|---|---|---|---|---|---|
| Solubility | Saturation Time | Solubility | Saturation Time | ||||
| [%] | [m3/h] | [g/mol] | [mol/L DES] | [h] | [mol/L DES] | [h] | |
| CO2 | 31.0 | 252.03 | 44.01 | 11.53 | 12.89 | 11.49 | 12.84 |
| L2 | 0.02 | 0.16 | 162.38 | 1.42 | 21.89 | 0.24 | 3.73 |
| L3 | 0.02 | 0.16 | 236.53 | 0.99 | 20.76 | 0.10 | 2.01 |
| D4 | 0.02 | 0.16 | 296.62 | 1.09 | 24.51 | 0.14 | 3.12 |
| H2S | 1.04 | 8.46 | 34.10 | 32.93 | 1150.32 | 146.63 | 122.15 |
| Equipment | Description | Equipment Cost (EC) ± SD [EUR] |
|---|---|---|
| Blower | Introduces biogas into the absorber | 42,000 ± 3360 |
| Absorber column | Column diameter: 1 m Column height: 15 m | 50,000 ± 4000 |
| Stripper column | Column diameter: 1 m Column height: 15 m | 50,000 ± 4000 |
| Centrifugal Pump | Pump Power | 46,000 ± 3680 |
| Heat Exchanger | Heat Exchanger | 38,000 ± 3040 |
| Centrifugal Compressor | Compressor Power | 36,000 ± 2880 |
| Dryer | Biogas water collection and disposal | 25,000 ± 2000 |
| Unlisted Equipment | 300,000 ± 24,000 | |
| Total equipment cost (TEC) | 587,000 ± 46,960 | |
| Parameter | Cost ± SD [EUR] for ChCl:U (1:2) | Cost ± SD [EUR] for ChCl:OA (1:2) |
|---|---|---|
| Direct Cost (DC) | ||
| Total equipment cost (TEC) | 587,000 ± 46,960 | 587,000 ± 46,960 |
| Installation instrumentation and control | 610,480 ± 48,838 | 610,480 ± 48,838 |
| Electrical and heat power | 64,570 ± 5166 | 69,950± 5596 |
| Building and building services and equipment installation | 381,550 ± 30,524 | 381,550 ± 30,524 |
| Yard improvement | 58,700 ± 4696 | 58,700 ± 4696 |
| External services | 410,900 ± 32,872 | 410,900 ± 32,872 |
| Total direct cost (TCD) | 2,113,200 ± 169,056 | 2,118,580 ± 169,486 |
| Indirect Cost (IC) | ||
| Engineering and construction site | 434,380 ± 34,750 | 434,380 ± 34,750 |
| Law cost | 23,480 ± 1878 | 23,480 ± 1878 |
| Contractor’s fee | 129,140 ± 10,331 | 129,140 ± 10,331 |
| Incidents | 258,280 ± 20,662 | 258,280 ± 20,662 |
| Total indirect cost (TCI) | 845,280 ± 67,622 | 845,280 ± 67,622 |
| Other Cost (OC) | ||
| Floating capital | 126,792 ± 10,143 | 126,792 ± 10,143 |
| DES batch | 66,816 ± 5345 | 74,277 ± 5942 |
| Total other cost (TOC) | 193,608 ± 15,489 | 201,069 ± 16,086 |
| Total capital investment cost (TCIC) | 3,152,088 ± 252,167 | 3,164,929 ± 253,194 |
| Parameter | Cost ± SD [EUR] of ChCl:U (1:2) | Cost ± SD [EUR] of ChCl:OA (1:2) |
|---|---|---|
| Fixed Cost (FC) | ||
| Regional taxes and insurance | 46,066 ± 3685 | 46,066 ± 3685 |
| Total fixed cost (TFC) | 46,066 ± 3685 | 46,066 ± 3685 |
| Direct Production Cost (DPC) | ||
| Maintenance (M) | 69,099 ± 5528 | 69,099 ± 5528 |
| Salary for the operator (1500 man-hour/year) (SO) (10 Personnel) | 58,320 ± 4666 | 58,320 ± 4666 |
| Supervision (S) | 8748 ± 700 | 8748 ± 700 |
| Operating materials | 10,365 ± 830 | 10,365 ± 830 |
| Changes in electricity cost in the laboratory | 20,425 ± 1634 | 20,425 ± 1634 |
| Total direct production cost (TDPC) | 166,957 ± 13,357 | 166,957 ± 13,357 |
| General Expenses (GE) | ||
| Administrative cost | 1313 ± 105 | 1313 ± 105 |
| Distribution, marketing and R&D cost | 39,710 ± 3177 | 39,710 ± 3177 |
| Total general Expenses (TGE) | 41,023 ± 3282 | 41,023 ± 3282 |
| DES Cost (DESC) | ||
| DES replacement cost | 334,080 ± 26,726 | 445,662 ± 35,653 |
| Depreciation expense | 3339 ± 267 | 339 ± 267 |
| Total DES Cost (TDESC) | 337,419 ± 26,994 | 449,001 ± 35,920 |
| Total operation and maintenance cost (TOC and MC) | 591,465 ± 47,317 | 703,047 ± 56,244 |
| Purification Methods | Total Annual Cost (TAC) | Unit Cost of Bio-Methane (UC) | Ref. |
|---|---|---|---|
| Amine scrubber | 1,104,000 EUR | 0.39 EUR/m3 | [56] |
| Membrane separation | 1,061,000 EUR | 0.38 EUR/m3 | [56] |
| ChCl:OA scrubber | 1,095,685 EUR | 0.37 EUR/m3 | This study |
| ChCl:U scrubber | 982,510 EUR | 0.35 EUR/m3 | This study |
| PSA | 970,000 EUR | 0.35 EUR/m3 | [56] |
| Water scrubbing | 880,000 EUR | 0.33 EUR/m3 | [56] |
© 2020 by the authors. Licensee MDPI, Basel, Switzerland. This article is an open access article distributed under the terms and conditions of the Creative Commons Attribution (CC BY) license (http://creativecommons.org/licenses/by/4.0/).
Share and Cite
Słupek, E.; Makoś, P.; Gębicki, J. Theoretical and Economic Evaluation of Low-Cost Deep Eutectic Solvents for Effective Biogas Upgrading to Bio-Methane. Energies 2020, 13, 3379. https://doi.org/10.3390/en13133379
Słupek E, Makoś P, Gębicki J. Theoretical and Economic Evaluation of Low-Cost Deep Eutectic Solvents for Effective Biogas Upgrading to Bio-Methane. Energies. 2020; 13(13):3379. https://doi.org/10.3390/en13133379
Chicago/Turabian StyleSłupek, Edyta, Patrycja Makoś, and Jacek Gębicki. 2020. "Theoretical and Economic Evaluation of Low-Cost Deep Eutectic Solvents for Effective Biogas Upgrading to Bio-Methane" Energies 13, no. 13: 3379. https://doi.org/10.3390/en13133379
APA StyleSłupek, E., Makoś, P., & Gębicki, J. (2020). Theoretical and Economic Evaluation of Low-Cost Deep Eutectic Solvents for Effective Biogas Upgrading to Bio-Methane. Energies, 13(13), 3379. https://doi.org/10.3390/en13133379