Article

Maximizing Distributed Energy Resource Hosting Capacity of Power System in South Korea Using Integrated Feeder, Distribution, and Transmission System

1
Department of Energy Systems Research, Ajou University, Suwon 16499, Korea
2
Department of Electrical and Computer Engineering, Virginia Tech, Blacksburg, VA 24061, USA
*
Author to whom correspondence should be addressed.
These authors contributed equally to this work.
Energies 2020, 13(13), 3367; https://doi.org/10.3390/en13133367
Submission received: 2 June 2020 / Revised: 19 June 2020 / Accepted: 28 June 2020 / Published: 1 July 2020
(This article belongs to the Special Issue Integrated Transmission and Distribution System Analysis)

Abstract

:
Intermittent power generated from renewable distributed energy resource (DER) can create voltage stability problems in the system during peak power production in the low demand period. Thus, the existing standard for operation and management of the distribution system limits the penetration level of the DER and the amount of load in a power system. In this standard, the hosting capacity of the DER is limited to each feeder at a level where the voltage problem does not occur. South Korea applied this standard, thereby making it hard to achieve its DER target. However, by analyzing the voltage stability of an integrated system, the hosting capacity of DER can be increased. Therefore, in this study, the maximum hosting capacity of DER is determined by analyzing an integrated transmission and distribution system. Moreover, the fast voltage stability index (FVSI) is used to verify the determined hosting capacity of DER. For this, the existing interconnection standard of DER at a feeder, distribution system, and transmission system level is investigated. Subsequently, a Monte Carlo simulation is performed to determine the maximum penetration of the DER at a feeder level, while varying the load according to the standard test system in South Korea. The actual load generation profile is used to simulate system conditions in order to determine the maximum DER hosting capacity.

1. Introduction

The introduction of distributed energy resource (DER) into the power system comes with many challenges. DER use renewable energy, which has intermittent characteristics in its production process. Therefore, problems arise with the integration of DER into the power system. Voltage instability is one of the major roadblocks faced while integrating DER into the conventional power system. The DER may deter voltage stability because its intermittent power generation may cause a mismatch between the load and the generation. As the main factor causing the voltage instability is the inability of the power system to meet demand [1], voltage stability becomes one of the main concerns in increasing the penetration of the DER. Moreover, the DER could cause a reverse power flow [2], which can cause an overvoltage problem. The DER capacity must be limited to prevent voltage collapse in the system.
The limitation of DER hosting capacity does not align with the energy goal of South Korea. Currently, the total interconnected DER capacity in the distribution system is 12,869 MW. In addition, 2800 MW of DER cannot be interconnected in the distribution system because of limited hosting capacity [3,4]. This limitation is enforced to ensure that the power system complies with the rapid voltage change standard, which is limited to 3% (0.03 p.u.) of its nominal voltage [5]. Therefore, the effect of the intermittent DER power generation is limited. The government of South Korea is currently planning to increase the penetration level of renewable energy [6]. The lack of hosting capacity is a major obstacle to their plan.
To increase the DER hosting capacity, certain aspects of the power system must be considered. The work of [7] installed DER in the bus with the weakest voltage profile, and then, used a stochastic analysis to determine the maximum hosting capacity for the system. Other methods to increase the hosting capacity include adapting the control mode of the DER [8,9]. The creation of an adaptable DER control, based on the load in the system, was proposed to increase DER hosting capacity. In reference [10], active power from the DER was controlled in real time to limit over voltages by predicting the dynamic Thevenin equivalent of the system.
The increase in DER hosting capacity can benefit both the utility companies and the future DER owners [10,11]. For utility companies, they can reduce capital expenditures (CAPEX) by decreasing the necessity for new distribution facilities. On the other hand, the DER owners can avoid the event in which the DER cannot be integrated into the distribution line by a lack of hosting capacity. Therefore, the DER owner can prevent delays in profit realization.
The previous studies focused on increasing DER hosting capacity by modeling the DER as an aggregated value in a bus. Moreover, these studies considered the capacity limit in order to prevent reverse power flow, which is the main cause of a voltage rise problem in the distribution system [12]. However, they did not consider how the DER can affect each individual feeder in the power system. The smallest system considered in these studies to increase the DER hosting capacity is a distribution system [3,4,7]. However, when using a more accurate but bigger model, a reverse power flow in one of the distribution feeders is permissible if another feeder in the distribution system has insufficient supply. Moreover, in the transmission system, the reverse power flow can be permitted because the distribution can be treated as a PV bus. Therefore, the reverse power flow from the distribution system is used to supply other parts of the transmission system with voltage stability as the control variable.
An integrated transmission and distribution system has been simulated in reference [13]. The results show that studying the integrated transmission and distribution system can yield different voltage profiles than merely studying the transmission system. It was shown that by studying an integrated system, the effect of DER penetration can be better captured. Therefore, this study investigates an approach to increase the DER capacity by considering the integrated transmission and distribution system. First, the existing DER interconnection standards are considered. Then, Monte Carlo simulation (MCS) is performed to determine the maximum penetration of DER in a feeder while the load is varied. Furthermore, a distribution system is analyzed to find the maximum penetration of the DER at a feeder level that will not violate the fast voltage stability index (FVSI) limit. Finally, both distribution and transmission are analyzed to determine the maximum capacity of the DER at the transmission level that does not violate the voltage stability requirement. The actual load generation profiles of the power system in South Korea are used to simulate one month of operation using the integrated system.

2. South Korea’s Standard for DER in the Power System

In South Korea, the interconnection of the DER in the distribution system and the operational rules of the distribution system are controlled by Korea Electric Power Corporation (KEPCO).
The overall scheme of the power system in South Korea is depicted in Figure 1. Referring to Figure 1, the DER in South Korea is in the distribution system except for cases where the capacity of the DER is greater than 20 MW.
When the DER is integrated into the power system, the technical specification of the DER at the integration point should be satisfied during the planning process. The standard of technical specification for interconnection states that the synchronization variables, including the frequency, voltage, and angle, at the point of common coupling, should be maintained within the stipulated ranges [14].
However, the hosting capacity of the DER is not determined based on the standard for the interconnection of the DER. The hosting capacity is based on the standard for operation of the distribution system. According to the current standard for operation of a distribution system, the maximum capacity of the DER that can be integrated into the distribution system is limited to 10 MW per distribution line. The current hosting capacity of a feeder is determined by the technical characteristics of the distribution line. In South Korea, the distribution line in which the DER can be integrated uses a line structure with three divisions and three ties. In addition, the distribution system can be segregated based on the voltage level, as illustrated in Table 1. The type of distribution line which the DER is linked to depends on the its capacity. If the capacity is lower than 500 kW, the DER can be integrated into the low or high voltage line. In this case, the type of distribution is determined by considering the physical constraints of the DER location. On the other hand, if the DER capacity is between 500 and 10,000 kW, then it can be integrated only into the high voltage distribution line. Therefore, most of the DER is integrated into the high voltage distribution line.
The maintenance range of the voltages for each type of distribution line are presented in Table 2. For the high voltage, where most of the DER is integrated, the value of the nominal voltage is 22,900 V and the upper and lower limit values are 20,800 and 23,800 V, respectively.
The maximum allowable capacity for each type of distribution line is listed in Table 3. The allowable capacity of distribution lines is calculated by using the technical specifications of distribution lines. For the normal distribution line, three divisions with three tie types based on the ACSR-OC 160 mm2 are applied. The allowable current for this type is 395 A, which can be converted into 15.7 MVA. Subsequently, the allowable capacity for the emergency state and steady state are 14 and 10 MVA, respectively.
Moreover, the power company decided to increase the hosting capacity of feeder to prepare for the diffusion of utilization of DER [15]. In that plan, the allowable capacity for a normal distribution line in the steady state is increased from 10,000 to 12,000 kW. For large-capacity distribution lines, the allowable capacity is increased from 15,000 to 18,000 kW.

3. Fast Voltage Stability Index

Voltage stability is the ability of a power system to maintain acceptable steady voltages at all the buses in the system after being subjected to a disturbance [1]. A system is stated to be voltage instable if a disturbance, e.g., a load increase, causes a progressive and uncontrollable drop in voltage. The FVSI is an index that is developed from the current equation through a branch in a two-bus system [16].
In Figure 2, the sending bus is denoted as ‘i’ and the receiving bus as ‘j’. Considering the sending bus (bus i) as the reference, by assuming that the voltage angle in bus i, δ i , is 0, the general current equation can be stated as:
I = V i 0 V j δ i R + j X
where R represents the branch resistance and X denotes branch reactance. A further derivation of (1) can produce:
V 2 ( R X sin δ + cos δ ) V i V j + ( X + R 2 X ) Q j = 0
As (2) is a quadratic equation of V j , its roots can be summarized as follows:
V j = ( R X sin δ + cos δ ) V 1 ± [ ( R X sin δ + cos δ ) V i ] 2 4 ( X + R 2 X ) Q j 2
FVSI is defined as the real root of (3). Therefore, the discriminant must be greater than or equal to 0, i.e.,
[ ( R X sin δ + cos δ ) V i ] 2 4 ( X + R 2 X ) Q j 0
By manipulating the variable in (4), we obtain the following relation:
4 Z 2 Q 2 X ( V 1 ) 2 ( R sin δ + X cos δ ) 2 1
When the system is balanced, the angle difference can be assumed to be very small. Thus, δ 0 , R sin δ 0 , X cos δ X . Therefore, the FVSI can be defined as:
F V S I i j = 4 Z 2 Q j V i 2 X
Analyzing (5), we conclude that the maximum value of FVSI that does not cause voltage instability is 1. The branch containing the FVSI closest to 1 implies that it is nearing the voltage collapse point, as the root of Equation (3) becomes imaginary.

4. Maximizing the Hosting Capacity with Monte Carlo Simulation

4.1. Monte Carlo Simulation

A Monte Carlo Simulation (MCS) is used to calculate the value of a desired function by using randomly extracted numbers. This random number generator can follow any kind of distribution. It is widely used for problems with high a degree of freedom, but it has a characteristic that should account for some errors. In this study, a uniform distribution is used to generate the simulation scenario.
In addition, a single result from an MCS cannot represent the overall trend of the results; it cannot be the sole parameter considered for decision making. Because the MCS includes a distribution of results, statistical methodology can be accepted to obtain parameters for decision making. In this manner, the interquartile range (IQR) and confidence interval (CI) are used to judge the stability of the system for various capacities of integrated DER. The IQR is a measure of data variability, and it can be calculated by obtaining the difference between the largest and smallest values in the middle 50% of a data set. The mathematical formation of the IQR is presented below:
I Q R = Q 3 Q 1
where Q3 is the 75th percentile and Q1 is the 25th percentile.
The CI is a method for interval estimation, and it is defined as a section in which the actual parameter is expected to exist. Various interval estimations, such as 90%, 95%, and 99% CI are possible. Among those, the most extensively used is 95% CI, and it means that there is a 95% possibility that there is an actual average within the predicted section. The 95% CI can be calculated as shown below:
C I 95 = X ¯ ± 1.96 × s n
where X ¯ is the average of sample, s is the standard deviation of sample, and n is the size of the sample.

4.2. Proposed Algorithm to Increase DER Hosting Capacity

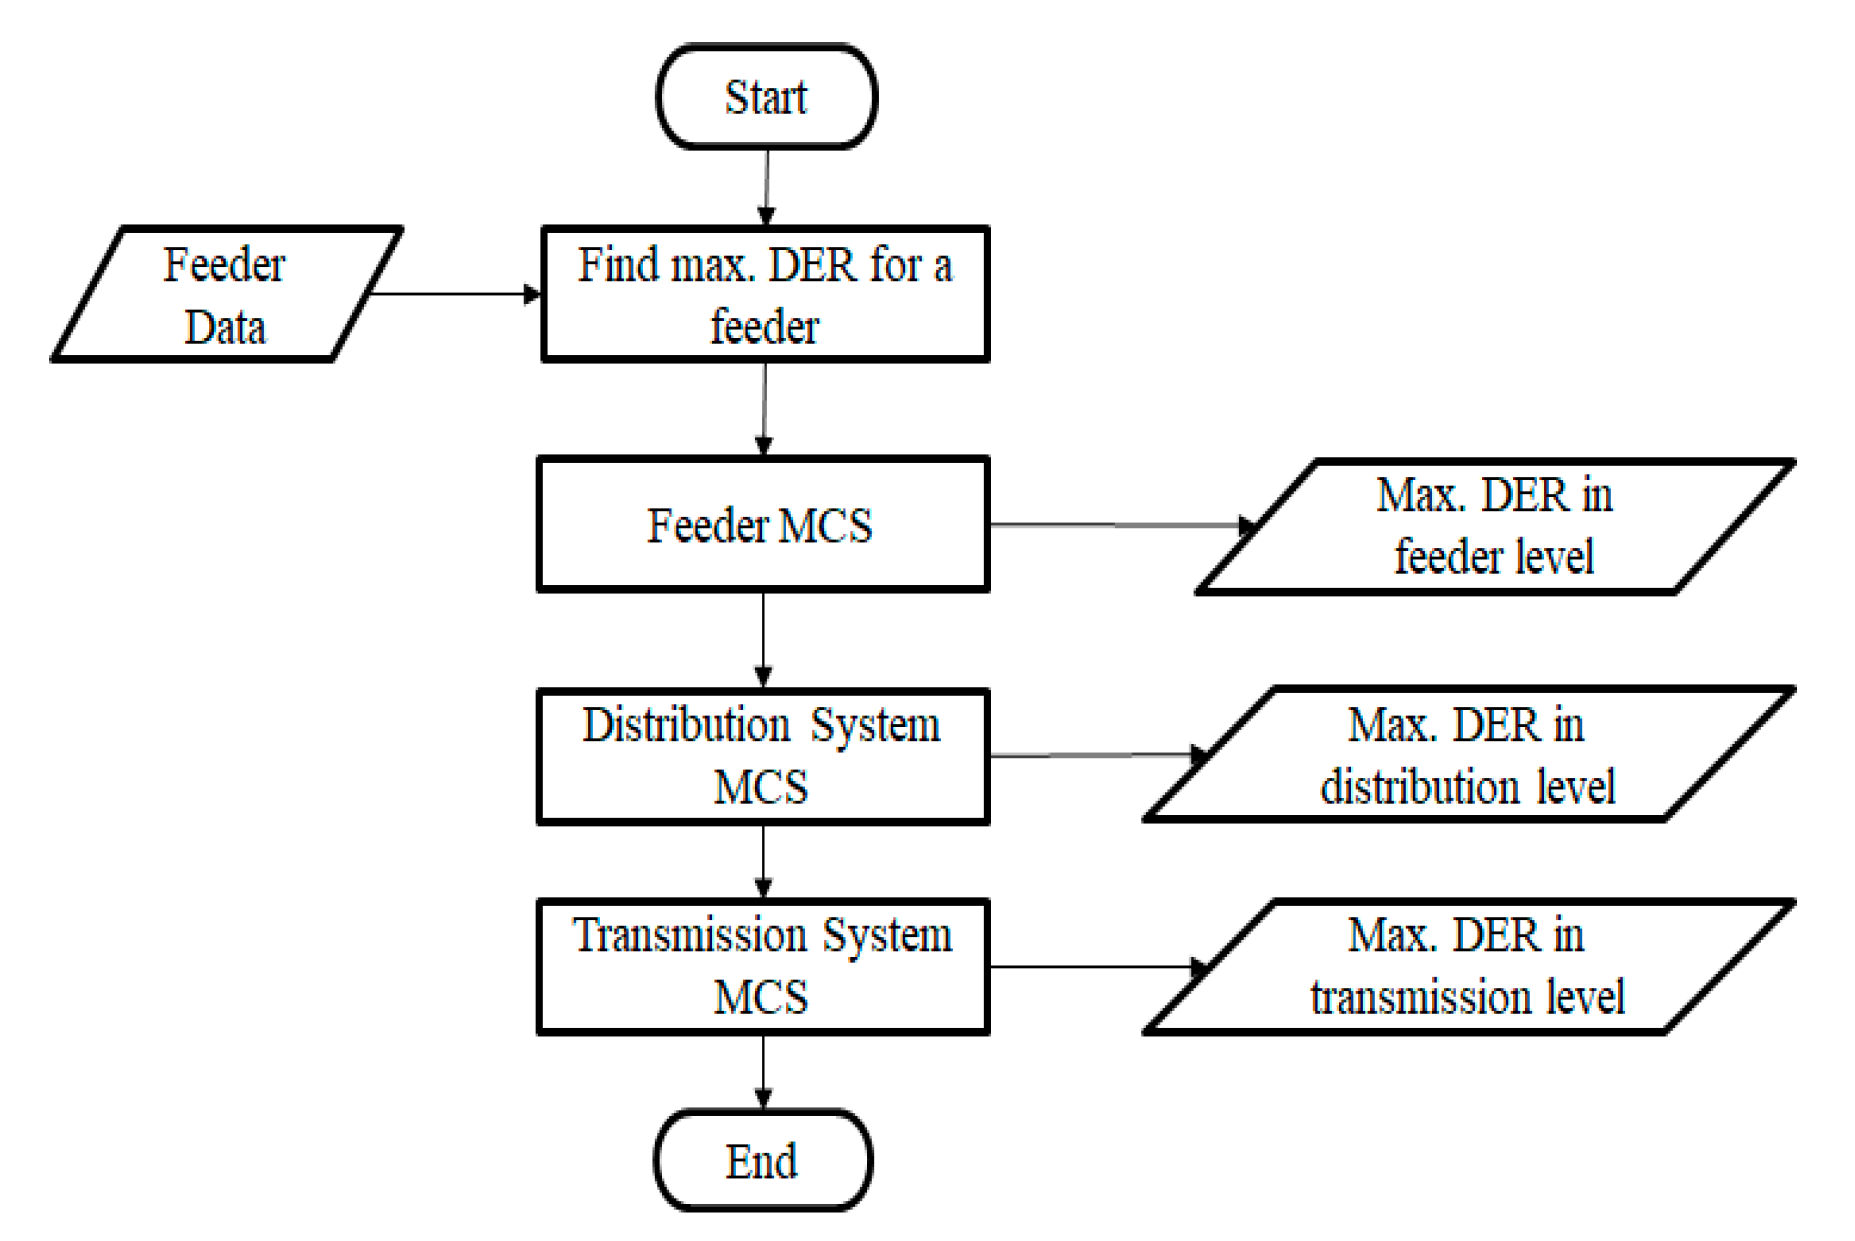
A new algorithm is proposed to find the penetration level of the DER. This algorithm begins by searching for the maximum DER capacity that can be added to a feeder. Using the maximum load in the feeder, the capacity of the DER is increased gradually until either a voltage violation, FVSI violation, or a reverse power flow is detected in the system. Subsequently, a feeder of the distribution system is analyzed using the MCS. The MCS generates the value of the load and the capacity of the DER in the feeder. The inclusion of the DER must comply with the operating constraint of the system and must be able to produce the FVSI with a value less than one at all branches of the feeder. Moreover, any reverse power flow at the start of the feeder is not allowed. Statistical methods are applied to determine the appropriateness of the feeder voltage in the MCS results. The upper values of the IQR and CI from the MCS results are used. Therefore, the objective function of the feeder level simulation can be stated as:
max f = max { S D E R } s . t . V min V I Q R V max V min V I C V max I i j I i j max F V S I < 1 P s l a c k > 0
In the feeder level simulation, the slack bus is the point of common coupling of the feeder with the distribution system. Therefore, P s l a c k represents the power flowing in from the distribution bank to the feeder. Consequently, a negative value indicates that there is a reverse power flow in the feeder. For the transmission system, the assumptions for (6) can be used. However, for the distribution system, the voltage angle differences between the sending and receiving bus may not be small. Therefore, for the feeder and distribution system, the FVSI is calculated by using (5).
First, the maximum capacity of the DER in the feeder level is determined by simulating a feeder with a DER. Then, the capacity of the DER is increased incrementally by 100 kVA until there is a violation of the constraints (9). When the maximum capacity of DER for each feeder has been determined, a distribution system containing several standard test feeders is used to determine the amount of DER that can be included in the system. The DER will be installed in each feeder according to the feeder level simulation. Then, the MCS is used to allocate the load and the DER capacity in the system. However, in the distribution system simulation, a reverse power flow in one of the feeders will be allowed as long as there is no reverse power flow to the substation. Therefore, in the distribution level simulation, P s l a c k denotes the power flowing from the substation of the distribution system. The FVSI value is checked on every branch of the system. In accordance to (5), the FVSI must be kept as low as possible in order to ensure the voltage stability of the system. Therefore, for each simulation, the branch with maximum FVSI will be chosen as the observation point.
When the capacity of the DER in the distribution level has been determined, the same process is repeated for the transmission level. MCS is used to allocate the load in each bus and the DER capacity in the system. To ensure an acceptable operating condition, no reverse power flow is allowed in the slack bus of the transmission system. The algorithm for determining the maximum DER hosting capacity is presented in Figure 3.

5. Case Study

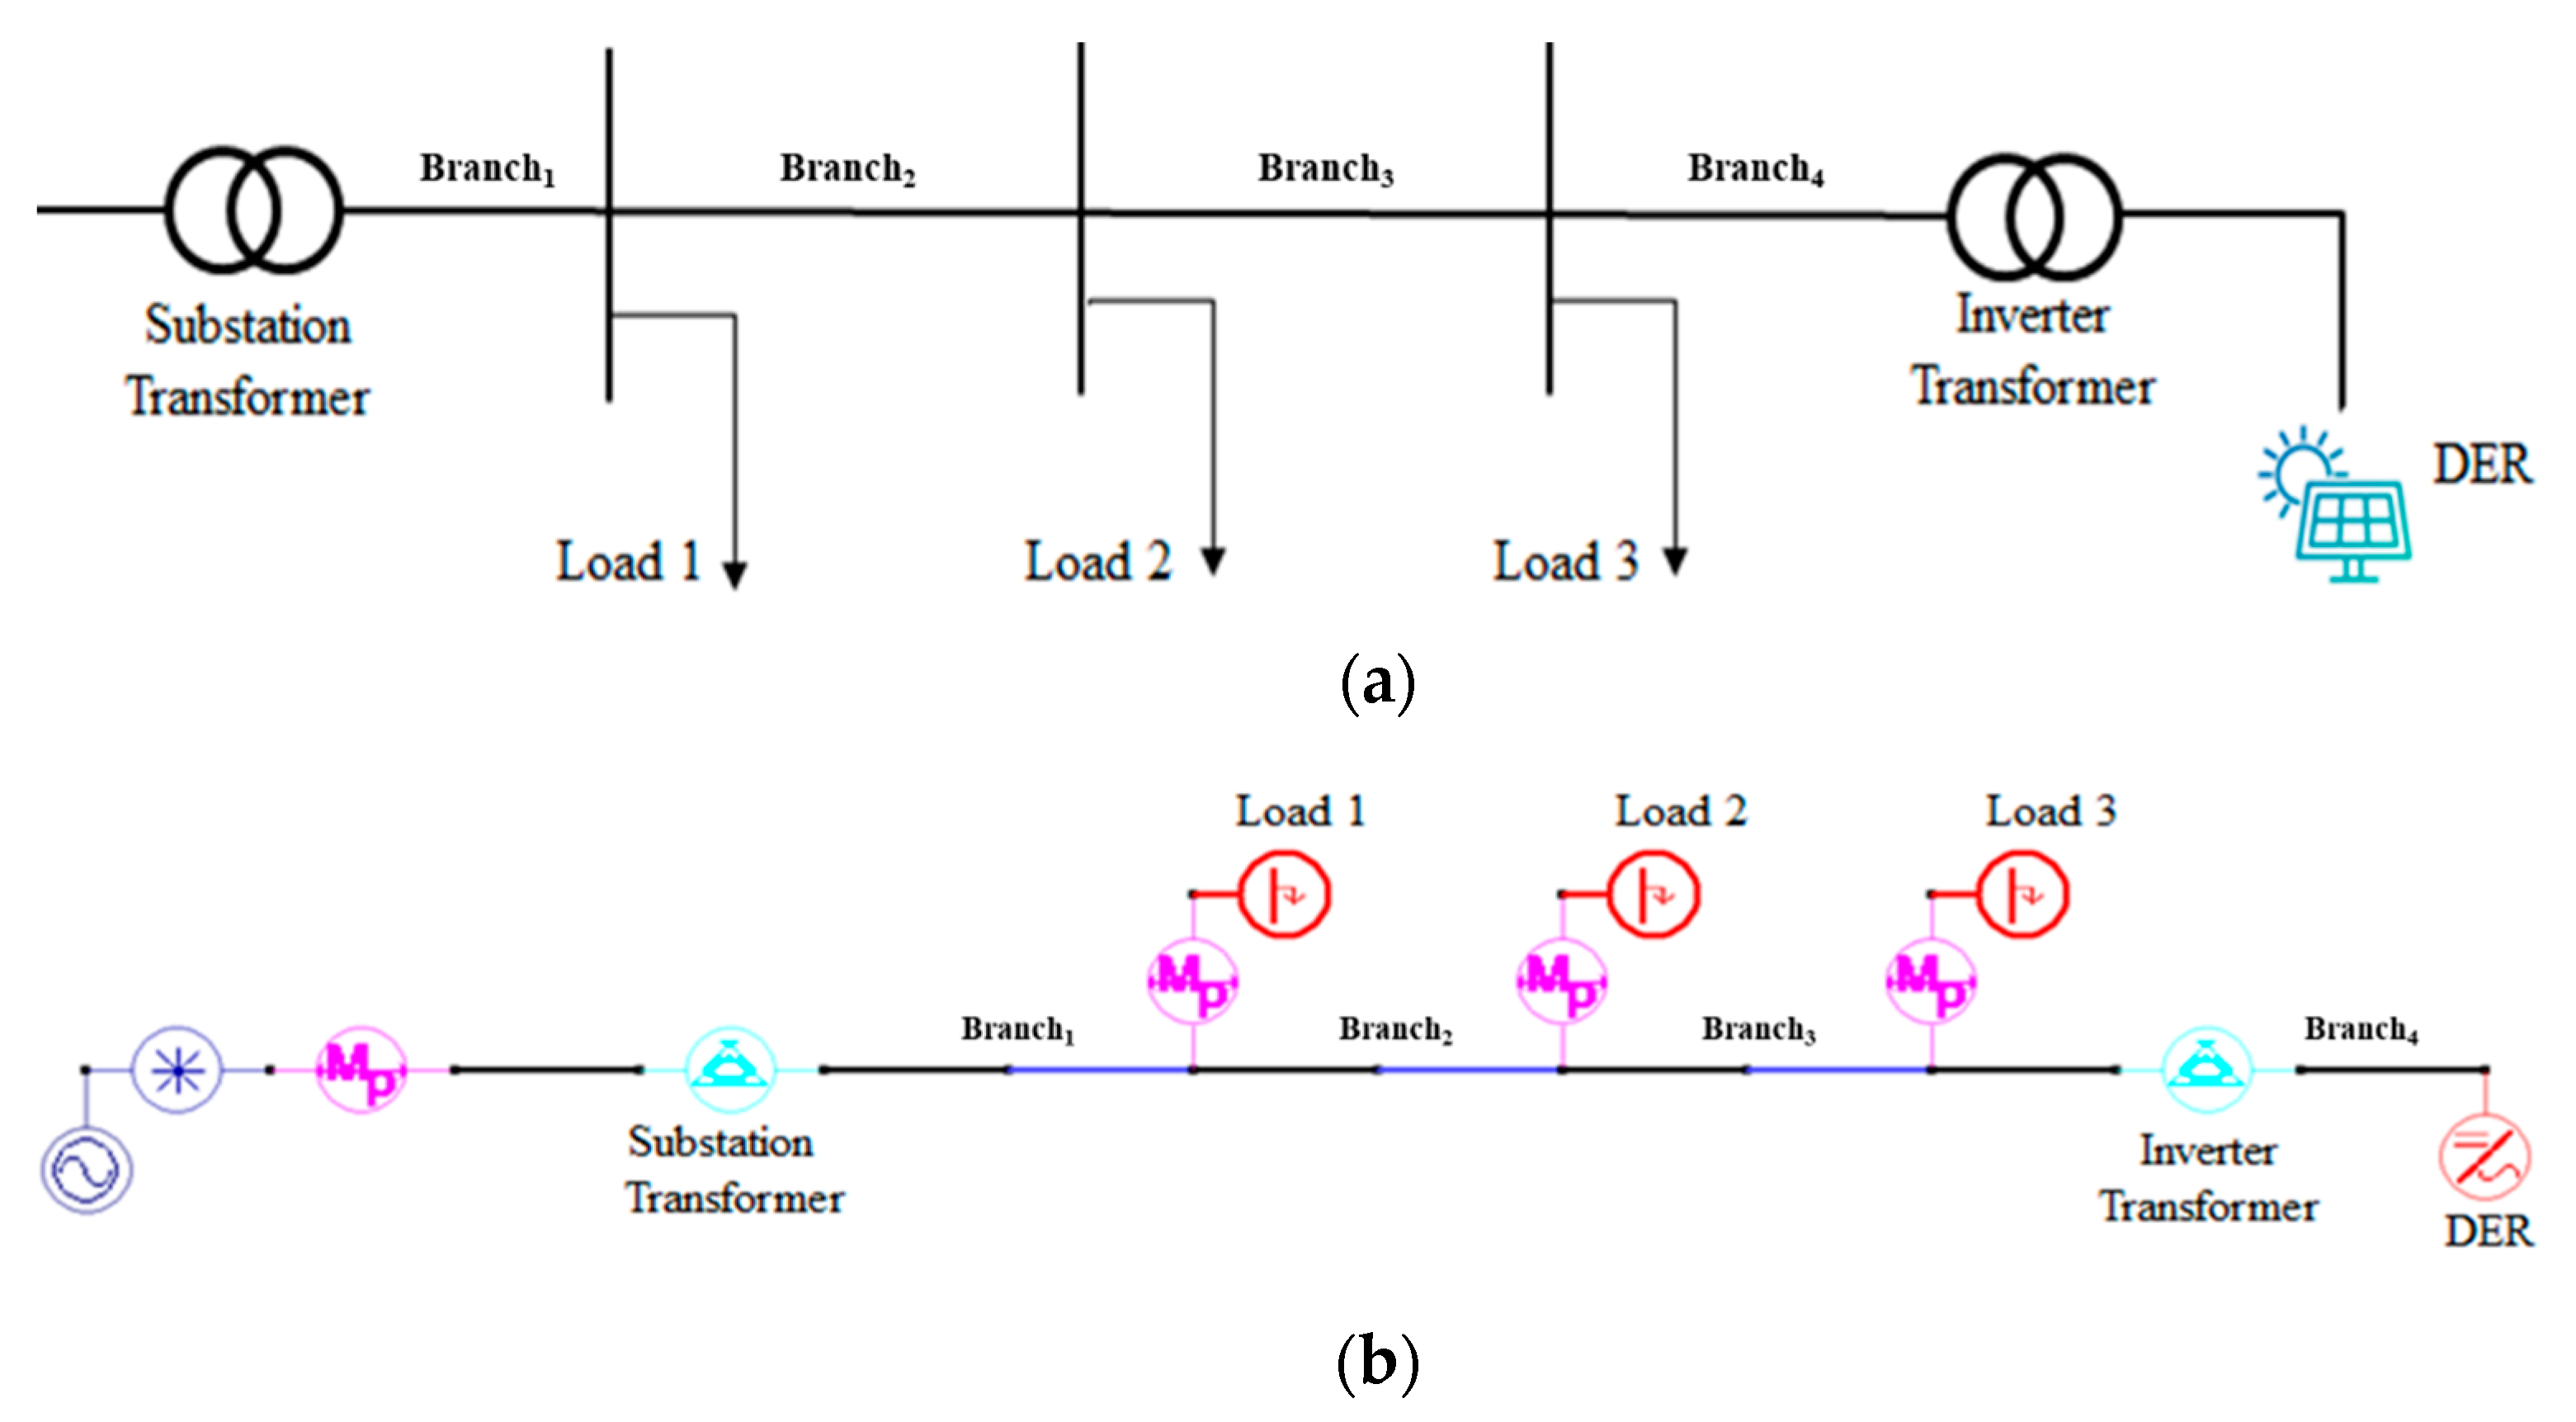
The proposed framework is verified using a standard test system in South Korea. The analysis begins at the feeder of the distribution system. The system is analyzed using the Distributed Engineering Workstation (DEW). Each feeder contains three load buses and a DER bus [17]. Each load or generation bus represents the aggregation of small size DER or load. The structure of each feeder is depicted in Figure 4. Figure 4a illustrates the structure of each feeder. Figure 4b shows the DEW schematic of the feeder. The feeder is supplied by the substation transformer and operates at the voltage level of 22.9 kV. The feeder contains three load buses and a single DER. The DER produces power at a voltage level of 220 V. Therefore, the DER is connected to the feeder by using the inverter transformer.
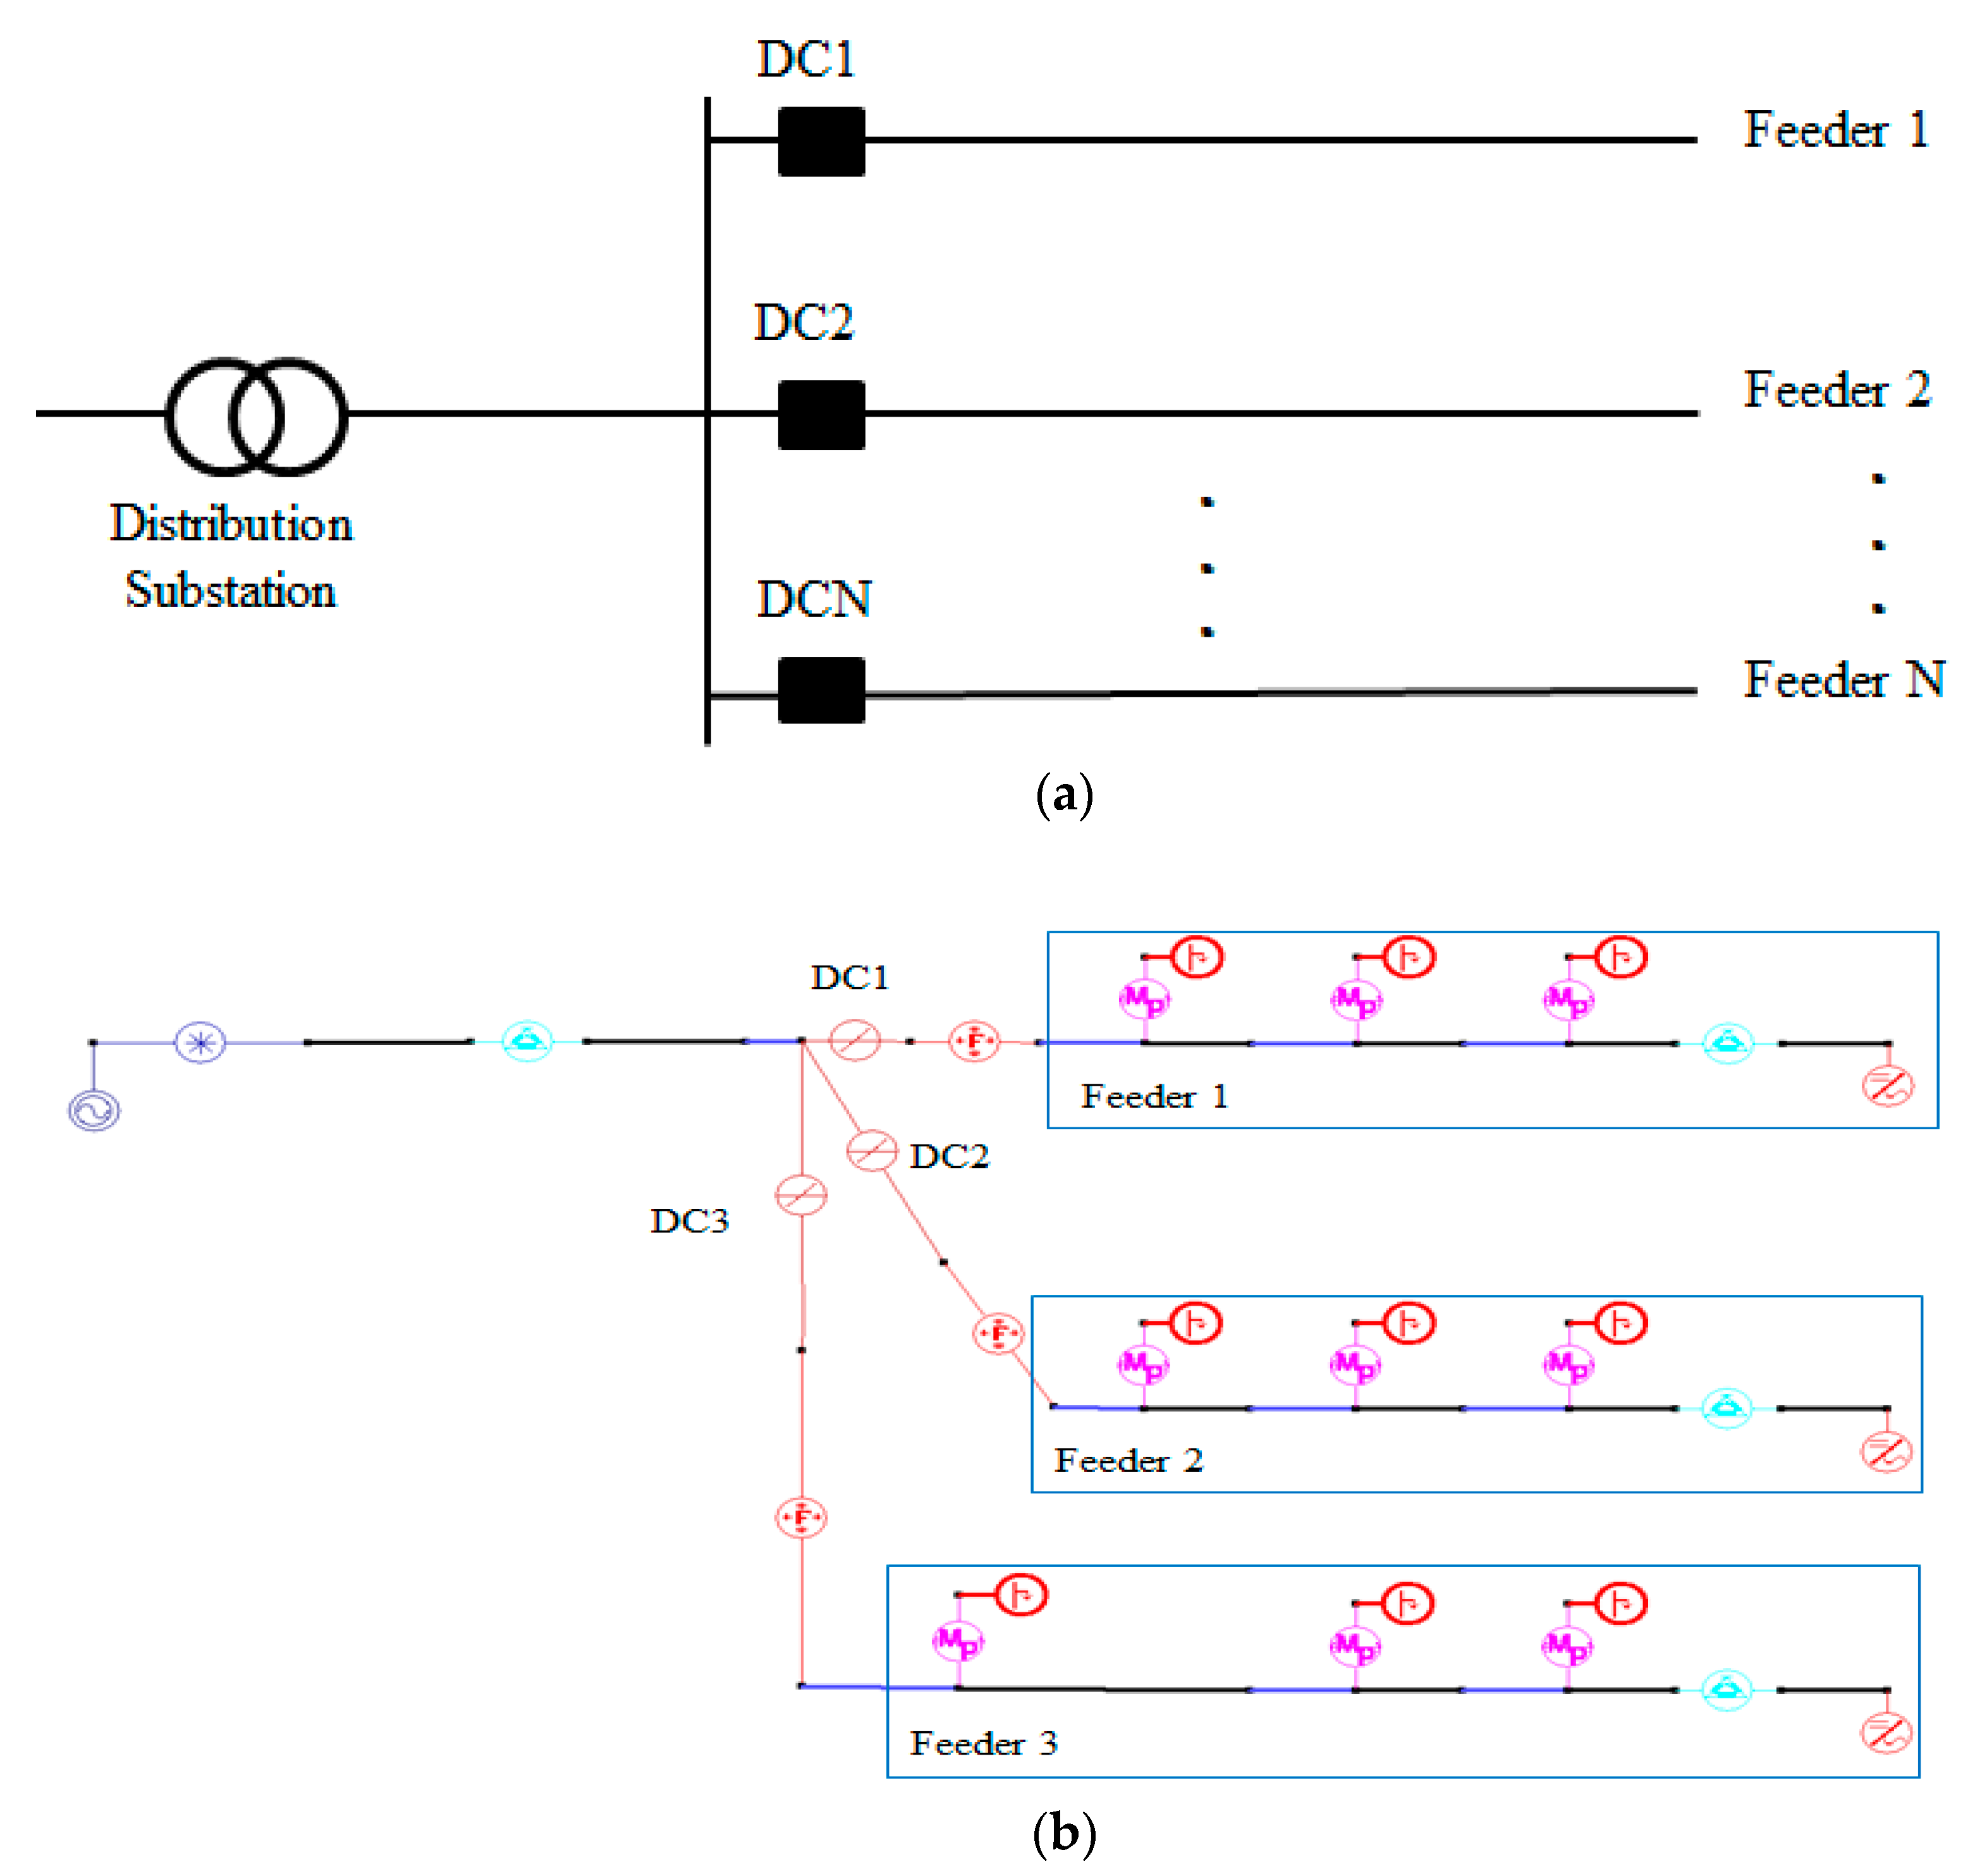
For each distribution system, either three or four feeders can be included. Each feeder is connected to the substation through a disconnecting switch (DC), which is a normally closed switch. The structure of the distribution system is shown in Figure 5a. Moreover, the distribution system with three feeders in the DEW can be seen in Figure 5b. Each feeder in Figure 5 contains the components of the feeder in Figure 4.
The transmission system has 11 substations and 34 feeders. The overall structure of the system is shown in Figure 6a, where SS indicates the substation of the distribution system. Each substation comprises a distribution system, which is composed of a few feeders, as shown in Figure 5. The slack bus is located in SS9. Figure 6b shows the transmission system in the DEW.
ASCR-OC was used as a type of distribution line in the simulation, and its technical characteristics are outlined in Table 4.
For the MCS, the distribution of variables for each feeder is listed in Table 5. The load for each value is between 3000 and 3500 kW. The capacity of DER is between 0 and 14,000 kW.

5.1. Result for Momentary Situation

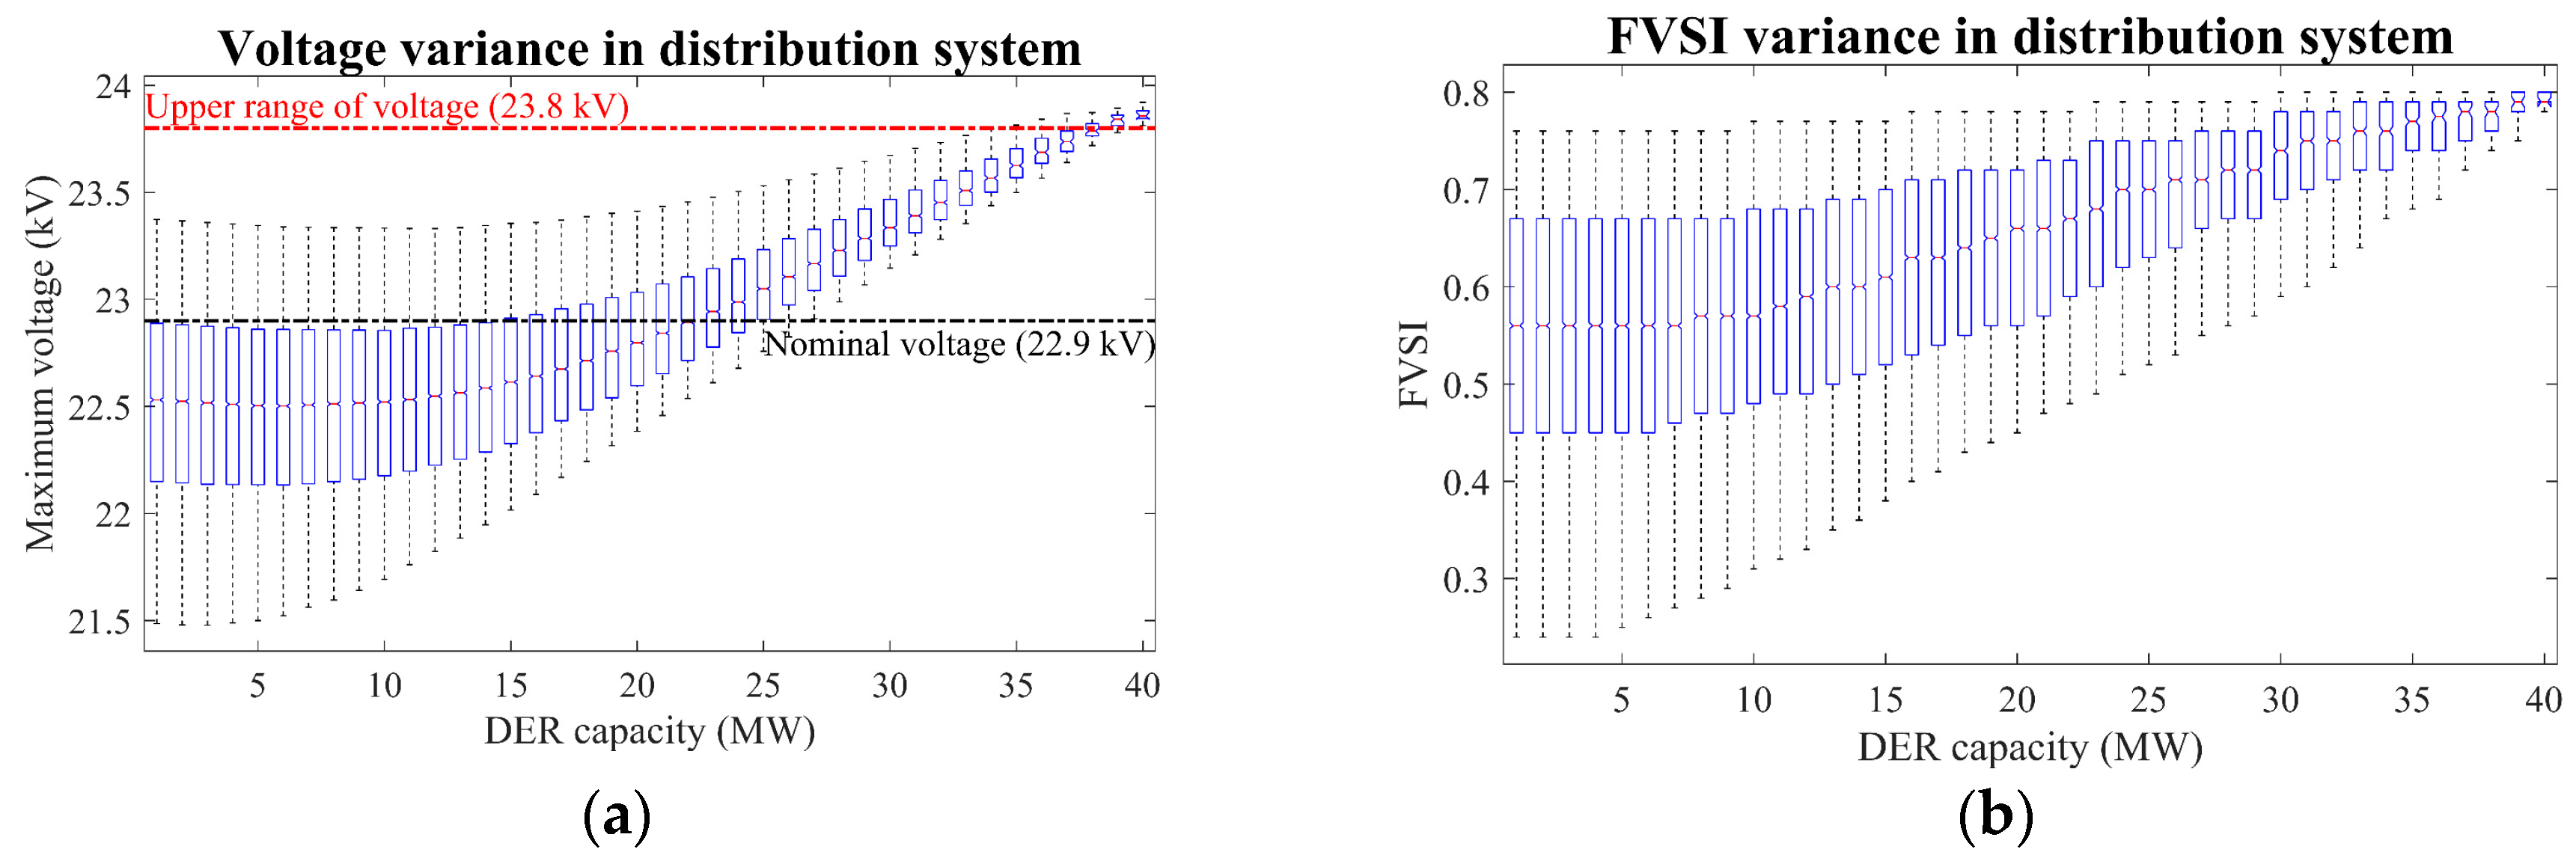
The voltage of the distribution line, in relation to the DER capacity, is shown in Figure 7a. It is measured at the end of the feeder where the DER is integrated. This is done because the voltage that is most likely to violate the operating limit is at the bus closest to the DER. As outlined in Section 2, the maximum and minimum allowable voltages of the distribution line are 23.8 and 20.8 kV, respectively. The total number of simulations considered for the feeder, distribution, and transmission is 6000. This is done to ensure the test case includes a diverse load and generation profile. For each simulation of the momentary situation, the load and generation profile for each feeder are produced by the MCS using the range in Table 5. The red-dashed line represents the upper range of line voltage, while the black-dashed line denotes the nominal voltage of the line. Since all of the results in the figure exhibit higher voltages than the stipulated lower range limit, the lower range limit is neglected. As the DER capacity increases, the voltage variation increases and the position of the notch in the boxplot appears to shift upwards. In addition, the upper part of the interquartile range does not exceed the upper range in these results until the DER capacity is 12.5 MW. Although the maximum value of voltage exceeds the upper voltage range, this result can be considered a proper hosting capacity because an over voltage with 12.5 MW of hosting capacity does not occur frequently in the MCS results. In addition, the maximum voltage level at 12.5 MW is lower than the hosting capacity in the emergency distribution line. Moreover, it is possible that the results shown in this study could be considered in the planned amendment.
For the FVSI, it was observed that in the feeder simulation, the maximum FVSI value is presented at Branch1 which is located between the substation transformer and Load 1 in Figure 4. The result of FVSI variance is shown in Figure 7b. Unlike the results of voltage variation, the FVSI exhibits relatively small dispersion in the MCS results. Moreover, in all cases, the value of FVSI is less than 1.
The simulation result for the distribution system is shown in Figure 8. In Figure 8a, the voltage variance in the distribution system is illustrated. Because the distribution system has three feeders and based on the results of the feeder level study just presented, the allowable capacity of the distribution system can be expected to be 37.5 MW. The simulation results of this study show that the allowable capacity of the distribution system with three banks is 37 MW, which is similar to the expected value. When calculating the allowable capacity in the distribution system, the maximum value was used without using the average voltage for the three feeders. Therefore, it appears to show a different value from the simple observation obtained by using the result from Figure 6.
In the distribution system, it was observed that the maximum FVSI value is observed at the Branch1 in feeder 2, as shown in Figure 5. In Figure 8b, the distribution of the calculated FVSI value for the distribution system is shown according to the capacity of the DER. In addition, similar to the results of feeders, the values of FVSI are less than 1 for all the simulation cases.
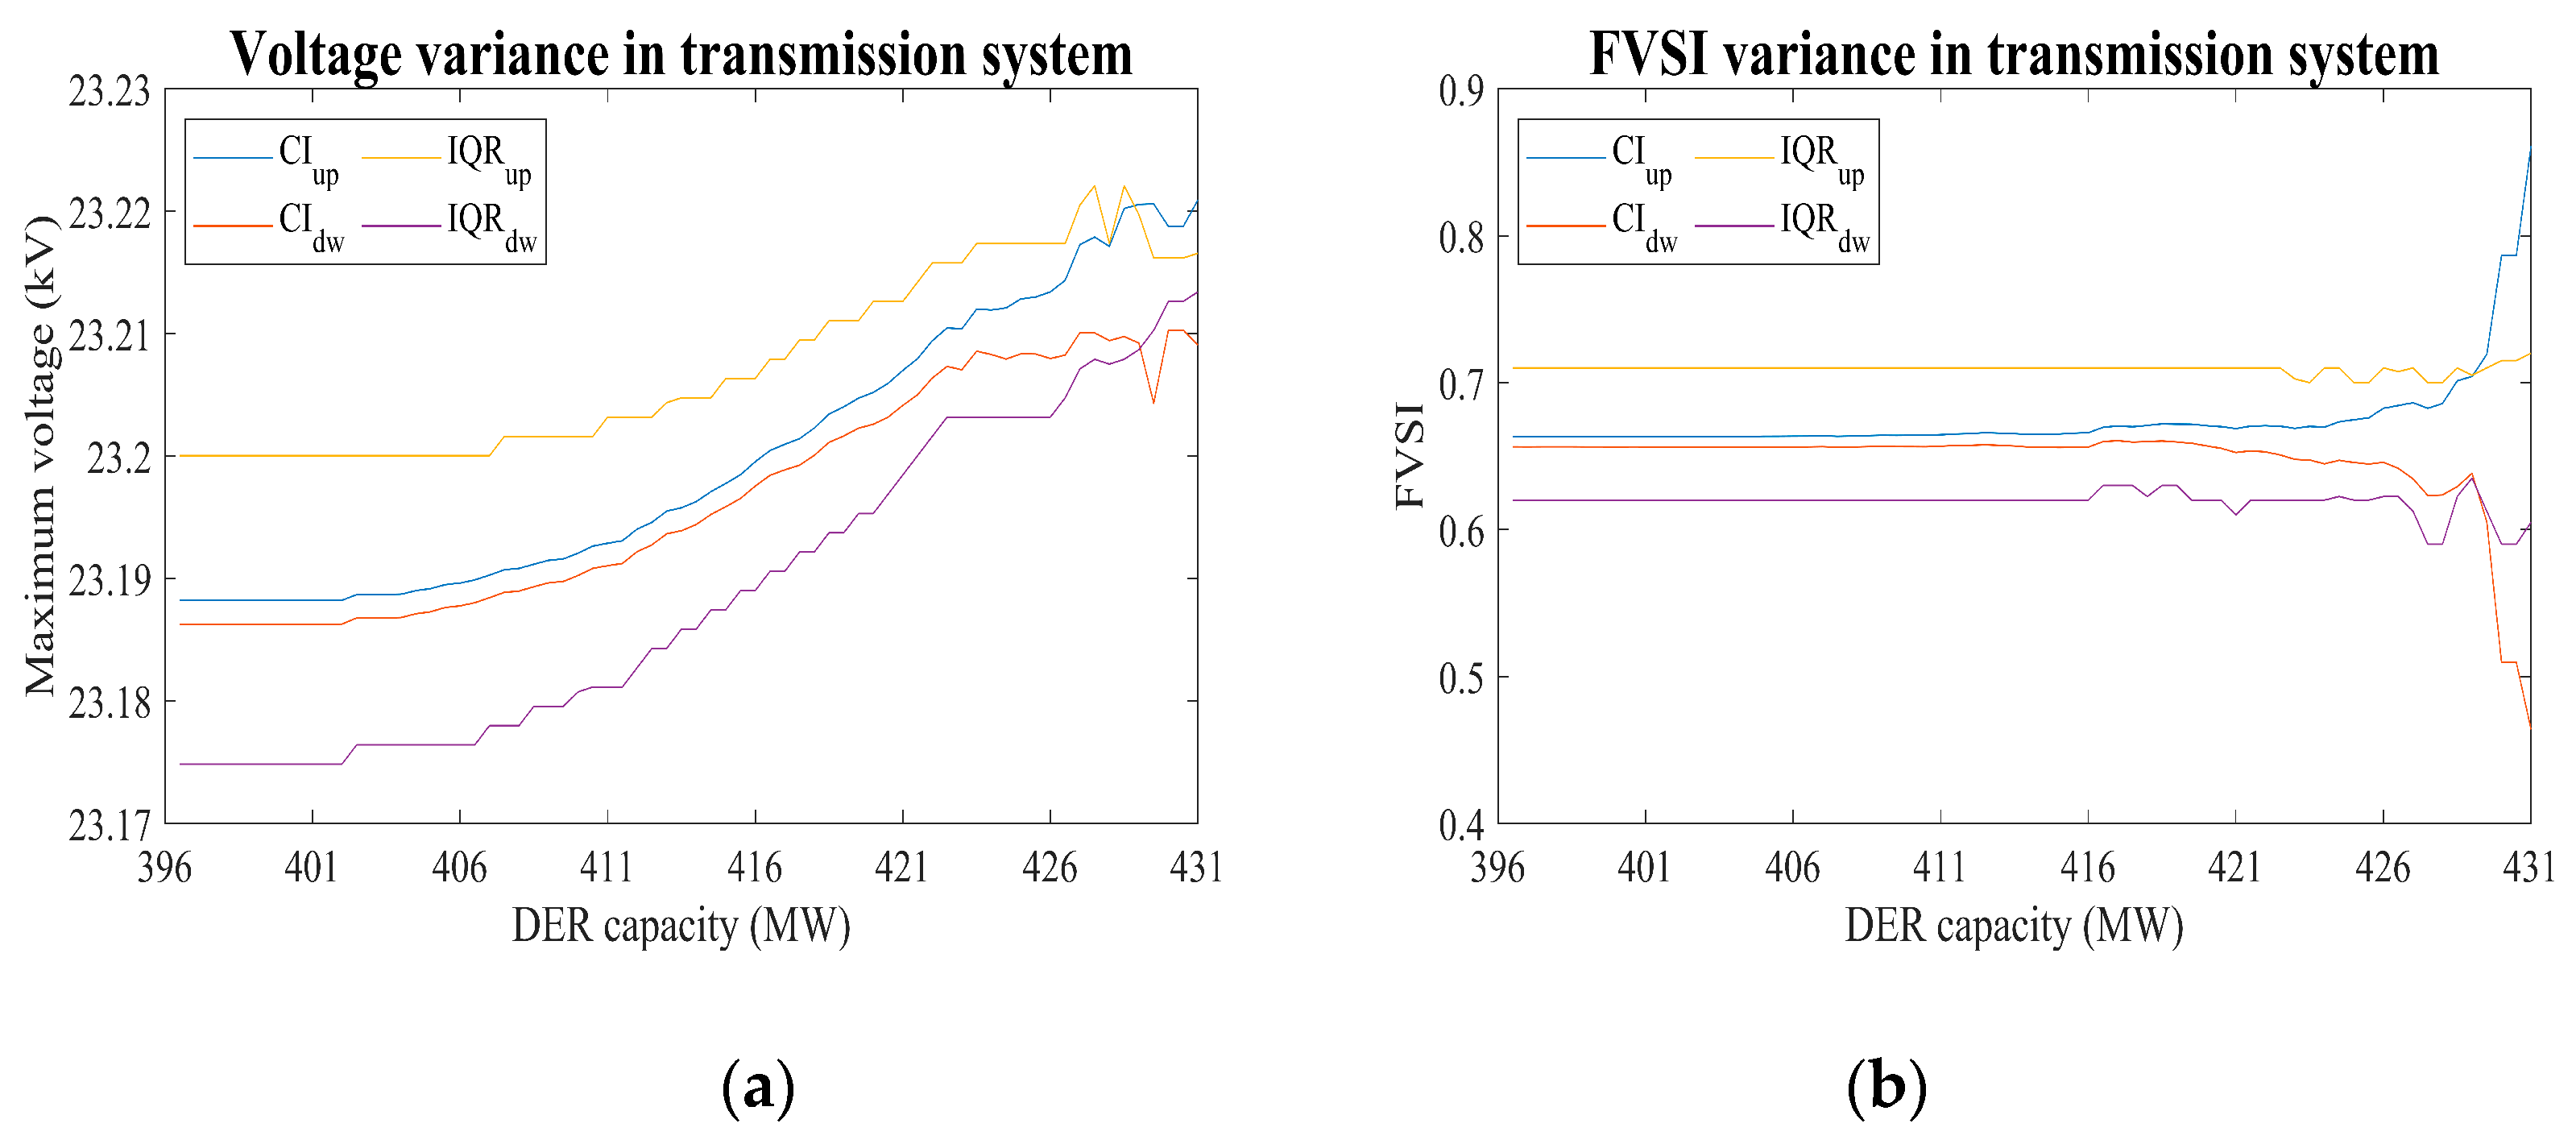
Figure 9a shows the results for the voltage variance in the transmission system. In this simulation, the DERs are evenly distributed in 11 substations (34 feeders). The allowable capacity of the transmission system is estimated as 425 MW (34 × 12.5) based on the analysis results of the hosting capacity of the feeder. The maximum FVSI value was observed at the BranchT,8-9 in Figure 6. Although the CI and IQR range for voltage increase as the integrated DER capacity increases, the level of the upper range of CI and IQR did not exceed the voltage range. This means that all feeders linked to the transmission system did not cause voltage violation problems even if they had approximately 12.5 MW of DER. In addition, the CI and IQR values for FVSI are less than 1 when the DER capacity reaches 425 MW, so there is no problem of voltage collapse. However, after the DER capacity exceeds 425 MW, the CI range of FVSI is emitted. The results show that even if the DER capacity exceeds 425 MW and the value of FVSI is less than 1, the trend of the FVSI value is diverging, indicating that voltage collapse is imminent for DER above 425 MW.
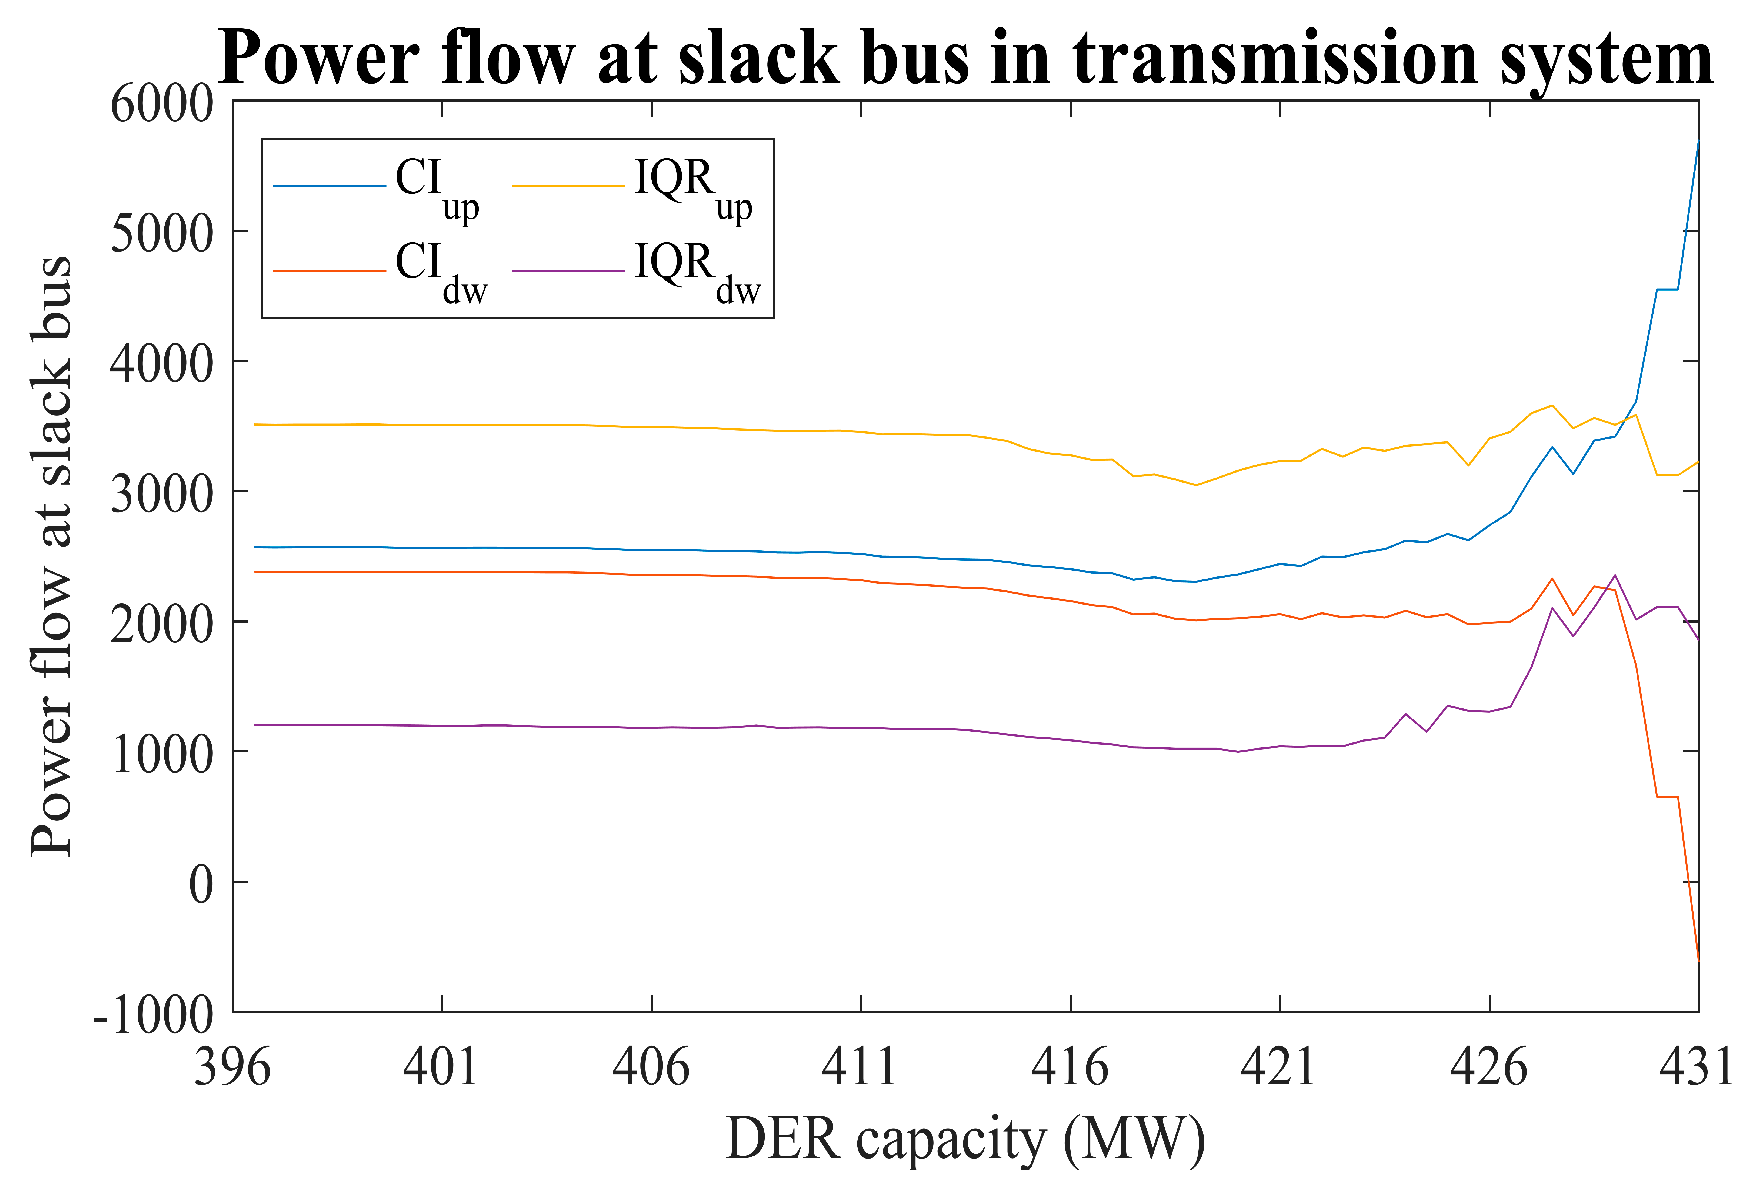
According to Equation (9), the power flow analysis at the slack bus should be shown. To address this, Figure 10 shows the level of power flow at bus 9 (slack bus) for the various levels of DER integration. As the DER capacity increases, there is no significant change in power flow. In addition, the power flow in the slack bus is positive, even when the integrated DER capacity is 425 MW. However, when 430 MW of DER exists, a reverse power flow is observed in the slack bus.
In this simulation system, a transmission system consisting of 11 substations and 34 feeders was handled. According to the existing standard, approximately 340 MW of DER can be integrated into this system. However, from the results of this study, the allowable DER capacity is increased to 425 MW. This is a difference of approximately 85 MW, and in order to narrow this gap, an additional facility investment of about nine additional feeders must be made to this system. In South Korea, the construction cost for a distribution feeder is estimated at US$447,106 [18]. Therefore, considering the test system, the economic benefit to the power utility by avoiding the installation of nine new distribution feeders can be calculated as US$4,023,954.

5.2. Result for Various Power Shares and Power Factors of DER and Estimation Model

The previous simulation results are obtained at a momentary situation using a constant power output from DER. However, the voltage variance is expected to change according to the rate between the level of load and the DER power output. In addition, the power factor of the DER can also impact the level of voltage of the feeder. Therefore, the simulation for voltage variance is performed for various power shares of the DER and power factors, where the power share of DER is calculated below:
P S = P D E R ( k W ) L ( k W )
where the PDER is the total power output of DER, and L is the total load at that time.
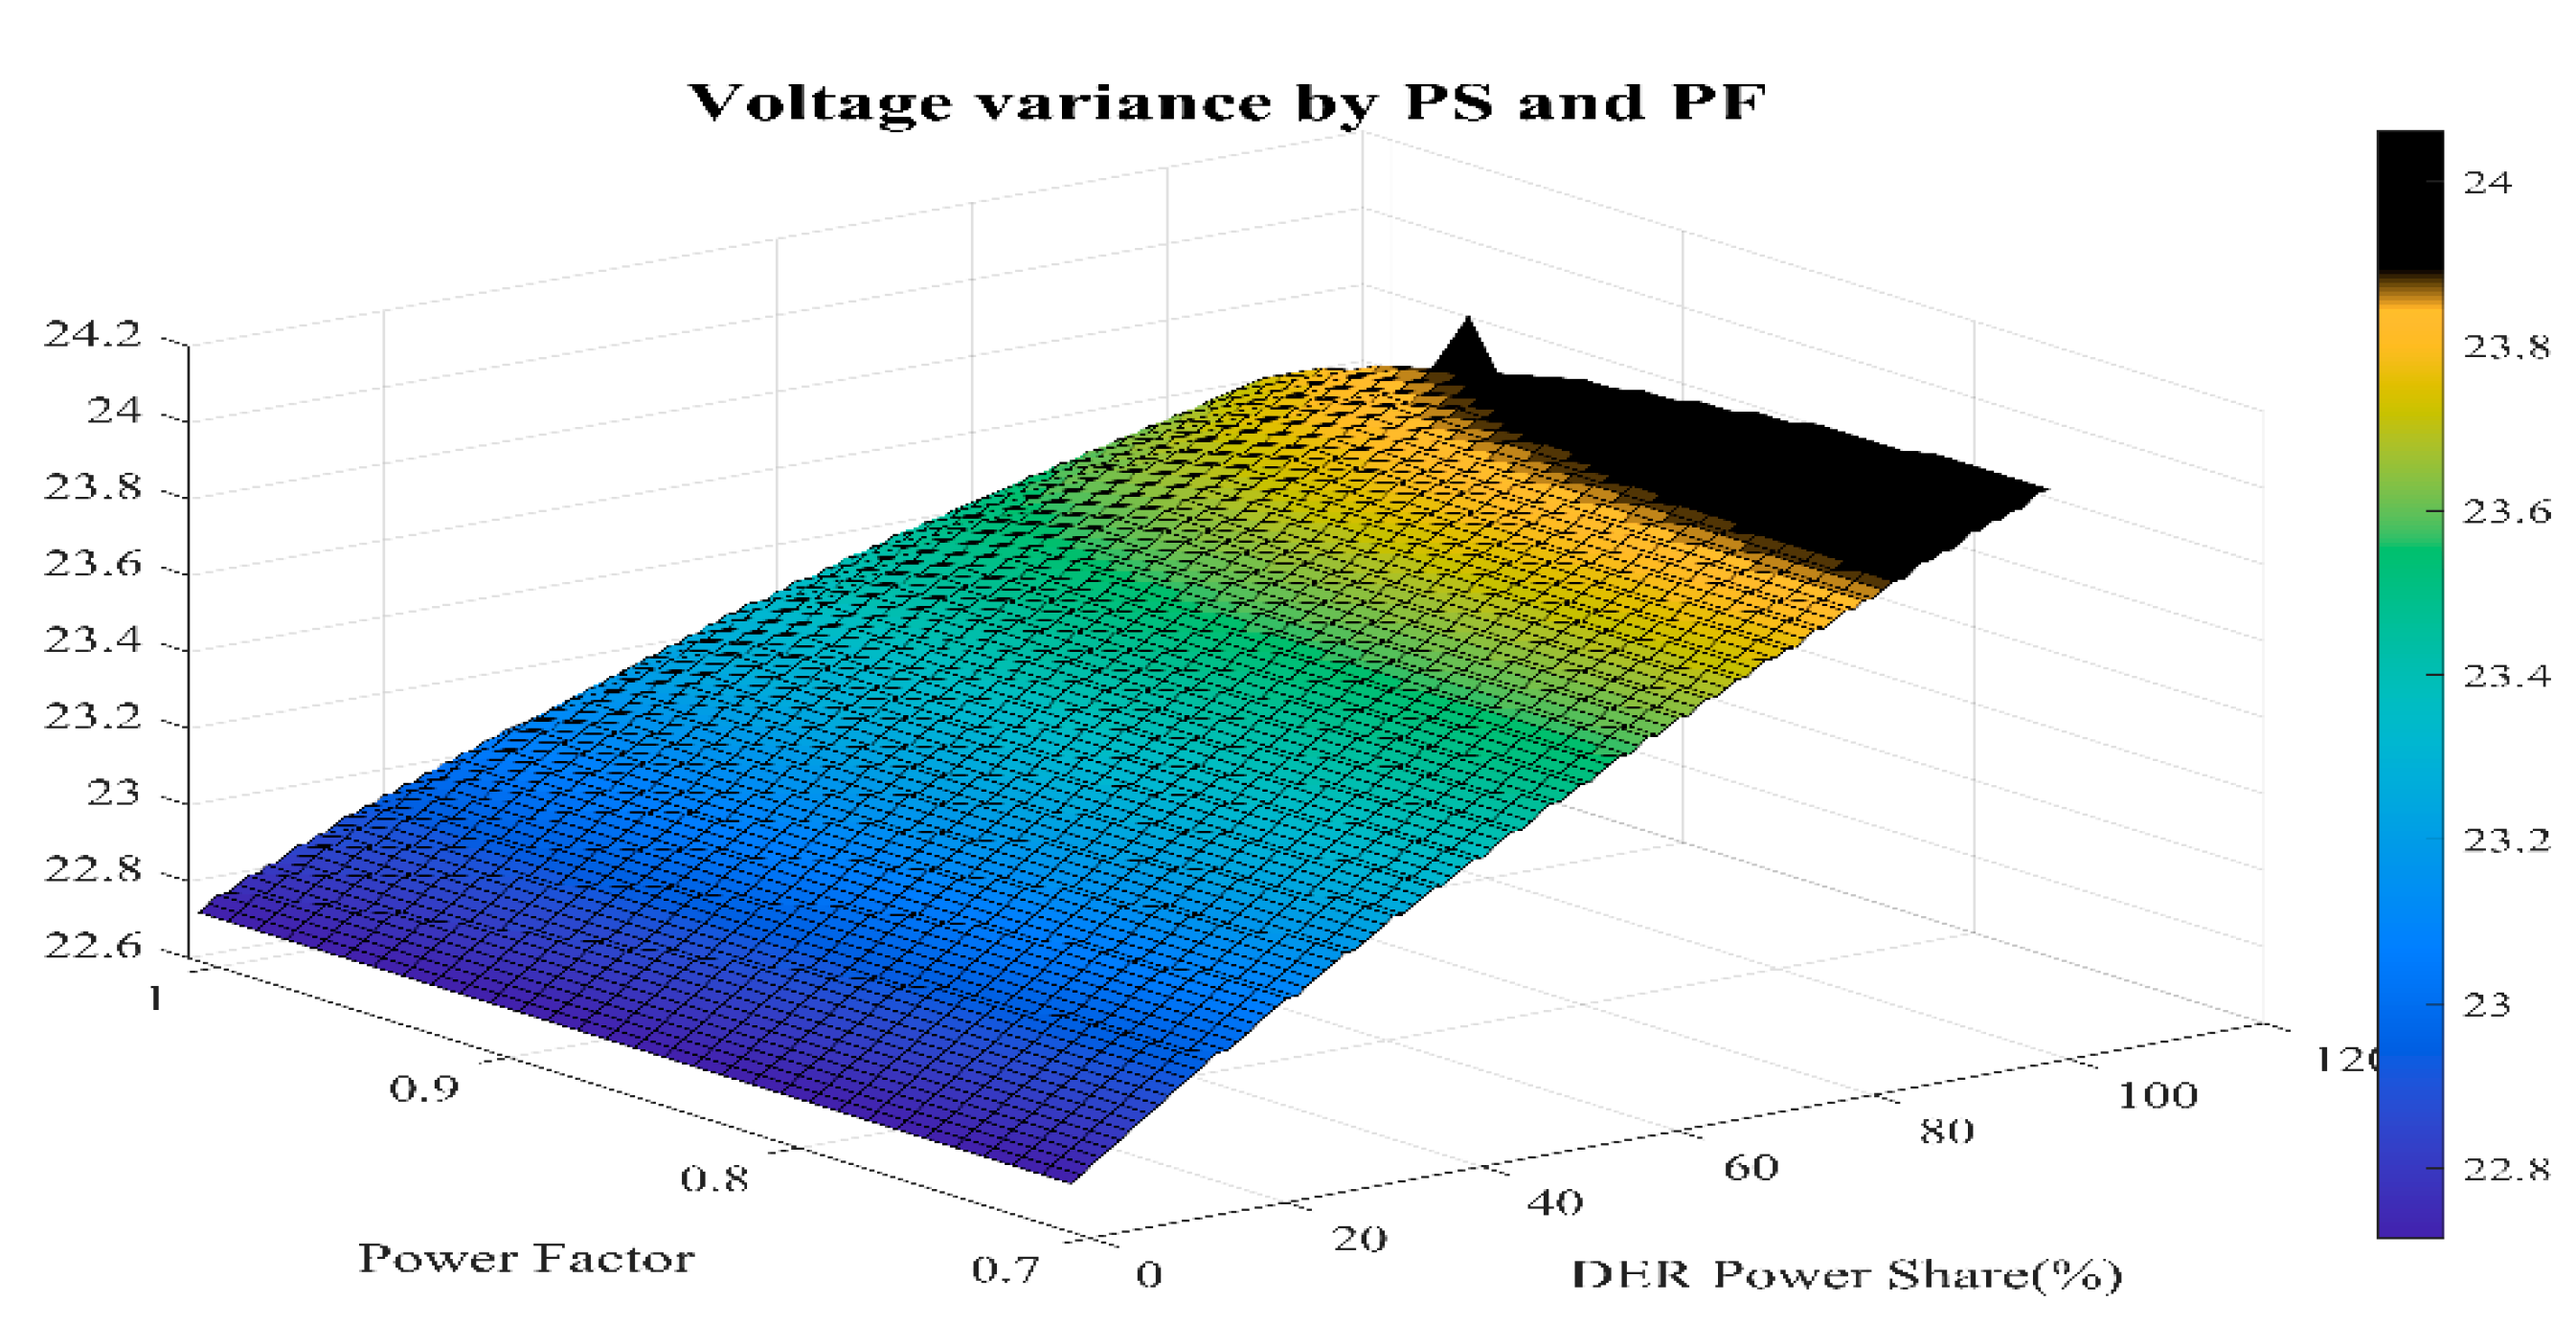
The voltage variance for various power shares and power factors of the DER is shown in Figure 11. As the power share of the DER is increased, the voltage of the distribution feeder also increases. If the voltage level exceeds the upper range of voltage, the color is changed to black to indicate that cases have voltage violation problems. The principle methodology used to calculate voltage variance is the same as in the previous analysis.

6. Monthly Simulation under Various DER Penetration Levels

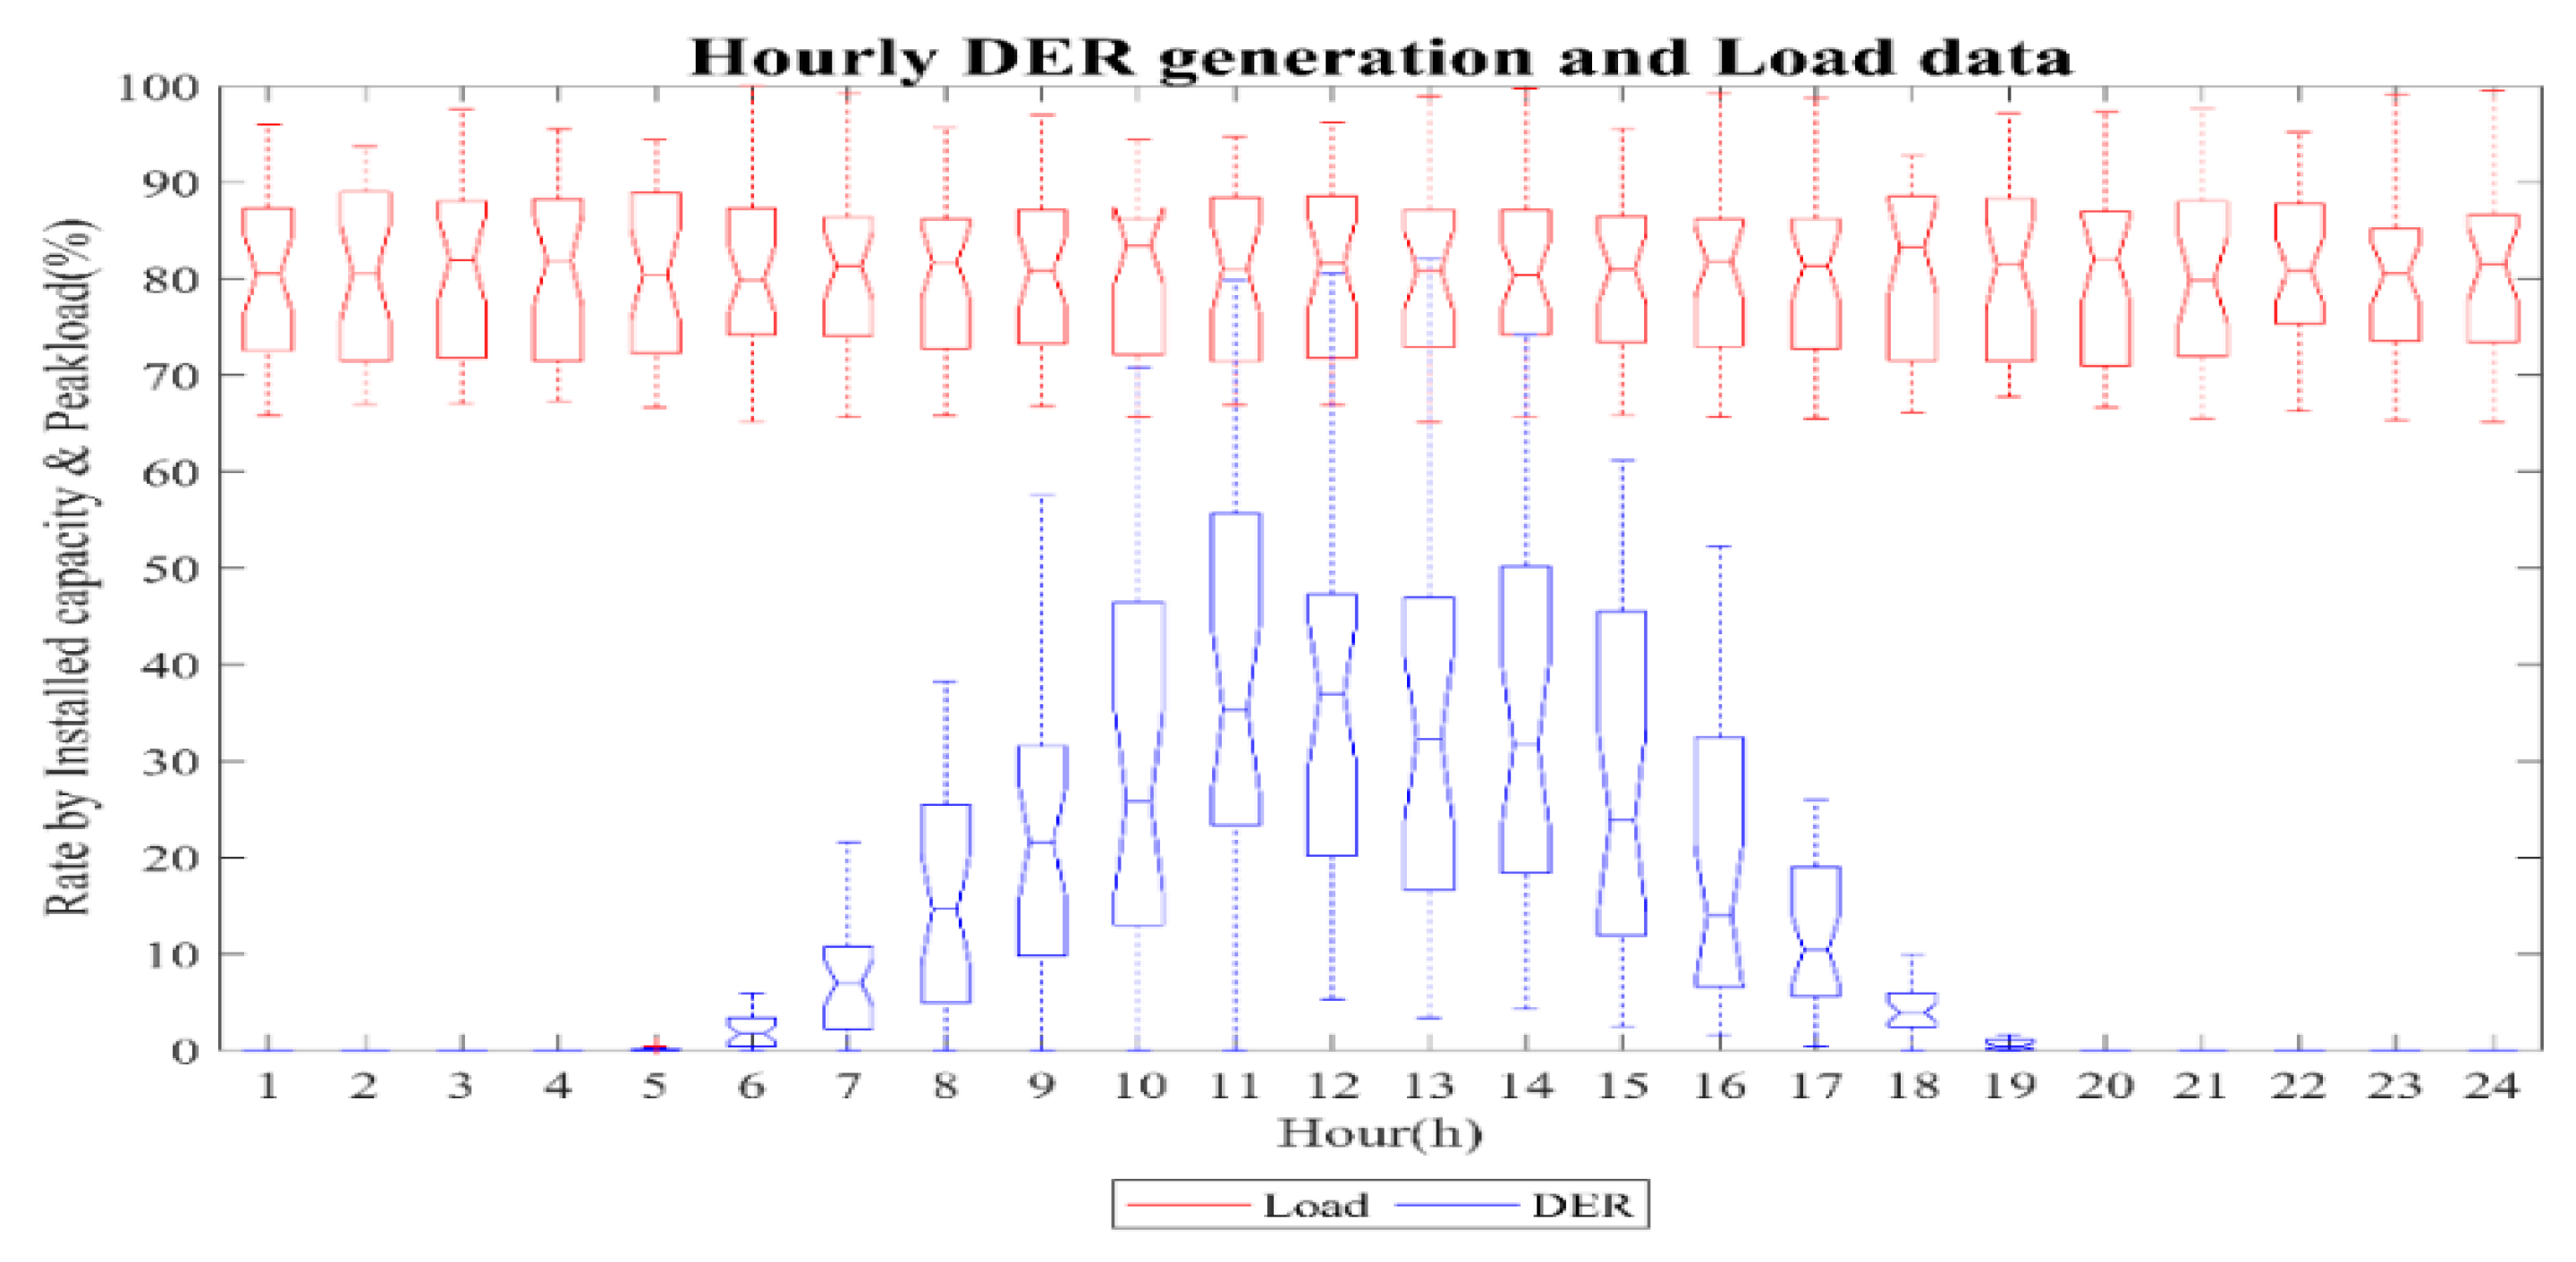
As observed in the previous section, various penetration levels and power factors can affect the system differently. The optimum power factor for the system is observed to be 0.9 for each DER in the system, as shown in Figure 11. To further highlight the effect of this optimum power factor, the simulation is performed for one month. In this simulation, for simplicity, PV generation is only considered because it is the most dominant type of DER in the distribution system. However, the approach presented here may be extended by including other types of DER in the power flow solution. The load in each distribution feeder and generation of each DER follows the load and generation curve for Jeju, South Korea, on July 2017, which is the peak consumption month. Besides, both profiles are from actual measured data. The hourly profiles of load and generation are shown in Figure 12 as a box plot. When looking at the size of the box by time, the load profile shows a smaller variance compared to generation. Using the percentage from the actual data, the power factor and the capacity of the DER are varied to show the effect of various DER parameters on the voltage stability of the system. From the previous simulations, it is determined that the BranchT,8-9 in Figure 6 is the branch with the highest FVSI value in the system, and thus, it is selected as the observation point in this simulation.
The penetration level used in this study is calculated by using the amount of electric use and electric energy generation from DER in the same period as shown below.
P L = E D E R ( kWh ) E L o a d ( kWh ) × 100
where EDER is the amount of electric energy generated in the specific period and ELoad denotes the amount of electric energy consumed in the same period with EDER.
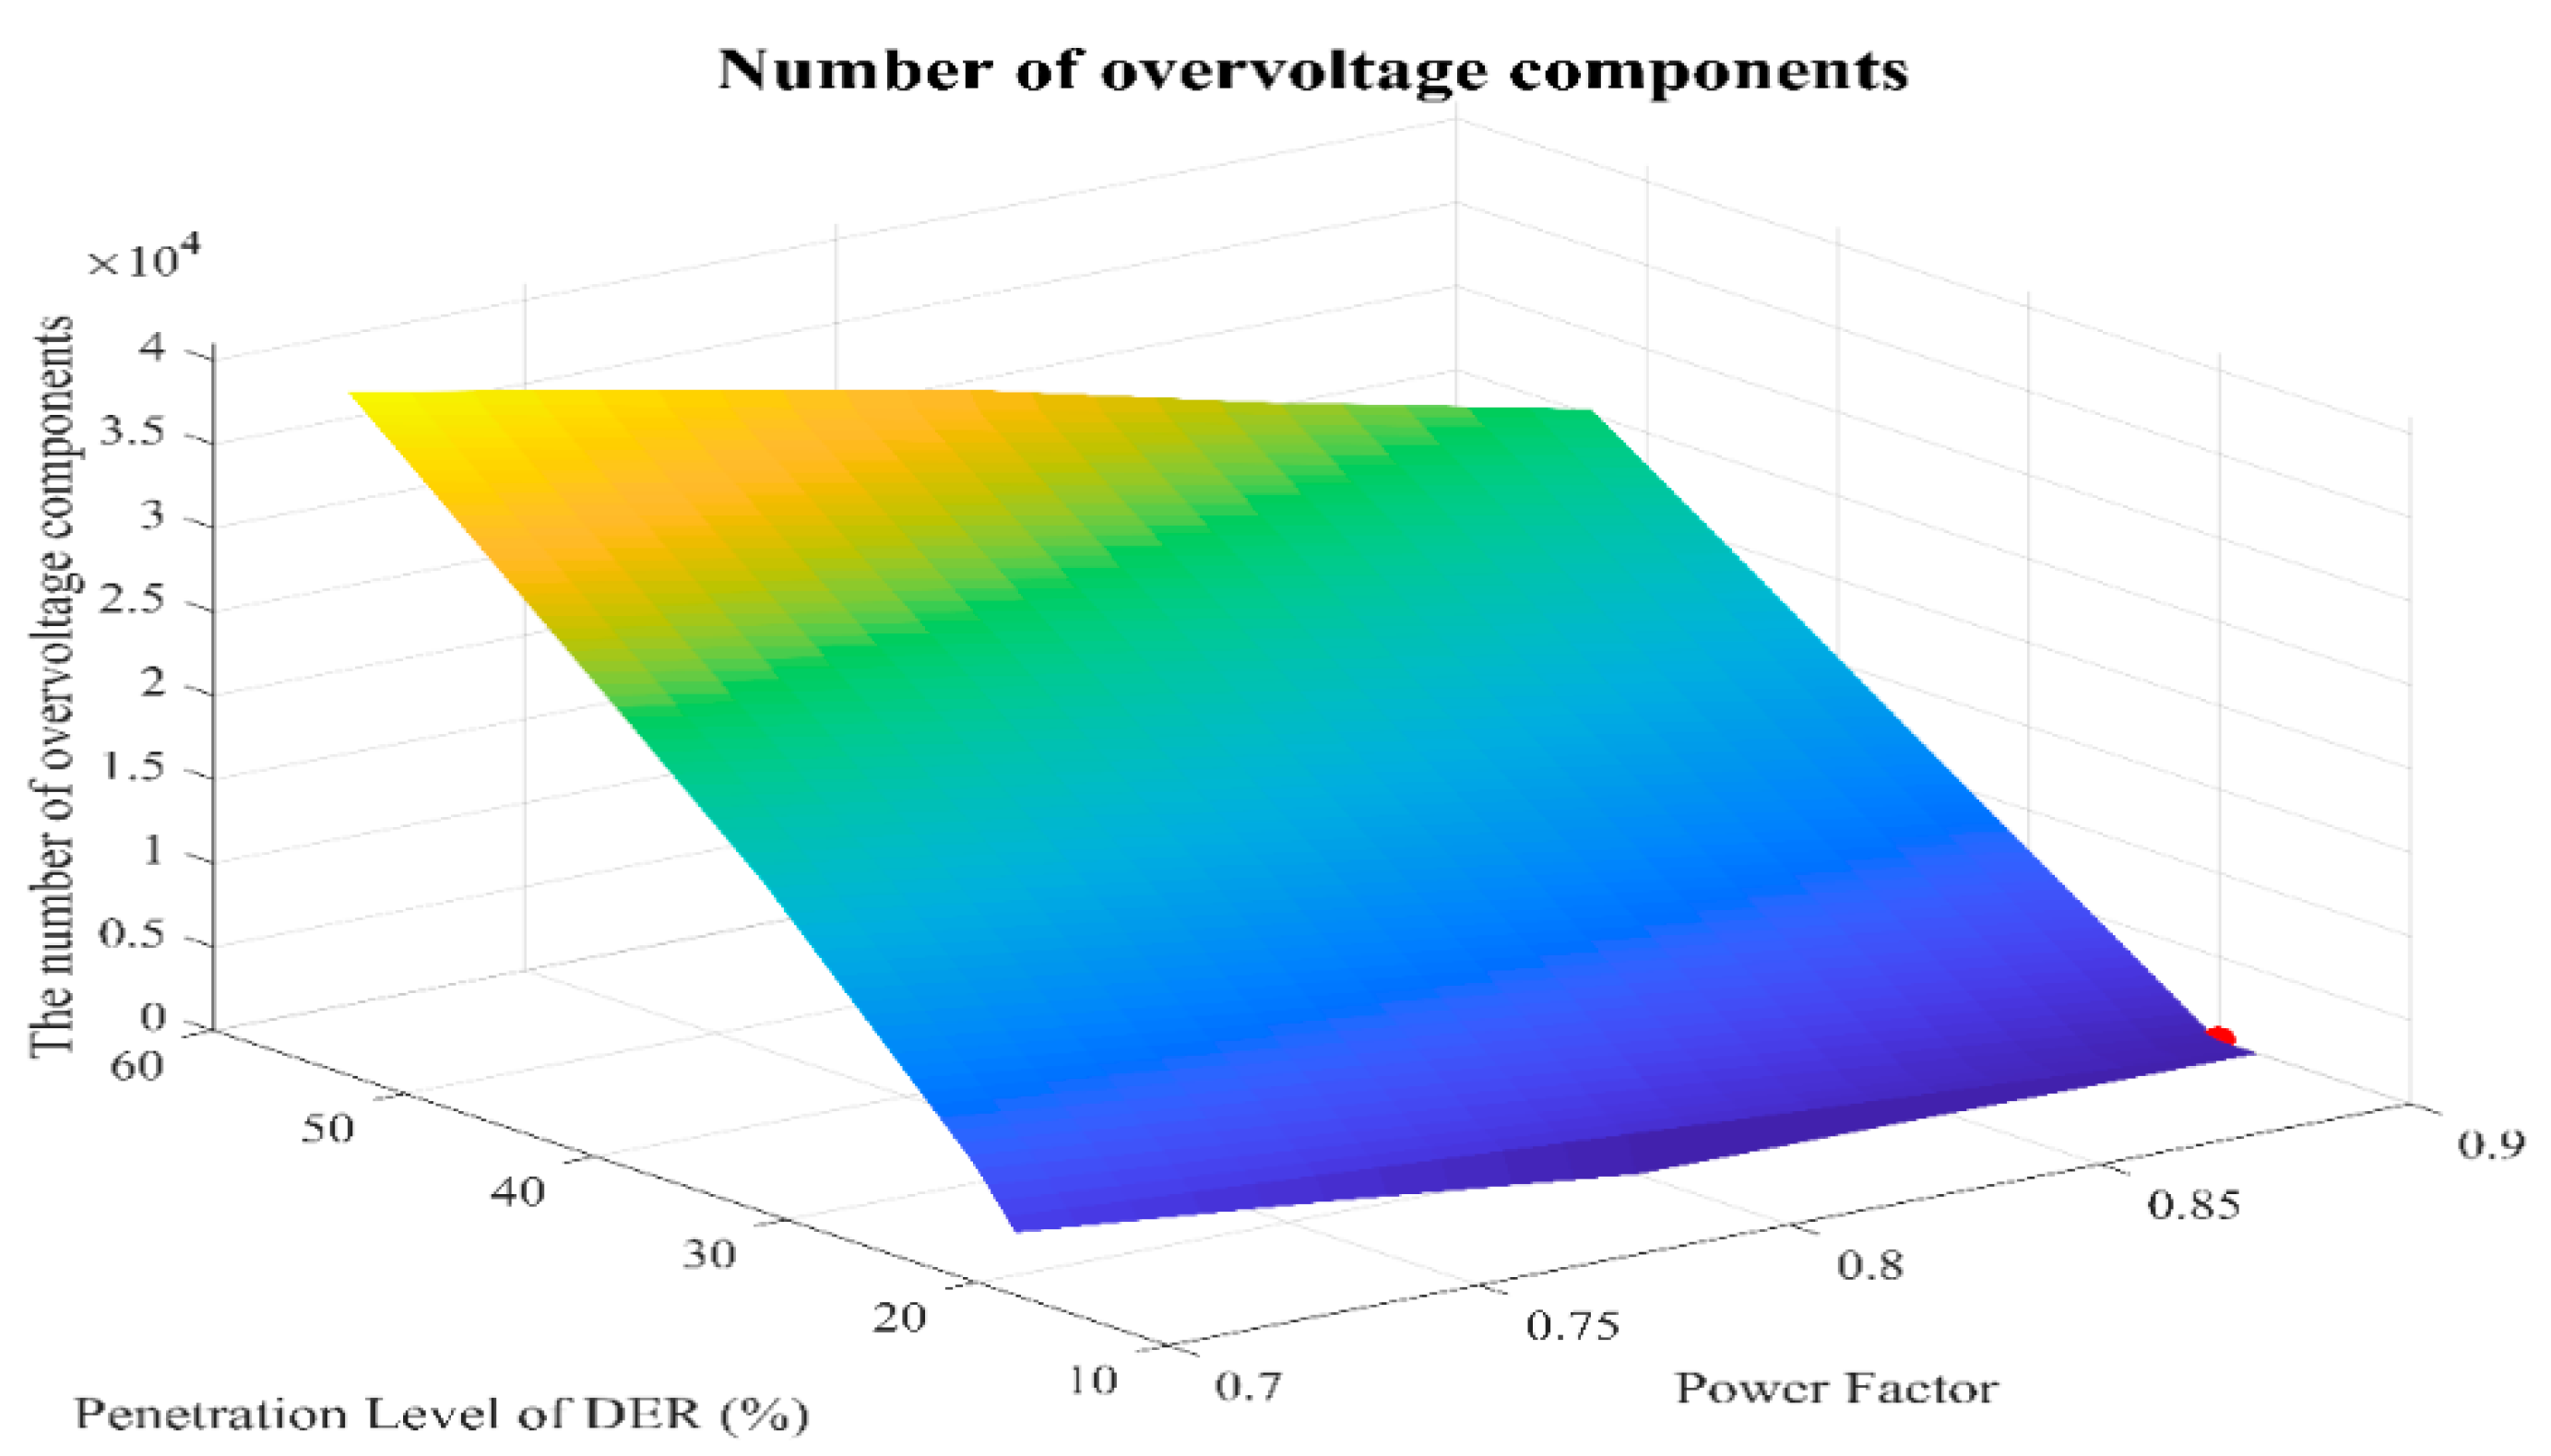
Figure 13 presents the number of overvoltage components in the one month simulation for various penetration levels, ranging from 10% to 60%, and the various power factors, ranging from 0.7 to 0.9. The number of overvoltage components increases when the power factor is decreased, or the penetration level is increased. When the DER is installed at approximately 10 or 12.5 MW, there are no overvoltage components if the power factor of the DER is set to 0.9. On the other hand, this result indicates that a higher power factor can reduce the probability of an overvoltage problem in the distribution feeder. It implies that the increase in the DER hosting capacity from 10 to 12.5 MW will not cause overvoltage problems.
The FVSI result indicates that the voltage stability limit in the system is not violated. The result is presented in Figure 14, wherein no cases produce an FVSI index >1, indicating the lack of a voltage stability problem during the simulation.
The overvoltage cases in the simulation are summarized in Table 6. When the capacity of the DER is increased to 20 MW and then, 37.5 MW for each feeder, multiple over voltages occur. On the contrary, the proposed capacity of 12.5 MW engenders a good voltage profile. In this case, the voltage is maintained between 0.95 and 1.05 p.u., and no overvoltage is found during the simulation. There are no overvoltages observed in similar cases, which can be obtained by using the current standard capacity of 10 MW. However, an undervoltage is observed during peak production hour. From the simulation, it can be concluded that the optimum capacity for each feeder can be increased to 12.5 MW for each feeder, with a power factor of 0.9.
The objective of the proposed methodology is not to determine the exact hosting capacity in Korea, but to provide an evaluation framework. Therefore, the proposed framework can be applied to another system to evaluate the maximum hosting capacity with their interconnection standard. However, it is difficult to directly compare the determined capacity between the systems and countries. Therefore, the proposed framework is verified by employing one of the distribution systems in Korea. The result of the hosting capacity for the selected distribution feeder is 12.5 MW, which is very close to the 12 MW of hosting capacity recently determined by the Korean utility company.

7. Conclusions

The DER standard in South Korea was reviewed. The DER capacity, which is limited to 10 MW on each distribution feeder, was used as the reference. The FVSI was used to indicate the voltage stability of the system under various penetration levels. An MCS was performed to illustrate the possibility of increasing the maximum limit of DER for feeders, distribution systems, and transmission, and an integrated system. When just feeders are considered, the simulation results for various load conditions indicate that it is possible to increase the capacity of the DER to 12.5 MW for each feeder without causing a disturbance in voltage stability. Using the new DER limit, an MCS is performed at both the distribution and transmission system levels, from which there are no voltage or FVSI violations found. Finally, a one month simulation is performed using the actual load and generation profile for various penetration levels. It is concluded that if the DER power factor is maintained at 0.9 lagging, the capacity of the DER can be increased to 12.5 MW in each feeder without causing any voltage instability in the system. In this study, power flow analysis is used to check voltage violations. Therefore, it is expected that the proposed methodology can be adopted for all interpretable system models. The proposed methodology also uses Monte Carlo simulation which takes into account system diversity. Furthermore, it is expected that the proposed framework can help the utility to obtain maximum hosting capacity. For DER owners, they can avoid the event in which the DER cannot be integrated into the distribution line by a lack of hosting capacity.
Moreover, the increase in hosting capacity has economic benefits by reducing the investment costs for new distribution lines. The economic benefits estimated for the study here are estimated to US$4,023,954. Although the economic benefits depend on the extent to which distribution lines need to be expanded by region, as the hosting capacity of distribution lines improves by 25%, the investment cost of distribution lines for linking the DER decrease by 20%.
In this study, the maximum hosting capacity is evaluated based on voltage stability. However, the importance of flexibility evaluation is increasing and also necessary to evaluate system stability when the number of DER is increased.

Author Contributions

Conceptualization, V.W., J.J. and R.B.; methodology, V.W. and J.J.; software, V.W.; validation, J.J.; formal analysis, V.W., J.K., and J.J.; investigation: J.K. and Y.Y.; resources, J.K. and Y.Y.; data curation, J.K. and Y.Y.; writing—original draft preparation, V.W., J.K.; writing—review and editing, J.J., R.B.; visualization, J.K.; supervision, J.J.; funding acquisition, J.J. All authors have read and agreed to the published version of the manuscript.

Funding

This research was supported by Energy AI Convergence Research & Development Program through the National IT Industry Promotion Agency of Korea (NIPA) funded by the Ministry of Science and ICT (No. S1601-20-1005).

Conflicts of Interest

The funders had no role in the design of the study; in the collection, analyses, or interpretation of data; in the writing of the manuscript, or in the decision to publish the results.

References

  1. Kundur, P.; Balu, N.J.; Lauby, M.G. Power System Stability and Control; McGraw-Hill: New York, NY, USA, 1994; ISBN 007035958X. [Google Scholar]
  2. Mortazavi, H.; Mehrjerdi, H.; Saad, M.; Lefebvre, S.; Asber, D.; Lenoir, L. A Monitoring Technique for Reversed Power Flow Detection with High PV Penetration Level. IEEE Trans. Smart Grid 2015, 6, 2221–2232. [Google Scholar] [CrossRef]
  3. Kim, S. Increasing Hosting Capacity of Distribution Feeders by Analysis of Generation and Consumption. KEPCO J. Electr. Power Energy 2019, 5, 295–309. [Google Scholar] [CrossRef]
  4. Cho, S.; Sim, J.; Lim, H.; Kim, H.; Kim, S.; Ju, S.; Song, J. Increasing Hosting Capacity in KEPCO Distribution Feeders. KEPCO J. Electr. Power Energy 2019, 5, 311–321. [Google Scholar]
  5. IEEE Standard Association IEEE Std. 1547-2018. Standard for Interconnection and Interoperability of Distributed Energy Resources with Associated Electric Power Systems Interfaces; IEEE: New York, NY, USA, 2018; ISBN 9781504446396. [Google Scholar]
  6. Kong, J.; Kim, S.T.; Kang, B.O.; Jung, J. Determining the size of energy storage system to maximize the economic profit for photovoltaic and wind turbine generators in South Korea. Renew. Sustain. Energy Rev. 2019, 116, 109467. [Google Scholar] [CrossRef]
  7. Africano, Y.; Celeita, D.; Ramos, G. Co-simulation strategy of PV hosting capacity applying a stochastic analysis. In Proceedings of the 2017 IEEE Workshop on Power Electronics and Power Quality Applications (PEPQA), Bogota, Colombia, 31 May–2 June 2017. [Google Scholar] [CrossRef]
  8. Song, Y.; Hill, D.J.; Liu, T. Static voltage stability analysis of distribution systems based on network-load admittance ratio. IEEE Trans. Power Syst. 2019, 34, 2270–2280. [Google Scholar] [CrossRef]
  9. Matavalam, A.R.R.; Ajjarapu, V. Calculating the long term voltage stability margin using a linear index. In Proceedings of the 2015 IEEE Power & Energy Society General Meeting, Denver, CO, USA, 1–5 September 2015. [Google Scholar] [CrossRef]
  10. ARENA. DEIP Access and Pricing; ARENA: Canberra, Australia, 2020. [Google Scholar]
  11. CEPA. Distributed Energy Resources Integration Program-Access and Pricing Reform Options; CEPA: London, UK, 2020. [Google Scholar]
  12. Elrayyah, A.Y.; Wanik, M.Z.C.; Bouselham, A. Simplified approach to analyze voltage rise in LV systems With PV installations using equivalent power systems diagrams. IEEE Trans. Power Deliv. 2017, 32, 2140–2149. [Google Scholar] [CrossRef]
  13. Jain, H.; Palmintier, B.; Krad, I.; Krishnamurthy, D. Studying the Impact of Distributed Solar PV on Power Systems Using Integrated Transmission and Distribution Models. In Proceedings of the 2018 IEEE/PES Transmission and Distribution Conference and Exposition (T&D), Denver, CO, USA, 1–5 April 2018. [Google Scholar] [CrossRef]
  14. Kim, J.; Baek, S.-M.; Park, J. Allowable Capacity Estimation of DGs for High Renewable Penetration to Distribution System. In Proceedings of the 2018 IEEE Industry Applications Society Annual Meeting (IAS), Portland, OR, USA, 23–27 September 2018; pp. 1–8. [Google Scholar]
  15. Ministry of Trade, Industry and Energy. Available online: http://english.motie.go.kr/ (accessed on 1 May 2020).
  16. Musirin, I.; Abdul Rahman, T.K. Novel fast voltage stability index (FVSI) for voltage stability analysis in power transmission system. In Proceedings of the Student Conference on Research and Development, Shah Alam, Malaysia, 17 July 2002. [Google Scholar] [CrossRef]
  17. Kim, J.C.; Cho, S.M.; Shin, H.S. Advanced power distribution system configuration for smart grid. IEEE Trans. Smart Grid 2013, 4, 353–358. [Google Scholar] [CrossRef]
  18. Afamefuna, D.; Chung, I.Y.; Hur, D.; Kim, J.Y.; Cho, J. A techno-economic feasibility analysis on LVDC distribution system for rural electrification in South Korea. J. Electr. Eng. Technol. 2014, 9, 1501–1510. [Google Scholar] [CrossRef] [Green Version]
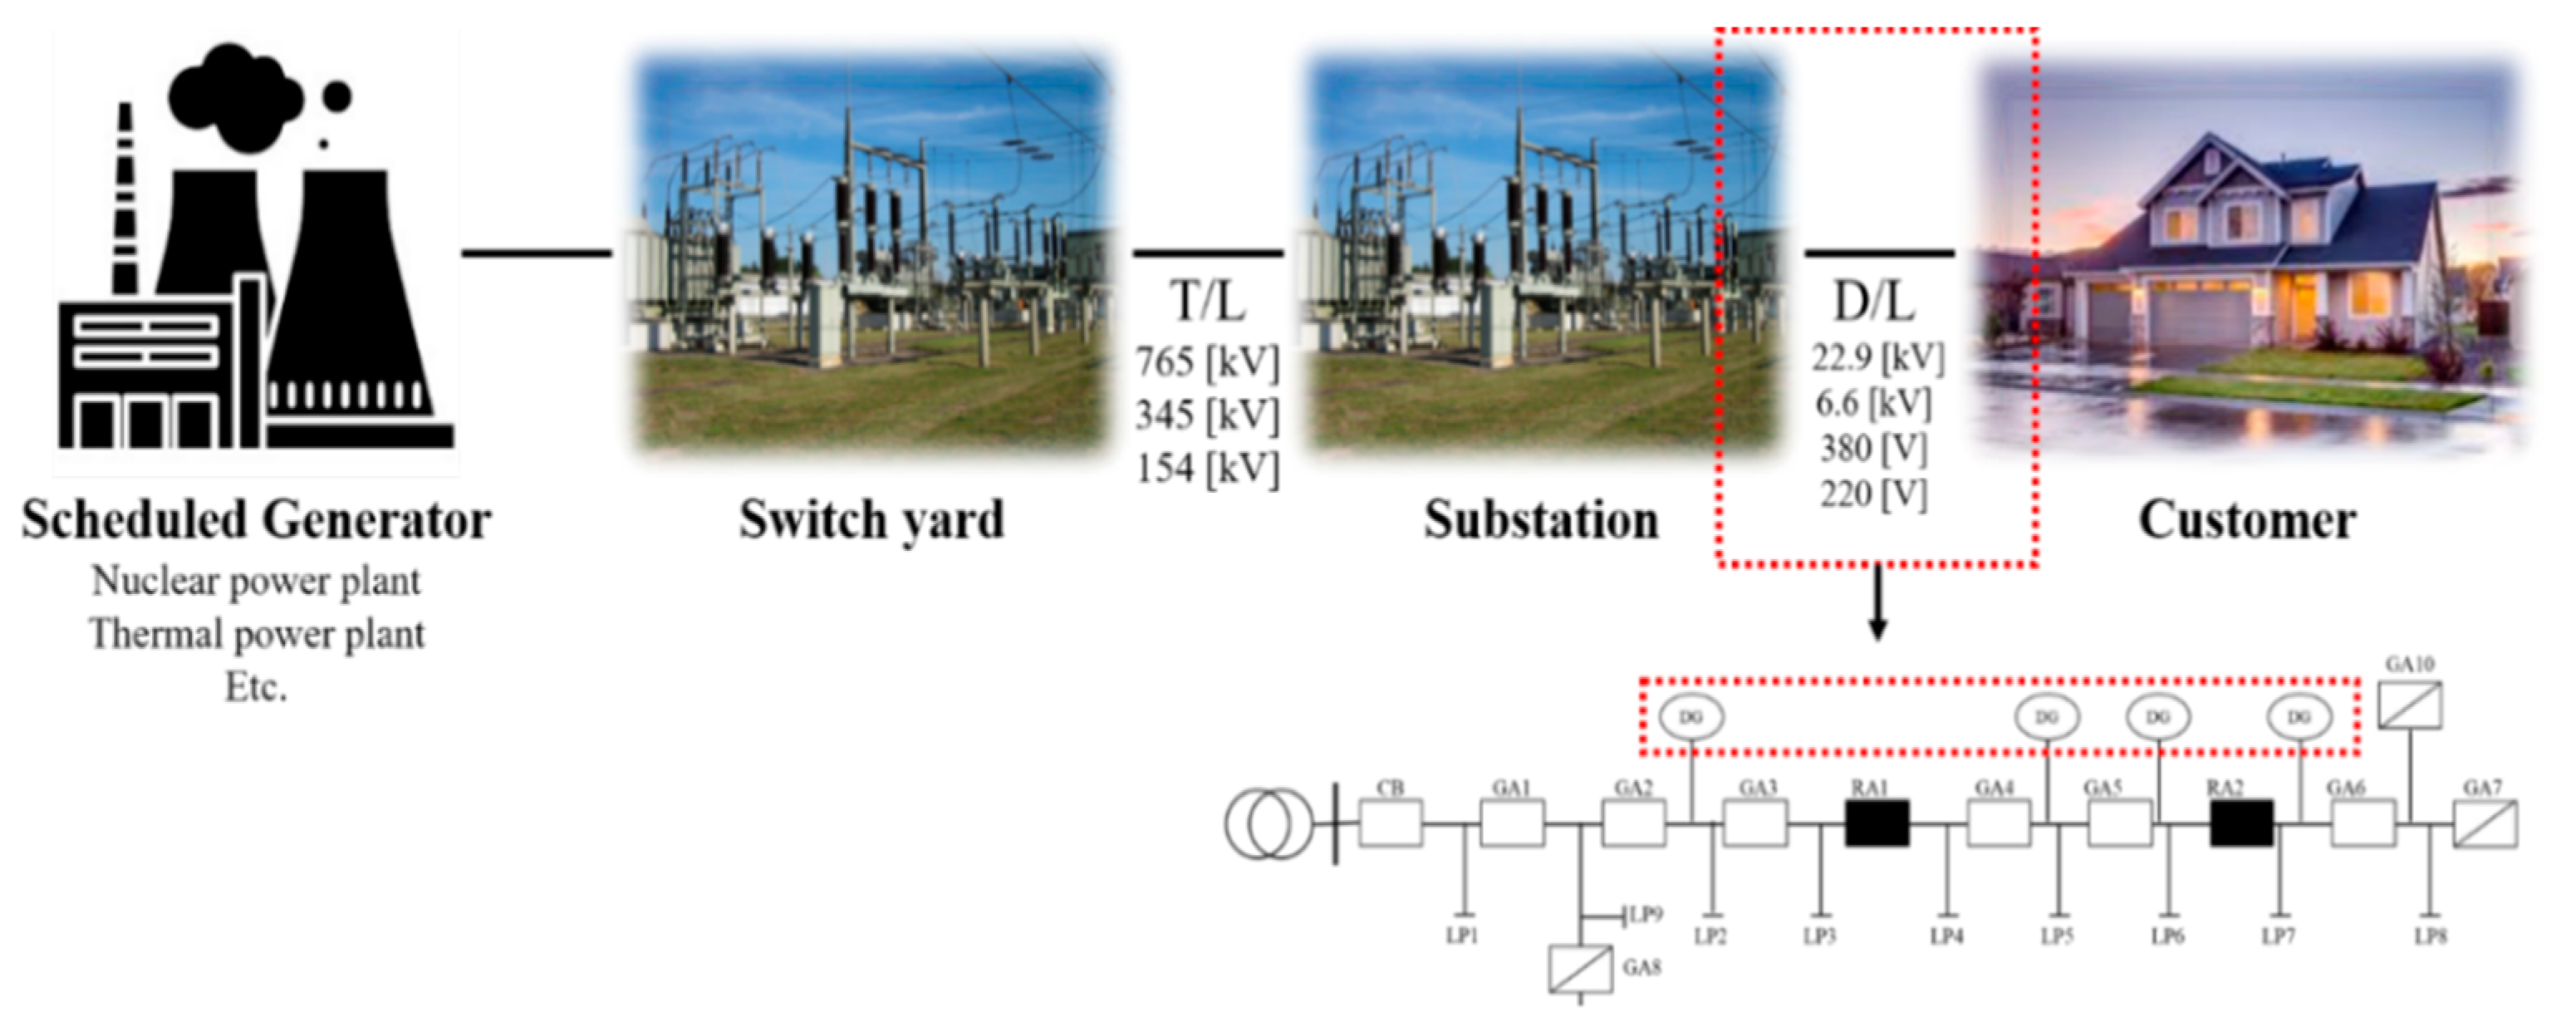
Figure 1. Overall power system scheme in South Korea.
Energies 13 03367 g001
Figure 2. Two-bus model representation.
Energies 13 03367 g002
Figure 3. Proposed algorithm to increase the hosting capacity of the DER in the power system.
Energies 13 03367 g003
Figure 4. Structure of the feeder for simulation (a); Feeder circuit in the DEW (b).
Energies 13 03367 g004
Figure 5. Structure of the distribution system for simulation (a) and the feeder circuit in the DEW (b).
Energies 13 03367 g005
Figure 6. (a) Structure of the transmission system for simulation and (b) the transmission circuit in the DEW.
Energies 13 03367 g006
Figure 7. The result for the feeder (a) voltage variance, (b) FVSI variance.
Energies 13 03367 g007
Figure 8. Results for distribution system: (a) voltage variance, (b) FVSI variance.
Energies 13 03367 g008
Figure 9. Result for the transmission system. (a) voltage variance, (b) FVSI variance.
Energies 13 03367 g009
Figure 10. The result for the power flow in the transmission system.
Energies 13 03367 g010
Figure 11. The overall flow of model development.
Energies 13 03367 g011
Figure 12. The hourly load and DER profile during July 2017.
Energies 13 03367 g012
Figure 13. The number of overvoltage components at different power factors and penetration levels.
Energies 13 03367 g013
Figure 14. The FVSI for various power factors and penetration levels.
Energies 13 03367 g014
Table 1. The nominal voltage of distribution line.
TypeNominal VoltageVoltage by Distribution Type (V)Maximum Voltage
Single-Phase Two-WireThree-Phase Three-WireThree-Phase Four-Wire
Low voltage220220---
380--220/380-
High voltage22,90013,200-13,200/22,90025,800
Table 2. The nominal voltage of distribution line.
Nominal Voltage (V)Maintenance Range (V)
MinMax
Low voltage220207233
380342418
High voltage13,20012,00013,800
22,90020,80023,800
Table 3. The allowable integration capacity for DER into the distribution line.
TypeVoltage (kV)Allowable Capacity (kVA)
Steady StateEmergency State
Normal distribution line22.910,00014,000
Large-capacity distribution line15,00020,000
Table 4. Technical specifications of the distribution line.
TypeApplication StandardAllowable Current (A)Condition
ASCR-OC
160 mm2
Continuous allowable current39590 °C
Table 5. Environment for simulation.
ObjectRangeDistribution Type
Load[3000–3500] kVAUniform
DER[0–14] kVA
Feeder length10 km [Fixed]-
Table 6. Number of Overvoltage Cases during July 2017 Simulation.
Capacity (MW)Penetration Level (%)Overvoltage ComponentMax. Power Share (%)
37.553.2651744233.38
2031.0897248158.88
12.520.11910114.91
1017.9558097.26