Article

Unlocking the Effects of Fluid Optimization on Remaining Oil Saturation for the Combined Sulfate-Modified Water and Polymer Flooding

Institute of Subsurface Energy Systems, Clausthal University of Technology, 38678 Clausthal-Zellerfeld, Germany
*
Author to whom correspondence should be addressed.
Energies 2020, 13(12), 3049; https://doi.org/10.3390/en13123049
Submission received: 12 May 2020 / Revised: 7 June 2020 / Accepted: 12 June 2020 / Published: 12 June 2020
(This article belongs to the Special Issue Enhanced Oil Recovery 2020)

Abstract

:
Interfacial interactions and wettability alteration remain as the main recovery mechanism when modified water is applied seeking to obtain higher oil recoveries. Fluid-fluid interaction could lead to the development of the called viscoelastic layer at the interface in oil-brine systems. This interfacial layer stabilizes thanks to the slow chemical interaction between oil polar compounds and salts in the brine. This study investigates the role of sulfate presence in injection brine that could possible lead to develop the interfacial viscoelastic layer and hence to contribute to the higher oil recovery. Furthermore, polymer flooding is performed in tertiary mode after brine flood to investigate/unlock the synergies and potential benefits of the hybrid enhanced oil recovery. Brine optimization is performed using the composition of two formation brines and four injection brines. Moreover, interfacial tension measurements and oil drop snap-off volume measurements are performed in parallel with the core flooding experiments to define the role of interfacial viscoelasticity as the recovery mechanism other than wettability alteration. Synthetic seawater spiked with double amount of sulfate depicted potential results of interfacial viscoelastic layer development and hence to contribute the higher oil recovery. Total oil recovery after secondary-mode using sulfate-modified water and tertiary-mode polymer flood was higher than the combination of seawater brine in secondary-mode and polymer flood in tertiary-mode. Nevertheless, experiments helped us concluding that the amount of sulfate added is a critical factor to obtain maximum oil recovery and to avoid pore-plugging problems. We, therefore, demonstrate that executing a detailed fluid optimization leads to promising laboratory results, potentially linked with an improvement in the economics of the field applications.

1. Introduction

Water-quality control is an important aspect of process applications, mainly from the operational point of view [1]. Quality control leads to better results when the water flooding process is applied for the purpose of enhanced oil recovery (EOR). Martin [2] first observed an increase in oil recovery using low-salinity water in sandstone reservoirs. Subsequent studies found that not only low-salinity water flooding but also chemically modified/smart water flooding could lead to increased oil recovery. Some researchers have used the terms low salinity and smart water synonymously [3].
Low salinity involves the dilution of injected water (i.e., seawater/produced brine) with fresh water to reduce the total dissolved solids (TDS) [4,5,6,7,8]. This reduces the ionic strength of the injected water but the hardness may remain the same. On the other hand, smart/modified water involves manipulating the ionic strength (hardness) of the injected water [9]. This manipulation is aimed at disturbing the established rock–oil–brine ionic equilibrium, which could result in optimum oil recovery by improving the microscopic displacement efficiency. Hence, the hardness of injected water is also manipulated by the ionic concentration.
In a simple sense, modified water flooding involves either the addition of active ions/salts or the removal of inactive ions/salts from the injection brine. This addition or removal of specific salts changes not only the salinity but also the hardness of the brine [10]. Morrow et al. [11] first proposed the concept of smart water, which led to later investigation of the impact of injected water composition on oil recovery [12,13,14,15,16,17,18]. Chemically modified water flooding has been studied as an EOR technique through sandstone core plugs and field tests [9,19,20,21,22,23]. Modified water flooding has received significant attention as an EOR technique due to its low cost and environmental friendliness compared to other EOR methods. Modified water is created through the manipulation of injected brine chemistry [7,8,19,20,24,25]. This manipulation includes the removal of specific inactive ions/salts as well as the addition of some active ions/salts. The modification of injected brine’s salinity and hardness establishes rock–fluid and fluid–fluid interactions in the reservoir and initiates the various recovery mechanisms responsible for higher oil production.

1.1. Recovery Mechanisms of Low-Salt/Sulfate-Modified Water

Modified-water flooding and low-salinity flooding have common recovery mechanisms, presented in Table 1, namely wettability alteration [26,27,28,29], multicomponent ion change (MIE) [8], clay swelling [8], change in pH value [23,25] and fluid–fluid interaction at the oil–brine interface [30,31,32]. However, this research mainly focuses on the investigation of wettability alteration and the interfacial mechanism at the fluid interface. Both mechanisms are based on the ionic activity among the injection brine, formation brine, oil polar compounds, and rock matrix. The expectation is that modified water injection disturbs the established rock–oil–brine ionic equilibrium due to the role of active ions (potential determining ions, PDI), helping to produce more oil.

1.1.1. Wettability Alteration

Wettability alteration of the reservoir from an oil-wet to water-wet state is a well-established recovery mechanism of low-salinity/modified water flooding, as many studies have reported [26,27,28,29]. The injection of modified water disturbs the established rock–oil–brine ionic equilibrium, which, in turn, releases the oil polar compounds attached to the rock surface [7]. The detachment of oil compounds causes wettability alteration from oil-wet to water-wet. According to information reported in the literature [5,10,33], the basic requirements for the successful application of either process, low-salinity or modified-water flooding, are similar. The following are requirements for wettability alteration of rock formations from an oil-wet to water-wet state to be the primary oil recovery mechanism:
  • Reservoir rock should be oil-wet/intermediate-wet [5,13,34].
Oil polar compounds are attached to the rock surface through divalent cations bridging and result in an oil-wet/intermediate-wet state. Modified water flooding detach these polar compounds and change the reservoir wettability to water-wet condition, as shown in Figure 1, and hence produces an additional oil recovery.
  • Existence of polar compounds in the oil [30,31,32].
Asphaltene and naphthenic acids (NAs) present in dead oil act as surface active compounds. These both surface active compounds stabilize not only water-in-crude oil emulsions but also constitute the stable interfacial film at the oil–brine interface. Slow and irreversible adsorption process of asphaltene at the oil–brine interface produce interfacial viscoelastic layer [35,36,37]. Improved oil–brine interface’s rheological properties due to presence of asphaltene are reported by Acevedo et al. [38]. NAs are another important fraction of crude oil and are composed of cycloaliphatic carboxylic acids (R-COOH) [32,39]. These NAs are accumulated at the oil–brine interface being hydrophilic in nature. Further, NAs can react with cations present in the brine to form naphthenic salts. These salts can dissociate in the aqueous phase or can accumulate at the oil–brine interface. However, the role of NAs remains uncertain. Some researchers claim that NAs develop stable oil–brine interface elasticity [32], while others reported these salts can soften the interfacial film [40].
  • High content of divalent cations in the formation brine [14,41].
Divalent cations (Ca+2, Mg+2) present in the formation of brine establish the chemical bondage between negative oil polar compounds and negatively charged rock surfaces, as shown in Figure 1. These ions are responsible for altering the sand-stone wettability from water-wet to oil-wet during the aging process.
In addition, contrary to previously reported cases, recent research has proposed that the presence of clay is not important for wettability alteration from an oil-wet to water-wet condition [42].

1.1.2. Oil–Brine Interfacial Interactions (Interfacial Viscoelasticity)

Some authors have proposed the role of fluid–fluid interfacial interactions as a recovery mechanism other than wettability alteration, as presented in Table 2. They claim that wettability alteration cannot be the only factor in low-salinity/modified-water flooding contributing to high oil recovery [22,33,37]. Therefore, another parameter that plays an important role in modified water flooding is the interfacial interaction between the brine and oil phases (fluid–fluid interaction).
These properties are static interfacial tension as well as dynamic interfacial rheology caused by ionic interfacial interactions at the fluid interface [30,43]. Additionally, in recent years, a great deal of research has investigated the role of interfacial rheology (dynamic interface response) in the brine–oil system, as presented [22,44].
Mohamed and Alvarado [22] reported the impact of sulfates on brine–oil interfacial elastic moduli, viscous moduli, and viscoelasticity. Mohamed and Alvarado [22] summarized that five times and three times higher (spiked) sulfate (3S and 5S) in seawater results in the highest response of viscoelasticity and viscous and elastic moduli. Similarly, Alvarado et al. [44] showed the impact of sulfates on elastic moduli. Alvarado et al. [44] concluded that Na2SO4 results in the highest elastic moduli over time (hours) at the oil–brine interface compared to NaCl and CaCl2.
From the results of Mohamed and Alvarado [22] and Alvarado et al. [44], it can be concluded that the spiked amount of sulfate improves the oil–brine interfacial interaction. Mohamed and Alvarado [22] reported that 3S and 5S brine produced optimum interfacial viscoelasticity. Improved dynamic stability forms a mechanically stable interfacial surface at the brine–oil interface and prevents snap-off oil droplets. Further, detached oil compounds develop liquid–liquid interaction with modified water to develop a stable layer at the interface [6,9]. Some researchers believe the formed fluid interface (oil–brine) is the main recovery mechanism other than wettability alteration [36,37,42,45].
In light of these findings, ionic manipulation plays a key role in developing interfacial interaction between brine and oil (fluid–fluid interaction). Studies show that the interfacial film forms when the NAs and asphaltene present in crude oil and divalent ions in the aqueous phase accumulate at the interface [35,36]. However, this layer is sensitive to brine salinity and forms a more stable layer under low-salt brines. According to Mohamed et al. [22], sulfates improve interfacial rheology between the two phases, resulting in higher oil recovery. In other words, from a fluid–fluid interaction point of view, sulfates could improve the stable interface resulting in oil-phase snap-off suppression and increase the oil drop size [6,22,46]. The fluid–fluid interaction is developed at the interface between the oil polar compounds and ions present in the brine forming a layer. The layer assists in transporting the continuous oil phase and resists the oil snap-off, hence producing more oil [47].
While the above-described studies of both recovery mechanisms—wettability alteration and fluid interfacial interactions—provide valuable information, the role of the main recovery mechanism of these two processes remains uncertain and needs to be investigated.

1.2. Sulfate as the Effective Potential Determining Ions (PDI)

Multivalent ions play a significant role in designing effective modified water. Therefore, most laboratory studies have investigated the impact of spiked SO4−2, Ca+2, Mg+2, BO3−3, and PO4−3 on oil recovery [6,10,52,53]. These ions are called potential determining ions (PDI) [13]. Due to their high ionic charge, these ions disturb the established rock–oil–brine (ROB) ionic balance and caused the release of polar oil compounds. In other words, PDI catalyzes the fluid–fluid and rock–fluid interaction process inside the reservoir. One important aspect is that among these PDIs, sulfate SO4−2 has proven to be the most effective for application in sandstone and carbonate reservoir rock [8,13,22,53].
Mohamed and Alvarado [22] investigated sulfate as a key parameter to design a smart water recipe for Berea sandstone core plug. According to authors, brines 3S (three times sulfate in seawater) and 5S (five times sulfate in seawater) brine showed promising results for oil–brine interfacial viscoelasticity and produced the highest oil recovery. Therefore, the amount of sulfate to be added in the modified water is a critical factor in the effective flooding process.
The wettability alteration process in sandstone reservoirs (clay and quartz) by a spiked (increased) amount SO4−2 is summarized in Figure 1. A spiked (increased) amount of SO4−2 in injected brine disturbs the ionic equilibrium of the system, resulting in the replacement of negative oil polar compounds with SO4−2 through Ca+2 and Mg+2 bridging the rock surface. Thus, oil polar compounds are released, and SO4−2 is attached to the rock surface through ionic bridging, resulting in a water-wet rock surface [7].
Nevertheless, a higher concentration of sulfate can be problematic when a significant amount (supersaturation) of divalent cations (Ba+2, Sr+2, and Ca+2) are present in the formation water. The latter is known as supersaturation that could get worse due to the chemical reactions, since for instance precipitation of CaSO4, BaSO4, and SrSO4 can occur. If the reservoir temperature is high enough, then this issue, also known as scaling, could potentially worsen compared with lower temperatures, as high temperature enhances the precipitation process [54,55]. This process, in turn, will cause major injectivity issues due to the generated formation damage and pore plugging around the wellbore [56,57,58]. Precipitation and pore-plugging problems challenge the efficiency of sulfate-modified water injection and can make any project uneconomical. In 2016, Ghosh et al. [57] studied the prediction of precipitation formation using a simulation technique and presented scale control methods.
Similarly, monovalent ions have no significant impact on additional oil recovery and are defined as non-PDI (Na+1 and Cl−1 and K+1). Thus, monovalent ions should be either removed or diluted to design the modified water. To enhance the wettability alteration of rock formations from oil-wet to water-wet, some researchers have proposed decreasing the Na+1 concentration in the injected water to design optimum modified water for the target reservoir system [46]. Moustafa and Shedid [46] showed the impact of decreasing the amount of non-PDI (Na+1) and increasing the amount of PDI sulfates (SO4−2) in injection brines. The obtained results indicate that increasing the amount of SO4−2 and decreasing the amount Na+1 produces higher cumulative oil recovery. However, pore volumes injected to achieve oil recovery from core plugs are less realistic compared to field-scale applications. Therefore, oil recovery obtained below 5 pore volume (PV) injected is relevant, focusing on the field-scale application.

1.3. Hybrid EOR Processes

Modified water with an increased amount of sulfates, combined with other EOR methods, is expected to produce additional oil recovery due to multiple recovery mechanisms. Similarly, the combination of polymer flooding with other EOR techniques has demonstrated positive effects on oil recovery, as shown in Table 3.
A potential benefit of the hybrid EOR method is the role of multiple recovery mechanisms in enhancing the capability of the flooding process. Reservoir wettability from oil-wet to water-wet is established during modified-water flooding as a pre-flush and changes the fluid distribution in the pores. Oil-phase moves from small pores to large or medium pores due to wettability alteration. Polymer flooding as tertiary mode after modified brine produces the oil phase present in big pores due to favorable mobility ratio. Further, this technology can be used for a proposed commercially economical EOR method. During the combined EOR flooding process, low-viscosity/concentration polymers are injected after the modified water [6,10,65]. However, recovery factors obtained are promising compared with high-concentration polymer flooding alone. Moreover, small concentrations of polymer in the hybrid method also reduce the potential environmental risks.

2. Overall Methodology and Approach

This work investigates the ability of combined EOR techniques (modified brine injection and polymer flooding), known as the hybrid method, to enhance the capability of the flooding process. The objectives of this paper are achieved using the following methodology, as shown in Figure 2, to gather data and evaluate the results:
  • Optimization of Formation and Injection Brines: Two types of formation brine and four types of injection brine were generated. The primary approach was to prepare brines, focusing on the role of increasing the sulfate and varying the TDS of the synthetic seawater (SSW) to correlate with the impact of salinity on oil recovery.
  • Polymer Diluted Solutions at Target Concentration: Low-concentration (750 ppm) polymer solutions were prepared to achieve a viscosity ratio of 2 between the oil and polymer. Polymer solutions were prepared to investigate the synergies and benefits of the combined EOR processes.
  • Contact Angle Measurements: Contact angle measurements were performed to confirm the wettability alteration of Bentheimer core plugs from a water-wet to oil-wet condition. Two approaches were adopted to cross-validate the results.
  • Mechanical degradation of polymer solutions: This step allowed us to understand and define any possible degradation prior to the core face and to draw better conclusions on polymer performance.
  • Fluid–fluid Interactions: Interfacial tension and interfacial viscoelastic response measurements were performed to investigate the ionic interaction between oil polar compounds and active ions in brine. The results of fluid–fluid interactions were incorporated to determine the possible impact on oil recovery.
  • Oil Recovery through Hybrid EOR Process: Different brines were flooded through oil-wet core plugs, as the secondary mode, followed by tertiary-mode polymer flooding. The purpose was to investigate the synergies of the promising hybrid EOR process.

3. Materials and Methods

3.1. Fluids and Chemicals

3.1.1. Brine Composition

For this study, two groups of brines are prepared through mixing different salt components with deionized water:
  • Group 1 is used to evaluate the different formation brines using SSW and doubled TDS of synthetic seawater (2*SSW TDS).
  • Group 2 is prepared to optimize a modified water based on the divalent ions, specifically with sulfates.
Synthetic seawater (SSW) is used as the base brine and therefore as a benchmark. Brine optimization is performed by addition of sulfates or removal of sodium ions. A detailed description of the used brines can be seen from Table 4. SSW + 2SO4−2 represents the base brine (SSW) with a doubled amount of sulfates while SSW + 4SO4−2 indicates the quadruple amount of sulfates. While SSW – Na represents the complete removal of sodium ions from SSW. For all brines, filtration is performed using 0.2 μm MF-Millipore Membrane Filter (Sigma-Aldrich) by applying ~40 psi (2.76 bar) N2 gas pressure, in order to avoid any undissolved solvent or small particles.
Note that in order to avoid any concern regarding solubility of SO4−2, as well as any precipitation issues, we have used a seemly low amount of within our experiments. This approach led us avoid precipitation and possible damaging chemical interactions, e.g. precipitation of calcium sulfate (CaSO4) and magnesium sulfate MgSO4”.
Brine hardness is calculated using the proportion of divalent ions in each brine. The parameter R+1 is defined according to Equation (1) by weight, as explained by Tabary et al. [70] and Tay et al. [71].
R + 1 = D i v a l e n t   c a t i o n s T o t a l   c a t i o n s

3.1.2. Polymer Solutions
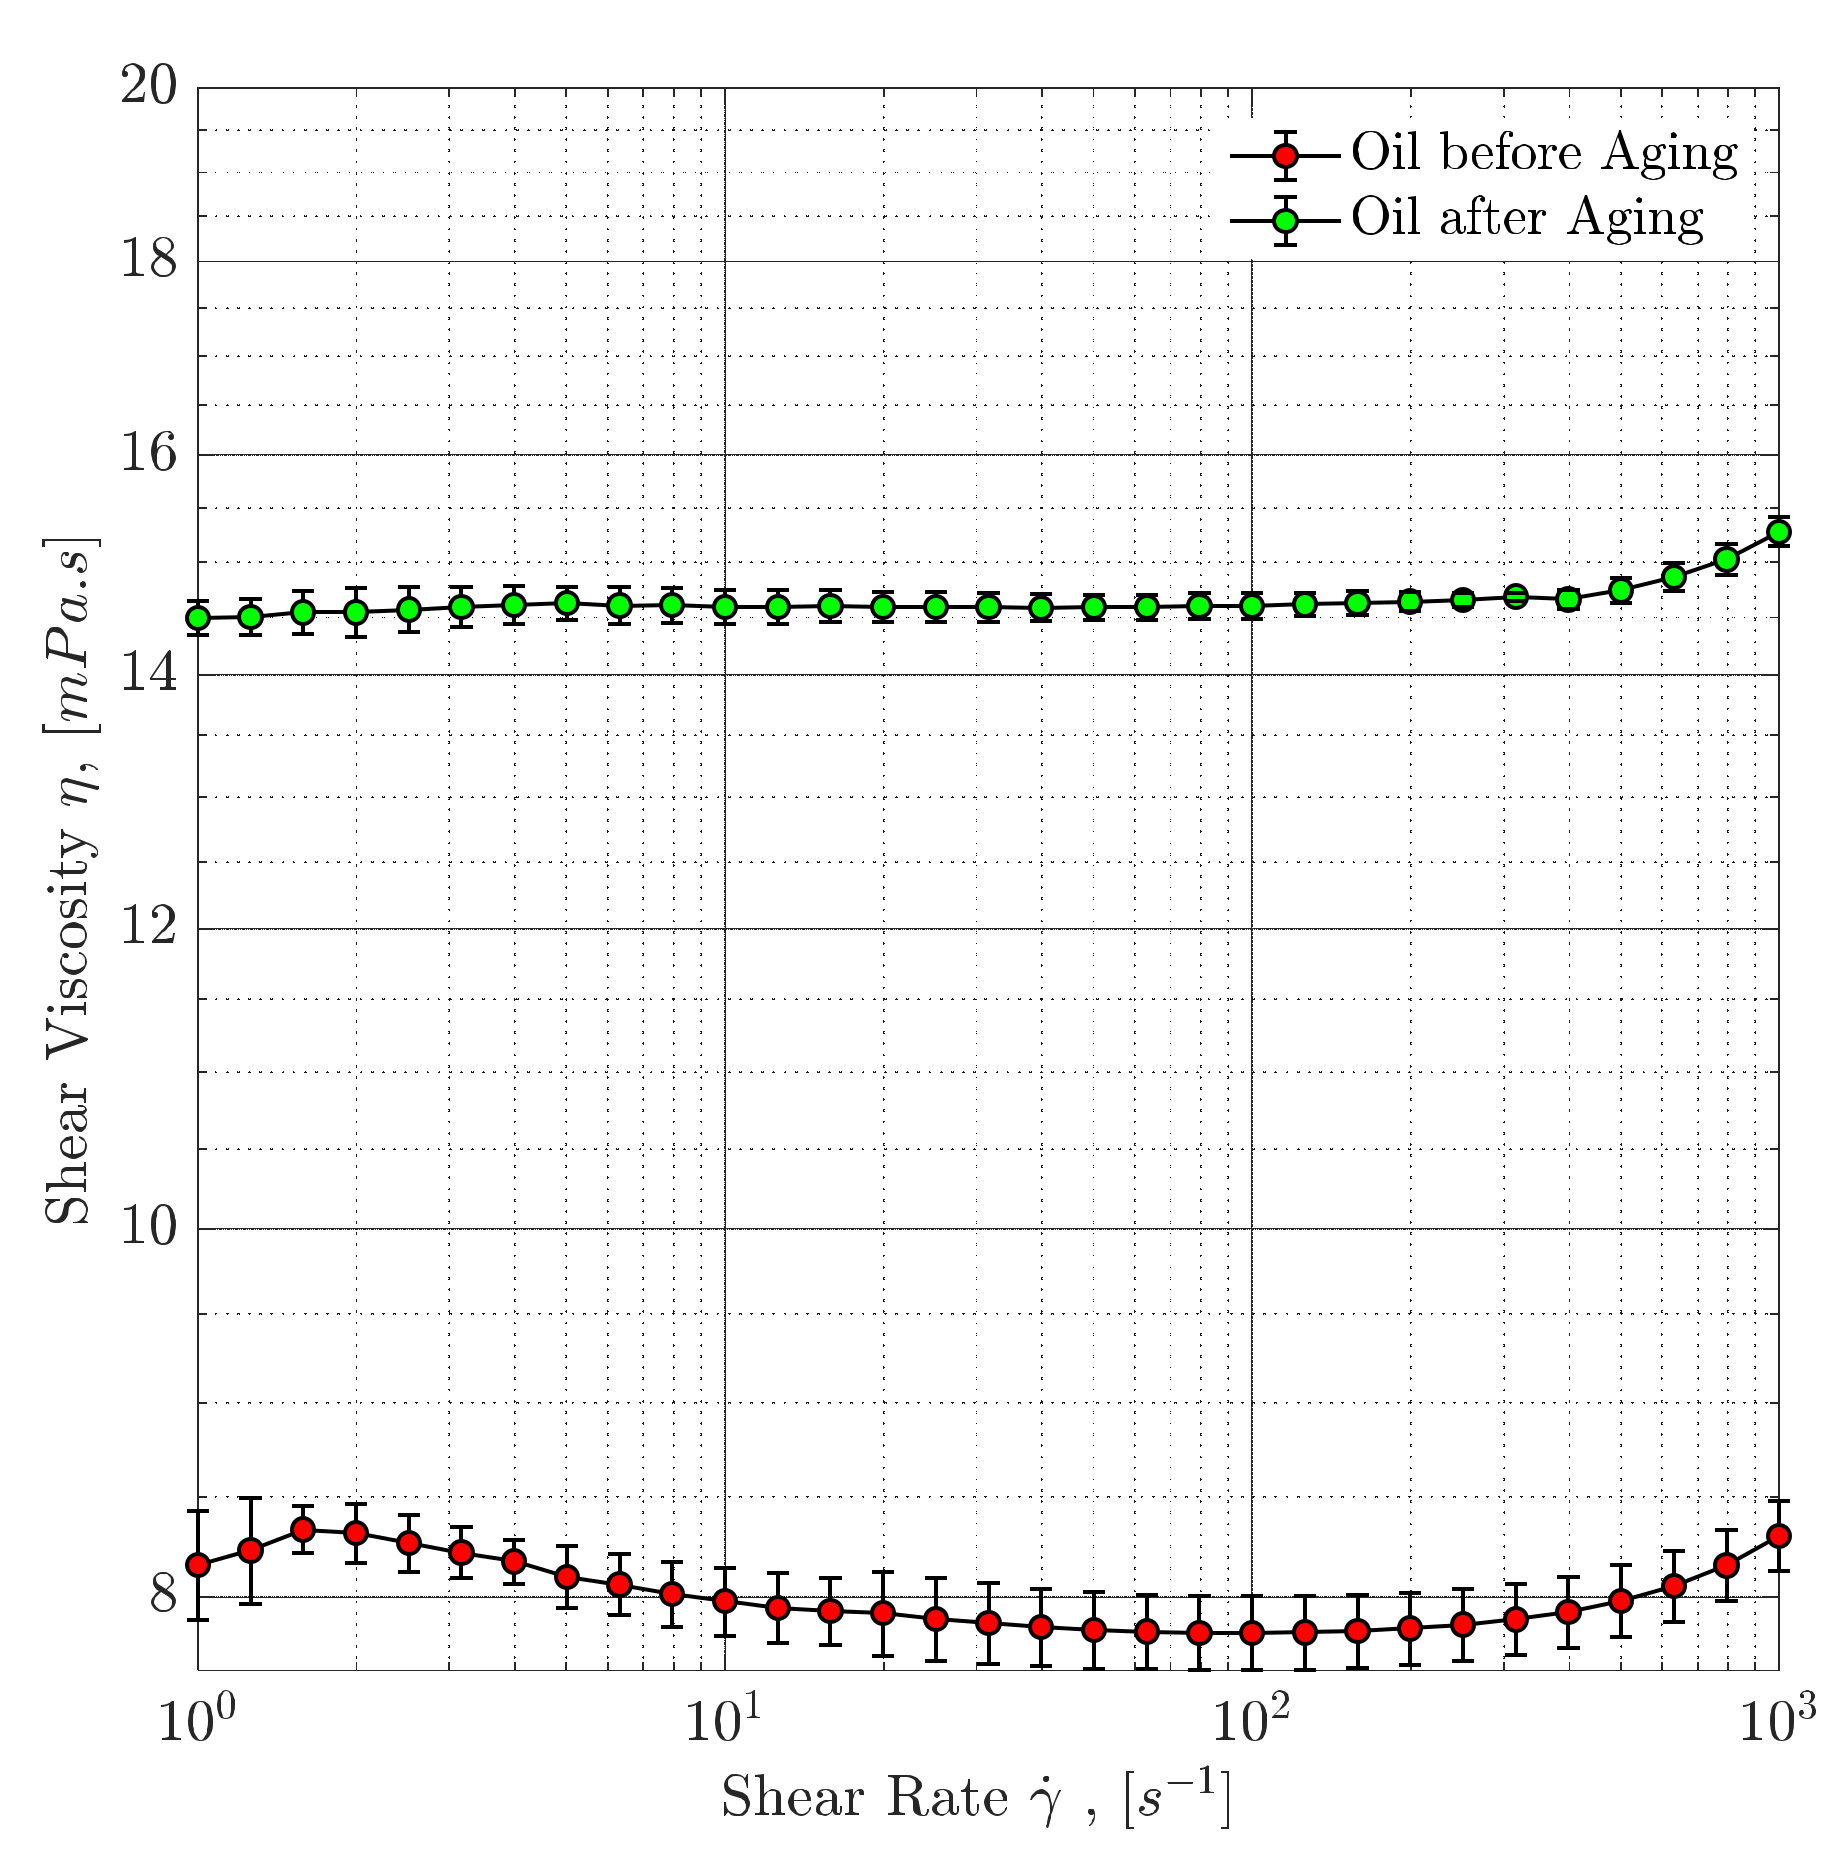
A synthetic, high molecular weight and viscoelastic polymer -Flopaam 6035 S (provided by SNF Floerger from Andrezieux, France) is used to prepare the diluted solutions. Flopaam 6035 S is a co-polymer of acrylamide and acrylate, suitable for reservoirs with temperature up to 70 °C with high Molecular Weight (MW) and reported viscoelastic behavior [72,73,74,75,76,77]. Diluted solutions are prepared using three injection brines (brine 1, brine 3 and brine 4) of Table 4 keeping a constant polymer concentration (750 ppm) using the approach adopted by Hincapie [73]. Polymer concentration of 750 ppm is defined to obtain a viscosity ratio of two between oil and polymer solution. Further, a detailed description of the rheological characterization and the concentration determination is described under fluid optimization section of previous work [7,8,10]. Diluted solutions are filtered using a 5.0 µm MF-Millipore Membrane Filter (Sigma-Aldrich) to avoid any undissolved fish eyes.

3.1.3. Dead Oil

Centrifuged and degassed dead crude oil (TAN is 1.15 mg KOH/g) is used for all experiments. Oil was filtered through a 5.0-μm Millipore filter to avoid the solid particles and thick residue. Main crude oil properties measured at 22 °C are Density (g/cm3) 0.88, 29.42 °API gravity, η (mPa.s) 23.00.

3.2. Porous Media

Bentheimer core plug samples are used in this study. Plugs are trimmed with an average length and diameter of 60 mm and 30 mm, respectively, and stored in the oven at 60 °C for at least 3 days. The performed routine core analysis (RCA) parameters can be seen from Table 5. Porosity (Φ) is measured using a Micromeritics 1340 pycnometer and permeability using a gas permeameter (kg) and brine (kb). FB* represents the formation brine in the core plugs.
Figure 3 provides a schematic representation of the core-flood setup. It consists of three ISCO pumps connected in a multi-flow arrangement (infusion/withdrawal). The core plug is placed in a core holder that receives confining pressure of 30.0 bar, applied using an ISCO injection pump by a control pressure mode. A backpressure valve of 2.0 bar is used to establish system pressure. The following steps were performed for core preparation and two-phase experimental evaluation:
  • Water Saturation: Vacuum saturation is used for initial water saturation at 100% Brine.
  • Permeability to Water (Brine): SSW brine is injected at three injection rates (0.5, 1.0 and 0.5 mL/min).
  • Oil saturation to initial water saturation (Swi): Oil saturation of core plugs is performed using a porous plate with a maximum injection pressure of 8.0 bar.
  • Core Ageing for Wettability Alteration: All cores are aged at 45 °C (core flooding experiments temperature) for six weeks prior to each core flood experiment, in order to establish attachment of polar components on the core. The wettability alteration of Berea and Bentheimer sandstone core plugs through a two- or three-week aging process has been established by many researchers [22,42,78,79].
  • Two-phase flooding experiments: The workflow/sequence adopted for the core flooding experiments is listed in Table 6. Bump rate injection is performed to avoid capillary end effects before tertiary mode flooding.

3.2.1. Contact Angle Measurements

Measurements were performed at room temperature (i.e., 22 °C) using the SSW brine. The core plug face was polished to achieve maximum smoothness and hence saturation with SSW. The core plug was placed with the smooth surface inside brine, and an oil drop was introduced from the bottom with a syringe system developed in-house. The oil drop came in contact with the plug surface, and contact angle measurements were performed over time. Furthermore, the core plug was saturated with dead oil to achieve connate water saturation, and plug aging was performed at 50 °C in an oven for six weeks. The aged core plug was immersed in SSW using the same procedure described earlier, to measure the contact angle between the oil-drop and rock surface. The core plugs were initially assumed as water-wet, and the aged plug was expected to become oil-wet due to the aging process, or mix-wet in the other case. Note that some additional measurements were performed using the pendant drop method (OCA 15 from Data Physics OCA-Series with some modifications) for cross-validation purposes. Modification of the pendant drop method included the oil-drop production procedure using the technique described earlier in this section. Image processing for contact angle measurements was performed using the OCA 15 device from DataPhysics Instruments GmbH (Germany). Contact angle measurements were performed for the core plugs aged for six weeks.

3.2.2. Mechanical Degradation of Polymer-Before Entering the Plug Face

Polymer solutions are injected through a stainless-steel pipeline (inner diameter = 1/8 inch) located between the injection pump and the core plug inlet. Polymer solutions are pumped at a rate of 0.15 mL/min (the same injection rate of the core flood) to investigate polymer mechanical degradation that occurs through pipes and valves. The main rationale is to define/determine in which percentage polymer degradation occurs before entering the core plugs. Degradation is therefore determined based on a comparison of the steady-shear viscosity before and after using Equation (2).
D e g r a d a t i o n   R a t e   D R = η o η e η o 100
where, η o = viscosity of the original solution, and η e = viscosity of the degraded solution.
According to different authors, e.g., [80], mechanical degradation is caused by the constant shear rate exerted by the pipe walls.

3.3. Fluid–Fluid Interaction

3.3.1. Interfacial Tension (IFT) Measurements

Oil–brine interfacial tension (IFT) measurements are performed to study the influence of brine monovalent and divalent ions (SO4−2, Ca+2, Mg+2) at the oil–brine interface. IFT measurements are performed at room temperature of 22 °C using the Du Noüy ring method (Prozessor-Tensiometer KRUESS GmbH K12). The input parameters of the device are oil and brine densities and the procedure for the evaluation can be described as:
A metallic ring is placed on a fire for a few seconds to burn any organic compound if present. The sample holder is filled with the brine sample, and a measurement ring is inserted in the brine. Device calibration is performed. The oil phase is filled at the top of the brine phase to the marked level. Measurement is performed by selecting the ring movement from bottom to top (brine to oil phase). Towards the end of the measurement, IFT at the oil–brine interface is measured through the force experienced by a sensor attached to the metallic ring. IFT measurements are performed between the dead oil and the five brines presented in Table 4.

3.3.2. Interfacial Viscoelastic Response (IFV)

This measurement does not provide a direct measure of interfacial viscoelasticity (G’ and G”). Rather, an indirect response of oil-drop size at the snap-off point incorporates with the dilatational elasticity. A 2.5 µL oil drop is produced in the specific brine phase through a syringe. Ten minutes of settlement time is provided to establish the ionic equilibrium between oil–brine phases. Ionic interaction between oil polar compounds and brine divalent ions is expected to happen during this time at the fluids interface. Oil (2.5 µL) is further injected after 10 min time interval to increase the oil drop size. Further ionic interaction time of 10 min between both phases is established. Subsequently, 2.5 µL oil is injected to increase the oil drop volume further. This oil-drop increasing process continues until the oil drop snap-off happened from the needle. The stable interfacial viscoelastic layer is estimated to produce big oil drop size before the snap-off point
Oil-drop involves two forces in opposite directions before the snap-off takes place. The first force, known as the buoyancy, occurs in an upward direction due to oil density. The second force is the interfacial elasticity, which acts downwards, establishes the oil-drop attachment to the needle, and suppresses the oil-drop snap-off. Oil-drop size continues to increase in the case that the downward force at the interface is higher than the upward force. After a definite increase in oil-drop size, buoyancy leads the interfacial elastic force and oil-drop detachment happens from the needle.
This investigation helped the study of the dilatational elasticity produced at the oil–brine interface due to ionic reactions. The strong dilatational elasticity response produces a stable interfacial elastic layer, which is expected to produce a big oil-drop before the snap-off point. Similarly, Morin et al. [47] and Mohamed and Alvarado [22] demonstrated that elastic interfacial film is stable and resistant to snap-off. Improved oil–brine interface will assist continuous oil flow during flooding and is hence correlated with the higher oil recovery.

3.4. Rheological Measurements

Rheological experiments are performed using a Kinexus pro+ rheometer by Malvern Instruments Ltd. to characterize polymer solutions. A double gap cell stainless steel (316) geometry is used. The type of double gap geometry used is DG24/27 R0427 SS, where the bob outer diameter is 24 mm and cup inner diameter is 27 mm. Steady shear viscosity measurements are performed using the double gap geometry. Fresh polymer solutions are utilized for each measurement starting from lower to higher shear rates. Rheometer calibration and inertia error correction are performed prior to each measurement and viscosity measurements are performed for fresh solutions in order to avoid the possible minor changes in polymer molecular structure. For further details on the detailed rheological measurement evaluation, refer to the author’s previous publications, specially [72], with further details in [74,75,76,81,82].

4. Results and Discussion

4.1. Wettability Alteration

Contact angle measurements of aged Bentheimer core plugs confirmed the attachment of the polar oil compounds to the rock surface and wettability alteration from water-wet (Figure 4) to an oil-wet (Figure 5).
The water-wetness of the Bentheimer core plug saturated with SSW was determined, as the oil drop did not result in any change in the contact angle over time (Figure 4). Water-wetness of Bentheimer sandstone has depicted that rock surface is strongly hydrophilic. The hydrophilic rock tendency, in turn, could not imbibe the oil-drop when in presence of the brine saturated core plug. Hence, the oil-drop shape when in contact with the rock surface remains unchanged resulting in no contact angle change. For the oil-saturated and aged core, a change in the contact angle was observed over time, confirming a possible wettability alteration due to the attachment of polar compounds with the rock surface over the aging period (Figure 5). It is assumed that Bentheimer has a negligible amount of clay (less than 1%), so quartz causes this wettability modification. The result is supported by Al-Saedi et al. [42], who reported that quartz behaves similarly to clays. According to Skauge et al. [79], the aging of Bentheimer cores at 50 °C for three weeks would induce the attachment of oil polar compounds to the rock surface.
Additional observations were made using the pendant drop method to validate the contact angle measurements. This approach was used to measure the contact angle between the saturated core plugs (seawater and dead oil) and oil drop, as shown in Figure 4 (bottom images) and Figure 5 (bottom images), respectively. A similar trend was observed, as core plugs saturated with brine showed a water-wet condition while oil-saturated, aged core plugs were altered to an oil-wet condition.
Contact angle results obtained from both approaches, in-house measurements (top images) and pendant drop method measurements (bottom images), are in line. The brine-saturated core plug indicated water wettability of the core plug. However, the six-week aging process of the oil-saturated core plug resulted in wettability alteration from a water-wet to oil-wet condition. This wettability alteration to an oil-wet state was caused by the oil polar compounds’ attachment to the rock surface through the bridging reaction of divalent cations present in the formation brine, as shown in Figure 1. Divalent cations bridging resulted in rock surface change from hydrophilic to hydrophobic. However, to establish hydrophobic conditions, formation brine must have a significant amount of divalent cations and oil should contain sufficient polar compounds. The slow chemical interaction during aging process, established the negative oil polar compounds attachment to negatively charged rock surface through divalent cations bridging. In contrast, the other hydrophobic surfaces (limestone) established oil-wet condition through a direct ionic interaction between positive charged rock surface and negative oil polar compounds. Therefore, we consider that the presence of divalent cations is an essential requirement to achieve the hydrophobic state in sandstone rock.

4.2. Fluid–Fluid Interaction

4.2.1. Impact of Sulfates on IFT

Table 7 presents the defined IFT response for each solution tested in this research. The results suggest that an optimum concentration of sulfate is a critical criterion to design adequate mechanized/modified water based on the fluid–fluid interfacial mechanism. SSW+2SO4−2 had the highest IFT value, which means it also resulted in the development of an elastic layer at the oil–brine interface. Therefore, the actual impact of both factors (rigid interfacial layer and coalescence-suppressing interfacial barriers) on oil recovery needs to be cleared from the core flooding experiments. Two main points can be derived from Table 7.
  • Doubling the amount of sulfates in SSW resulted in a doubled value of IFT (compared to SSW).
It is assumed that changes obey the ionic reaction happening at the interface. Interactions between divalent ions in the brine and oil polar compounds (asphaltene) at the interface formed a stable layer. The results of Mohamed and Alvarado [22] and Moustafa and Shedid [46] support this assumption. Morin et al. [47] proposed that this elastic layer at the interface correlates with producing more oil due to continuous oil flow because the layer is resistant to oil-phase rupture. The improved interfacial layer developed at the fluid interface helped produce higher IFT measurements for SSW+2 SO4−2 brine.
  • Quadrupling the sulfates in SSW resulted in a decrease in the IFT response.
A possible explanation for this behavior is the presence of an excessive amount of sodium in the brine. An excessive amount of sodium in the brine can implicate the development of naphthenic salts through the reaction between sodium in the brine and NAs in the oil. Naphthenic salts are accumulated at the oil–brine interface and soften the interfacial film [40]. According to Alvarado et al. [43] and Moradi and Alvarado [30], the controlling mechanism is associated with two coalescence-suppressing interfacial barriers between fluids.

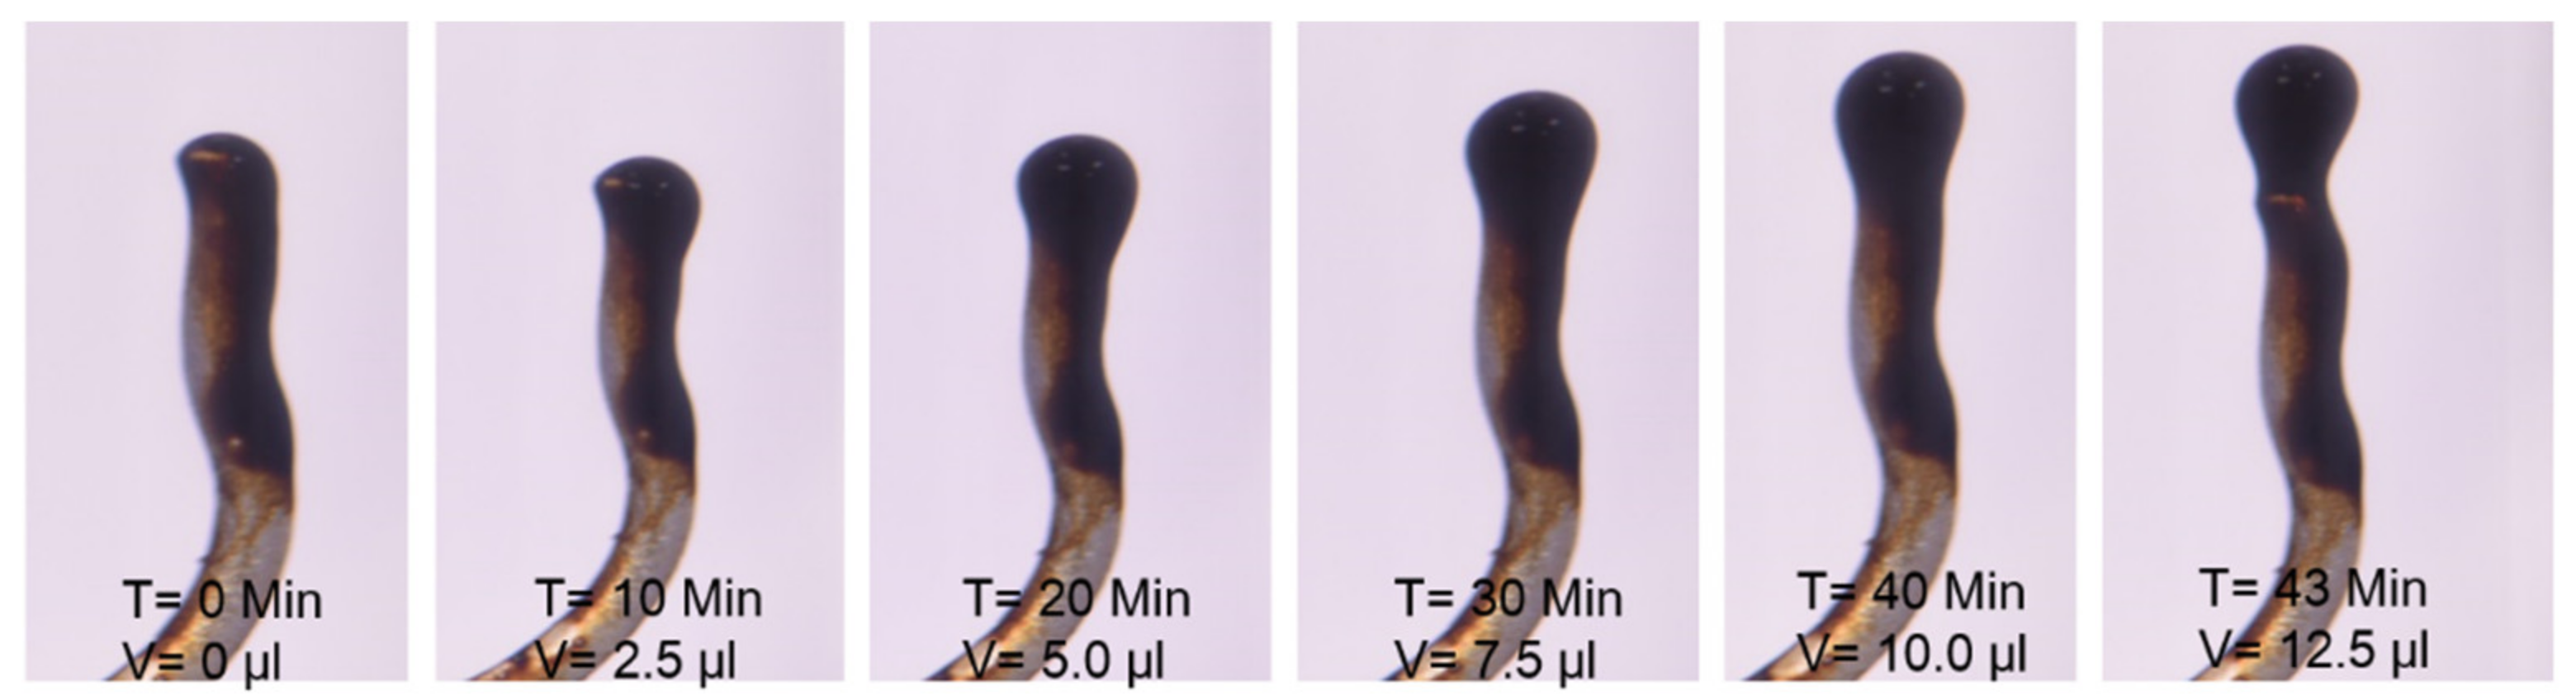
4.2.2. Interfacial Viscoelastic Response (IFV)

Table 8 summarizes the defined data. The observed behavior appears to be in line with the results reported for the IFT response. SSW+2SO4−2 depicted the biggest drop size before the drop snap-off point, and the drop was sustained on the needle for 43 min. It is assumed that this is due to the improved oil–brine interface layer developed by the slow and irreversible adsorption process of asphaltene-sulfate at the oil–brine interface, as discussed earlier [35,36,37]. This adsorption process of asphaltene-sulfates resulted in the development of a stable interface between the oil and brine [38]. Moreover, the induced interfacial layer made the oil-drop resistant to rupture, or the oil-drop snap-off from the needle occurred after a longer time interval. Both sulfate and NAs produced repulsion forces at the interface, as shown in Figure 6B. The ability of NAs to improve the oil–brine interfacial elasticity was also reported by Havre and Sjoeblom [32]. These repulsive forces resulted in a higher IFT response at the fluid interface. This higher IFT indirectly resulted in the development of an interfacial elastic layer at the fluid interface. Hence, the stable and elastic interfacial layer continued to produce large oil drops with increasing oil influx until the buoyancy force overcame the interfacial force. The higher buoyancy force caused oil-drop snap-off from the needle. Moreover, the strong interfacial layer made the oil drop resistant to rupture or snap-off from the needle for 43 min, in Table 8.
An additional point to note is that SSW+4SO4−2 had the smallest oil drop size at the snap-off point. A reason for this is an excessive amount of sodium can cause coalescence-suppressing interfacial barriers at the oil–brine interface. An excessive amount of sodium can promote the stability of microscale water-in-crude oil emulsions at the interface and, hence, early snap-off of the oil drop from the needle, as shown in Figure 6A. According to Kiran et al. [40], an excessive amount of sodium results in the formation of naphthenic salts at the interface, which, in turn, softens the interfacial barrier. In simple words, attractive forces are developed at the oil–brine interface as the result of an excessive amount of sodium ions and negative oil polar compounds (NAs), as presented in Figure 6A. These attractive forces result in microscale soap formation at the interface, which results in a decrease of IFT. Hence, buoyancy becomes dominant at the small oil-drop size, which results in earlier oil-drop snap-off from the needle.
A series of images shown in Figure 7, Figure 8, Figure 9 depict the oil-drop size development during the snap-off evaluation. As shown, the oil drop in SSW brine developed drop volume up to 7.5 µL, which was sustained for 21 min (Figure 7), while in SSW+4SO4−2 brine, the drop volume reached only 5.0 µL and was sustained for 11 min before snap-off (Figure 8). Moreover, in SSW+2SO4−2 brine, the largest oil drop size developed, at 12.5µL volume, with snap-off occurring at 43 min (Figure 9).
As an overall observation, doubling the amount of sodium sulfate improved the asphaltene-sulfate adsorption process at the oil–brine interface and helped develop a stable interfacial barrier. This improved elastic response resulted in the higher IFT values and the production of larger oil drops. Further, increasing the amount of sodium sulfate catalyzed the ionic reaction between sodium ions in the brine and NAs in the oil. This reaction produced a negative impact on the oil–brine interfacial film, resulting in lower IFT values and hence small oil drop production.

4.3. Rheological Evaluation

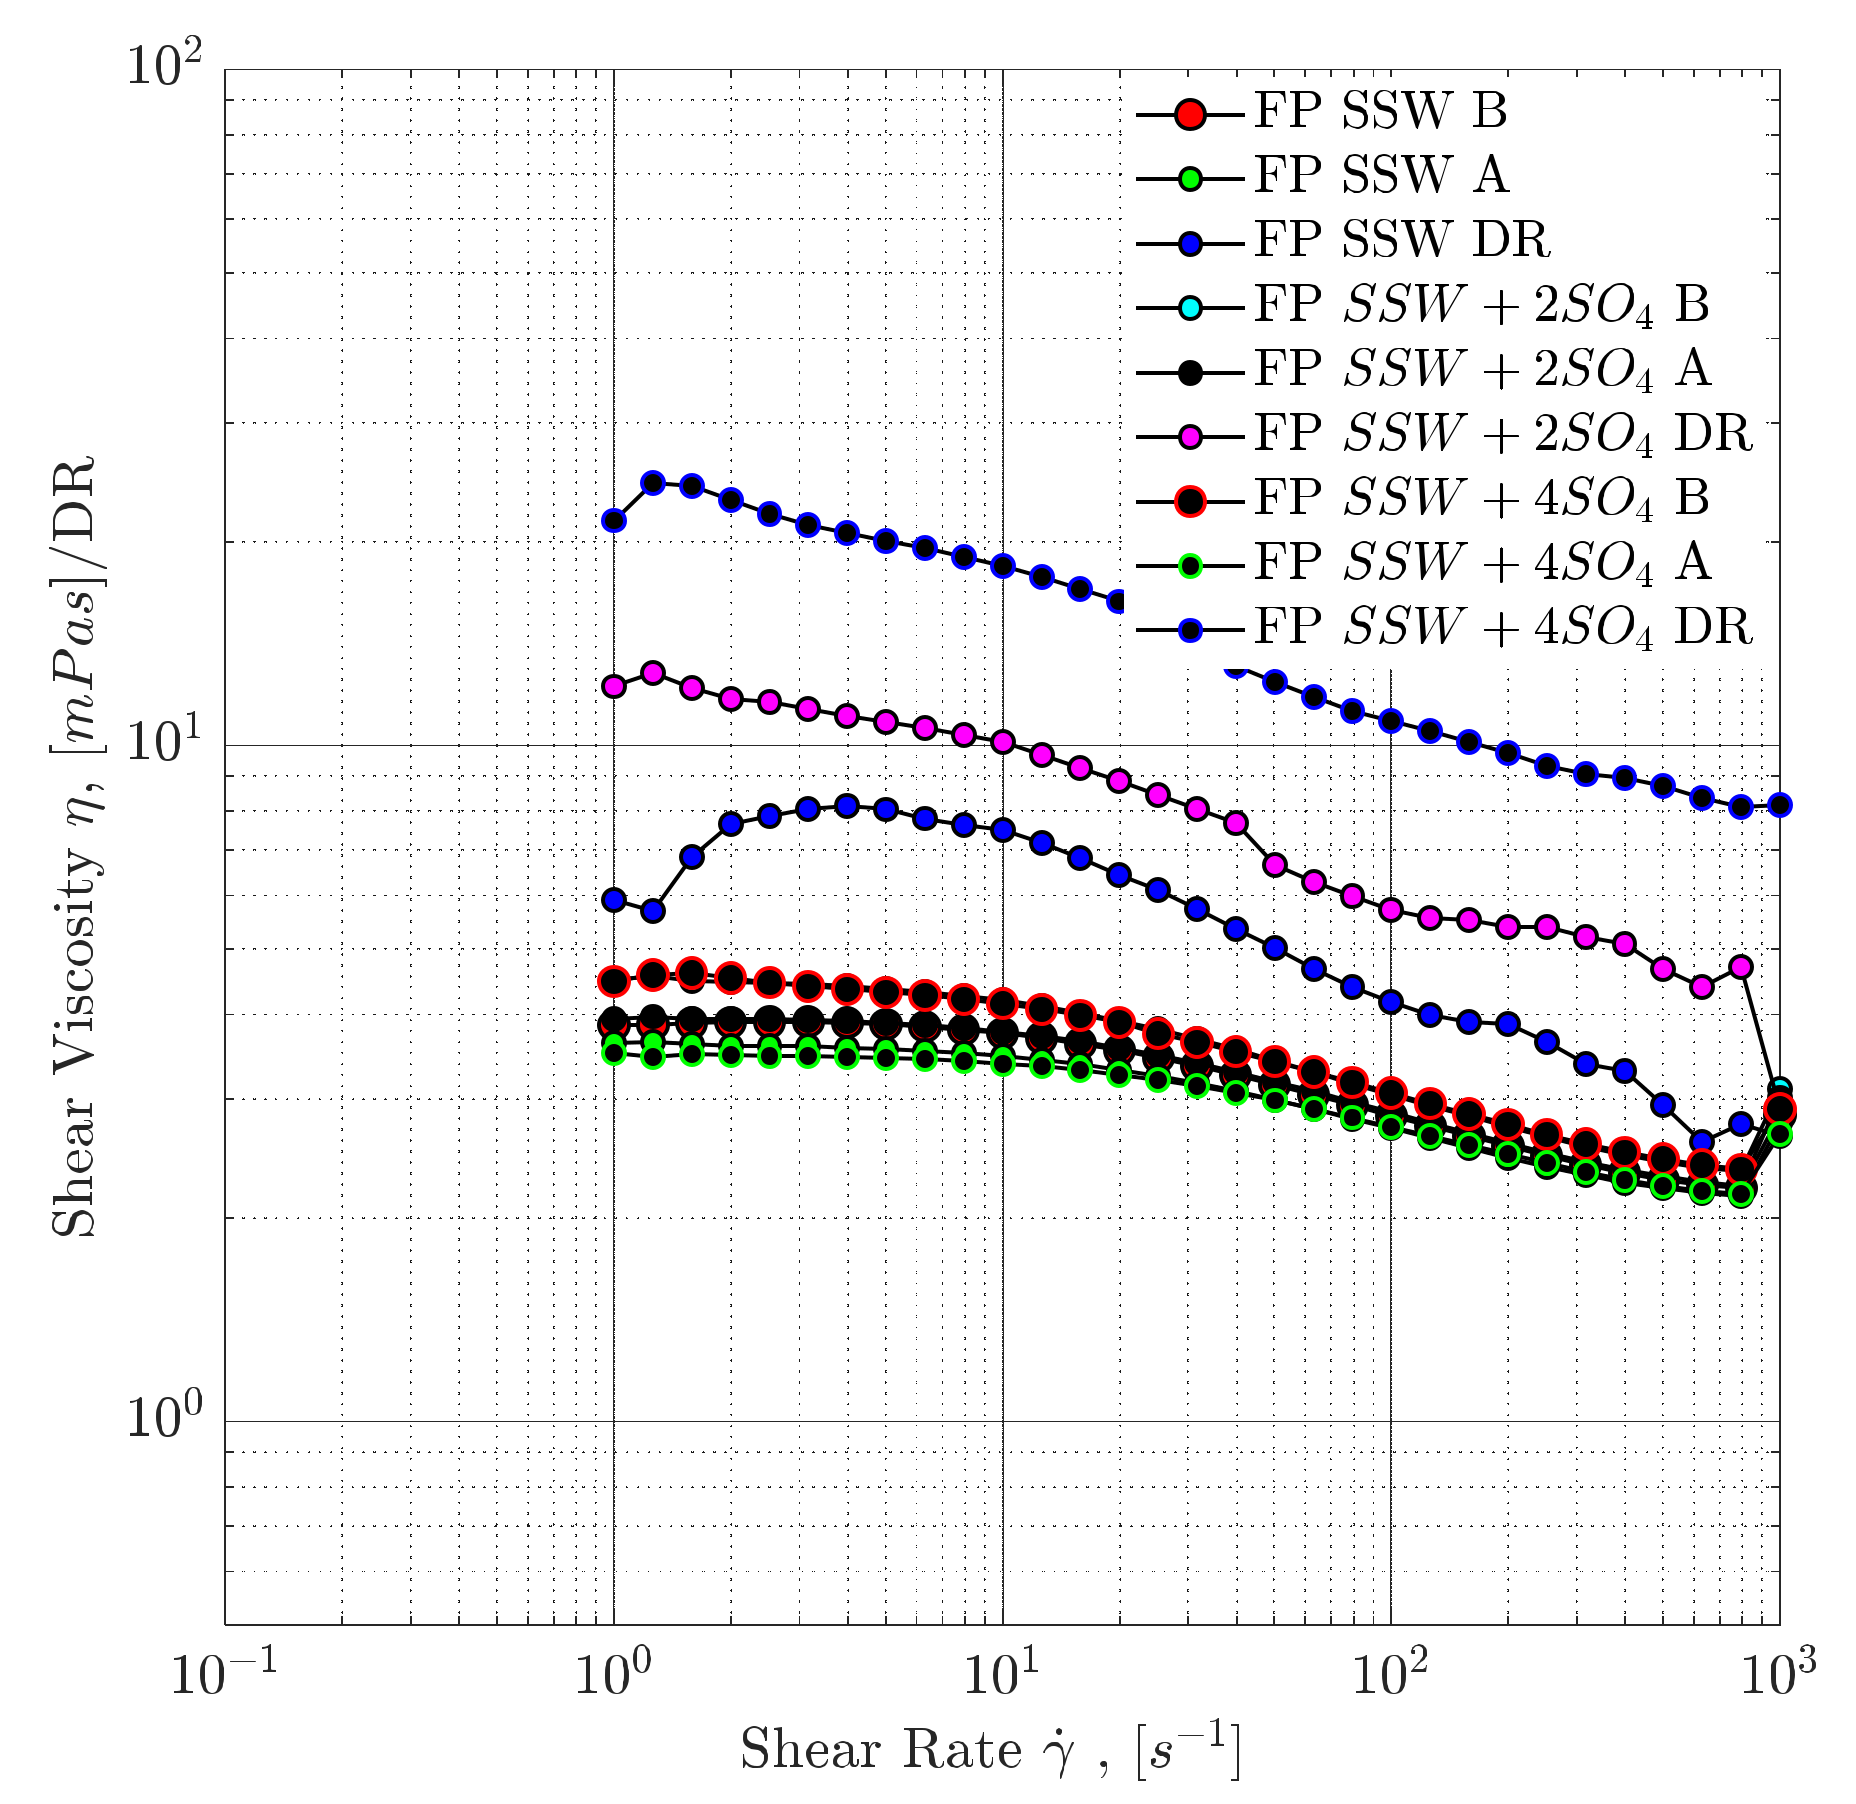
4.3.1. Steady-Shear Rheology (Shear Viscosity)

Figure 10 shows the shear viscosity of polymer solutions (injected in the tertiary mode). The selection criteria for polymer viscosity were described in a previous study [7,8,10]. The main idea is to select a polymer concentration that provides half of the dead oil viscosity (≈4.0 mPa.s at a shear rate of 10 s−1); hence, 750-ppm polymer concentrations were injected in the tertiary mode for the core flooding experiments.

4.3.2. Polymer Degradation and Stability Analysis

Figure 11 depicts the viscosity loss in the polymer solution and hence the degradation rate (according to Equation (2)). Polymer solutions are sensitive to the amount of sulfate added to the brine while designing the modified water. The steady shear viscosity curve shows that the higher the amount of added sulfates, the higher the mechanical degradation observed. Moreover, the highest mechanical degradation, and hence the highest viscosity loss, happens when the polymer solution enters the core. Therefore, two main insights can be drawn here:
  • Mixing polymer solutions in sulfate-modified water may not be an excellent or a promising approach.
  • Mixing polymer solutions in SSW can result in mechanically stable polymer solutions, subsequently affecting economics (utility factor).
The impact of polymer degradation can be clearly seen from Table 9. The polymer prepared in SSW produced higher recovery compared to the polymer prepared in modified water in the tertiary mode. A spiked amount of sulfate made the polymer solution sensitive to mechanical degradation and sweep efficiency in porous media was an issue. This indicates that polymer–SSW flooding after sulfate-modified water injection can produce higher recovery compared to polymer–SSW+2SO4−2. The same polymer sensitivity results with the spiked amount of sulfates were also obtained in previous studies [7,10].

4.4. Core Flood Experiments and Oil Recovery Observations

Table 9 summarize the results obtained for the core flooding experimental workflow defined in Table 6. The recovery factor (RF) indicates strong dependency on the chemical composition of the formation brine, injection brine, and, presumably, the fluid–fluid/rock–fluids interactions, as previously discussed. The remaining oil saturation (ROS) is also included. The most relevant observations from Table 9 can be grouped into these categories: (1) SSW as formation brine and (2) Double SSW as formation brine.

4.4.1. SSW as Formation Brine (Secondary-mode Brine Flooding)

  • Secondary-mode SSW injection (T2 core) resulted in the lowest RF at around 34%. A similar result was obtained under the same flooding conditions in the previous work [10].
  • Injection of chemically modified brines disturbed the ionic equilibrium system inside the core plug. However, the aging of core plugs resulted in the attachment of polar compounds on the rock surface (previously confirmed in this work).
  • Core plug T7 had in the lowest remaining oil saturation (54.31%) after secondary-mode sulfate-modified water injection (SSW as formation brine), as shown in Figure 12. This response is assumed to correlate with improved fluid–fluid interfacial interaction (previously discussed). SSW+2SO4−2 had the highest fluid–fluid interfacial interaction (IFT and IFV measurements), as also reported by Tetteh and Barati [83]. During core flooding, the wettability alteration process is initiated through modified brine, resulting in detachment of the oil from the rock formation. In parallel, in the oleic phase, contact with the injected brine forms an ionic interfacial layer. Presumably, this ionic interfacial layer helps with the continuous flow of oil. This further restricts the oil drop’s reattachment on the rock surface, hence the plugging and entrapment of the oleic phase.
  • Flooding with SSW+4SO4−2 produced the second-highest oil recovery of 38.98%. This significantly lowered the remaining oil saturation compared to SSW brine and SSW-Na injection, which may be associated with improved fluid–fluid interaction. It is believed that the excessive spiked amount of sulfates (4SO4−2) helped to decrease IFT to 2.06 mN/m. Related to the IFT and oil-drop snap-off evaluations, the smallest drop-size detachment was observed, and the improved oil–brine interface reaction helped produce microscale water-in-oil emulsions (or microscale soap formation).
  • The oil recovery results are in line with the results obtained by Mohamed and Alvarado [22]. Maximum oil recovery was obtained by increasing the sulfates in SSW by three and five times. According to the authors, three and five times more sulfate results in the highest interfacial viscoelasticity.
  • It can be seen from experiments Nr. 1 through 4 of Table 9 (Figure 12) that the improved fluid–fluid properties have a dominant role compared to microscale water-in-oil emulsions for higher oil production. Moreover, the amount of sulfate added to designed modified water is a critical parameter that requires attention. Injecting SSW and SSW-0NaCl did not lead to additional oil production due to a lack of active sulfate ions. It is assumed that neither of the brines could disturb the established rock–oil–brine (ROB) ionic equilibrium and hence could not improve oil recovery (weaker fluid–fluid interaction).

4.4.2. Double SSW as Formation Brine (Secondary-mode Brine Flooding)

  • Focusing on the second group of experiments (Nr. 5 through 8 from Table 9), SSW injection produced the lowest recovery of 34.56%, leaving a significant amount of remaining oil saturation (65.44%) in the core.
  • Injecting SSW+4SO4−2 resulted in the highest RF of 51.78% and the lowest remaining oil saturation of 48.22%, as shown in Figure 12. This behavior is in contrast with injecting SSW+2SO4−2 (Nr. 1 through 4 from Table 9), which produced the highest recovery with SSW as formation brine. The same result can be reasonably expected for remaining oil saturation (ROS) with 2*SSW formation brine. However, this did not happen and instead, SSW+4SO4−2 produced the highest recovery. This is associated with the relationship between the chemical composition of injection and formation brines. As the formation brine composition is doubled to 2*SSW, the sulfate amount must be quadrupled in the injection brine. This process is necessary to compensate for the ionic reaction based on fluid–fluid interaction. Therefore SSW+4SO4−2 produced the highest recovery with 2*SSW formation brine.
  • The second-lowest ROS (54.65%) was achieved by injecting SSW-0NaCl brine, as shown in Figure 12. This result is in line with the results reported by Zhang et al. [13]. The higher recovery is believed to be connected to the role of the PDI and non-PDI ions in the system. 2*SSW formation brine was saturated with PDI (Ca+2 and Mg+2 ions) while the injection brine had no non-PDI (Na+1). An additional supporting argument for higher recovery is the reduced TDS. TDS of SSW-0NaCl were less than half that of SSW. Therefore, in this case, the low concentrations of salts could also play a role. It can be claimed that the combined scenario of PDI and non-PDI ions and low salinity played a crucial role in lowering the ROS. However, the ROS obtained in the T1 core plug indicates otherwise, suggesting that the role of low concentrations of salts was negligible. Finally, the activity of PDI and non-PDI ions support the lowered ROS in the T3 core flood.
Summarising the results of secondary-mode injection for both formation brines, it is clear that combined mechanisms of wettability alteration in porous media and improved fluid–fluid interfacial interactions are responsible for the higher oil recovery. Further, the spiked amount of sulfates in injection brine significantly lowered the remaining oil saturation (ROS). In addition, both sets of experiments further explained that the relationship between the amount of sulfates added and oil recovery is not strictly linear. Hence, having an optimum amount of sulfates is an important parameter to achieve the lowest ROS. These experiments also suggest that the chemical relationship between injection brine and formation brine is essential.

4.4.3. Bump Rate: Remaining Oil Saturation

  • The RF bump rate results in Table 9 and Figure 13 indicate the oil produced through the bump rate. Bump-rate injection is performed at a higher rate (more than doubled) than brine flooding, as described earlier. This higher injection rate could cause a higher-pressure differential along the core and cause oil to be trapped due to capillary end effects.
  • Looking at the Figure 13 for oil recovery, the T4 and T1 plugs produced the maximum oil. There is no specific trend regarding the relationship between the bump rate and RF based on the chemical composition of the previously injected brine. The RF obtained for the bump rate provides significant insights into the production of trapped oil due to capillary end effects. A higher recovery (14.95%) from T1 is expected because of the highest ROS (67.98%) after secondary-mode brine flooding. Interestingly, however, T4 also produced significant oil (13.59%). Comparing the RF of the T4 and T5 experiments (secondary mode), the difference becomes significant (10%). It is assumed that some oil is released due to improved fluid–fluid interaction in T4 and could not be recovered due to the strong capillary end effects. However, the bump rate helped to release this trapped oil due to the excessive pressure drop.

4.4.4. Remaining Oil Saturation after Tertiary-mode Polymer Flooding

  • Polymer flooding in the tertiary recovery mode also resulted in a significant reduction in ROS, as shown in Table 9 and Figure 14. As previously mentioned, the objective is to lower ROS due to viscosity support from tertiary-mode flooding. Therefore, the viscosity of the polymer is defined as half that of the oil viscosity so the viscosity value lies between that of the brine and oil. It can be argued that this oil recovery is only due to mobility control of the polymer flood. However, Shaker Shiran and Skauge [65] found that hybrid EOR (combined EOR techniques) flooding results in higher recovery compare to a single EOR technique.
  • Looking at the recovery numbers, polymer flooding after SSW-0NaCl significantly decreased ROS in the T3 core (with 2*SSW as formation brine). The combined effect of (potential determining ions, PDI) ions in the formation fluid and removal of non-PDI ions in the injected fluid released oil from the core surface, but this oil could not be produced even with the bump rate. The changes in viscosity due to the polymer flood made it possible for this detached oil to flow. Therefore, this contributed to lower the ROS to 16.32%. Interestingly enough, polymer flooding after SSW flooding contributed to significant recovery (12.67% and 13.4%), but the reason for this is the higher amount of ROS (in both T2 and T6 plugs). Moreover, comparing the final ROS from T2 and T6, the data depict the highest values among all scenarios. It is likely that polymer flooding produced higher recoveries due to the higher ROS of T2 and T6 plugs. Subsequently, polymer flooding after sulfate-modified water flooding reduced ROS by 9% to 11%, which is significant.

4.4.5. Final Recovery and Remaining Oil Saturation

  • Table 9 and Figure 14 show that the improved fluid–fluid interfacial interaction significantly reduced the ROS (T7 and T5 cores) in both groups of formation brines.
  • Depleted Na+1 in injection brine and a spiked amount of Ca+2 and Mg+2 ions in formation brine also produced significant oil recovery (71.34%). This result is in agreement with the data reported by Zhang et al. [53].
  • According to the final ROS data of the T3 and T5 experiments, the flooding process of T5 (SSW+4SO4−2) is commercially economical. The main reason for this is the brine processing cost of SSW-0NaCl for T3. Na+1 removal from SSW can cost much more compared to the addition of a small amount of sulfate in the injection brine to design the modified water. Economically and technically, the spiked amount of sulfate is a feasible process on a commercial scale.
  • The highest ROS was seen after the injection of SSW in both groups of experiments, as shown in Table 9. As previously described, this is because the injection and formation brines shown in Table 4 have the same hardness value. The modification of SSW to design modified water established a contrast in hardness between injected and formation brine. This process further manipulates the ionic equilibrium in the reservoir system. As seen in Table 4 and Table 9, the lowest ROS values were observed when the hardness contrast between injection and formation brine is significant. To summarize, the combined EOR process worked efficiently, contributing to significant oil recovery.
  • Maximum total oil recovery was observed for the hybrid EOR process of SSW+4SO4−2 and SSW+2SO4−2 injection in the secondary mode and polymer flooding in the tertiary mode (SSW as formation brine). Similarly, in the case of 2*SSW formation brine, the highest total recovery was achieved through a hybrid EOR process comprising injecting SSW+4SO4−2 and SSW-Na in the secondary mode followed by polymer flooding in the tertiary mode. However, SSW-Na preparation is not commercially economical, which further indicates that sulfate-modified brine should be injected in the secondary mode. To sum up, hybrid EOR processes worked efficiently, contributing to significant oil recovery, as found by Shaker Shiran and Skauge [65] and Tahir et al. [7,8,10].

4.4.6. Modified Water Injection in the Post-Tertiary Mode

Table 10 describes the injection of modified water in the post-tertiary mode after SSW injection (core T10). Note that the bump rate, before modified water injection, produced significant oil; this is assumed to eliminate possible capillary end effects. On one hand, sulfate-modified water injection worked well in the tertiary mode contributing to a 9.64% reduction in ROS. In contrast, sulfate-modified water injection in the secondary mode (T4 in Table 9) contributed to 2% increased recovery compared to the combination of SSW in the secondary mode and sulfate-modified water injection in the tertiary mode (Table 10). This comparison leads to the recommendation to adopt sulfate-modified water injection in the secondary mode as the best strategy.

4.4.7. Oil Recovery Profile versus PV Injected

It was challenging to develop the oil production profile over the pore volume injected after the brine breakthrough. Before the breakthrough, both oil and brine phases were stable in the fraction collector due to the continuous one-phase flow. Hence, it was possible to measure oil produced over time. After the breakthrough, oil and brine production overlapped in the calibrated collector. Oil drop movement towards the top and brine movement towards the bottom was observed in the fraction collector due to gravitational differences.
This opposite fluid movement created phase entrapment and a kind of emulsion, as can be seen in Figure 15A. One reason for this could be the oil viscosity, since before the aging process, oil viscosity was measured to be 8.0 mPa.s. However, during the six-week aging period, the evaporation of lighter oil components reduced the oil level. Oil refilling was performed twice during the aging process to keep core plugs inside the oil phase. Therefore, it is expected that lighter components evaporated, leaving behind the heavier components, as shown in Figure 16. Moreover, core flooding was performed at 45 °C and the fraction collector was at room temperature (i.e., 20 °C). It is expected that the combined action of the temperature difference and enriched heavier oil components in the core caused phase entrapment and emulsion development in the fraction collector, as shown in Figure 15A. This problem was solved by providing phase settlement time at a higher temperature (45 °C) for 3 h. After each flooding experiment, the fraction collector was kept in an oven for 3 h, and the volumes of both phases (oil and brine) were measured afterward, as shown in Figure 15B. Unfortunately, this technique could not provide the after-breakthrough produced oil values over time to draw a production profile. Therefore, the final recovery data and pressure response are the outputs of flooding experiments. In spite of that, oil shear viscosity before and after core aging was measured and presented in Figure 16, where such differences appear to be explained by the evaporation of some of the components as mentioned before.

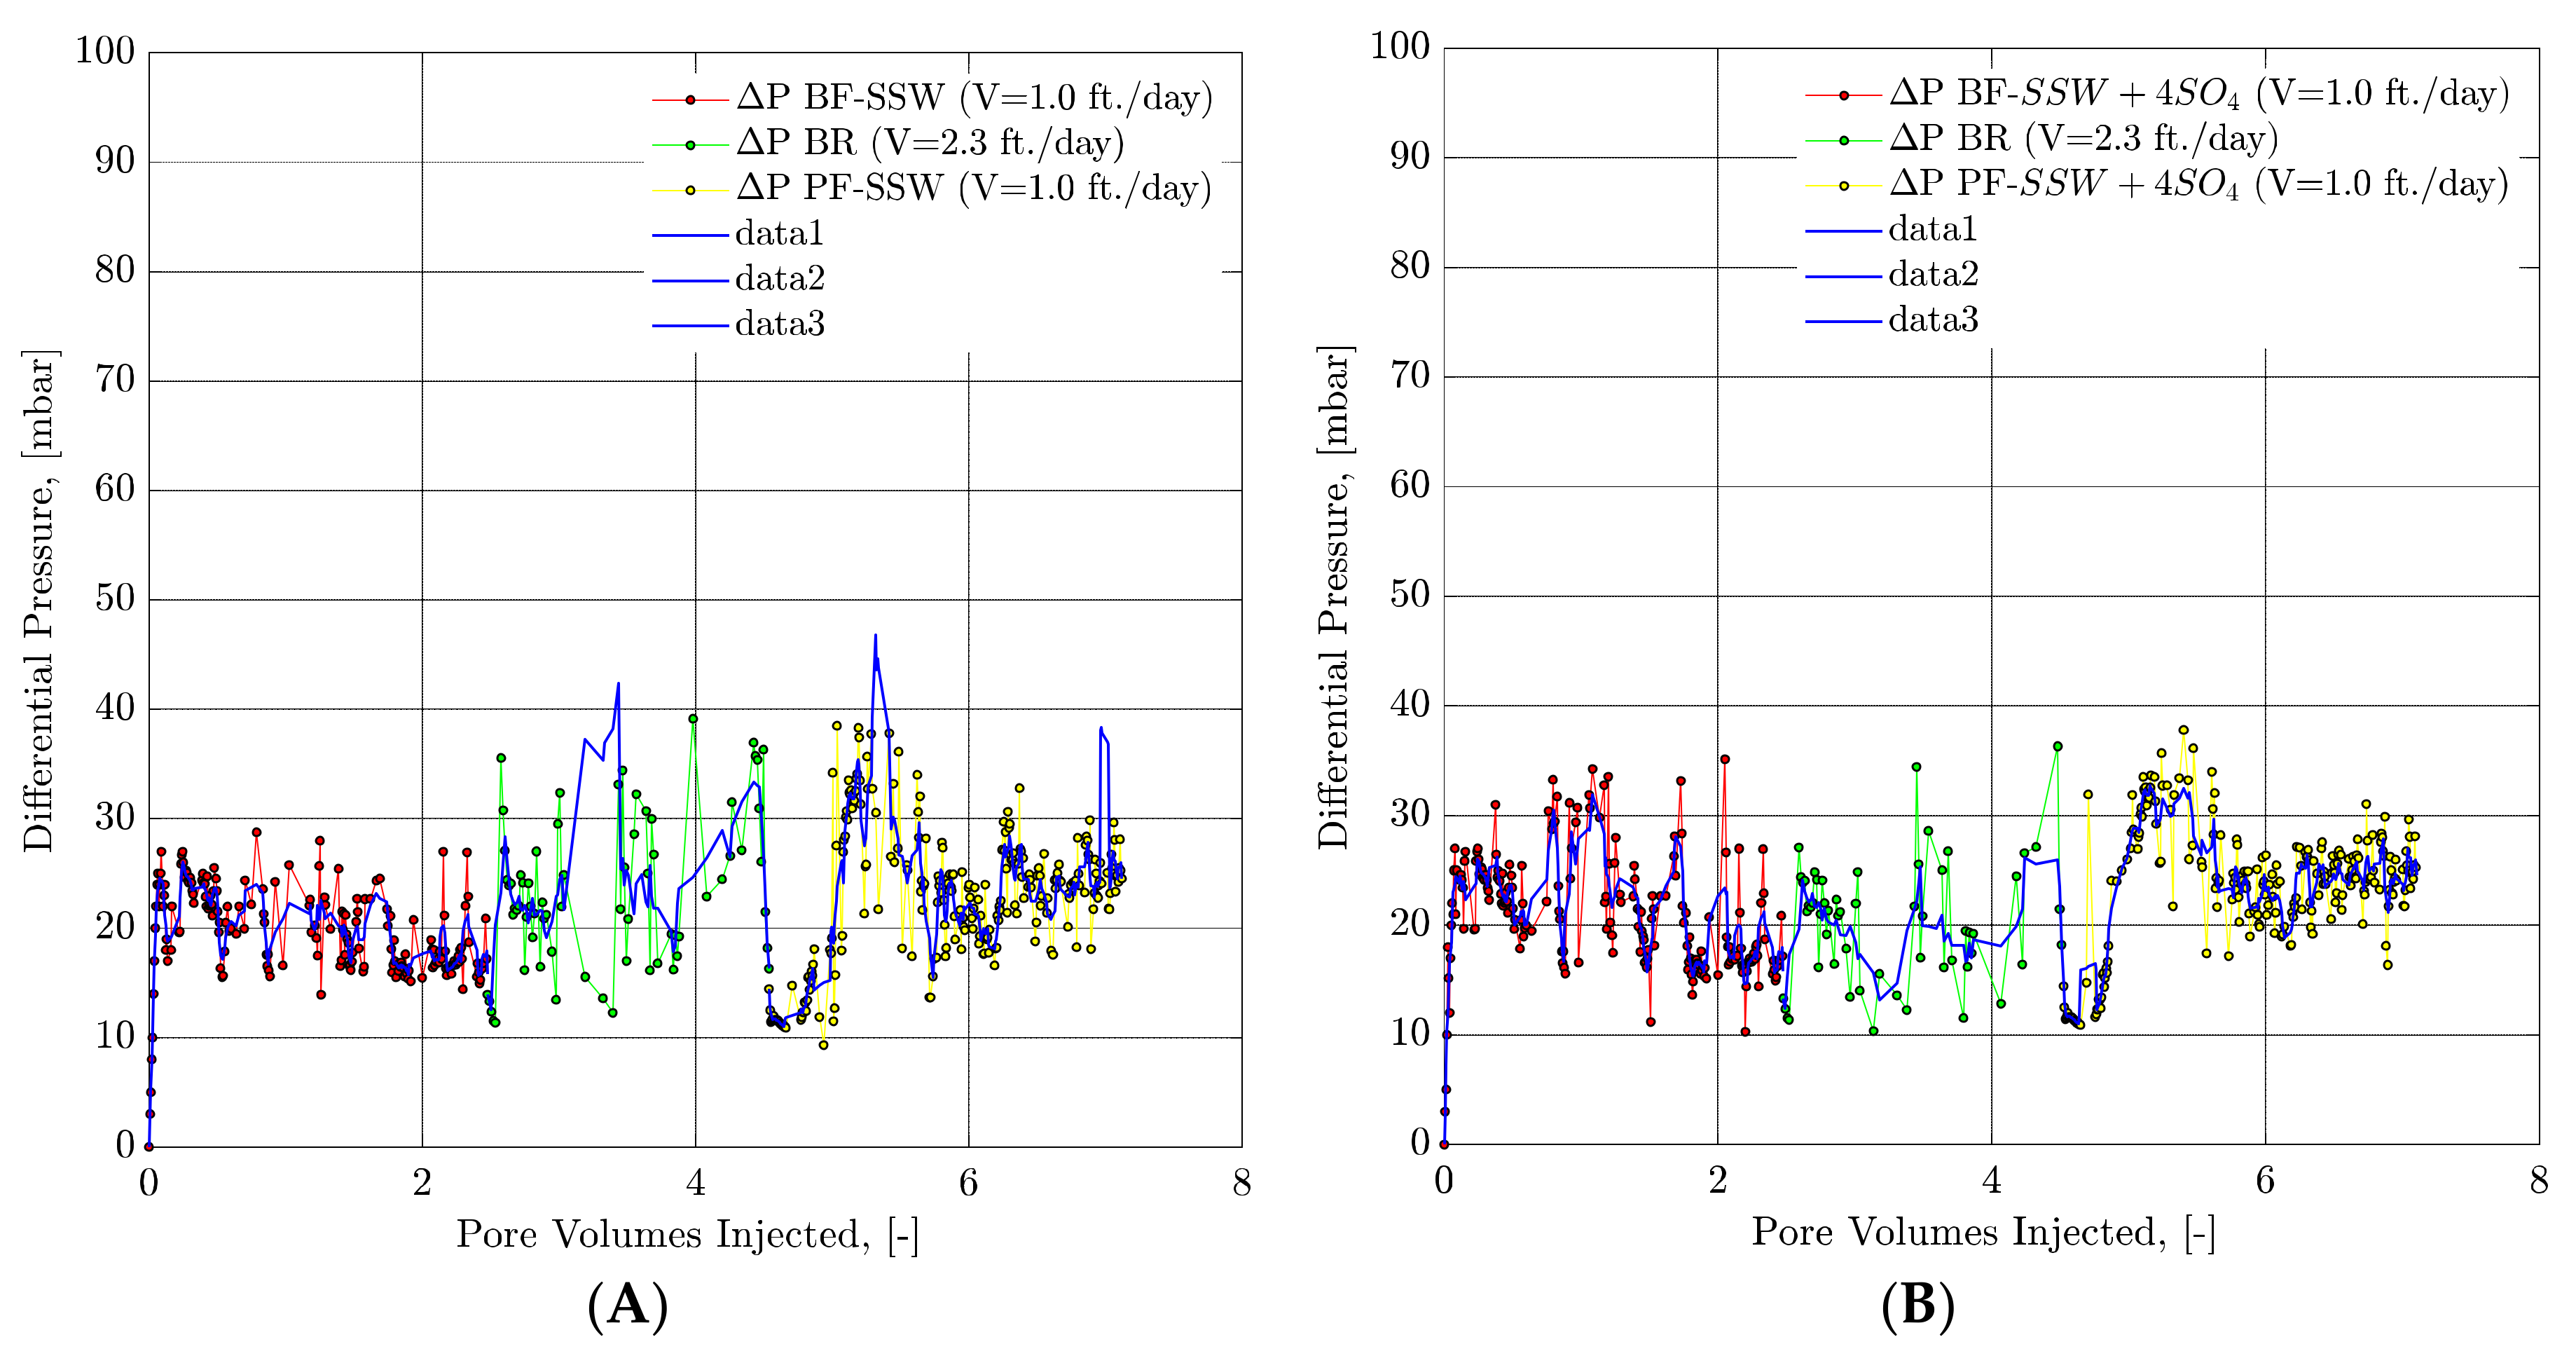
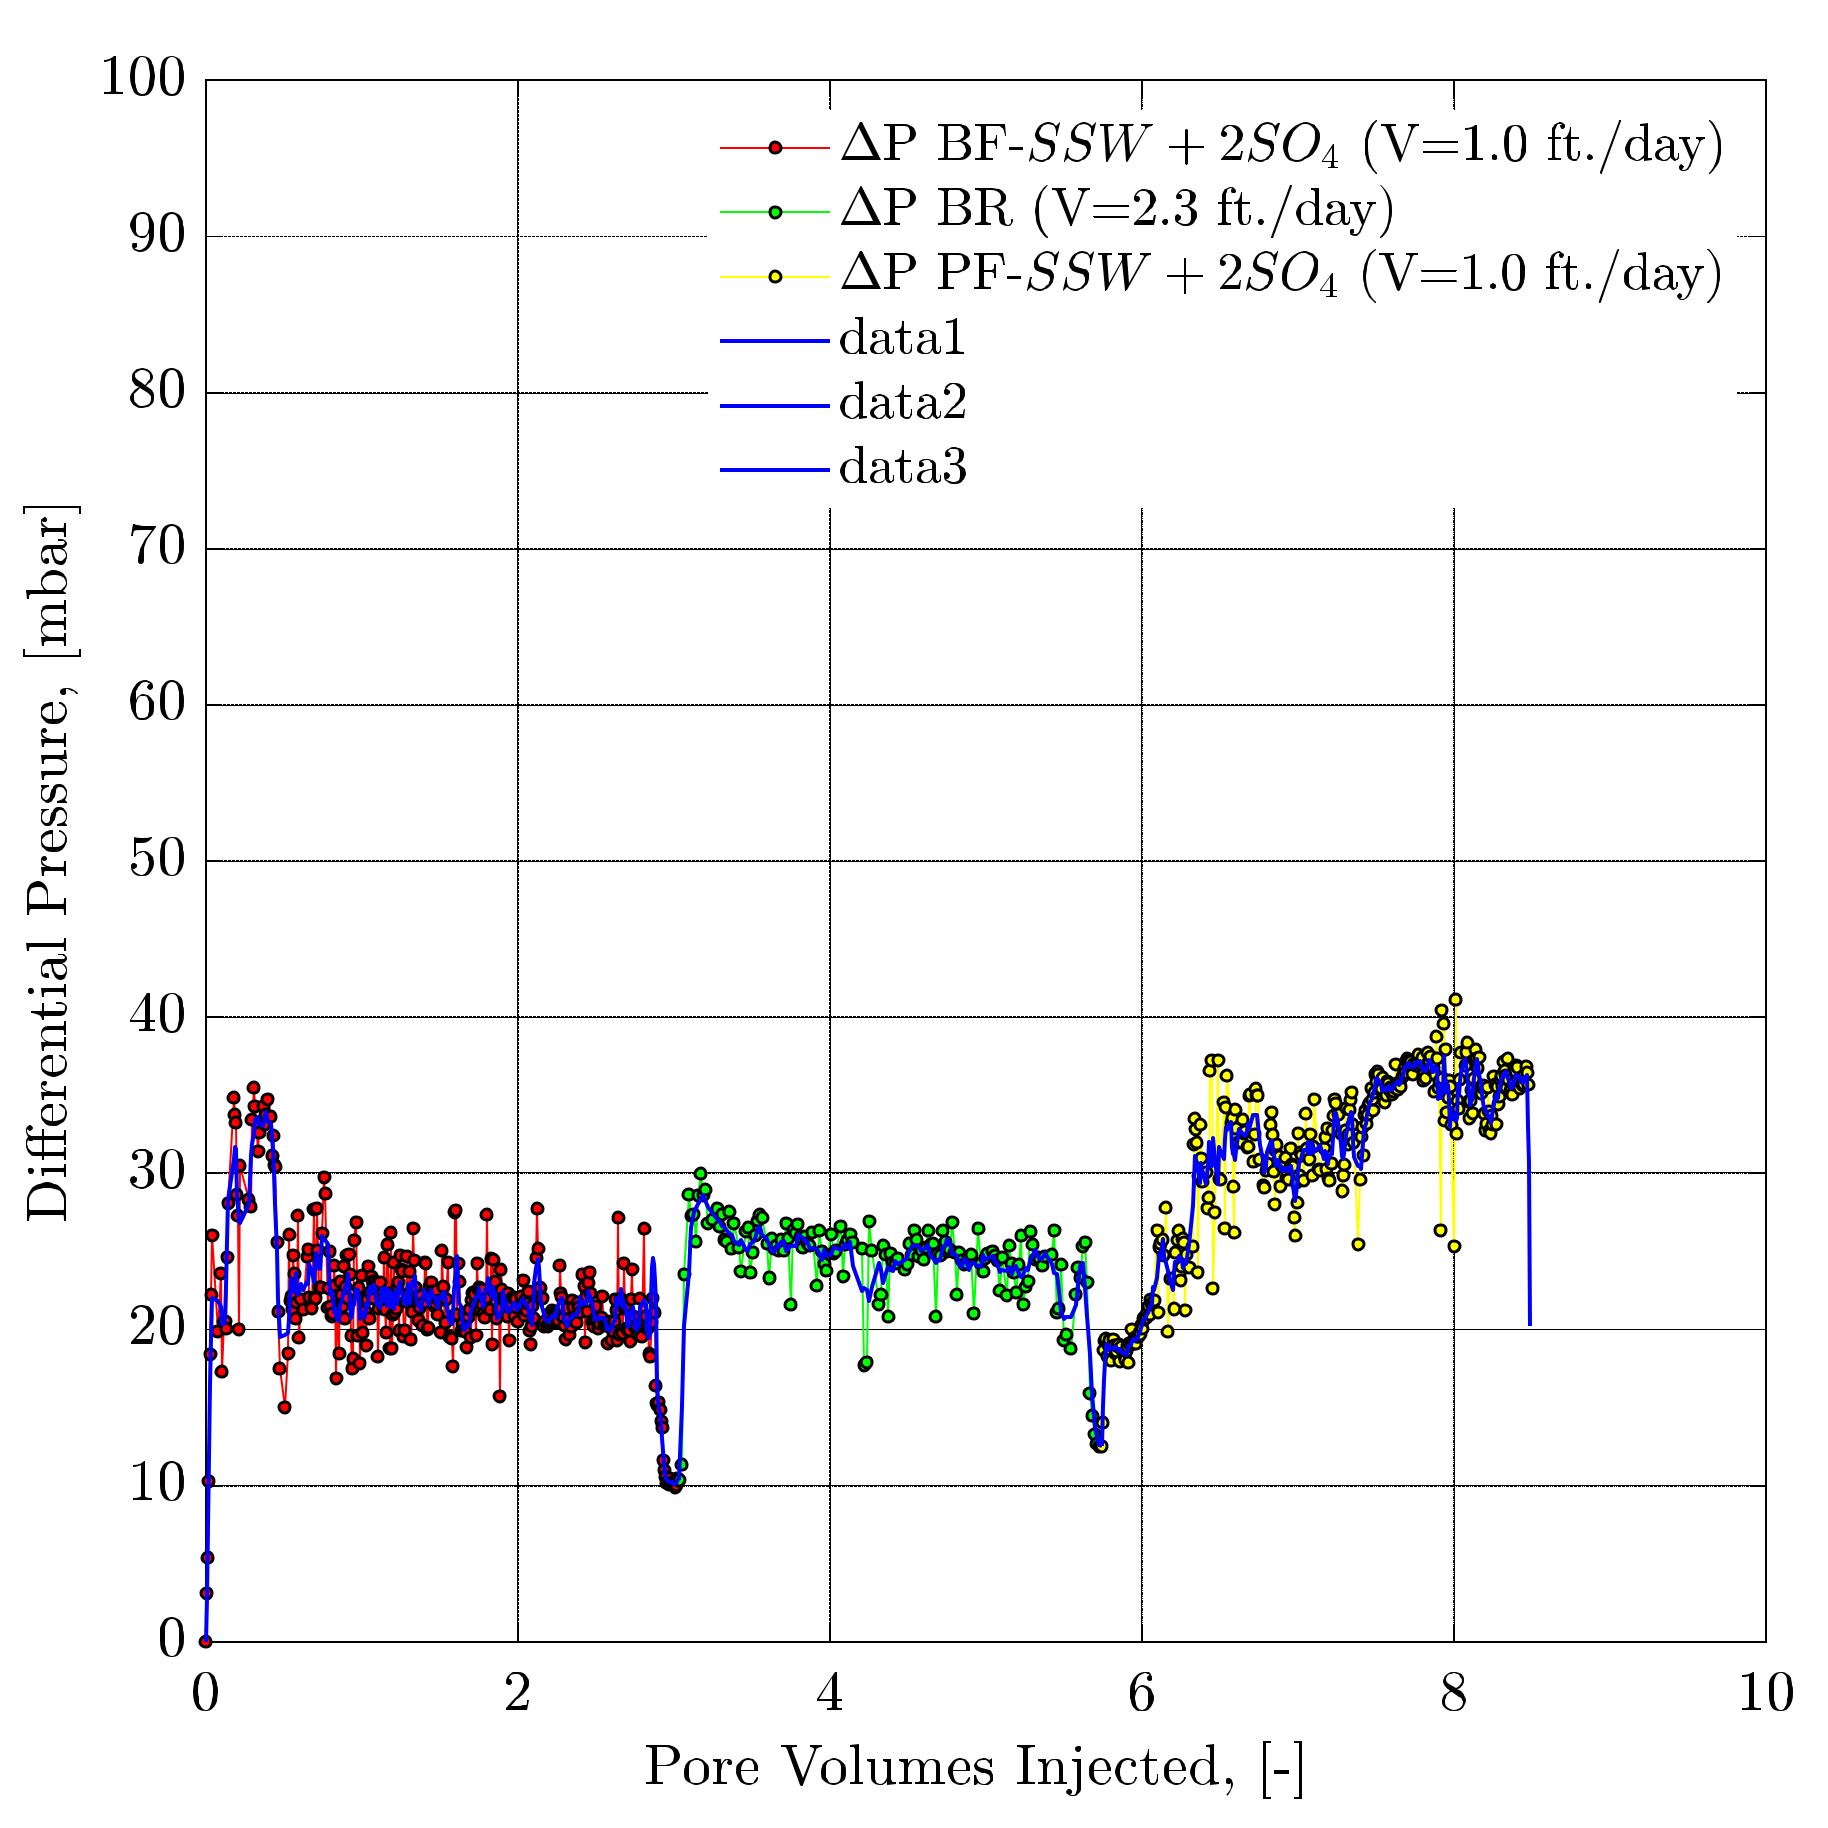
4.4.8. Pressure Response Observations

Figure 17, Figure 18 and Figure 19 represent the pressure response of selected core flooding experiments described in Table 9. Figure 20 describes the pressure behavior of the experiments described in Table 10. As can be seen, the pressure response is nearly the same for both the secondary-mode brine flooding and bump-rate injection. Figure 18B presents an exception of the measured pressure data. A slightly higher but unstable pressure was observed. One explanation could be the presence of small air bubbles in the pipe that connects the pressure sensor (experimental artefact). Overall, pressure trends for all flooding experiments are about the same. A significant increase in pressure was observed for polymer flooding after brine flooding for all experiments, resulting in an increase in pressure until the breakthrough.

5. Conclusions

Based on the experimental investigation and the evaluation of the obtained results, it can be concluded that the proposed sulfate-modified water application helped to reduce remaining oil saturation (ROS) significantly (11.42-17.2% original oil in place).
Combined evaluations of fluid–fluid interfacial interaction measurements lead to the conclusion that a spiked amount of sulfates in the injected brine allowed a stable ionic interfacial layer to develop at the oil–brine interface. This stable layer formed due to the ionic reaction between oil polar compounds and ions in the brines, which turned into fluid–fluid interaction to contribute the additional oil recovery. Later core flood experiments proved that the injection of sulfate-modified water disturbed the established rock–oil–brine (ROB) ionic equilibrium in the reservoir. This disturbance caused detachment of the oil phase from the rock surface, and sulfates developed an interfacial layer at the interface. This improved the fluid interface, helping to produce continuous oil flow and hence reduce the ROS.
Furthermore, it can also be concluded that the chemical compatibility between injection and formation brines is essential to design the modified water. With SSW as formation brine, SSW+2SO4−2 injection resulted in the lowest ROS. With 2*SSW as formation brine, SSW+4SO4−2 injection resulted in the lowest ROS. This relationship is due to ionic interaction between divalent cations in the formation brine and sulfate ions of the injection brine. Moreover, the role of potential determining ions (PDI) (Ca+2 and Mg+2) in the formation brine and removal of non-PDI (Na+1) in the injection brine is also significant in ROS reduction.
Looking at the synergies and benefits of sulfate-modified water with polymer flooding, the lowest ROS was achieved after the secondary mode of modified water and tertiary-mode polymer flooding. Finally, the addition of sulfate when designing sulfate-modified water worked perfectly, resulting in less ROS. However, polymer solutions should not be prepared in modified water. A higher amount of sulfates can make the solutions sensitive to mechanical degradation and hence higher viscosity loss.

Author Contributions

M.T. performed experiments and defined methodology. R.E.H. worked on conceptualization and results validation, L.G. reviewed and performed editing. All authors have read and agreed to the published version of the manuscript.

Funding

This research received no external funding.

Acknowledgments

We acknowledge support by the Open Access Publishing Fund of Clausthal University of Technology.

Conflicts of Interest

The authors declare no conflict of interest.

Abbreviations

APolymer viscosity after injection through core flood pipe-system till core plug
BPolymer viscosity before injection core plug
BFBrine flood
BRBump rate
DRDegradation rate of polymer solutions (%)
IFTInterfacial tension
IFVInterfacial viscoelasticity
PDIPotential determining ions
PFPolymer flood
QInjection rate
ROBRock–oil–brine
ROSRemaining oil saturation
SSWSynthetic sea water
SSW+2SSynthetic sea water doubled with sulfates
SSW+2SSynthetic sea water quadrupled with sulfates
SWModified Water
TDSTotal dissolved solids
FBFormation brine
kgPermeability to gas
KbPermeability to brine

References

  1. Patton, C.C. Water Quality Control and Its Importance in Waterflooding Operations. J. Pet. Technol. 1988, 40, 1123–1126. [Google Scholar] [CrossRef]
  2. Martin, J.C. The Effects of Clay on the Displacement of Heavy Oil by Water. Venez. Annu. Meet. 1959. [Google Scholar] [CrossRef]
  3. Yousef, A.A.; Al-Saleh, S.; Al-Jawfi, M.S. Smart WaterFlooding for Carbonate Reservoirs: Salinity and Role of Ions. In Proceedings of the SPE Middle East Oil and Gas Show and Conference, Manama, Bahrain, 25–28 September 2011. [Google Scholar] [CrossRef]
  4. Nasralla, R.A.; Nasr-El-Din, H.A. Nasr-El-Din, Coreflood Study of Low Salinity Water Injection in Sandstone Reservoirs. In Proceedings of the SPE/DGS Saudi Arabia Section Technical Symposium and Exhibition, Al-Khobar, Saudi Arabia, 15–18 May 2011. [Google Scholar] [CrossRef]
  5. Shiran, B.S.; Skauge, A. Wettability and Oil Recovery by Low Salinity Injection. In Proceedings of the SPE EOR Conference at Oil and Gas West Asia, Muscat, Oman, 16–18 April 2012. [Google Scholar] [CrossRef] [Green Version]
  6. Tahir, M.; Hincapie, R.E.; Foedisch, H.; Strobel, G.-J.; Ganzer, L. Potential Benefits of Fluid Optimization for Combined Smart-Water and Polymer Flooding: Impact on Remaining Oil Saturation. In Proceedings of the SPE Russian Petroleum Technology Conference, Moscow, Russia, 22–24 October 2019. [Google Scholar] [CrossRef]
  7. Tahir, M.; Hincapie, R.E.; Tahir, M. Influence of Sulfate Ions on the Combined Application of Modified Water and Polymer Flooding—Rheology and Oil Recovery. Energies 2020, 13, 2356. [Google Scholar] [CrossRef]
  8. Tahir, M.; Hincapie, R.E.; Gaol, C.L.; Säfken, S.; Ganzer, L. Flow Dynamics of Sulfate-Modified Water/Polymer Flooding in Micromodels with Modified Wettability. Appl. Sci. 2020, 10, 3239. [Google Scholar] [CrossRef]
  9. Suman, Y.K.; Shirif, E.; Ibrahim, H.; Ala-Ktiwi, A. Evaluation of Low Saline “Smart Water” Enhanced Oil Recovery in Light Oil Reservoirs. World J. Eng. Technol. 2014, 2, 13–22. [Google Scholar] [CrossRef]
  10. Tahir, M.; Hincapie, R.E.; Foedisch, H.; Abdullah, H.; Ganzer, L. Impact of Sulphates Presence During Application of Smart Water Flooding Combined with Polymer Flooding. In Proceedings of the SPE Europec featured at 80th EAGE Conference and Exhibition, Copenhagen, Denmark, 11–14 June 2018. [Google Scholar] [CrossRef]
  11. Morrow, N.R.; Valat, M.; Yidliz, H. Effect of Brine Composition on Recovery of an Alaskan Crude Oil by Waterflooding. In Proceedings of the Annual Technical Meeting, Calgary, AB, Canada, 10–12 June1996. [Google Scholar] [CrossRef]
  12. Tang, G.; Morrow, N. Salinity, Temperature, Oil Composition, and Oil Recovery by Waterflooding. SPE Reserv. Eng. 1997, 12, 269–276. [Google Scholar] [CrossRef]
  13. Zhang, P.; Tweheyo, M.T.; Austad, T. Wettability alteration and improved oil recovery by spontaneous imbibition of seawater into chalk: Impact of the potential determining ions Ca2+, Mg2+, and SO42−. Colloids Surf. A Physicochem. Eng. Asp. 2007, 301, 199–208. [Google Scholar] [CrossRef]
  14. Lager, A.; Webb, K.J.; Black, C.J.J.; Singleton, M.; Sorbie, K.S. Low salinity oil recovery—An experimental investigation. Petrophysics 2008, 49, 28–35. [Google Scholar]
  15. Morrow, N.R.; Tang, G.-Q.; Valat, M.; Xie, X. Prospects of improved oil recovery related to wettability and brine composition. J. Pet. Sci. Eng. 1998, 20, 267–276. [Google Scholar] [CrossRef]
  16. Rivet, S.; Lake, L.W.; Pope, G.A. A Coreflood Investigation of Low-Salinity Enhanced Oil Recovery. In Proceedings of the SPE Annual Technical Conference and Exhibition, Florence, Italy, 19–22 September 2010. [Google Scholar] [CrossRef]
  17. Xie, Q.; Ma, D.; Wu, J.; Liu, Q.; Jia, N.; Luo, M. Low Salinity Waterflooding in Low Permeability Sandstone: Coreflood Experiments and Interpretation by Thermodynamics and Simulation. In Proceedings of the SPE Asia Pacific Enhanced Oil Recovery Conference, Kuala Lumpur, 11–13 August 2015. [Google Scholar] [CrossRef]
  18. Winoto, W.; Loahardjo, N.; Xie, S.X.; Yin, P.; Morrow, N.R. Secondary and Tertiary Recovery of Crude Oil from Outcrop and Reservoir Rocks by Low Salinity Waterflooding. In Proceedings of the SPE Improved Oil Recovery Symposium, Tulsa, OK, USA, 14–18 April 2012. [Google Scholar] [CrossRef]
  19. Aghaeifar, Z.; Strand, S.; Puntervold, T.; Austad, T.; Sajjad, F.M. Smart Water injection strategies for optimized EOR in a high temperature offshore oil reservoir. J. Pet. Sci. Eng. 2018, 165, 743–751. [Google Scholar] [CrossRef]
  20. AlGeer, M.A.; Gmira, A.; Al-Enezi, S.M.; Yousef, A.A. A New Insight on the Impact of Individual Ions on Fluid/Fluid Interactions and SmarWater Recovery. In Proceedings of the SPE EOR Conference at Oil and Gas West Asia, Muscat, Oman, 21–23 March 2016. [Google Scholar] [CrossRef]
  21. Zhang, Y.; Xie, X.; Morrow, N.R. Waterflood Performance by Injection of Brine with Different Salinity for Reservoir Cores. In Proceedings of the SPE Annual Technical Conference and Exhibition, Anaheim, CA, USA, 11–14 November 2007. [Google Scholar] [CrossRef]
  22. Mohamed, M.I.; Alvarado, V. Smart Water Flooding in Berea Sandstone at Low Temperature: Is Wettability Alteration the Sole Mechanism at Play? In Proceedings of the SPE Annual Technical Conference and Exhibition, San Antonio, TX, USA, 9–11 October 2017. [Google Scholar] [CrossRef]
  23. Lager, A.; Webb, K.J.; Black, C.J.J. Impact of Brine Chemistry on Oil Recovery. In Proceedings of the IOR 2007 14th European Symposium on Improved Oil Recovery, Cairo, Egypt, 22–24 April 2007; Available online: http://www.earthdoc.org/publication/publicationdetails/?publication=6195 (accessed on 13 November 2007).
  24. Al-Nofli, K.; Pourafshary, P.; Mosavat, N.; Shafiei, A. Effect of Initial Wettability on Performance of Smart Water Flooding in Carbonate Reservoirs—An Experimental Investigation with IOR Implications. Energies 2018, 11, 1394. [Google Scholar] [CrossRef] [Green Version]
  25. Mamonov, A.; Puntervold, T.; Strand, S. EOR by Smart Water Flooding in Sandstone Reservoirs—Effect of Sandstone Mineralogy on Initial Wetting and Oil Recovery. In Proceedings of the SPE Russian Petroleum Technology Conference, Moscow, Russia, 16–18 October 2017. [Google Scholar] [CrossRef]
  26. Bagci, S.; Kok, M.V.; Türksoy, U.; Baǧci, S. Effect of brine composition on oil recovery by waterflooding. Pet. Sci. Technol. 2001, 19, 359–372. [Google Scholar] [CrossRef]
  27. Ligthelm, D.J.; Gronsveld, J.; Hofman, J.; Brussee, N.; Marcelis, F.; van der Linde, H. Novel Waterflooding Strategy By Manipulation Of Injection Brine Composition. In Proceedings of the EUROPEC/EAGE Conference and Exhibition, Amsterdam, The Netherlands, 8–11 June 2009. [Google Scholar] [CrossRef]
  28. Morrow, N.; Buckley, J. Improved Oil Recovery by Low-Salinity Waterflooding. J. Pet. Technol. 2011, 63, 106–112. [Google Scholar] [CrossRef]
  29. Webb, K.J.; Black, C.J.J.; Tjetland, G. A Laboratory Study Investigating Methods for Improving Oil Recovery in Carbonates. In Proceedings of the International Petroleum Technology Conference, Doha, Qatar, 21–23 November 2005. [Google Scholar] [CrossRef]
  30. Moradi, M.; Alvarado, V. Influence of Aqueous-Phase Ionic Strength and Composition on the Dynamics of Water–Crude Oil Interfacial Film Formation. Energy Fuels 2016, 30, 9170–9180. [Google Scholar] [CrossRef]
  31. Horváth-Szabó, G.; Czarnecki, J.; Masliyah, J. Liquid Crystals in Aqueous Solutions of Sodium Naphthenates. J. Colloid Interface Sci. 2001, 236, 233–241. [Google Scholar] [CrossRef] [PubMed]
  32. Havre, T.E.; Sjöblom, J. Emulsion stabilization by means of combined surfactant multilayer (D-phase) and asphaltene particles. Colloids Surf. A Physicochem. Eng. Asp. 2003, 228, 131–142. [Google Scholar] [CrossRef]
  33. Garcia-Olvera, G.; Alvarado, V.; Alvarado, V. Interfacial rheological insights of sulfate-enriched smart-water at low and high-salinity in carbonates. Fuel 2017, 207, 402–412. [Google Scholar] [CrossRef]
  34. Alotaibi, M.B.; Azmy, R.M.; Nasr-El-Din, H.A. Wettability Studies Using Low-Salinity Water in Sandstone Reservoirs. In Proceedings of the Offshore Technology Conference, Houston, TX, USA, 3–6 May 2010. [Google Scholar] [CrossRef]
  35. Czarnecki, J.; Moran, K. On the Stabilization Mechanism of Water-in-Oil Emulsions in Petroleum Systems. Energy Fuels 2005, 19, 2074–2079. [Google Scholar] [CrossRef]
  36. Verruto, V.J.; Kilpatrick, P.K. Water-in-Model Oil Emulsions Studied by Small-Angle Neutron Scattering: Interfacial Film Thickness and Composition. Langmuir 2008, 24, 12807–12822. [Google Scholar] [CrossRef]
  37. Sullivan, A.P.; Zaki, N.N.; Sjöblom, J.; Kilpatrick, P.K. The Stability of Water-in-Crude and Model Oil Emulsions. Can. J. Chem. Eng. 2008, 85, 793–807. [Google Scholar] [CrossRef]
  38. Acevedo, S.; Borges, B.; Quintero, F.; Piscitelly, V.; Gutiérrez, L.B. Asphaltenes and Other Natural Surfactants from Cerro Negro Crude Oil. Stepwise Adsorption at the Water/Toluene Interface: Film Formation and Hydrophobic Effects. Energy Fuels 2005, 19, 1948–1953. [Google Scholar] [CrossRef]
  39. Auflem, I.H.; Westvik, A.; Sjöblom, J. Destabilization of Water-in-Crude Oil Emulsions Based on Recombined Oil Samples at Various Pressures. J. Dispers. Sci. Technol. 2003, 24, 103–112. [Google Scholar] [CrossRef]
  40. Kiran, S.K.; Acosta, E.; Moran, K. Evaluating the hydrophilic–lipophilic nature of asphaltenic oils and naphthenic amphiphiles using microemulsion models. J. Colloid Interface Sci. 2009, 336, 304–313. [Google Scholar] [CrossRef] [PubMed]
  41. Anderson, W.G. Wettability Literature Survey- Part 1: Rock/Oil/Brine Interactions and the Effects of Core Handling on Wettability. J. Pet. Technol. 1986, 38, 1125–1144. [Google Scholar] [CrossRef]
  42. Al-Saedi, H.N.; Flori, R.E.; Al-Jaberi, S.K. Eliminate the role of clay in sandstone: EOR low salinity water flooding. J. Pet. Explor. Prod. Technol. 2018, 9, 1475–1483. [Google Scholar] [CrossRef] [Green Version]
  43. Alvarado, V.; Wang, X.; Moradi, M. Role of Acid Components and Asphaltenes in Wyoming Water-in-Crude Oil Emulsions. Energy Fuels 2011, 25, 4606–4613. [Google Scholar] [CrossRef]
  44. Alvarado, V.; Garcia-Olvera, G.; Manrique, E.J. Considerations of Adjusted Brine Chemistry for Waterflooding in Offshore Environments. OTC Bras. 2015. [Google Scholar] [CrossRef]
  45. Tahir, M.; Hincapie, R.E.; Langanke, N.; Ganzer, L.; Jaeger, P. Coupling Microfluidics Data with Core Flooding Experiments to Understand Sulfonated/Polymer Water Injection. Polymer 2020, 12, 1227. [Google Scholar] [CrossRef]
  46. Moustafa, E.-A.A.; Shedid, S.A. Effects of magnesium and potassium sulfates on oil recovery by water flooding. Egypt. J. Pet. 2018, 27, 649–656. [Google Scholar] [CrossRef]
  47. Morin, B.; Oakey, J.; Liu, Y.; Alvarado, V. A microfluidic flow focusing platform to screen the evolution of crude oil–brine interfacial elasticity. Lab. Chip. 2016, 16, 3074–3081. [Google Scholar] [CrossRef]
  48. Bidhendi, M.M.; Garcia-Olvera, G.; Morin, B.; Oakey, J.; Alvarado, V. Interfacial Viscoelasticity of Crude Oil/Brine: An Alternative Enhanced-Oil-Recovery Mechanism in Smart Waterflooding. SPE J. 2018, 23, 0803–0818. [Google Scholar] [CrossRef]
  49. Garcia-Olvera, G.; Alvarado, V. The Potential of Sulfate as Optimizer of Crude Oil-Water Interfacial Rheology to Increase Oil Recovery during Smart Water Injection in Carbonates. In Proceedings of the SPE Improved Oil Recovery Conference, Tulsa, OK, USA, 11–13 April 2016. [Google Scholar] [CrossRef]
  50. Ayirala, S.C.; AlYousef, A.A.; Li, Z.; Xu, Z. Water Ion Interactions at Crude Oil-Water Interface: A New Fundamental Understanding on SmartWater Flood. In Proceedings of the SPE Middle East Oil & Gas Show and Conference, Manama, Bahrain, 6–9 March 2017. [Google Scholar] [CrossRef]
  51. Reza, R. The Effect of Seawater on the Interfacial Tension: Smart Water Flooding. Available online: https://www.academia.edu/25203560/The_Effect_of_Seawater_on_the_Interfacial_Tension_Smart_Water_Flooding (accessed on 15 April 2020).
  52. Fathi, S.J.; Austad, T.; Strand, S. Water-Based Enhanced Oil Recovery (EOR) by “Smart Water”: Optimal Ionic Composition for EOR in Carbonates. Energy Fuels 2011, 25, 5173–5179. [Google Scholar] [CrossRef] [Green Version]
  53. Zhang, Y.; Morrow, N.R. Comparison of Secondary and Tertiary Recovery with Change in Injection Brine Composition for Crude-Oil/Sandstone Combinations. In Proceedings of the SPE/DOE Symposium on Improved Oil Recovery, Tulsa, OK, USA, 22–26 April 2006. [Google Scholar] [CrossRef]
  54. Yuan, M. Effect of Temperature on Barium Sulfate Scale Inhibition of Diethylene Triamine Penta (Methylene Phosphonic Acid). In Advances in Crystal Growth Inhibition Technologies; Springer: Boston, MA, USA, 2002; pp. 151–163. [Google Scholar]
  55. Bin Merdhah, A.B.; Yassin, A.A.M. Laboratory Study and Prediction of Calcium Sulphate at High-Salinity Formation Water. Open Pet. Eng. J. 2008, 1, 62–73. Available online: https://benthamopen.com/ABSTRACT/TOPEJ-1-62 (accessed on 14 November 2017). [CrossRef] [Green Version]
  56. Andersen, K.I.; Halvorsen, E.; Sælensminde, T.; Østbye, N.O. Water Management in a Closed Loop - Problems and Solutions at Brage Field. In Proceedings of the SPE European Petroleum Conference, Paris, France, 24–25 October 2000. [Google Scholar] [CrossRef]
  57. Ghosh, B.; Sun, L.; Osisanya, S. Smart-Water EOR Made Smarter A Laboratory Development. In Proceedings of the International Petroleum Technology Conference, Bangkok, Thailand, 14–16 November 2016. [Google Scholar] [CrossRef]
  58. Graham, G.M.; Boak, L.S.; Hobden, C.M. Examination of the Effect of Generically Different Scale Inhibitor Species (PPCA and DETPMP) on the Adherence and Growth of Barium Sulphate Scale on Metal Surfaces. In Proceedings of the International Symposium on Oilfield Scale, Aberdeen, UK, 30–31 January 2001. [Google Scholar] [CrossRef]
  59. Al-Qattan, A.; Sanaseeri, A.; Al-Saleh, Z.; Singh, B.; Al-Kaaoud, H.; Delshad, M.; Hernandez, R.; Winoto, W.; Badham, S.; Bouma, C.; et al. Low Salinity Waterflood and Low Salinity Polymer Injection in the Wara Reservoir of the Greater Burgan Field. In Proceedings of the SPE EOR Conference at Oil and Gas West Asia, Muscat, Oman, 26–28 March 2018. [Google Scholar] [CrossRef]
  60. Pourafshary, P.; Moradpour, N. Hybrid EOR Methods Utilizing Low-Salinity Water. Enhanc. Oil Recover. Process. New Technol. 2019. [Google Scholar] [CrossRef] [Green Version]
  61. Wang, D.; Hao, Y.; Delamaide, E.; Ye, Z.; Ha, S.; Jiang, X. Results of Two Polymer Flooding Pilots in the Central Area of Daqing Oil Field. In Proceedings of the SPE Annual Technical Conference and Exhibition, Houston, Texas, 3–6 October 1993. [Google Scholar] [CrossRef]
  62. Kleinitz, W.; Littmann, W. Polymer Flooding: Appraisal of Four Different Field Projects in Germany. In Proceedings of the IOR 1995 8th European Symposium on Improved Oil Recovery, Vienna, Austria, 15–17 May 1995; p. cp-107-00054. [Google Scholar] [CrossRef]
  63. Koning, E.J.L.; Mentzer, E.; Heemskerk, J. Evaluation of a Pilot Polymer Flood in the Marmul Field, Oman. In Proceedings of the SPE Annual Technical Conference and Exhibition, Houston, TX, USA, 2–5 October 1988. [Google Scholar] [CrossRef]
  64. Algharaib, M.; Alajmi, A.; Gharbi, R. Improving polymer flood performance in high salinity reservoirs. J. Pet. Sci. Eng. 2014, 115, 17–23. [Google Scholar] [CrossRef]
  65. Shiran, B.S.; Skauge, A. Enhanced Oil Recovery (EOR) by Combined Low Salinity Water/Polymer Flooding. Energy Fuels 2013, 27, 1223–1235. [Google Scholar] [CrossRef]
  66. Torrijos, I.D.P.; Puntervold, T.; Strand, S.; Austad, T.; Bleivik, T.H.; Abdullah, H.I. An experimental study of the low salinity Smart Water - Polymer hybrid EOR effect in sandstone material. J. Pet. Sci. Eng. 2018, 164, 219–229. [Google Scholar] [CrossRef]
  67. AlSofi, A.M.; Wang, J.; AlBoqmi, A.M.; AlOtaibi, M.B.; Ayirala, S.C.; AlYousef, A.A. SmartWater Synergy with Chemical EOR for a Slightly Viscous Arabian Heavy Reservoir. In Proceedings of the SPE Heavy Oil Conference and Exhibition, Kuwait City, Kuwait, 6–8 December 2016. [Google Scholar] [CrossRef]
  68. Santo, A.; Muggeridge, A. An Investigation into the Benefits of Combined Polymer-Low Salinity Waterflooding. In Proceedings of the SPE Asia Pacific Oil and Gas Conference and Exhibition, Brisbane, Australia, 23–25 October 2018. [Google Scholar] [CrossRef]
  69. Mohammadi, H.; Jerauld, G. Mechanistic Modeling of the Benefit of Combining Polymer with Low Salinity Water for Enhanced Oil Recovery. In Proceedings of the SPE Improved Oil Recovery Symposium, Tulsa, OK, USA, 14–18 April 2012. [Google Scholar] [CrossRef]
  70. Tabary, R.; Douarche, F.; Bazin, B.; Lemouzy, P.M.; Moreau, P.; Morvan, M. Design of a Surfactant/Polymer Process in a Hard Brine Context: A Case Study Applied to Bramberge Reservoir. In Proceedings of the SPE EOR Conference at Oil and Gas West Asia, Muscat, Oman, 16–18 April 2012. [Google Scholar] [CrossRef]
  71. Tay, A.; Oukhemanou, F.; Wartenberg, N.; Moreau, P.; Guillon, V.; Delbos, A.; Tabary, R. Adsorption Inhibitors: A New Route to Mitigate Adsorption in Chemical Enhanced Oil Recovery. In Proceedings of the SPE Asia Pacific Enhanced Oil Recovery Conference, Kuala Lumpur, Malaysia, 11–13 August 2015. [Google Scholar] [CrossRef]
  72. Hincapie, R.E.; Duffy, J.; O’Grady, C.; Ganzer, L. An Approach to Determine Polymer Viscoelasticity under Flow through Porous Media by Combining Complementary Rheological Techniques. In Proceedings of the SPE Asia Pacific Enhanced Oil Recovery Conference, Kuala Lumpur, Malaysia, 11–13 August 2015. [Google Scholar] [CrossRef]
  73. Hincapie, R.E. Pore-Scale Investigation of the Viscoelastic Phenomenon during Enhanced Oil Recovery (EOR) Polymer Flooding through Porous Media; Papierflieger: Clausthal-Zellerfeld, Germany, 2016. [Google Scholar]
  74. Tahir, M.; Hincapie, R.E.; Be, M.; Ganzer, L. Experimental Evaluation of Polymer Viscoelasticity during Flow in Porous Media: Elongational and Shear Analysis. In Proceedings of the SPE Europec featured at 79th EAGE Conference and Exhibition, Paris, France, 12–15 June 2017. [Google Scholar] [CrossRef]
  75. Tahir, M.; Hincapie, R.E. Coexistence of Shear and Elongational Components of Flow Paths through Porous Media during Polymer-Flooding Applications. In Proceedings of the 77th EAGE Conference and Exhibition, Madrid, Spain, 1–4 June 2015. [Google Scholar]
  76. Be, M.; Hincapie, R.E.; Rock, A.; Gaol, C.L.; Tahir, M.; Ganzer, L. Comprehensive Evaluation of the EOR Polymer Viscoelastic Phenomenon at Low Reynolds Number. In Proceedings of the SPE Europec featured at 79th EAGE Conference and Exhibition, Paris, France, 12–15 June 2017. [Google Scholar] [CrossRef]
  77. Tahir, M.; Hincapie, R.E.; Be, M.; Ganzer, L. A Comprehensive Combination of Apparent and Shear Viscoelastic Data during Polymer Flooding for EOR Evaluations. World J. Eng. Technol. 2017, 5, 585–600. [Google Scholar] [CrossRef] [Green Version]
  78. Al-Saedi, H.; Flori, R.E.; Mortadha, A. Investigation of Smart Water Flooding in Sandstone Reservoirs: Experimental and Simulation Study Part 2. In Proceedings of the Abu Dhabi International Petroleum Exhibition & Conference, Abu Dhabi, UAE, 12–15 November 2018. [Google Scholar] [CrossRef]
  79. Skauge, T.; Djurhuus, K.; Reichenbach-Klinke, R. Visualization of Heavy Oil Mobilization by Associative Polymer. In Proceedings of the SPE Europec featured at 80th EAGE Conference and Exhibition, Copenhagen, Denmark, 11–14 June 2018. [Google Scholar] [CrossRef]
  80. Bowen, R.L. Chemical Engineering, 68th ed.; Elsevier: Amsterdam, The Netherlands, 1961; pp. 119–122. [Google Scholar]
  81. Vermolen, E.; Van Haasterecht, M.J.; Masalmeh, S.K.; Faber, M.J.; Boersma, D.M.; Gruenenfelder, M.A. Pushing the envelope for polymer flooding towards high-temperature and high-salinity reservoirs with polyacrylamide based ter-polymers. In Proceedings of the SPE Middle East Oil and Gas Show and Conference, Manama, Bahrain, 25–28 September 2011. [Google Scholar] [CrossRef]
  82. Elhajjaji, R.R.; Hincapie, R.E.; Tahir, M.; Rock, A.; Wegner, J.; Ganzer, L. Systematic Study of Viscoelastic Properties During Polymer-Surfactant Flooding in Porous Media (Russian). In Proceedings of the SPE Russian Petroleum Technology Conference and Exhibition, Moscow, Russia, 24–26 October 2016. [Google Scholar] [CrossRef]
  83. Tetteh, J.T.; Barati, R. Crude-Oil/Brine Interaction as a Recovery Mechanism for Low-Salinity Waterflooding of Carbonate Reservoirs. SPE Reserv. Eval. Eng. 2019, 22, 877–896. [Google Scholar] [CrossRef]
Figure 1. Wettability alteration mechanism of SO4−2 in sandstone. (A) Refers to oil-wet and (B) refers to water-wet condition of reservoir [8].
Energies 13 03049 g001
Figure 2. Descriptive flow chart of materials and methods.
Energies 13 03049 g002
Figure 3. Sketch of core flood experimental setup.
Energies 13 03049 g003
Figure 4. Contact angle between synthetic seawater (SSW) saturated core plug and oil drop at 0 min (left side) and after 60 min (right side). Top images are obtained from in-situ device and bottom Images represent the Pendant drop method contact-angle measurement.
Energies 13 03049 g004
Figure 5. Contact-angle measurement between oil-saturated, six-week aged core plug and oil drop at 0 min (left side) and after 60 min (right side). Top images are obtained from in-situ device and bottom images represent the pendant drop method contact-angle measurement.
Energies 13 03049 g005
Figure 6. Ionic activity of sodium and sulfate ions to develop small and large drops, respectively. (A) refers to attractive forces between opposite charges at fluids interface and (B) refers to repulsive forces at fluids interface.
Energies 13 03049 g006
Figure 7. Oil drop volume increased until the snap-off point in SSW brine (fluid interfacial interactions).
Energies 13 03049 g007
Figure 8. Oil drop volume increased until the snap-off point in SSW+4SO4−2 brine (fluid interfacial interactions).
Energies 13 03049 g008
Figure 9. Oil drop volume increased until the snap-off point in SSW+2SO4−2 brine (fluid interfacial interactions).
Energies 13 03049 g009
Figure 10. Steady shear viscosity of polymer solutions at a temperature of 45 °C. Polymer solutions are prepared in three injection brines.
Energies 13 03049 g010
Figure 11. Viscosity loss and mechanical degradation of polymer solutions through stainless steel pipe before entering the core plug. B represents the fresh solution, and A represents the degraded solution through stainless steel pipe connections.
Energies 13 03049 g011
Figure 12. Oil recovery factors from secondary mode brine flooding. 2*SSW and SSW represent the formation brines.
Energies 13 03049 g012
Figure 13. Oil recovery factors after secondary mode brine flooding and bump rate. 2*SSW and SSW represent the formation brines.
Energies 13 03049 g013
Figure 14. Graphical overview of oil recovery and remaining oil saturation demonstrated in Table 6.
Energies 13 03049 g014
Figure 15. Oil produced after the brine flooding in the secondary mode. Phase entrapment during core flooding (A) and the same fluids after phase settlement in an oven (B).
Energies 13 03049 g015
Figure 16. Oil viscosity before and after aging process at 45 °C.
Energies 13 03049 g016
Figure 17. Pressure drop versus PV (pore volume) injected for T6 core plug (A) and T5 core plug (B). Red color represents the experimental data for secondary mode injection of brine flood, green color shows the experimental data for bump rate while yellow color is for the tertiary mode injection of polymer flood. Blue line represents the data smoothening function. 2*SSW is the formation brine.
Energies 13 03049 g017
Figure 18. Pressure drop versus PV injected for T8 core plug (A) and T1 core plug (B). Red color represents the experimental data for secondary mode injection of brine flood, green color shows the experimental data for bump rate while yellow color is for the tertiary mode injection of polymer flood. Blue line represents the data smoothening function. SSW is the formation brine.
Energies 13 03049 g018
Figure 19. Pressure drop versus PV injected for T7 core plug. Red color represents the experimental data for secondary mode injection of brine flood, green color shows the experimental data for bump rate while yellow color is for the tertiary mode injection of polymer flood. Blue line represents the data smoothening function. SSW is the formation brine.
Energies 13 03049 g019
Figure 20. Pressure drop versus PV injected for T10 core plug. Cyan color represents the experimental data for secondary mode injection of brine flood, yellow color shows the experimental data for bump rate while red color is for the tertiary mode injection of smart mode injection of modified water (SSW+2SO4−2) and green color for quaternary mode polymer flood. Blue line represents the data smoothening function. SSW is the formation brine.
Energies 13 03049 g020
Table 1. Recovery mechanisms found in the literature for low-salt brine/modified water injection.
No.MechanismsApproach/EvaluationFormationActive SaltsRef.
1Wettability alterationCore flooding, IFTSandstone and CarbonatesLow-salt brine[33]
2Fine migration, Wettability alterationIFT, Core floodingSandstone and CarbonatesLow-salt brine[34]
3Transition stateSand adhesion tests for 3-pH rangesQuartz SandsNaCl, CaCl2[35]
4Wettability alterationSand-pack floodingSand-packDecreasing NaCl[9]
5Wettability alterationSpontaneous imbibition, Core floodingSandstoneLow-salt brine[5]
6IFT, Wettability alteration, MIECore flooding, SimulationSandstoneLow-salt brine[36]
7Double layer expansionContact angle, Core floodingSandstoneLow-salt brine[37]
8COBRCore floodingSandstoneLow-salt brine[38]
9Wettability alteration, Pore pluggingCore floodingSandstoneLow-salt brine[39]
10Wettability alteration, PH-valueCore flooding, Sand-pack, Crushed sandSandstoneLow-salt brine[25]
11Wettability alterationCore floodingSandstoneSoftened Formation brine (Ca. Mg)[40]
12IFTIFTVariousCa, SO4[41]
17VariousReview publicationVariousN/A[42]
18VariousReview publicationVariousN/A[43]
19VariousReview publicationVariousN/A[44]
Table 2. Some studies found in the literature, with focus on interfacial interaction as a potential recovery mechanism.
No.MechanismApproachFormationActive SaltsRef.
1Wettability alteration, DLE, Oil–brine int.Spontaneous imbibition, Interfacial rheologySandstoneSO4, Low salt brine (36,600–5460 ppm)[22]
2Oil–brine interfacial interactionsInterfacial viscoelasticity, Core floodingSandstoneSO4, Low salt brine (1%–10% of 0.674 M)[48]
3Oil–brine interfacial interactionsIFTN/ACa, Mg, Na, SO4 (5760 ppm)[20]
4Oil–brine interfacial interactionsCore floodingCarbonateSO4, Low salt brine (3535–37,102 ppm)[49]
5Oil–brine interfacial interactionsLangmuir Trough, Oil drop Volume, G’,G’’ ModuliN/ASO4, Low salt brine (5761–16,407 ppm)[50]
6IFTIFTN/ACa, SO4[51]
Table 3. Summary of hybrid enhanced oil recovery (EOR) studies found in the literature.
No.MechanismsApproachFormationFlooding PlanRef.
1Hybrid EORPilot testSandstoneDiluted produced brine + Low salinity polymer[59]
2Hybrid EORReviewSandstoneLow salt brine + Low concentration polymer[60]
3Hybrid EORPilot testSandstoneLow salt brine pre-flush (800–1300 ppm) + Polymer flood (1000 ppm)[61]
4Hybrid EORPilot testSandstoneLow salt brine pre-flush + Polymer flood (800 ppm)[62]
5Hybrid EORPilot testSandstoneLow salt brine pre-flush (500 ppm) + Polymer flood (800 ppm)[63]
6Hybrid EORCore floodingSandstoneLow salt brine pre-flush (5000–30000 ppm) + Polymer flood (2000–4000 ppm)[64]
7Hybrid EORCore floodingSandstoneLow salt brine pre-flush (3600 ppm) + Polymer flood (300–1000 ppm)[65]
8Hybrid EORCore floodingSandstoneLow salt brine pre-flush (6900 ppm) + Polymer flood (1000 ppm)[66]
9Hybrid EORCore floodingCarbonateLow salt brine pre-flush (6900 ppm) + Polymer flood (2000–3000 ppm)[67]
10Hybrid EORNumerical simulationSandstoneLow salt brine (700–5000 ppm) + Polymer flood (1000–1500 ppm)[68]
11Hybrid EORNumerical simulationSandstoneLow salt brine (10 times seawater) + Polymer flood (13.5cP)[69]
Table 4. Chemical composition of formation and injection brines.
Chemical FormulaTotal Dissolved Solids (g/L)
Group 1
Formation Brines
Group 2
Injection Brines
Brine 1Brine 2Brine 1Brine 3Brine 4Brine 5
SSW2*SSWSSWSSW+2SO4−2SSW+4SO4−2SSW-Na
NaCl23.9747.9423.9723.9723.970.00
KCl0.801.600.800.800.800.80
CaCl2·2H2O1.112.211.111.111.111.11
MgCl2·6H2O11.0422.0811.0411.0411.0411.04
SrCl2·6H2O0.030.050.020.030.020.02
Na2SO43.937.863.937.8615.733.93
NaHCO30.270.550.270.270.270.27
TDS41.1582.3141.1545.0952.9517.18
Hardness0.130.130.130.110.090.48
Density (g/cm3) @22 °C1.031.041.031.021.041.02
η (mPa.s) @45 °C0.630.70.630.680.680.65
Table 5. Characteristics of the core plugs used in this work.
CoreLDphi, ΦPVkgkbSwcSoiFB*
mmmm%mLmDmD%%
T159.9929.5227.188.953272214820.6179.39SSW
T260.1129.3626.539.183231206715.6684.34SSW
T360.429.0826.228.193775205121.3978.612*SSW
T460.0829.3426.28.583464211320.5279.482*SSW
T560.3729.3128.568.053434194620.9779.032*SSW
T660.2229.326.419.23438194417.8082.202*SSW
T760.0929.4426.769.23244195217.8982.11SSW
T859.9329.3326.068.83112197018.6781.33SSW
T1059.8729.3326.438.43370210826.3673.64SSW
AVE.60.12 ± 0.1729.33 ± 0.1126.73 ± 0.738.72 ± 0.453371.11 ± 180.412033.22 ± 76.5619.99 ± 2.8680.01 ± 2.80-
Table 6. Implemented sequence/work-flow to perform the core flooding experiments.
Formation BrineSecondary Mode Injection Tertiary Mode Injection
2*SSW SSWBump RatePolymer prepared in SSW
SSW+2SO4−2Bump RatePolymer prepared in SSW +2SO4−2
SSW+4SO4−2Bump RatePolymer prepared in SSW +4SO4−2
SSW-NaClBump RatePolymer prepared in SSW +2SO4−2
SSW SSW Bump RatePolymer prepared in SSW
SSW+2SO4−2Bump RatePolymer prepared in SSW+2SO4−2
SSW+4SO4−2Bump RatePolymer prepared in SSW+4SO4−2
SSW-NaClBump RatePolymer prepared in SSW+2SO4−2
SSWBump RateSSW +2SO4−2Polymer prepared in SSW
V (ft/day)12.31
Table 7. Interfacial tension (IFT) between brines and crude oil at 22 ºC.
BrineIFT 1IFT 2IFT (Average)
mN/mmN/mmN/m
SSW2.032.372.20
SSW+2 SO4−24.664.284.47
SSW+4SO4−22.112.012.06
SSW-0NaCl2.853.022.94
2*SSW3.153.393.27
Table 8. Oil drop-size analysis before snap-off.
BrineTime Till Snap-OffOil Drop Size
MinutesµL
SSW217.5
SSW+4SO4−2115.0
SSW+2SO4−24312.5
Table 9. Summary of core flooding experiment results and comparison of obtained recoveries (per Table 6).
Nr.Form. BrineInj. BrineCoreΦk, brine SoiRF Sec. Mode Inje. PVRF Bump Rate Inje. PVRF Tert. ModeInje. PVTotal RF (%)ROS
(%)
1SSW SSWT226.53206784.3434.27≈37.55≈313.94≈355.7644.24
2SSW+2SO4−2, T726.76195282.1145.69≈37.07≈38.84≈361.6038.40
3SSW+4SO4−2, T826.06197081.3338.98≈39.28≈39.90≈358.1641.84
4SSW-0NaCl, T127.18214879.3932.01≈314.95≈312.56≈359.5240.48
52*SSW SSWT626.41194482.234.56≈310.36≈312.67≈357.5942.41
6SSW+2SO4−2, T426.20211379.4841.37≈313.59≈310.05≈365.0134.99
7SSW+4SO4−2T528.56194679.0351.78≈311.50≈38.83≈372.1127.89
8SSW-0NaCl, T326.22205178.6145.35≈39.67≈316.32≈371.3428.66
Table 10. Core flooding experiment with tertiary-mode sulfate-modified water injection (per Table 6).
Nr.Form. BrineInj. BrineCore NameΦk, brine Soi RF Sec. Mode
(BF)
Inje. PVRF Bump Rate Inje. PVRF Tert. ModeRF Post-Tert.Total RF (%)
1SSWSSWT1026.43210873.6434.04≈310.21≈39.643.9757.857

